Immigration and Entrepreneurship
Revised Draft of Chapter for the Handbook on the Economics of International Migration
Robert W. FairlieUniversity of California, Santa Cruz and IZA
Magnus LofstromPublic Policy Institute of California and IZA
October 2013
1. Introduction
Immigrants are widely perceived as being highly entrepreneurial.1 Business
ownership is higher among the foreign-born than the native-born in many developed
countries such as the United States, United Kingdom, Canada and Australia (Borjas 1986;
Lofstrom 2002; Clark and Drinkwater 2000, 2010; Schuetze and Antecol 2006; Fairlie et
al. 2010). Substantial contributions of immigrant entrepreneurs to the technology and
engineering sectors of the economy, especially in Silicon Valley, have also been well
documented and have received broad attention (Wadwha, et al. 2007; Saxenian 1999,
2000). In an attempt to attract immigrant entrepreneurs, many developed countries have
created special visas and entry requirements for immigrant entrepreneurs (Schuetze and
Antecol 2006). In the United States, for example, special preferences for admission are
given to immigrants who invest $1 million in businesses and create or preserve at least 10
full-time jobs for U.S. workers, and recently, the Startup Act 2.0 bill proposes to expand
opportunities for immigrants to start businesses in the United States (U.S. Department of
Homeland Security 2012).
1 We use the terms self-employed, entrepreneur and business owner synonymously in this chapter.
1

Immigrant entrepreneurship is becoming increasingly important in the U.S. as
both immigration and foreign-born business ownership has grown steadily over the last
decades. Approximately 16 percent of the U.S. workforce was foreign born in 2009, a
proportion that has more than doubled since its 7 percent share in 1980 (Lofstrom, 2009).
Over the same time period, self-employment grew strongly and immigrants continued to
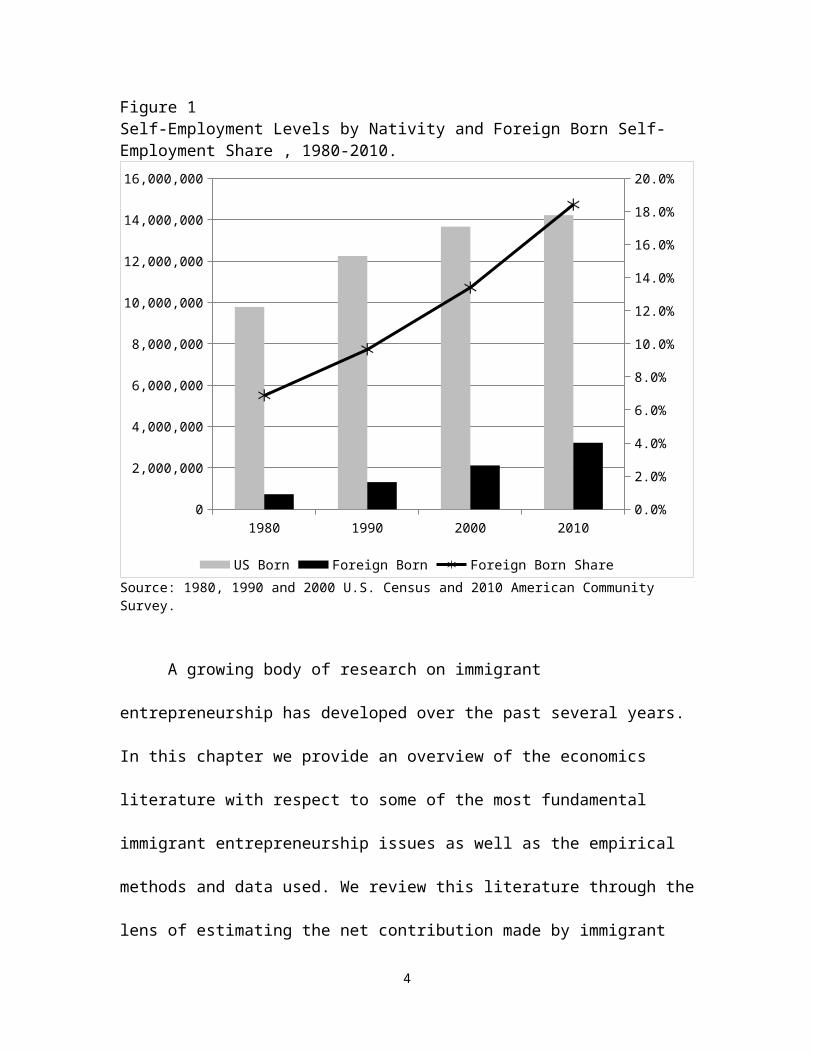
increase their share of business owners. Figure 1 shows an increase of close to 7 million
business owners from 1980 to 2010 and that immigrants’ share of self-employment
increased from about 6.9 percent to 18.4 percent. Although not entirely clear from the
figure, the increase in the foreign born self-employment share in the last decade is
partially driven by the slowdown in native self-employment growth, which started around
the beginning of the Great Recession in 2007.
2

Figure 1Self-Employment Levels by Nativity and Foreign Born Self-Employment Share , 1980-2010.
1980 1990 2000 20100
2,000,000
4,000,000
6,000,000
8,000,000
10,000,000
12,000,000
14,000,000
16,000,000
0.0%
2.0%
4.0%
6.0%
8.0%
10.0%
12.0%
14.0%
16.0%
18.0%
20.0%
US Born Foreign Born Foreign Born ShareSource: 1980, 1990 and 2000 U.S. Census and 2010 American Community Survey.
A growing body of research on immigrant entrepreneurship has developed over
the past several years. In this chapter we provide an overview of the economics literature
with respect to some of the most fundamental immigrant entrepreneurship issues as well
as the empirical methods and data used. We review this literature through the lens of
estimating the net contribution made by immigrant entrepreneurs to the host economy.
Immigration is a very hotly debated topic because of the contrasting concerns over
lowering wages for existing workers, increasingly public assistance rolls, security and
changing the demographic makeup of host countries, and the need for less- and high-
skilled workers, supporting an aging population, insourcing instead of outsourcing labor,
3
and family reunification. Central to the debate is whether immigrants provide a net
positive or net negative contribution to host economy. Partly fueled by this debate, an
extremely large literature in economics examines the separate impacts of immigrants on
various parts of the economy such as the labor market, public assistance, tax system, and
educational systems.2 Since much of the attention of the relevant research has been on the
United States, this will be the focus of our discussion.
Evaluating the ways in which immigrant entrepreneurs contribute to the economy
provides a useful and novel framework for reviewing the previous literature.
Fundamental to evaluating how immigrants contribute to entrepreneurship and small
business ownership is examining patterns of business ownership. Several previous studies
examine immigrant business ownership focusing on explaining group differences
especially using decomposition techniques. The performance of immigrant-owned
businesses is also fundamental to understanding their contribution to the host economy.
Previous research examines assimilation and its effects on immigrant self-employment
earnings, and also examines immigrant group differences in business earnings. A third
area is whether immigrant entrepreneurs displace native entrepreneurs, have positive
spillovers in technology and innovation, and contribute to diversity in products and
services in the host country. A small, but new and emerging literature tackles these
difficult questions. Finally, the ability of immigrant-owned businesses to export back to
their home countries, and thus potentially expand the host country's economy represents
another important and understudied topic.
2 See Borjas (1994) and Kerr and Kerr (2011) for reviews of this literature. To our knowledge, the literature focusing on immigrant entrepreneurship has not been previously reviewed in the economics literature.
4
In addition to being a relatively understudied aspect of overall impacts of
immigration on host economies, the focus of this chapter on contributions to
entrepreneurship and small business ownership is important economically. Promoting
entrepreneurship is viewed as a national priority by governments around the world. The
interest is driven primarily by evidence that small businesses create a disproportionate
share of new jobs in the economy, represent an important source of innovation, increase
national productivity and alleviate poverty (see Reynolds 2005; OECD 2006; U.S. Small
Business Administration 2011 for example).3 The self-employed are also unique in that
they create jobs for themselves, representing more than ten percent of total employment
in the United States and many other countries.
The rest of the chapter proceeds as follows. Section 2 documents the large
contributions immigrant entrepreneurs make to the U.S. economy. Section 3 examines
differences in business ownership rates across immigrant groups by first examining who
is an immigrant entrepreneur. We then briefly discuss some of the methodology
commonly used in the literature to study the causes of these differences, and end the
section by providing a detailed review of the literature explaining group differences.
Section 4 reviews the literature on immigrant business performance. Section 5 discusses
additional areas of importance, such as crowd out, spillovers and diversity, for evaluating
the overall contribution of immigrant entrepreneurs. Section 6 concludes and discusses
future areas of research.
3 Haltiwanger, Jarmin and Miranda (2011) refine the argument that small businesses create a disproportionate number of jobs by showing that business startups and young businesses are the ones contributing substantially to both gross and net job creation.
5
2. The Contribution of Immigrant Entrepreneurs to the Economy
Immigrants make substantial contributions to business ownership, business
income and employment in the United States. In this section, we present some estimates
from the American Community Survey documenting just how large these contributions
are to the U.S. economy. Estimates from the 2006-10 ACS indicate that there are 2.4
million immigrant business owners, representing 18.2 percent of all business owners (the
ACS data are discussed in detail in Appendix A). The large immigrant share of all
business owners compares favorably to the immigrant share of the work force.
Immigrants constitute 16.3 percent of the total U.S. work force, implying a higher
business ownership rate than the U.S.-born rate. Indeed, 11.0 percent of immigrants own
a business, compared with 9.6 percent of the U.S.-born work force. This finding is
consistent with several previous studies that document higher business ownership rates
among immigrants. We review this literature below in Section 3.
We next examine the question of what is the immigrant contribution to business
startup activity in the United States. A separate analysis of business startup activity is
important because new businesses are often associated with economic growth,
innovation, and the creation of jobs. To measure business startup activity, we use panel
data created by matching consecutive months of the 2007-2011 Current Population
Survey (CPS). Immigrants represent 24.9 percent of all new business owners in the
United States. The share of business startup activity generated by immigrants is much
higher than the immigrant share of the workforce at risk of starting a business each
month. We find that immigrants represent 15.6 percent of the non-business owning
workforce. The higher share of immigrant business startup activity translates into much
6

higher rates of business formation by immigrants than nonimmigrants. The business
formation rate per month among immigrants is 0.51 percent; that is, of 100,000 non-
business-owning immigrants, 510 start a business each month. This rate of business
formation is higher than the nonimmigrant rate of 0.28 percent, or 280 of 100,000 U.S.-
born non-business owners per month.
We also explore the question of how much immigrant-owned businesses
contribute to total business income in the United States. The answer to this question tells
us something about how much value immigrant entrepreneurs create for the U.S.
economy? We address this question using two measures based on available data. First,
we examine the contribution of immigrant business owners to total business income
generated by all U.S. business owners using ACS data. The second and related measure
that we examine is total sales and receipts by immigrant-owned businesses using data
from specially commissioned tabulations from the 2007 Survey of Business Owners.
The total business income for immigrants is $121 billion, representing 15.0
percent of all business income in the United States. Total U.S. business income is $808
billion. The immigrant representation of total business income is lower than the
representation of the total number of business owners, suggesting that immigrant-owned
businesses have lower average incomes. Immigrant-owned business income is $49,779
on average, compared with $62,695 for nonimmigrants. We discuss the literature that
examines average business earnings among immigrants and how this is related to
assimilation in the home country below in Section 4.
The immigrant-owned business contribution to total sales and receipts is
examined next. Estimates from the SBO indicate that immigrant-owned business
7

OwnershipNumber of
FirmsShare of
Total FirmsTotal Sales
($000s)Share of
Total SalesImmigrant (majority foreign-born) 1,798,541
13.4% 779,833,278$
10.0%Non-immigrant (majority native-born) 11,578,280
86.6% 7,047,737,009$ 90.0% Total immigrant and non-immigrant 13,376,821
100.0% 7,827,570,287$ 100.0%Equally foreign-/native-born 244,070
102,760,238$
Foreign-born status indeterminate 12,673,969
3,019,131,351$
Table 1Total Sales for Immigrant and Non-Immigrant Owned FirmsSpecial Tabulations from Survey of Business Owners (2007)
Note: (1) The sample includes businesses that are classified by the IRS as sole proprietorships, partnerships, 1120 corporations, or employers, and that have sales of $1000 or more. (2) Excludes publicly held and other firms not classifiable by owner status.
generated 10.0 percent of total sales generated by firms in which the majority foreign
born status can be classified (Table 1). Firms that are equally foreign- and native-born
owned represent 1.8 percent of firms and 1.3 percent of total sales. Adding these firms to
those with 51 percent foreign-born ownership, results in a total share of firms with 50
percent or more foreign-born ownership of 15.0 percent.
On average, immigrant firms have lower sales than non-immigrant firms.
Immigrant-owned firms have $434,000 in average annual sales and receipts compared
with $609,000 among non-immigrant firms.4 These patterns reflect those found for
average levels of business income. On average, immigrant-owned businesses produce
lower earnings. But, as noted below this comparison hides important differences by time
in the country and source country.
Using data from the SBO, we next examine how immigrant-owned businesses
contribute to total employment. Immigrant-owned businesses are found to make large
contributions to total employment in the United States. Table 2 reports estimates of the
4 Firms that are equally foreign and U.S.-born owned have a similar level of average sales as firms that are majority foreign owned ($421,000). Firms with an indeterminate foreign owned status have lower average sales at $238,000.
8

OwnershipNumber of
Employer FirmsShare of Total Empl. Firms
Total Employment
Share of Total Employment
Immigrant (majority foreign-born) 501,973
14.1% 3,997,977
9.9%Non-immigrant (majority native-born) 3,049,698
85.9% 36,426,585
90.1% Total immigrant and non-immigrant 3,551,671
100.0% 40,424,562
100.0%Equally foreign-/native-born 74,006
642,138
Foreign-born status indeterminate 1,564,291
15,559,855
Table 2Employment for Immigrant and Non-Immigrant Owned FirmsSpecial Tabulations from Survey of Business Owners (2007)
Note: (1) The sample includes businesses that are classified by the IRS as sole proprietorships, partnerships, 1120 corporations, or employers, and that have sales of $1000 or more. (2) Excludes publicly held and other firms not classifiable by owner status.
share of employer firms owned by immigrants and total employment by immigrant-
owned businesses. Immigrants own 14.1 percent of businesses hiring employees. This
share is roughly similar to share for the number of businesses presented in Table 1
indicating that immigrant-owned businesses are similarly likely to hire any employees
than are non-immigrant owned businesses.
Immigrant businesses also hire roughly 10 percent of employees hired by
identifiable firms in the United States. Among firms hiring employees, immigrant-owned
businesses hire an average of 8 employees each.
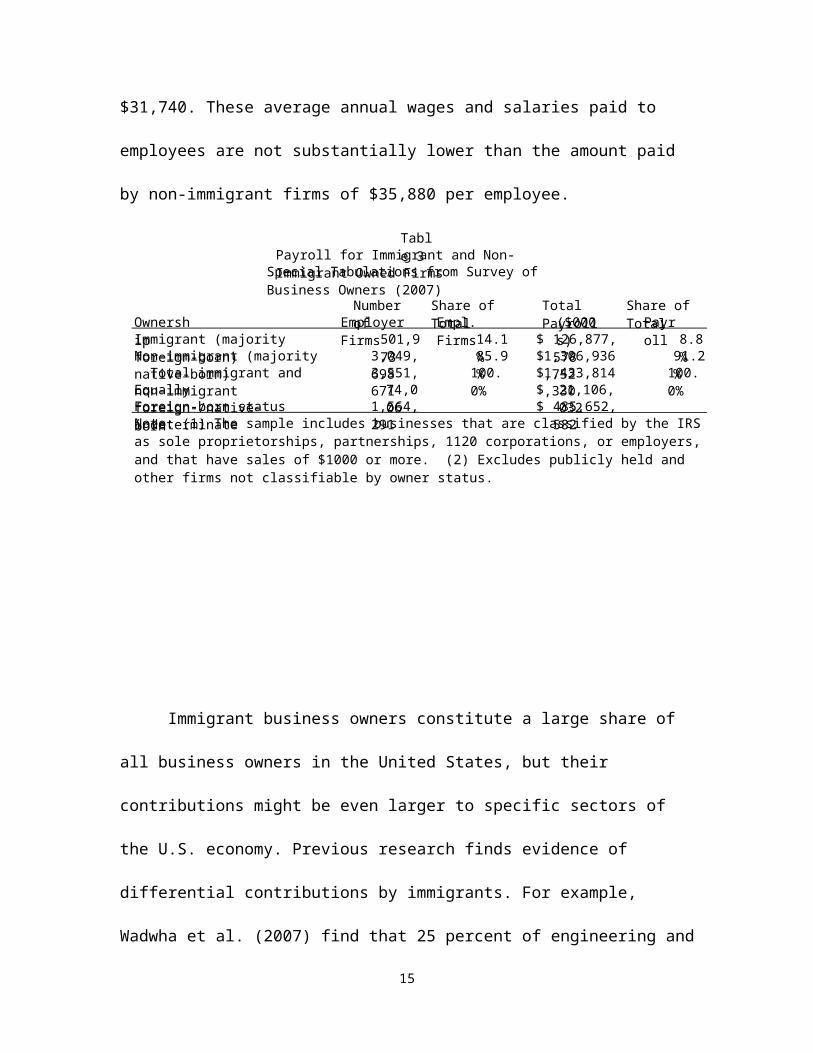
Table 3 reports the share of total payroll by immigrant-owned businesses. The
immigrant share of total payroll is 8.8 percent. The average immigrant-owned employer
business in the United States pays out $252,758 to its employees. The average paid to
each of those employees is $31,740. These average annual wages and salaries paid to
employees are not substantially lower than the amount paid by non-immigrant firms of
$35,880 per employee.
9

OwnershipNumber of
Employer FirmsShare of Total Empl. Firms
Total Payroll ($000s)
Share of Total Payroll
Immigrant (majority foreign-born) 501,973
14.1% 126,877,578$
8.8%Non-immigrant (majority native-born) 3,049,698
85.9% 1,306,936,752$ 91.2% Total immigrant and non-immigrant 3,551,671
100.0% 1,433,814,330$ 100.0%Equally foreign-/native-born 74,006
21,106,032$
Foreign-born status indeterminate 1,564,291
485,652,582$
Table 3Payroll for Immigrant and Non-Immigrant Owned Firms
Special Tabulations from Survey of Business Owners (2007)
Note: (1) The sample includes businesses that are classified by the IRS as sole proprietorships, partnerships, 1120 corporations, or employers, and that have sales of $1000 or more. (2) Excludes publicly held and other firms not classifiable by owner status.
Immigrant business owners constitute a large share of all business owners in the
United States, but their contributions might be even larger to specific sectors of the U.S.
economy. Previous research finds evidence of differential contributions by immigrants.
For example, Wadwha et al. (2007) find that 25 percent of engineering and technology
companies started in the past decade were founded by immigrants and Saxenian (1999,
2002) finds evidence that immigrant entrepreneurs play an important role in the success
and development of California’s Silicon Valley. We briefly examine whether immigrant
business owners contribute differently to high-skilled businesses, industries, and states.
Focusing on education (or skills) first, we find that nearly 45 percent of all business
owners with less than a high school degree are immigrants. Immigrant business owners
with a college degree also represent a large share of all business owners with a college
degree (15.7 percent).
Immigrant business owners make notable contributions to the U.S. economy in
several industries. More than one-quarter of all businesses in the transportation,
accommodation, recreation and entertainment, and other services industries are owned by
10

immigrants. Immigrant-owned businesses also contribute substantially to retail trade
(22.6 percent), wholesale trade (20.3 percent), and health care and social assistance (20.0
percent).
Immigrant business owners are heavily concentrated in California, New York,
Florida, and Texas and may contribute more to the economies of these states than others.
Immigrant business owners represent a very large share of all business owners in the
California. Nearly 37 percent of all business owners in California are immigrants.
Roughly 30 percent of all business owners in New York, Florida and New Jersey are
foreign-born, and roughly one-fourth of all business owners in Texas and Hawaii are
foreign-born. Immigrant contributions to business ownership in all these states are
substantially higher than the national average of 18.2 percent.
Estimates from the ACS clearly indicate that immigrants make significant
contributions to business ownership, formation, and income in the United States. The
economic contributions of immigrant business owners are also unevenly distributed
across the United States, with the largest contributions located in California and other
"gateway" states, and are more concentrated in specific sectors of the economy. The large
contributions made by immigrant entrepreneurs, especially in specific locations and
sectors, are partly responsible for the considerable research interest generated on the
subject, which we review in the next section.
3. Immigrant Business Ownership
Previous research documents that business ownership is higher among the
foreign-born than the native-born in many developed countries such as the United States,
11

United Kingdom, Canada and Australia (Borjas 1986; Lofstrom 2002; Clark and
Drinkwater 2000, 2006; Schuetze and Antecol 2006; Fairlie et al. 2010). As noted above,
the business ownership rate among immigrants is 11.0 percent in the United States, which
is 15 percent higher than the native born rate of 9.6 percent. Business creation rates are
also substantially higher among immigrants than natives.
Several previous studies have examined explanations for high rates of business
ownership and creation among immigrants. Several of these studies have also examined
the causes of substantial heterogeneity in rates across immigrant groups. This research
has predominately relied on decomposition techniques. Before reviewing this literature,
however, we return to the ACS data to explore the characteristics of immigrant
entrepreneurs and their businesses.
Who are Immigrant Entrepreneurs in the United States?
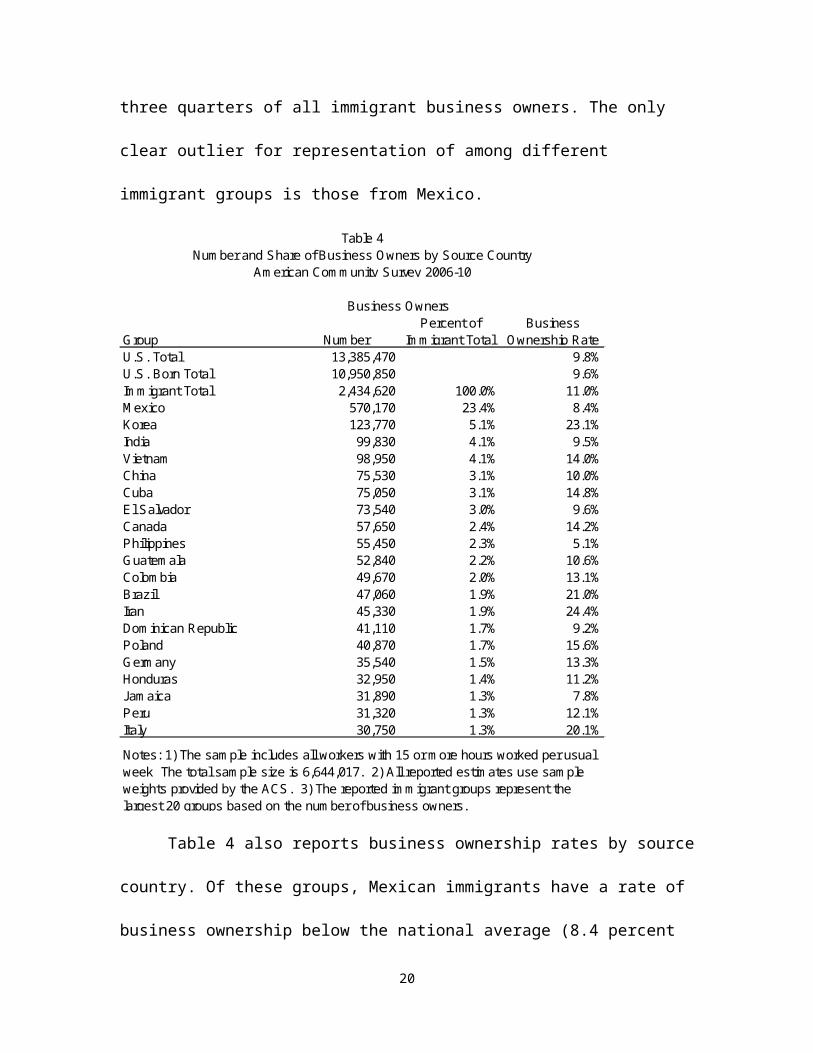
Where do immigrant business owners come from? Table 4 reports estimates of the
number and share of business owners by source country for the top 20 countries. The
largest contributing country is Mexico, with 570,170 business owners representing nearly
a quarter of all immigrant business owners in the United States. Korean immigrant
business owners make up the next largest share of business owners, with 5.1 percent.
Indian and Vietnamese immigrants also represent relatively large shares of immigrant
business owners (more than 4 percent for each group). Another clear pattern revealed
from the table, however, is the diversity of source countries of immigrants residing in the
United States. The 20 countries combined still represent less than three quarters of all
12
immigrant business owners. The only clear outlier for representation of among different
immigrant groups is those from Mexico.
Group NumberPercent of
Immigrant TotalU.S. Total 13,385,470 9.8%U.S. Born Total 10,950,850 9.6%Immigrant Total 2,434,620 100.0% 11.0%Mexico 570,170 23.4% 8.4%Korea 123,770 5.1% 23.1%India 99,830 4.1% 9.5%Vietnam 98,950 4.1% 14.0%China 75,530 3.1% 10.0%Cuba 75,050 3.1% 14.8%El Salvador 73,540 3.0% 9.6%Canada 57,650 2.4% 14.2%Philippines 55,450 2.3% 5.1%Guatemala 52,840 2.2% 10.6%Colombia 49,670 2.0% 13.1%Brazil 47,060 1.9% 21.0%Iran 45,330 1.9% 24.4%Dominican Republic 41,110 1.7% 9.2%Poland 40,870 1.7% 15.6%Germany 35,540 1.5% 13.3%Honduras 32,950 1.4% 11.2%Jamaica 31,890 1.3% 7.8%Peru 31,320 1.3% 12.1%Italy 30,750 1.3% 20.1%
Notes: 1) The sample includes all workers with 15 or more hours worked per usual week The total sample size is 6,644,017. 2) All reported estimates use sample weights provided by the ACS. 3) The reported immigrant groups represent the largest 20 groups based on the number of business owners.
Table 4Number and Share of Business Owners by Source Country
American Community Survey 2006-10
Business Ownership Rate
Business Owners
Table 4 also reports business ownership rates by source country. Of these groups,
Mexican immigrants have a rate of business ownership below the national average (8.4
percent compared with 9.8 percent). The large contribution to the total number of
immigrant business owners is thus being driven by the large share of Mexican
immigrants in the United States and not by higher business ownership rates. In contrast,
13

Education Level NumberPercent of
Immigrant TotalAll education levels 2,434,610 100.0%Less than high school 625,680 25.7%High school graduate 592,880 24.4%Some college 490,510 20.1%College graduate 725,540 29.8%Notes: 1) The sample includes all business owners with 15 or more hours worked per usual week. 2) All reported estimates use sample weights provided by the ACS.
Table 5Number and Share of Immigrant Business Owners by Education Level
American Community Survey 2006-10
23.1 percent of Korean immigrants own a business, one reason they represent the second
largest number of immigrant business owners in the United States.
Table 5 reports estimates of the number and share of immigrant business owners
by education level. The largest educational group among immigrants is college graduates.
Nearly 30 percent of all immigrant business owners have a college degree. The next
largest category is having less than a high school degree. Roughly one-quarter of
immigrant business owners have less than a high school degree.
Immigrants are heavily concentrated in California, New York, Florida, and Texas
(U.S. Department of Homeland Security, 2011). The geographical concentration of
immigrant business owners reflects these general patterns. Table 6 reports estimates of
the number and share of immigrant business owners by state. California has by far the
largest number of immigrant business owners, with 676,537. These immigrant business
owners represent 27.8 percent of all immigrant business owners in the United States.
Immigrant business owners in Florida, New York, and Texas also have large
14
concentrations of immigrant business owners. In contrast to the disperse distribution of
immigrant business owners across source countries, immigrant business owners are much
more geographically concentrated.
15

Industry NumberPercent of
Immigrant TotalU.S. Total 2,434,621 100.0%Alabama 7,968 0.3%Alaska 3,394 0.1%Arizona 50,706 2.1%Arkansas 6,171 0.3%California 676,537 27.8%Colorado 27,645 1.1%Connecticut 31,320 1.3%Delaware 3,320 0.1%District of Columbia 4,003 0.2%Florida 286,144 11.8%Georgia 63,342 2.6%Hawaii 15,997 0.7%Idaho 4,051 0.2%Illinois 99,810 4.1%Indiana 11,995 0.5%Iowa 4,823 0.2%Kansas 7,378 0.3%Kentucky 6,143 0.3%Louisiana 14,726 0.6%Maine 2,711 0.1%Maryland 50,028 2.1%Massachusetts 50,778 2.1%Michigan 30,223 1.2%Minnesota 15,001 0.6%Mississippi 4,534 0.2%Missouri 11,414 0.5%Montana 1,061 0.0%Nebraska 3,905 0.2%Nevada 20,000 0.8%New Hampshire 4,253 0.2%New Jersey 101,251 4.2%New Mexico 11,440 0.5%New York 261,140 10.7%North Carolina 33,120 1.4%North Dakota 381 0.0%Ohio 20,768 0.9%Oklahoma 11,983 0.5%Oregon 22,216 0.9%Pennsylvania 38,799 1.6%Rhode Island 6,478 0.3%South Carolina 11,869 0.5%South Dakota 606 0.0%Tennessee 15,369 0.6%Texas 256,849 10.5%Utah 9,229 0.4%Vermont 1,700 0.1%Virginia 53,709 2.2%Washington 45,696 1.9%West Virginia 1,486 0.1%Wisconsin 10,342 0.4%Wyoming 809 0.0%
Notes: 1) The sample includes all business owners with 15 or more hours worked per usual week. 2) All reported estimates use sample weights provided by the ACS.
Table 6Number of Immigrant Business Owners by State
American Community Survey 2006-10
16

What are the characteristics of the businesses owned by immigrant entrepreneurs?
We first examine the industry distribution of immigrant-owned businesses in the United
States. Table 7 reports estimates of the number of immigrant business owners by major
industry group. Immigrant business owners have large concentrations in Construction,
Professional Services, and Other Services, with each industry capturing more than 15
percent of the total. Roughly 10 percent of immigrant business owners are also
represented in Retail Trade, Health Care and Social Assistance, and Accommodation,
Recreation and Entertainment.
Industry NumberPercent of
Immigrant TotalAll Industries 2,434,607 100.0%Agriculture 26,750 1.1%Extraction 1,290 0.1%Construction 417,540 17.2%Manufacturing 78,640 3.2%Wholesale trade 79,560 3.3%Retail trade 263,250 10.8%Transportation 143,110 5.9%Information 19,880 0.8%Finance 133,500 5.5%Professional Services 406,970 16.7%Educational Services 24,850 1.0%Health Care and Social Assistance 237,580 9.8%Accommodation, Recreation and Entertainment 207,670 8.5%Other services 394,017 16.2%
Notes: 1) The sample includes all business owners with 15 or more hours worked per usual week. 2) All reported estimates use sample weights provided by the ACS.
Table 7Number and Share of Immigrant Business Owners by Industry
American Community Survey 2006-10
Another measure of interest is the share of immigrant business owners that own
incorporated vs. unincorporated businesses in the United States. Incorporated businesses
17

are generally more successful than unincorporated businesses. Incorporating a small
business provides limited liability for the owner, but can also be costly and subjects the
business to additional legal and financial restrictions. Estimates from the ACS indicate
that 34.9 percent of all immigrant business owners own incorporated businesses, which is
roughly similar to the percentage for non-immigrant owned businesses. Immigrant
business owners do not appear to be overly clustered in less profitable and less regulated
unincorporated businesses.
Methodology for Analyzing Immigrant Group Differences in Entrepreneurship
Most of the existing research on immigrant entrepreneurship aims to explain
differences in business ownership rates between immigrants and natives and/or
differences across immigrant groups. A common starting point for this strand of work is
typically to model the self-employment decision, which can be entry or exit, as one to
maximize expected utility subject to the constraints faced by the individual. As such, the
framework can shed light on factors making self-employment more (less) rewarding for a
particular group as well as easier (harder) to attain than it is for a comparison group.
Appendix B provides further details on how the utility model is used to represent the self-
employment decision.
To assess the role of the observable characteristics in explaining the ethnic/racial
self-employment gap the self-employment models are typically estimated as probit or
logit models. Coefficient estimates and standard errors from these regressions are used to
identify the determinants of self-employment and whether immigrant differences remain
after controlling for these determinants, which often include individual, family, source
18

country, and geographical characteristics. The estimates and the values of the observed
characteristics can also be utilized in a nonlinear Blinder-Oaxaca decomposition (Fairlie
1999, 2003) to determine their contributions of each type of characteristic on the
observed differences in self-employment. The decomposition technique is described in
detail in Appendix C. The technique can provide an answer, for example, to the question
of how much of the difference in business ownership rates between two immigrant
groups is due to one group having a higher education level than the other group, or
whether the difference in business ownership rates between immigrants and natives can
be explained by differences in education.
Explaining Group Differences - Literature Review
Existing research has analyzed numerous factors and their roles in explaining
group differences in self-employment. These include human capital, wealth and access to
financial capital, parental entrepreneurship, home country business experience, ethnic
enclaves, blocked opportunities in formal employment as well as selection. This is a large
body of literature with numerous contributions from both sociologists and economists.
Here we predominantly review the work of economists.
Human Capital
Human capital, measured by education and language proficiency, plays a
prominent role and has been found in the literature to be a major determinant of business
ownership differences across groups. Although it is widely accepted that education plays
an important part in the success or failure of small businesses, its role in explaining entry
into firm ownership is unclear since higher education increases individuals’ opportunities
19
and compensation in wage/salary work. As such, it increases the opportunity costs of
entrepreneurship and, all else equal, makes entry into self-employment less likely.
However, education is also likely to generate skills that are associated with greater
success, such as analytical abilities, communication skills, and other skills needed to run
a business successfully. Although much of the research points towards a positive
relationship between education and business ownership, the evidence is somewhat mixed
(van der Sluis et al, 2008). Lofstrom, Bates and Parker (forthcoming) postulates that this
may be due to sorting into industries based on entry barriers. They find that educational
credentials of highly educated potential entrepreneurs, in particular, is associated with
lower probability of small-firm ownership in some less financially rewarding industries
while it encourages entry into higher barrier industries that also offer higher returns.
The literature focusing on the role of human capital in explaining group
differences in business ownership provides a much less ambiguous picture, especially in
studies of the low self-employment rates of the immigrant fueled largest and fastest
growing ethnic minority group in the U.S., Latinos. At the other end of the spectrum is
another quickly growing group, again primarily due to immigration but with much
different experiences in the U.S., Asians.
Low levels of education obtained by Latinos are partly responsible for their lower
business ownership rates. Estimates from non-linear decompositions using the CPS
indicate that education differences account for 32.8 to 37.9 percent of the entry rate gap
for Mexican-Americans (Fairlie and Woodruff 2007). Lofstrom and Wang (2009) find
that education is important in explaining differences is business creation rates between
Mexican-Americans and whites, as well as the types of businesses entrepreneurs are
20

likely to pursue. The high rate of business ownership by Asians is in part due to their
relatively high levels of education (Fairlie 2006).
Another measure of human capital relevant for Latinos and Asians is language
ability. Limited English language ability may make it difficult to communicate with
potential customers and suppliers, and learn about regulations. On the other hand, lack of
fluency in English may limit opportunities in the wage/salary sector resulting in an
increased likelihood of becoming self-employed. Previous studies provide some
evidence that a better command of the English language is associated with more self-
employment (see Fairlie and Meyer 1996 and Fairlie and Woodruff 2010 for example).
But, there is also a literature that points to blocked opportunities in the wage/salary sector
because of language barriers increasing self-employment among Asian immigrants
(Kassoudji 1988, Min 1989, 1993, Bates 1997).
Wealth and Access to Financial Capital
One of the most important barriers preventing would-be entrepreneurs from
starting businesses and small businesses from growing is inadequate access to financial
capital. The importance of personal wealth as a determinant of entrepreneurship has been
the focus of an extensive body of literature. Numerous studies using various
methodologies, measures of wealth and country microdata explore the relationship
between wealth and entrepreneurship. Most studies find that asset levels (e.g. net worth)
measured in one year increase the probability of starting a business by the following
year.5 The finding has generally been interpreted as providing evidence that 5 For a few examples, see Evans and Jovanovic (1989), Evans and Leighton (1989), Holtz-Eakin, Joulfaian, and Rosen (1994), Lindh and Ohlsson (1996), Black, de Meza and Jeffreys (1996), Blanchflower and Oswald (1998), Dunn and Holtz-Eakin (2000), Taylor (2001), Zissimopoulos, Karoly, and Gu (2009), and Fairlie and Krashinsky (2012).
21

entrepreneurs face liquidity constraints, but there is some debate over the evidence (e.g.
see Hurst and Lusardi 2004 and Fairlie and Krashinsky 2012). Personal wealth can be
invested directly in the business, used as collateral to obtain business loans, or used
through home equity lines.6
Previous studies have documented that Latinos have substantially lower levels of
wealth than whites (see Wolff 2000 and Cobb-Clark and Hildebrand 2004). The latest
estimates from the U.S. Census Bureau indicate that the median level of net worth is
$7,424 for Latinos. In contrast, the median net worth for white, non-Latinos is $110,729.
The median net worth for Asians is $69,590.
These findings from the previous literature suggest that relatively low levels of
wealth among Latinos and the relatively high levels of wealth among Asians may be a
source of racial differences in rates of business ownership. Indeed, recent research using
statistical decomposition techniques provides evidence supporting this hypothesis.
Fairlie and Woodruff (2007) examine the causes of low rates of business formation
among Mexican-Americans. Relatively low levels of assets explain roughly one quarter
of the business entry rate gap for Mexican-Americans. Lofstrom and Wang (2009) using
SIPP data also find that low levels of wealth for Mexican-Americans and other Latinos
work to lower self-employment entry rates. Apparently, low levels of personal wealth
limit opportunities for Mexican-Americans and other Latinos to start businesses.
Recent research, however, indicates that immigrant-owned businesses overall start
with higher levels of startup capital than non-immigrant owned businesses (Fairlie 2012).
Nearly 20 percent of immigrant owned firms started with $50,000 or more in financial
6 The largest source of startup capital for businesses is personal and family savings and the majority of small business loans require personal commitments by owners (U.S. Census Bureau 2006; Avery, Bostic and Samolyk 1998).
22

capital compared with 15.9 percent of non-immigrant owned firms. Hispanic immigrant
firms have lower levels of startup capital than the immigrant total and Asian immigrant
firms have higher levels of startup capital. The most common source of startup capital
for immigrant-owned businesses is personal or family savings with roughly two-thirds of
businesses reporting this source of startup capital. Other common sources of startup
capital used by immigrant firms are credit cards, bank loans, personal or family assets,
and home equity loans. The sources of startup capital used by immigrant firms do not
differ substantially from those used by non-immigrant firms.
Home Country Business Experience
The relationship between home country self-employment experiences and host
country self-employment is not well understood. Previous research indicates that home-
country self-employment rates are either positively associated with self-employment rates
in the United States (Yuengert 1995) or that the two are not significantly associated
(Fairlie and Meyer 1996). Immigrants from Mexico also provide a clear outlier for a
positive relationship (Fairlie and Woodruff 2007). Roughly one fourth of Mexico's
workforce is a self-employed business owner. In contrast, the Mexican immigrant rate of
self-employment is only 6 percent in the United States -- a rate of self-employment that is
substantially lower than the national average of 11 percent. It is possible that although
previous home country self-employment experience is useful it is overwhelmed by other
constraints to starting businesses in the United States such as limited access to capital,
low educational levels, and limited English language ability (Lofstrom and Wang 2009;
Fairlie and Woodruff 2007, 2010).
23

The absence of a good understanding of the role of home country business
experience is at least partly due to a lack of suitable individual level data that includes
pre-migration self-employment information. As Akee, Jaeger and Tatsiramos (2008)
shows, the availability of relatively recent data from the New Immigrant Survey (NIS)
provides an opportunity to overcome this hurdle. Using the NIS, they test whether
immigrant who reported being self-employed in their home country are also more likely
to be self-employed in the U.S. and whether the pre-migration entrepreneurial experience
affects earnings in the U.S. They find that home country self-employment increases the
probability of self-employment in the U.S. by about 7 percentage points and are
consistent with a positive effect on self-employment earnings.
Ethnic Enclaves
A potential contributor to the higher rates of business ownership among
immigrants overall, and especially immigrants from Asia, is the residential concentration
of co-nationals or co-ethnics in certain urban areas, so called enclaves. The earlier
research on this comes from the sociology literature in the context of ethnic resources as
a determinant in an individual’s choice of whether or not to choose self-employment (see
for example Light, 1972, Light and Bonacich, 1988 and Aldrich and Waldinger, 1990).
Examples of ethnic resources are skills or knowledge to provide services or goods to
other co-ethnics or co-nationals, availability of low wage labor, social support networks
that assist an individual in obtaining necessary start-up capital or in transferring
managerial skills. Aldrich and Waldinger (1990) describe “opportunity structures” as
market conditions that may favor goods or services oriented towards co-ethnics or co-
nationals. Locating in an ethnic enclave may provide a market for special products and
24

services and access to co-ethnic labor.7 With respect to the latter, entrepreneurs may have
an opportunity to take advantage of co-nationals limited labor market choices, especially
recently arrived immigrants, due to language and cultural barriers. It then follows, it is
argued, that immigrants who are living in areas with relatively high proportions of co-
nationals may have a comparative advantage in providing certain goods or services, food
or restaurant services for example, to their co-nationals compared to natives or other
immigrants. A consequence, according to this theory, is higher self-employment rates
among immigrants living in enclaves.
Existing research examining the impact of ethnic enclaves on the success (and
thus economic contribution) of immigrant entrepreneurs frequently finds that locating in
an ethnic enclave may indeed enhance opportunities and spur self-employment. For
example, Wilson and Portes (1980) find evidence in support of the enclave hypothesis for
a sample of Cuban immigrants living in Miami. Using a measure of enclave at the
Standard Metropolitan Statistical Area (SMSA) level, Borjas (1986) finds that self-
employment among Mexicans, Cubans, and “other Hispanics” is increasing in the
percentage of Hispanics in an SMSA. The effect is larger among the immigrant
population than among the population born in the U.S. Using 2000 Census data, Fairlie
and Woodruff (2007) find that Mexican immigrant self-employment rates are higher in
ethnic enclaves. Other evidence in support of the positive relationship between enclaves
and business ownership rates extending beyond Hispanics can be found in Yoon (1995),
Sanders and Nee (1996) and Lofstrom (2002). However, the evidence is more mixed on
7 Other early studies making this argument include Kinzer and Sagarin (1950) and Glazer and Moynihan (1970).
25

whether black self-employment is higher in areas with larger concentrations of blacks
(see Boyd 1990 and Dawkins 2007 for example).
Ethnic enclaves may explain why some ethnic groups have high rates of business
ownership, but enclaves can also dampen opportunities for entrepreneurs by creating
intense competition among co-ethnics (Aldrich and Waldinger 1990 and Razin and
Langlois 1996). Other research has proposed that disadvantaged minorities may turn to
self-employment as a survival strategy, possibly due to employment discrimination
(Light and Roach, 1986). If so, higher rates of business ownership are not so much the
results or signs of success but represent a reflection of blocked opportunities in
wage/salary employment. This is an important issue since in this context the
contributions of immigrant entrepreneurs are likely to be lower and is at times analyzed
from a so-called push versus pull perspective where a “push” factor is one where
individuals decide to start businesses when no other attractive alternatives are available
and higher economic returns and the non-monetary benefits of business ownership are
considered “pull” factors. However, determining empirically under what circumstances
some factors motivate while others discourage self-employment through the push vs. pull
lens can arguably be compared to deciding which blade of the scissors cut the paper.
Legal Status and Undocumented Immigrants
Another potential barrier to business ownership among immigrants is legal status.
Legal status may affect the decision to start a business for several reasons. First,
legal status is a prerequisite for access to many institutions which are important to
entrepreneurs. Legal residents have access to the court system, should disputes arise with
26
employees or customers. Legal status may also be required for participation in
government contracts. Legal migrants are more likely to own property which might be
used as collateral, and hence have access to credit. These factors suggest that legal status
should result in higher levels of business ownership. On the other hand, Kossoudji and
Cobb-Clark (2002) find that Latino wage and salary workers gaining legal status through
IRCA experienced wage increases, which increase the opportunity costs of starting a
business.8 Hence, the association between legal status and business ownership is
theoretically ambiguous.
A large share of the Mexican-born population residing in the United States is
estimated to be undocumented (Costanzo et al, 2001; Passel, Capps and Fix 2004). Fairlie
and Woodruff (2010) use a sample of undocumented immigrants from the Legalized
Population Survey (LPS) and the Immigration Reform and Control Act of 1986 (IRCA)
as a natural experiment to assess the impact of legal status on Mexican-American
business ownership. They find that legal status has an important impact on business
ownership rates among Mexican immigrants. Given estimates that half or more of the
Mexican-born population in the United States in 2000 was in the country illegally, legal
status accounts for at least 0.7 percentage points in the business ownership rate of male
and female Mexican immigrants. The benefits of legal status for business ownership thus
appear to outweigh the increased opportunity costs associated with higher wages.
Lastly, more recently there is evidence that increased enforcement of employer sanctions
against the hiring of unauthorized immigrants in wage/salary employment may lead to
higher self-employment rates (Bohn and Lofstrom, 2013). They report that in this context
8 More recent research, however, does not find evidence of large positive effects of legalization on labor market outcomes (Lofstrom, Hill and Hayes, 2013).
27
increases in reported self-employment is not particularly welcome news as it is most
likely associated with growth in lower paid informal employment.
4. Immigrant Business Performance
The contributions of immigrant entrepreneurs rest at least partly on their performance
as business owners. As shown in our overview section of immigrant entrepreneur
contributions, a number of measures can be used to shed light on this issue. Of these,
earnings or income has played the most prominent role in the literature.
The economic returns to self-employment in general have been rather extensively
examined. Studies from the 1980s find that potential wages and wage growth of
entrepreneurs are higher or not significantly different from the wages and growth of paid
employees (for example, Brock and Evans, 1986; Rees and Shah, 1986 and Evans and
Leighton, 1989). However, Hamilton (2000) shows that these results are influenced by a
handful of high-income entrepreneurial “superstars” and that most entrepreneurs have
both lower initial earnings and lower earnings growth than they would receive in
wage/salary employment. The observed and previously reported higher average earnings
may thus not characterize the self-employment returns of most business owners. To what
extent this applies to immigrant entrepreneurs is not entirely clear. This, as in the general
literature, is primarily due to the difficulty in finding valid instruments that credible
generates exogenous variation in employment choices, the challenges in comparing
wage/salary and self-employment earnings and the limited sources of suitable individual
level panel data that include key information such as pre-self-employment experience and
length of time in business. Nonetheless, a number of papers have examined the relative
performance of immigrant business owners, compared both to their wage/salary
28

counterparts and the performance of other entrepreneurs. The latter research represents
the relatively less empirically challenging strand of literature.
In Section 2 we report that average earnings of immigrant-owned businesses are
lower than for natives. This comparison, however, hides important heterogeneity across
immigrants. One issue is that immigrant business earnings tend to rise with time in the
country, possibly reflecting that business ownership is stepping stone in upward
economic mobility representing a tool in immigrants’ economic assimilation process
(Cummings 1980). Although there are a number of studies analyzing how immigrant
business ownership rates changes with time spent in the new country (e.g. Borjas 1986;
Clark and Drinkwater 2010; Lofstrom 2002, Schuetze 2005 and Andersson and Wadensjö
2004), not many have examined assimilation earnings patterns among immigrant self-
employed business owners.
Lofstrom (2002) analyzes both self-employment probabilities and earnings and
find that both increases with time spent in the U.S. More specifically, the results based on
1980 and 1990 US Census data suggests that self-employed immigrants are relatively
successful and may even reach earnings parity with observationally similar US born
entrepreneurs after about 25 years in the country. This is in contrast to wage/salary
immigrants for whom he does not find evidence of earnings convergence relative to their
native born wage/salaried counterparts. In an analysis that also includes immigrants in
Canada and Australia, Antecol and Schuetze, (2007) find that in all three countries self-
employment increases with time in the country but that in terms of earnings outcomes
relative to natives, self-employed immigrants in the U.S out-performed immigrants to
those two countries. This is an interesting and policy relevant finding given that unlike
29

immigrants to Canada and Australia, U.S. immigrants are not extensively selected and
admitted based on skills.
A relevant strand of literature is the one that examines earnings growth, including
those comparative studies of minority groups that are predominantly immigrants. Those
studies, which mostly focus on disadvantaged groups, provide some evidence of
relatively successful immigrant entrepreneurs. For example, Fairlie (2004), utilizing the
National Longitudinal Survey of Youth (NLSY), finds evidence of faster earnings growth
among self-employed Latino men than among male Latino wage /salary workers.
Focusing on low-skilled workers and relying on data form the Survey of Income and
Program Participation (SIPP), Lofstrom (2011) builds on this work and finds that the
returns to low-skilled self-employment among immigrants is higher than it is among
natives. However, in spite of relatively rapid earnings growth, he also finds that
wage/salary employment appears to be a more financially rewarding option for most low-
skilled immigrants. He concludes “The lack of strong evidence of relative success among
low-skilled immigrant entrepreneurs suggests that previous finding of greater labor
market assimilation among self-employed immigrants is driven by the relative success of
the comparatively higher skilled immigrant entrepreneurs” (p.43).
Differences across Immigrant Groups
A few previous studies have also examined whether business earnings and
performance differ by source countries. These studies generally find high levels of
business earnings among Asian immigrant groups and lower levels among Latino
immigrant groups.
30

From this strand of research, Asian immigrant owned businesses are generally
found to perform better than native owned businesses. Fairlie and Robb (2008, 2011)
using data the Characteristics of Business Owners (CBO) find that Asian-owned
businesses, which are 80 percent immigrant owned, have higher sales and profits, and are
more likely to survive and hire employees than are non-Hispanic white owned
businesses. Using Blinder-Oaxaca and non-linear decompositions they identify the causes
of these differences. They find that high levels of startup capital explain roughly 50-100
percent and high levels of education explain 8-26 percent of why Asian-owned
businesses perform better on average.
Fairlie, Zissimopoulos and Krashinsky (2010) compare business income among
Asian immigrants in the United States and Canada. They find that Asian immigrant
owned businesses have slightly higher average earnings than the national average in the
United States, but slightly lower average earnings than the national average in Canada.
Partly explaining the U.S. pattern, Asian immigrant business owners are found to have
substantially higher education levels than the national average.
There are some notable differences across Asian immigrant groups in the United
States, however. The highest levels of business earnings are found for immigrants from
India, Pakistan, and the Philippines, and the lowest levels of earnings are found for
immigrants from Vietnam and Bangladesh. In related work, Fairlie, et al. (2010) find that
Indian immigrants have the highest level of business earnings across all immigrant
groups and not just Asian groups. Indian business owners have average earnings of
$84,080, which significantly higher than the national average of $52,086 in 2000. This
differential is especially surprising given that India’s low per capita income -- only
31

$2,644 adjusted for purchasing power parity. But, Indian business owners in the United
States are found to be highly educated with nearly 70 percent having at least a 4-year
college degree. These high levels of education among Indian immigrants in the United
States are responsible for nearly half of the higher level of entrepreneurial earnings while
industry differences explain an additional 10 percent. In Canada, Indian entrepreneurs
have average earnings slightly below the national average but they are more likely to hire
employees, as are their counterparts in the United States and United Kingdom. The
Indian educational advantage is smaller in Canada and the United Kingdom contributing
less to their entrepreneurial success.
As noted in Table 4, immigrant business owners from Mexico comprise roughly
one quarter of all immigrant business owners in the United States. Not surprisingly then a
few recent studies have focused on this group. In recent research, Lofstrom and Wang
(2009) find, using the 1996 and 2001 Survey of Income and Program Participation
(SIPP), that relatively low levels of education and wealth contribute to lower business-
creation rates among Mexican-Americans. Using the 2000 Census, Fairlie and Woodruff
(2010) find that differences in age, education and marital status explain part of the lower
business ownership rate among Mexican-Americans, compared with the entire U.S. labor
force. Focusing on earnings, Fairlie (2004) finds evidence of faster earnings growth
among self-employed Latino men than among male Latino wage and salary workers from
the National Longitudinal Survey of Youth, and Zuiker (1998) finds evidence that self-
employment helps more than half of Latinos in the Southwest escape poverty.
Examining the causes of both low levels of business formation and business
income among Mexican-Americans, Fairlie and Woodruff (2010) find that low levels of
32

education and wealth explain the entire gap between Mexican immigrants and non-Latino
whites in business formation rates; together with language ability, these factors explain
nearly the entire gap in business income. Legal status represents an additional barrier for
Mexican immigrants, reducing business ownership rates by 0.7 percentage points.
Human and financial capital deficiencies limit business ownership and business success
among second and third-generation Mexican-Americans to a lesser extent.
Some of this work has focused more specifically on Latinas. Lofstrom and Bates
(2009) observe that Latina entrepreneurs have lower average earnings than both white
female entrepreneurs and Latina employees. However, once differences in mean
observable characteristics are taken into account Latina entrepreneurs often do well and
are even estimated to earn more than observationally similar non-minority white female
Entrepreneurs (but still slightly less than observationally similar wage/salary employed
Latinas).
5. Crowd out, Spillovers and Diversity
A more complete picture of the contributions of immigrant entrepreneurs requires a
look beyond the performance and impacts of the business owners. That is, the
contributions need to be viewed in the light of how it may enhance economic growth and
innovation but also through the lens of crowd out. For example, if there are large negative
displacement effects on natives from immigrant business ownership, positive
contributions are to some extent diminished. We next review the relatively young
literature that aims to shed light on immigrant entrepreneurship spillover effects.
33
The first study in this strand of the economics literature used 1980 and 1990 Census
microdata and a number of estimation techniques and measures of self-employment and
immigration to examine the impact on native born entrepreneurs (Fairlie and Meyer
2003). Their findings provide some evidence that immigration may negatively affect
native self-employment probabilities. The first-difference estimates indicate that
somewhere between 0.37 to 0.85 self-employed native men and 0.09 to 0.19 self-
employed native women are displaced by each self-employed immigrant. However, they
also report that this is not corroborated by the predictions of their general equilibrium
model or using the 1980 and 1990 cross-sections. In light of some evidence of a negative
impact on native self-employment rates, surprisingly the analysis of the effects of
immigration on native self-employment earnings suggests that immigration increases
native self-employment earnings. In light of the less than clear picture of the role of
immigration on native business owners, they postulate that the results “may be due to
immigrants primarily displacing marginal or low-income self-employed natives, but our
analyses do not provide clear evidence supporting this hypothesis” (p. 647).
More recent work focusing on innovations point rather unambiguously toward
positive spillover effects of immigrant entrepreneurs. In this context the research
concentrate on innovation as measured by patents, licensing and publications and
contributions are not limited to immigrant business owners. This is motivated by the
observation that immigrants are greatly over-represented among US-based Nobel Prize
winners (Peri 2007), high-impact companies (Hart and Acs 2011), patent applications
(Wadhwa et al 2007) and members of the National Academy of Sciences and the
National Academy of Engineering (Hunt and Gauthier-Loiselle 2010). More directly
34

related to business ownership, immigrants are also over-represented among founders of
high-tech companies (Saxenian 2002 and Wadhwa et al 2007), biotech firms (Monti,
Smith-Doerr and MacQuaid 2007), biotech companies undergoing initial public offerings
(Stephan and Levin 2001) and public venture-backed US companies (Anderson and
Platzer 2006). With respect to immigrant high-tech contributions, Hart and Acs (2011)
present evidence that suggests that although immigrants play an important role in this
important sector of the economy, “most previous studies have overstated the role of
immigrants in high-tech entrepreneurship (p.116). The challenging empirical question of
whether these types of observed relationships are causal is what some very interesting
recent papers have tackled. Using different identification strategies, two papers in
particular stand out here; Hunt and Gauthier-Loiselle (2010) and Kerr and Lincoln
(2010).
Using a state level panel for the period 1940-2000 and the 1940 distribution of skilled
immigrants as an instrument for later location choices, Hunt and Gauthier-Loiselle (2010)
find that skilled immigrants strongly contribute to innovation in the U.S. For example, the
IV estimates suggest that the increase in the share of the population of immigrants with at
least a college degree increased patenting per capita by about 21 percent. Moreover, they
point out that their analysis does not suggest that immigrants are innately more able than
natives but that the higher rate of patenting among college graduate immigrants is
entirely explained by the greater share of immigrants with science and engineering
education compared to natives.
Kerr and Lincoln (2010) take a different approach to assess the impact of high-skilled
immigration on technology formation as measured by science and engineering
35
employment and patenting. In addition to variation across cities and firms, they take
advantage of the substantial changes in the cap on new visas issued for the largest and
arguably most important temporary visa programs currently in place in the U.S.; the H-
1B program.9 They focus on the largest source country group of H-1B holders, those
from India and China as well as the most relevant occupations, science and engineering
(SE). They find that changes in the H-1B population account for a significant share of the
growth in U.S. immigrant science and engineering employment. Importantly, they rule
out crowding out effects on labor market outcomes (employment levels, unemployment
rates and mean wages) of native scientists and engineers and the results suggest
potentially small crowding-in effects.
Another potential measure of the contribution of immigrant-owned businesses is
exports. The ability of firms to export goods and services outside of the U.S. market
represents a measure of current success and the potential for future, long-term success of
firms. To the extent that immigrant-owned businesses can export (to their home
countries) it expands total revenues coming into the United States. For the first time, the
2007 SBO included information on both owner’s immigrant status and exports. Specially
commissioned tabulations of export levels for immigrant and non-immigrant businesses
from the 2007 SBO are reported in Table 8. Similar to sales, employment and payroll
these data are not available for immigrant businesses in published reports by the Census
9 The H-1B program allows U.S. businesses to temporarily employ high-skilled foreign workers in key specialty occupations generally requiring at least a bachelor’s degree. The H-1B visa is valid for three years and is renewable once for an additional three years. New visas are subject to an annual cap - which is one source of the controversy of the program - currently set at 65,000 visas (but which has been as high as 195,000). Exemptions from the cap include those workers hired by universities and non-profit research institutes and 20,000 individuals who hold a master’s degree or higher from a U.S. university
36

Immigrant and Native-Born Firms
Export Level
Percent of Immigrant
Total
Percent of Export Level
Total Percent of TotalNone 92.9% 12.7% 95.2%Less than 1% 1.4% 11.1% 1.7%1% to 4% 1.0% 14.7% 0.9%5% to 9% 0.6% 17.1% 0.5%10% to 19% 0.8% 20.2% 0.5%20% to 49% 1.0% 24.8% 0.5%50% to 99% 1.2% 35.1% 0.4%100% 1.0% 50.5% 0.3%Total reporting 100.0% 13.0% 100.0%
Immigrant Firms
Table 8Immigrant Share of Businesses by Export Level
Special Tabulations from Survey of Business Owners 2007
Note: (1) The sample includes businesses that are classified by the IRS as sole proprietorships, partnerships, 1120 corporations, or employers, and that have sales of $1000 or more. (2) Excludes publicly held and other firms not classifiable by owner status.
Bureau. The reported percentages represent the share of total sales of goods and services
represented by exports outside of the United States.
Immigrant-owned businesses are more likely to export than are non-immigrant
owned businesses. Among immigrant firms, 7.1 percent export compared with 4.4
percent of non-immigrant firms and 4.8 percent of all firms. Immigrant firms are also
more likely to have very high levels of exports with 3.2 percent of immigrant firms
having exports that represent 20 percent or more of their total sales of goods and services.
In comparison, less than 1 percent of non-immigrant firms and 1.2 percent of all firms
have exports that represent 20 percent or more of their total sales.
Immigrant-owned businesses constitute a very large share of businesses with high
levels of exports. Immigrant-owned businesses constitute one-quarter of all businesses
with exports of 20 to 49 percent of total sales, 35.1 percent of all businesses with exports
37

of 50 to 99 percent, and 50.5 percent of all businesses with exports representing 100
percent of total sales.
Immigrant-owned firms may have higher levels of exports than non-immigrant
owned firms because of business networks with their home countries, similar languages
and cultural ties. Regardless of the underlying cause, higher levels of exports among
immigrant owned firms may help these firms better succeed in the long run. Exports are
also important for alleviating the large U.S. trade imbalance with the rest of the world
and have been emphasized as a way to create jobs (U.S. Whitehouse 2010). Evidence of
the positive effects of immigrant entrepreneurs on exports is found in Rauch and Casella
(1998) and Rauch and Trindade (2002) who show that co-ethnic networks promote
bilateral trade by providing market information as well as by supplying matching and
referral services.
6. Conclusions and Areas for Future Research
Immigrants are widely perceived as being highly entrepreneurial and important
for economic growth and innovation. This is reflected in immigration policies and many
developed countries have created special visas and entry requirements in an attempt to
attract immigrant entrepreneurs. Not surprisingly, a significant body of research on
immigrant entrepreneurship has developed over the years. In this chapter we provide an
overview of the economics literature through the lens of immigrant business owners’ net
contributions to the economy.
Immigrant entrepreneurs are not a homogenous group and hence their experiences
and contributions vary widely across ethnic and source country groups. Although there is
38

some evidence that self-employment is associated with some upward economic mobility
for disadvantaged workers, groups that are characterized by relatively low skill levels
have not experienced the same degree of success as those with higher levels of human
capital.
Overall, much of the existing research points towards positive net contributions
by immigrant entrepreneurs. The emerging literature on these contributions as measured
by innovations represents the most convincing evidence so far. However, some
fundamental issues have yet not been credibly addressed. First, there is little evidence in
the literature on how much immigrant-owned businesses contribute to job growth.
Although data exists on employment among immigrant-owned businesses no data are
available showing the dynamics of employment among these firms. More research is
clearly needed on the contribution of immigrant firms to U.S. exports. Immigrant
business owners are more likely to export, but we know little about how much they
export in total dollars and how many jobs are created by these expanded markets for
selling goods and services. Another area of research needed is the contribution of
immigrant businesses to diversity. Although the contribution of immigrant firms to
diverse restaurants, merchandise and services is apparent in any visit to a major U.S. city,
we know less about the contribution to diversity in manufacturing and design of
innovative products. In all of these cases, finding data will pose substantial challenges.
39

References
Aldrich, Howard E., and Roger Waldinger. 1990. "Ethnicity and Entrepreneurship." Annual Review of Sociology, 16(1): 111-135.
Anderson, Stuart, and Michaela Platzer. 2006. “American Made: The Impact of Immigrant Entrepreneurs and Professionals on U.S. Competitiveness”, National Venture Capital Association, Arlington, VA.
Andersson, Pernilla and Eskil Wadensjö 2005. “Self-employed Immigrants in Denmark and Sweden – a Way to Economic Self-Reliance?” IZA Discussion Paper No. 1130.
Antecol, Heather and Herbert J. Schuetze, 2007 “Immigration, Entrepreneurship and the Venture Start-Up Process", International Handbook Series on Entrepreneurship eds. Simon C. Parker, Zoltan J. Acs, and David R. Audretsch: Kluwer Academic Publishers, Volume 2.
Black, Jane, David de Meza, and David Jeffreys. 1996. "House Prices, The Supply of Collateral and the Enterprise Economy." The Economic Journal. 106 (434):60-75.
Blanchflower, David G., and Andrew J. Oswald. 1998. "What Makes an Entrepreneur?" Journal of Labor Economics, 16 (1), pp. 26-60.
Blinder, Alan S. 1973. "Wage Discrimination: Reduced Form and Structural Variables." Journal of Human Resources 8: 436-455.
Bohn, Sarah and Magnus Lofstrom. 2013 “Employment Effects of State Legislation”, in David Card and Steven Raphael (eds.) Immigration, Poverty, and Socioeconomic Inequality, Russell Sage, pp. 282-314.
Borjas, George. 1986. “The Self-Employment Experience of Immigrants” Journal of Human Resources, 21, Fall: 487-506.
Borjas, George. 1994 “The Economics of Immigration,” Journal of Economic Literature,32, 1667-717.
Bradford, William D. 2003. "The Wealth Dynamics of Entrepreneurship for Black and White Families in the U.S.," Review of Income and Wealth, 49(1): 89-116.
Bucks, Brian K., Arthur B. Kennickell, and Kevin B.Moore. 2006. "Recent Changes in U.S. Family Finances: Evidence from the 2001 and 2004 Survey of Consumer Finances," Federal Reserve Bulletin, Washington, D.C.: Board of Governors of the Federal Reserve System.
Clark, Kenneth and Stephen Drinkwater. 2000. "Pushed out or pulled in? Self-employment among ethnic minorities in England and Wales." Labour Economics. 7, pp.603-628.
40

Clark, Kenneth and Stephen Drinkwater. 2010. “'Patterns of Ethnic Self-Employment in Time and Space: Evidence from British Census Microdata” Small Business Economics, 2010, 34 (3), 323-338
Cobb-Clark, Deborah A., and Vincent Hildebrand. 2004. "The Wealth of Mexican Americans," IZA Discussion paper No. 1150.
Dunn, Thomas A. and Douglas J. Holtz-Eakin. 2000. "Financial Capital, Human Capital, and the Transition to Self-Employment: Evidence from Intergenerational Links," Journal of Labor Economics 18 (2): 282-305.
Evans, David and Boyan Jovanovic. 1989. "An Estimated Model of Entrepreneurial Choice Under Liquidity Constraints." Journal of Political Economy 97(4):808-27.
Evans, David, and Linda Leighton. 1989. "Some Empirical Aspects of Entrepreneurship," American Economic Review, 79, pp. 519-535.
Fairlie, Robert W. 1999. "The Absence of the African-American Owned Business: An Analysis of the Dynamics of Self-Employment." Journal of Labor Economics, 17(1): 80-108.
Fairlie, Robert W. 2004. "Does Business Ownership Provide a Source of Upward Mobility for Blacks and Hispanics?," Entrepreneurship and Public Policy , ed., Doug Holtz-Eakin, Cambridge: MIT Press.
Fairlie, Robert W. 2005. "An Extension of the Blinder-Oaxaca Decomposition Technique to Logit and Probit Models," Journal of Economic and Social Measurement, 30(4): 305-316.
Fairlie, Robert W. 2006. "Entrepreneurship among Disadvantaged Groups: An Analysis of the Dynamics of Self-Employment by Gender, Race and Education," Handbook of Entrepreneurship, Volume 2, eds. Simon C. Parker, Zoltan J. Acs, and David R. Audretsch, Kluwer Academic Publishers, 437-478.
Fairlie, Robert W. 2008. Estimating the Contribution of Immigrant Business Owners to the U.S. Economy, U.S. Small Business Administration, Office of Advocacy, Washington, D.C.
Fairlie, Robert W. and Harry A. Krashinsky, 2005. "Liquidity Constraints, Household Wealth, and Entrepreneurship Revisited," Review of Income and Wealth, 58(2): 279-306.
Fairlie, Robert W. and Bruce D. Meyer. 2003 “The Effect of Immigration on NativeSelf-Employment” Journal of Labor Economics, vol. 21, no. 3, pp. 619-50.
41

Fairlie, Robert W. and Alicia M. Robb (2008) Race and entrepreneurial success: Black-, Asian-, and White-owned businesses in the United States. Cambridge, MA: MIT Press.
Fairlie, Robert W. and Alicia M. Robb. 2009. "Determinants of Business Success: An Examination of Asian-Owned Businesses in the United States," Journal of Population Economics, 22(4): 827-858.
Fairlie Robert W., Julie Zissimopoulos, and Harry A. Krashinsky. 2010. The international Asian business success story: A comparison of Chinese, Indian, and other Asian businesses in the United States, Canada, and United Kingdom. International differences in entrepreneurship, in Josh Lerner and Antoinette Shoar, eds. University of Chicago Press and National Bureau of Economic Research, 179-208. Fairlie Robert W., Julie Zissimopoulos, Harry A. Krashinsky, and Krishna Kumar. 2012. "Indian Entrepreneurs in the United States, Canada and United Kingdom," Research in Labor Economics (forthcoming).
Fairlie Robert W., and Christopher Woodruff. 2010. "Mexican-American Entrepreneurship," The Berkeley Electronic Journal of Economic Analysis & Policy, (Contributions), 10(1): 1-42, Article 10.
Glazer, Nathan and Daniel P. Moynihan. 1970. Beyond the Melting Pot: the Negroes, Puerto Ricans, Jews, Italians, and Irish of New York City, 2nd Edition. Cambridge: MIT Press.
Haltiwanger, John, Ron S Jarmin, and Javier Miranda. 2011. "Who Creates Jobs? Small vs. Large vs. Young," University of Maryland Working Paper.
Hart, David M. and Zoltan J. Acs 2011 “High-Tech Immigrant Entrepreneurship in the United States” Economic Development Quarterly 25:2 p.116-129.
Headd, B., and R. Saade. 2008. Do business definition decisions distort small business results? Washington, D.C. : U.S. Small Business Administration, Office of Advocacy working paper.
Holtz-Eakin, Douglas, David Joulfaian, and Harvey Rosen. 1994a. "Entrepreneurial Decisions and Liquidity Constraints." RAND Journal of Economics 23: 334-347.
Hunt, Jennifer. 2011 “Which Immigrants Are Most Innovative and Entrepreneurial? Distinctions by Entry Visa” Journal of Labor Economics, 29:3, pp. 417-457
Hunt, Jennifer, and Marjolaine Gauthier-Loiselle. 2010. “How Much Does Immigration boost innovation?” American Economic Journal: Macroeconomics, 2(2): 31–56.
Kassoudji, Sherrie. 1988. “English Language Abilities and the Labor Market Opportunities of Hispanic and East Asian Men,” Journal of Labor Economics, 6 (2).
42

Kerr, William R., and William F. Lincoln. 2010. “The Supply Side of Innovation: H-1B Visa Reforms and U.S. Ethnic Invention”, Journal of Labor Economics, 28(3): 473-508.
Kerr, Sari Pekkala and William R. Kerr. 2011. “Economic Impacts of Immigration: A Survey” NBER Working Paper No. 16736.
Kinzer, Robert H., and Edward Sagarin. 1950. The Negro in American Business: the Conflict between Separatism and Integration, New York: Greenberg.
Light, Ivan. 1972. Ethnic Enterprise in America. Berkeley: University of California Press.
Lindh T., and H. Ohlsson. 1996. ‘Self-employment and windfall gains: evidence from the Swedish lottery’, Economic Journal, 106: (439), November, pp.1515-1526.
Lofstrom, Magnus. 2002. "Labor market assimilation and the self-employment decision of immigrant entrepreneurs", Journal of Population Economics, 15(1), January, 83-114.
Lofstrom, Magnus, and Chunbei Wang. 2009 “Mexican-American Self-Employment: A Dynamic Analysis of Business Ownership” Research in Labor Economics, Vol. 29, pp.197-227.
Lofstrom, Magnus and Timothy Bates. 2009 “Latina Entrepreneurs”, Small Business Economics, 33:4, pp. 427-439.
Lofstrom, Magnus, Tim Bates and Simon Parker. Forthcoming, “Why Are Some People More Likely to Become Small-Businesses Owners than Others: Entrepreneurship Entry and Industry-Specific Barriers”, Journal of Business Venturing
Lofstrom, Magnus. 2011 “Low-Skilled Immigrant Entrepreneurship”, Review of Economics of the Household, 9:1, pp.25-44.
Lofstrom, Magnus, Laura Hill and Joseph Hayes. 2013 “Wage and Mobility Effects of Legalization: Evidence from the New Immigrant Survey”, Journal of Regional Science, 2013, 53:1, pp.171-197.
Monti, Daniel. J., Laurel Smith-Doerr and James MacQuaid. 2007. “Immigrant Entrepreneurs in the Massachusetts Biotechnology Industry”, Boston, MA: Immigrant Learning Center.
Oaxaca, Ronald. 1973. "Male-Female Wage Differentials in Urban Labor Markets," International Economic Review, 14 (October), 693-709.
Oaxaca, Ronald, and Michael Ransom. 1994. "On Discrimination and the Decomposition of Wage Differentials," Journal of Econometrics, 61, 5-21.
43
OECD (2005). SME and Entrepreneurship Outlook - 2005 Edition, Organisation for Economic Co-operation and Development Press.
Partnership for a New American Economy and the Partnership for New York City. 2012. Not Coming to America: Why the US is Falling Behind in the Global Race for Talent.
Peri, Giovanni. 2007. “Higher Education, Innovation and Growth.” in Education and Training in Europe, ed. Giorgio Brunello, Pietro Garibaldi, and Etienne Wasmer, 56–70. Oxford: Oxford University Press.
Rauch, James E., and Casella, Alessandra. 1998 “Overcoming Informational Barriers to International Resource Allocation: Prices and Group Ties” National Bureau of Economic Research working paper no. 6628.
Rauch, James E. and Vitor Trindade. 2002. “Ethnic Chinese Networks in International Trade”, Review of Economics and Statistics 84:1, pp. 116-130.
Razin, Eran and Andre Langlois. 1996. "Metropolitan Characteristics and Entrepreneurship among Immigrants and Ethnic Groups in Canada, International Migration Review, 30(3): 703-727.
Reynolds, Paul. 2005. Entrepreneurship in the US: The Future is Now. Springer.
Sanders, Jimy M. and Victor Nee. 1996 “Immigrant Self-Employment: The Family as Social Capital and the Value of Human Capital” American Sociological Review, Vol. 61, No. 2, pp. 231-249.
Saxenian, A. 1999. Silicon Valley’s new immigrant entrepreneurs, San Francisco: Public Policy Institute of California.
Saxenian, A. 2000. Networks of immigrant entrepreneurs. In The Silicon Valley edge: A habitat for innovation and entrepreneurship. C. Lee, W. F. Miller, and H. S. Rowen, eds. Stanford: Stanford University Press.
Saxenian, A. 2002. “Silicon Valley’s New Immigrant High-Growth Entrepreneurs” Economic Development Quarterly, 16, p. 20-31.
Schuetze, H. J., and H. Antecol. 2007. Immigration, entrepreneurship and the venture start-up process. The life cycle of entrepreneurial ventures: International handbook series on entrepreneurship, vol. 3, S. Parker, ed. Springer: New York.
Singer, Audrey. 2012. Immigrant Workers in the U.S. Labor Force, Brookings Institute and Partnership for a New American Economy Report.
44
Stephan, Paula E., and Sharon G. Levin. 2001. “Exceptional Contributions to US Science by the Foreign-Born and Foreign-Educated.” Population Research and Policy Review, 20:(1–2), pp. 59–79.
Taylor, Mark. 2001. "Self-Employment and Windfall Gains in Britain: Evidence from Panel Data." Economica. 63, pp. 539-565.
U.S. Department of Homeland Security. 2011. 2010 yearbook of immigration statistics, Washington, D.C.: Office of Immigration Statistics, http://www.dhs.gov/xlibrary/assets/statistics/yearbook/2010/ois_yb_2010.pdf.
U.S. Department of Homeland Security 2012. EB-5 Immigrant Investor, http://www.uscis.gov.
U.S. Small Business Administration, Office of Advocacy. 2011. Research and Statistics, http://www.sba.gov/advocacy/847.
Wadhwa, V., A. Saxenian, B. Rissing, and G. Gereff. 2007. America’s new immigrant entrepreneurs. Durham, NC: Duke University.
Yoon, I. (1995), ‘The growth of Korean immigrant entrepreneurship in Chicago’. Ethnic and Racial Studies 18, 215–235.
Yuengert, Andrew M. 1995. "Testing Hypotheses of Immigrant Self-Employment." Journal of Human Resources 30(1):194-204.
Zissimopoulos, Julie, Lynn Karoly, and Qian Gu. 2009. " Liquidity Constraints, Household Wealth, and Self-Employment: The Case of Older Workers," RAND Working Paper.
45

Appendix A: Data Sources on Immigrant Entrepreneurship
With varying degrees of limitations, there are a number of data sources for
analyzing immigrant entrepreneurship in the U.S. We briefly review the most relevant
ones.
The three of the nationally representative Census Bureau datasets used above are
described below. These datasets are the ones with large enough sample sizes to study
immigrant business owners in detail. Two of the datasets are household surveys -- the
American Community Survey and the Current Population Survey -- and provide
information on business ownership, startup activity and business income. The third
dataset is a business-level survey -- the Survey of Business Owners -- and provides
information on business sales, employment, payroll and exports. The datasets also
provide detailed information on immigrant owners such as source country, skill level,
state of residence, and industry of business.
The American Community Survey
The primary sample used to examine immigrant business ownership and net
business income is the American Community Survey (ACS). Starting with the data
collected in 2005, the ACS is a 1% nationally representative survey with microdata for
about 11.6 million observations for adults in recent years. Even after conditioning on
business ownership, the sample size is very large, allowing one to explore the causes of
differences in net business income. The ACS is also large enough to examine state,
industrial, skill level and country-of-origin differences across immigrant business owners.
46

Using the ACS data, business ownership is measured based on the class-of-
worker question that refers to the respondent's main job or business activity (i.e., activity
with the most hours) at the time of the interview. Business owners are individuals who
report that they are 1) "self-employed in own not incorporated business, professional
practice, or farm," or 2) "self-employed in own incorporated business, professional
practice, or farm." This definition includes owners of all types of businesses—
incorporated, unincorporated, employer, and non-employer firms. Commonly defined
samples include all business owners ages 18 and over who work 15 or more hours per
week in their businesses. To rule out very small-scale businesses, disguised
unemployment, or casual sellers of goods and services, typically only business owners
with 15 or more hours worked are included.10 Fifteen hours per week is often chosen as
the cutoff because it represents a reasonable amount of work effort in the business, about
two days per week. Note that self-employed business ownership is defined as the
individual's main job activity, thus removing the potential for counting side businesses
owned by wage-and-salary workers.
The Matched Current Population Survey
Although research on entrepreneurship is growing rapidly, very few national
datasets provide information on recent trends in business formation. The measure to
study immigrant business startup activity can be derived from matched data from the
Current Population Surveys (CPS). The measure captures the rate of business creation at
the individual owner level. The underlying datasets used to create the entrepreneurship or
business formation measure are the basic monthly files of the CPS. Although the CPS is
10 Some unemployed individuals may report being self-employed if they sell a small quantity of goods or services while not working at their regular jobs.
47

commonly used as cross-sectional data, longitudinal data can be created by linking the
CPS files over time. The surveys, conducted monthly by the U.S. Bureau of the Census
and the U.S. Bureau of Labor Statistics, are representative of the entire U.S. population
and in recent years contain observations for more than 130,000 people. For example,
combining the 2007 to 2010 monthly data creates a sample size of 3.8 million adult
observations.
Households in the CPS are interviewed each month over a four-month period.
Eight months later they are re-interviewed in each month of a second four-month period.
Thus, individuals who are interviewed in January, February, March, and April of one
year are interviewed again in January, February, March, and April of the following year.
The rotation pattern of the CPS thus allows for matching information on individuals
monthly for 75 percent of all respondents to each survey. To match these data, we use the
household and individual identifiers provided by the CPS and removes false matches by
comparing race, sex, and age codes from the two months. All non-unique matches are
also removed from the dataset. Monthly match rates are generally between 94 and 96
percent, and false positive rates are very low.
The business formation rate is estimated by first identifying all individuals who
do not own a business as their main job in the first survey month, then matching CPS
files to determine whether they own a business as their main job (with 15 or more usual
hours worked per week) in the following survey month. The business formation rate is
thus defined as the percentage of the population of non-business owners who start a
business each month. To identify whether they are business owners in each month,
information on their main job, defined as the one with the most hours worked, is used.
48

Thus, individuals who start side or casual businesses are not counted if they are working
more hours on a wage-and-salary job.
The 2007 Survey of Business Owners
Estimates of business ownership and formation rates and of the net business
income of owners are available using Census and CPS microdata, but another source of
information is provided by business-level data, where the business, rather than the owner,
is the focus of the analysis. The main advantage of business-level data is that they
typically provide more information on business performance than individual-level data,
but the main disadvantage is that they do not include information on the demographic
characteristics of the owner.11 The only large nationally representative business-level data
set in which the immigrant status of the owner is identifiable is the 2007 SBO. For the
first time since 1992 (then called the Characteristics of Business Owners), the U.S.
Census Bureau in 2007 collected information on the immigrant status of business owners
in its main database collecting information on the ownership characteristics of U.S.
businesses. The SBO is conducted by the U.S. Census Bureau every five years to collect
statistics that describe the composition of U.S. businesses by gender, race, and ethnicity.
The universe for the most recent survey is all firms operating during 2007 with receipts
of $1,000 or more that filed tax forms as individual proprietorships, partnerships,
employers or any type of corporation.
The 2007 SBO includes information on whether the business owner is an
immigrant which is determined by whether the owner is foreign-born vs. U.S. born.
Following the convention used by the Census Bureau in reporting business statistics by
11 See Headd and Saade (2008) and Fairlie and Robb (2008) for more discussion on the comparison between individual-level and business-level data on entrepreneurship.
49

race, immigrant-owned businesses are defined as those with majority foreign-born
ownership (51% or more). Similarly, non-immigrant businesses are defined as those with
majority U.S.-born ownership (51% or more). Equally-owned firms are also reported in
the tables presented below but are not included in calculating the immigrant shares.
The 2007 SBO also includes information on the sales, employment, payroll and
exports of the business. Unfortunately, however, only business and employer firm counts
by foreign-born status were reported in published reports by the Census Bureau. Instead,
I commissioned the U.S. Census Bureau to conduct special runs using the 2007 SBO that
provide information on the sales, employment, payroll and exports of immigrant-owned
businesses and non-immigrant owned businesses.12
The Survey of Income and Program Participation
The U.S. Census Bureau has also generates individual level longitudinal data that
can be used for analyzing various aspects of immigrant entrepreneurship. The Survey of
Income and Program Participation (SIPP) contains individual demographic information
as well as detailed information on labor market activities, business ownership, and
business characteristics. The surveys are conducted every four months (called a “wave”)
for, depending on the panel, roughly 37,000 to 47,000 U.S. households in each panel. For
the most recent completed SIPP panels, the length of the panel is four years for the 1996
and 2004 panels while the 2001 panel followed individuals for only three years (The
2008 SIPP panel began in September 2008 and will run through December 2013).
Importantly, given the focus on disadvantaged groups, of which many are immigrants,
12 Published data from the Census Bureau also only report foreign-born owners and not businesses (which is why no sales, employment, payroll and export information is reported). We find, however, that published estimates for the SBO report show a very similar ratio of foreign-born owners to foreign-born and U.S. born owners.
50

SIPP panels oversampled low-income households. The data are nationally representative
when the provided sampling weights are used.
Each wave in the SIPP panels contain both core questions, common to each wave,
and topical questions that are not updated in each wave. In addition to the key variables
found in the core modules, two topical modules are particularly valuable for research on
immigrant business owners: immigration (which includes information on country of
origin, citizenship status, and year of arrival, collected in the second wave in each panel),
and assets and liabilities (containing wealth and asset data, including business equity,
collected once a year in each panel). Given the longitudinal nature of the data, it allows
for dynamic analysis such as entry and exits of self-employment.
51

Appendix B: Utility Model Representation of Self-Employment Decision
Typically it is assumed that the utility function is a function of expected income,
or earnings if working, yits-e
for self-employment work and y itJ
for participating in state J
(for example wage/salary work, unemployment or to not participate in the labor force and
where i and t are indices for individual i at time t). Furthermore, earnings, or income, in
each state will depend on a vector of observable characteristics,X it , possible constraints
faced by the individual, vit, and unobserved characteristicsε it , which may represent
random shocks to earnings or income opportunities and/or information known to the
individual but not to the econometrician. Assuming that individuals maximize expected
utility, a person will choose self-employment if the expected utility from self-
employment, denotedE(u its-e ), is greater than the expected utility in any of the other J
states, represented here byE(u itJ ). Expected utility in the J+1 states can be defined as:
E(uitJ )= y it
J +v itJ δ J+εit
J =Χ it βJ+v itJ δ J +ε it
J(4.1)
E(uits−e )= y it
s−e+vits−e δ s−e+εit
s−e=Χ it β s−e+v its−e δ s−e+εit
s−e(4.2)
where εJ and ε s−e
may be assumed to be jointly normally distributed with mean zero and
variances σ J2 and σ s−e
2. Alternatively, the disturbances may be assumed to follow a
logistics distribution. An individual chooses self-employment at time t if:
I it¿ =E(uit
s−e )−E(uitJ )>0 , for any state J (4.3)
52

Clearly the index function I it¿
is unobservable. However, from equations (4.1), (4.2) and
(4.3) I it¿
can be defined as:
I it¿ =E(uit
s−e )−E(uitJ )
=Χ it βs−e−Χ it βJ+v its−e δ s−e−v it
J δ J+εits−e−εit
J
=W it π+eit (4.4)
If we set I=1 if I it¿ >0 , if the individual is observed to have entered self-
employment at time t, and I=0 if I it¿ ≤0 , if the person decides not to start up a new
business, then equation (4.4) can simply be seen as a probability model of entry into self-
employment. In other words, the model can be seen as a conditional probability model
where the person is observed to be not self-employed in the previous time period, i.e. at t-
1. Similarly, conditioning on observing the person to be in self-employment at time t-1,
the model can represent the business ownership exit decision. The entry and exit models
estimated can be represented by the following, where Iit=1 represents an observed
transition, i.e. a decision to enter or exit self-employment:
Prob [ I it=1 ]=X it β+v it δ+eit (4.5)
where
X it = Matrix containing observable characteristics such as age, educational attainment, marital status, number of children, immigrant status, years in residence in the U.S., geographic location.
vit = Matrix containing controls for potential business ownership constraints, or barriers, such as financial assets.
53

Appendix C: Decomposition Methodology
The primary methodology used for identifying causes of immigrant/native or
immigrant group differences in business ownership is the decomposition technique. This
technique decompose inter-group differences (for any two groups) in mean levels of an
outcome into those due to different observable characteristics or "endowments" across
groups and those due to different effects of characteristics or "coefficients" of groups.
The standard Blinder-Oaxaca technique is used for dependent variables that are estimated
with linear regressions. For decomposing immigrant group differences in binary
outcomes, such as business ownership rates, an alternative non-linear decomposition
technique originally developed in Fairlie (1999) and further discussed in Fairlie (2005) is
used.13 The technique is used when logit or probit regressions are estimated to identify
the determinants of business ownership or other binary business outcomes.
For a linear regression, the standard Blinder-Oaxaca decomposition of the
immigrant/native gap in the average value of the dependent variable, Y, can be expressed
as:
whereX jis a row vector of average values of the independent variables andβ j
is a vector
of coefficient estimates for immigrant group j (Blinder 1973; Oaxaca 1973). Following
Fairlie (1999), the decomposition for a nonlinear equation, such as Y = F(Xβ ), can be
written as:
13 SAS programs are available at people.ucsc.edu/~rfairlie/decomposition, and Stata programs are available by entering "ssc install fairlie" in Stata.
54
Y N−Y I = [( X N−X I ) βN ] + [ X I ( βN− βI )] , (4.6)

where Nj is the sample size for immigrant group j. This alternative expression for the
decomposition is used because Y does not necessarily equal F(X β ).14 In both (4.6)
and (4.7), the first term in brackets represents the part of the racial gap that is due to
group differences in distributions of X, and the second term represents the part due to
differences in the group processes determining levels of Y. The second term also
captures the portion of the racial gap due to group differences in unmeasurable or
unobserved endowments. Most previous studies applying the decomposition technique
do not focus on this "unexplained" portion of the gap because of the difficulty in
interpreting results (see Jones 1983 and Cain 1986 for more discussion).
To calculate the decomposition, define Yjas the average probability of the binary
outcome of interest for immigrant group j and F as the cumulative distribution function
from the logistic distribution. Alternatively, for a probit model F would be defined as the
cumulative distribution function from the standard normal distribution.
An equally valid method of calculating the decomposition is to use the immigrant
coefficient estimates,β I, as weights for the first term and the white distributions of the
independent variables,XN
, as weights for the second term. This alternative method of
calculating the decomposition often provides different estimates, which is the familiar
index problem with the Blinder-Oaxaca decomposition technique. A third alternative is
to weight the first term of the decomposition expression using coefficient estimates from
a pooled sample of the two groups or all groups, which also includes dummy variables 14 Note that the Blinder-Oaxaca decomposition is a special case of (4.2).
55
Y N−Y I = ¿¿ (4.7)

for those groups (see Oaxaca and Ransom 1994 for example). The use of this third
alternative is becoming more popular.
Using the pooled coefficients from a sample of all racial groups has the advantage
over using the white coefficients because it captures the determinants for all groups and
are more precisely estimated (because of the larger sample and more heterogeneity of
firms). They are also preferred over the minority coefficients because they are less likely
to be influenced by discrimination. The goal of the decomposition is to estimate how
much differences in owner or firm characteristics explain of the racial gap in business
outcomes given a non-discriminatory environment.
The first term in (4.7) provides an estimate of the contribution of racial
differences in the entire set of independent variables to the racial gap in the dependent
variable. Estimation of the total contribution is relatively simple as one only needs to
calculate two sets of predicted probabilities and take the difference between the average
values of the two. Identifying the contribution of group differences in specific variables
to the racial gap, however, is not as straightforward. To simplify, first assume that
NB=NW and that there exists a natural one-to-one matching of black and white
observations. Using coefficient estimates from a logit regression for a pooled sample,β¿
, the independent contribution of X1 to the racial gap can then be expressed as:
Similarly, the contribution of X2 can be expressed as:
56
1N I∑ ¿
i=1
N I
F ( α ¿+X1iN β1
¿ +X 2iN β2
¿ )−F( α¿+ X1iI β1
¿+X 2iN β2
¿ ) ¿
(4.8)

The contribution of each variable to the gap is thus equal to the change in the average
predicted probability resulting from sequentially switching the white characteristics to
black characteristics one variable or set of variables at a time.15 A useful property of this
technique is that the sum of the contributions from individual variables will be equal to
the total contribution from all of the variables evaluated with the full sample.
In practice, the sample sizes of the two groups are rarely the same and a one-to-
one matching of observations from the two samples is needed to calculate (4.8) and (4.9).
In this example, it is likely that the immigrant sample size is substantially smaller than
the native sample size. To address this problem, first use the pooled coefficient estimates
to calculate predicted probabilities, Y i , for each immigrant and native observation in the
sample. Next, draw a random subsample of natives with a sample size equal to NI and
randomly match it to the full immigrant sample. The decomposition estimates obtained
from this procedure depend on the randomly chosen subsample of natives. Ideally, the
results from the decomposition should approximate those from matching the entire native
sample to the immigrant sample. A simple method of approximating this hypothetical
decomposition is to draw a large number of random subsamples of natives, match each of
these random subsamples of natives to the immigrant sample, and calculate separate
15 Unlike in the linear case, the independent contributions of X1 and X2 depend on the value of the other variable. This implies that the choice of a variable as X1 or X2 (or the order of switching the distributions) is potentially important in calculating its contribution to the racial gap. A simple solution to solve this problem of path dependence (if the estimates are indeed sensitive to the ordering) is to randomize the ordering of variables at the same time the random subsample of whites is chosen (in stata use the ro option and increase the number of replications).
57
1N I∑ ¿
i=1
N I
F ( α ¿+X1iI β1
¿+ X 2iN β2
¿ )−F( α ¿+ X1iI β1
¿+X 2iI β2
¿ ) ¿
(4.9)

decomposition estimates. The mean value of estimates from the separate decompositions
is calculated and used to approximate the results for the entire native sample.
58


