
REVISED FINAL (100 PERCENT) DESIGN
LOCKHEED WEST SEATTLE SUPERFUND SITE REMEDIAL ACTION
SEATTLE, WASHINGTON
Prepared for: Lockheed Martin Corporation
Prepared by: Amec Foster Wheeler Environment & Infrastructure, Inc. Dalton, Olmsted & Fuglevand, Inc. American Construction Company
July 2018

REVISION TABLE
Revision Number
Prepared By
SubmittalTo
SubmittalDates
Change Description
Section
Narrative (of Items Affected)
0 Tetra Tech, Inc. USEPA 10/31/2016 All Draft 30% Design
1 Tetra Tech, Inc. USEPA 05/01/2017 All Draft 60% Design
2 Amec Foster Wheeler USEPA 01/08/2018 All Draft 90% Design
3 Amec Foster Wheeler USEPA 04/09/2018 All Final 100% Design
4 Wood USEPA 06/06/2018 2.1, 5.3, 5.3.2, 5.9.2, 7.4.2, 7.4.4.3, and 10
Revised Final 100% Design

July 2018 Revised Final (100 Percent) Design Report Page i
TABLE OF CONTENTS
Section Page
Table of Contents ........................................................................................................... i
List of Figures ............................................................................................................... v
List of Tables ................................................................................................................. v
List of Appendices ........................................................................................................ v
Acronyms and Abbreviations ..................................................................................... vii
Section 1 Introduction ............................................................................................... 1-1
1.1 Site Background ........................................................................................... 1-1
1.2 Lockheed West Seattle Area ........................................................................ 1-3
1.3 Description of Remedial Action .................................................................... 1-4
1.3.1 Design Coordination with the Port .......................................................... 1-5
1.3.2 Design Coordination with Other Cleanup Actions ................................... 1-6
1.3.3 Roles and Responsibilities ...................................................................... 1-7
1.3.4 Design Coordination with Tribal Fishing.................................................. 1-7
1.4 Report Organization ..................................................................................... 1-7
Section 2 Regulatory Requirements ......................................................................... 2-1
2.1 Cleanup Objectives ...................................................................................... 2-2
2.2 Key Applicable or Relevant and Appropriate Requirements (ARARs) ......... 2-4
2.3 Other ARARs ............................................................................................... 2-4
2.4 State Laws and Regulations (TBCs) ............................................................ 2-6
2.5 Local Codes and Regulations (TBCs) .......................................................... 2-7
2.5.1 Air Quality Requirements ........................................................................ 2-7
2.5.2 King County Code ................................................................................... 2-7
2.5.3 Seattle Municipal Code ........................................................................... 2-8
Section 3 Site Conditions .......................................................................................... 3-1
3.1 Site Description, Ownership, and Use .......................................................... 3-1
3.1.1 Current Site Use ..................................................................................... 3-3
3.1.2 Potential Site Future Uses ...................................................................... 3-3
3.2 Previous Site Investigations ......................................................................... 3-4
3.3 Source Control ............................................................................................. 3-5

July 2018 Revised Final (100 Percent) Design Report Page ii
3.4 Habitat and Natural Resources .................................................................... 3-5
3.5 Site Physical Characteristics ........................................................................ 3-6
3.6 Sediment Chemical Characteristics ............................................................. 3-7
3.6.1 Horizontal Extent of Contamination ........................................................ 3-8
3.6.2 Vertical Extent of Contamination in Removal Areas ............................... 3-9
3.6.3 Nature and Source of PAHs in Shipway ............................................... 3-10
3.7 Sediment Physical Characteristics ............................................................. 3-11
3.7.1 Existing Bathymetry and Debris ............................................................ 3-12
3.7.2 Geotechnical Properties ........................................................................ 3-12
3.7.3 Sediment Dewatering Characteristics ................................................... 3-13
3.8 Shoreline Structures ................................................................................... 3-14
3.8.1 Sheet Pile Embedment Depth ............................................................... 3-14
3.8.2 Structural Field Inspection and Testing ................................................. 3-15
Section 4 Debris and Pile Removal and Disposal ................................................... 4-1
4.1 Design Basis and Assumptions .................................................................... 4-1
4.2 Utility AND OUTFaLL Protection .................................................................. 4-2
4.3 Shoreline Debris Removal ............................................................................ 4-2
4.4 Pile Removal in Former Shipway ................................................................. 4-3
4.4.1 Pile Extraction ......................................................................................... 4-4
4.4.2 Removal of Other Debris and Structural Components ............................ 4-4
4.4.3 Lessons Learned from Pile Removal at LSSOU ..................................... 4-4
4.5 Shoreline Stability Evaluations ..................................................................... 4-5
4.5.1 Bank Stability Evaluations ....................................................................... 4-5
4.5.2 Sheet Piles Stability Evaluations ............................................................. 4-5
4.6 Debris Transport and Disposal ..................................................................... 4-7
Section 5 Sediment Removal and Disposal ............................................................. 5-1
5.1 Design Basis and Assumptions .................................................................... 5-1
5.2 Sediment Properties ..................................................................................... 5-2
5.2.1 Sediment Cohesiveness ......................................................................... 5-2
5.2.2 Sediment Density .................................................................................... 5-2
5.2.3 Percent Solids ......................................................................................... 5-3
5.3 Dredge Prism Design ................................................................................... 5-3
5.3.1 Neatline Dredge Depths and Slopes ....................................................... 5-3

July 2018 Revised Final (100 Percent) Design Report Page iii
5.3.2 Extent of Dredging .................................................................................. 5-4
5.3.3 Overdredge ............................................................................................. 5-5
5.4 Shoreline/Intertidal Sediment Removal ........................................................ 5-5
5.5 Former Shipway Sediment Removal ............................................................ 5-6
5.6 Subtidal Sediment Removal ......................................................................... 5-6
5.7 Shoreline Stability Evaluations ..................................................................... 5-6
5.7.1 Bank Stability Evaluations ....................................................................... 5-6
5.7.2 Sheet Piles Stability Evaluations ............................................................. 5-8
5.8 Dredge Method and Operational Controls .................................................... 5-9
5.8.1 Dredging Methodology ............................................................................ 5-9
5.8.2 Dredge Operations ............................................................................... 5-10
5.9 Sediment Dewatering ................................................................................. 5-11
5.9.1 Barge Dewatering ................................................................................. 5-11
5.9.2 Upland Dewatering ............................................................................... 5-11
5.9.3 Wastewater Treatment .......................................................................... 5-12
5.10 Sediment Transload and Disposal ............................................................. 5-12
5.10.1 Sediment Transloading ......................................................................... 5-12
5.10.2 Disposal ................................................................................................ 5-12
5.11 Dredge Verification and Confirmation Sampling ......................................... 5-13
Section 6 Backfill, Residual Management Layer, and Enhanced Natural Recovery Layer Placement ...................................................................................................... 6-1
6.1 Design Basis and Assumptions .................................................................... 6-1
6.2 Intertidal Area and Former Shipway Area Backfill ........................................ 6-2
6.2.1 Backfill Material Specifications ................................................................ 6-2
6.2.2 Placement Methodology ......................................................................... 6-3
6.3 RML and ENR Layer Placement .................................................................. 6-3
6.3.1 RML and ENR Material Specifications .................................................... 6-4
6.3.2 RML and ENR Placement Methodology ................................................. 6-4
6.4 Placement Verification ................................................................................. 6-5
6.5 ENR and RML Effectiveness ........................................................................ 6-6
Section 7 Short-Term Environmental Control Measures ........................................ 7-1
7.1 Short-Term Water Quality Impacts ............................................................... 7-1
7.1.1 In-Water Work Window ........................................................................... 7-3
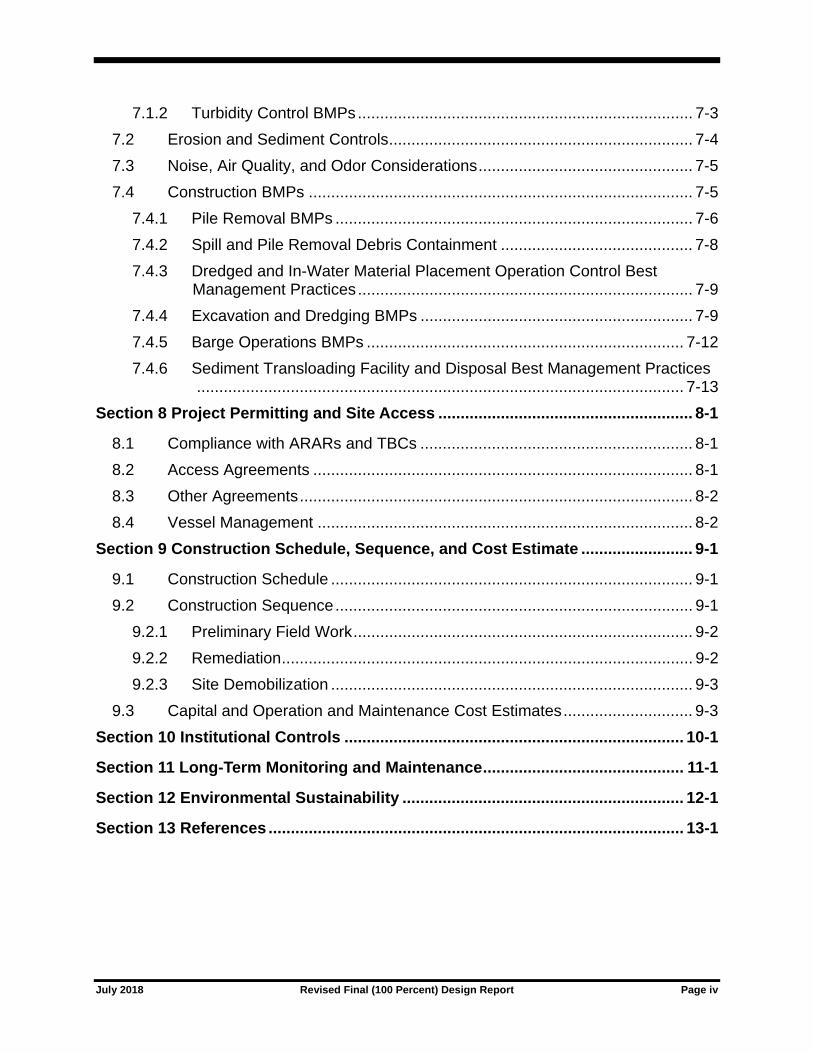
July 2018 Revised Final (100 Percent) Design Report Page iv
7.1.2 Turbidity Control BMPs ........................................................................... 7-3
7.2 Erosion and Sediment Controls .................................................................... 7-4
7.3 Noise, Air Quality, and Odor Considerations ................................................ 7-5
7.4 Construction BMPs ...................................................................................... 7-5
7.4.1 Pile Removal BMPs ................................................................................ 7-6
7.4.2 Spill and Pile Removal Debris Containment ........................................... 7-8
7.4.3 Dredged and In-Water Material Placement Operation Control Best Management Practices ........................................................................... 7-9
7.4.4 Excavation and Dredging BMPs ............................................................. 7-9
7.4.5 Barge Operations BMPs ....................................................................... 7-12
7.4.6 Sediment Transloading Facility and Disposal Best Management Practices ............................................................................................................. 7-13
Section 8 Project Permitting and Site Access ......................................................... 8-1
8.1 Compliance with ARARs and TBCs ............................................................. 8-1
8.2 Access Agreements ..................................................................................... 8-1
8.3 Other Agreements ........................................................................................ 8-2
8.4 Vessel Management .................................................................................... 8-2
Section 9 Construction Schedule, Sequence, and Cost Estimate ......................... 9-1
9.1 Construction Schedule ................................................................................. 9-1
9.2 Construction Sequence ................................................................................ 9-1
9.2.1 Preliminary Field Work ............................................................................ 9-2
9.2.2 Remediation ............................................................................................ 9-2
9.2.3 Site Demobilization ................................................................................. 9-3
9.3 Capital and Operation and Maintenance Cost Estimates ............................. 9-3
Section 10 Institutional Controls ............................................................................ 10-1
Section 11 Long-Term Monitoring and Maintenance ............................................. 11-1
Section 12 Environmental Sustainability ............................................................... 12-1
Section 13 References ............................................................................................. 13-1

July 2018 Revised Final (100 Percent) Design Report Page v
TABLE OF CONTENTS (CONTINUED)
LIST OF FIGURES
Figure 1 Site Vicinity Figure 2 Selected Remedy Figure 3 Remediation Overview
Figure 4 Current Management and Ownership Figure 5a PSR PAH Contamination in Deep Former Shipway Sediments Figure 6 CSL and SQS Boundary Figure 7 Dredge Plan Overview
Figure 8 Decision Unit Dredge Sequence
LIST OF TABLES
Table 1 Summary of Cleanup Levels for Contaminants of Concern in Sediment Table 2 Remedial Action Levels to Be Achieved at Sediment Surface Following
Excavation and Dredging Table 3 Summary of Remedial Action Level Exceedances Table 4 PSR Surface Sediment Samples Collected from near the Former Shipway and
the Upland PSR DNAPL Table 5 Geotechnical Properties of Dredge Sediment Table 6 Sediment Dewatering Parameters Table 7 Amendment Dewatering—Paint Filter Test Results Table 8 Gravity Dewatering Test Results Table 9 Dredge Volume Summary Table Table 10 Slope Stability Analysis Table 11 Sheet Pile Wall Deflection Analysis Table 12 RML, ENR, and Backfill Estimated Volume Summary Table 13 Applicable or Relevant and Appropriate Requirements and to be Considered
Criteria
LIST OF APPENDICES
Appendix A—Pre-Design Chemistry Data Summary and Dredge Extent Verification Appendix B—Section 408 Substantive Compliance Memorandum
Appendix C—Construction Quality Management Plan Appendix D—Construction Quality Assurance Plan Appendix E—Design Drawings Appendix F—Biological Assessment Appendix G—Archaeological Work, Monitoring, and Inadvertent Discovery Plan Appendix H—Basis of Design Calculations Appendix I—Debris/Pile Removal Support System Plan Appendix J—Best Management Practices

July 2018 Revised Final (100 Percent) Design Report Page vi
Appendix K—Site Management Plan (includes Contingency Plan, Pollution Control Plan, Transportation and Disposal Plan, Green and Sustainable Remediation Plan, and Climate Change Adaptation Plan)
Appendix L—Excavation, Dredging, and Backfill Plan Appendix M—Water Quality Monitoring Plan Appendix N—Dewatering Plan Appendix O—Construction Water Management Plan Appendix P—Field Sampling Plan, Construction and Post-Construction Sediment
Monitoring Quality Assurance Project Plan, and Site-Specific Health & Safety Plan
Appendix Q—Survey Plan Appendix R—Specifications Appendix S—Erosion and Sedimentation Control Plan Appendix T—Permitting and Site Access Plan Appendix U—Vessel Management Plan Appendix V—Project Implementation Schedule Appendix W—Equipment Decontamination Plan Appendix X—Capital and Operation and Maintenance Cost Estimate Appendix Y—Institutional Control Implementation and Assurance Plan Appendix Z—Long-Term Monitoring and Maintenance Plan

July 2018 Revised Final (100 Percent) Design Report Page vii
ACRONYMS AND ABBREVIATIONS
ARAR applicable or relevant and appropriate requirement
AWQC ambient water quality criteria
BMP best management practice
°C degrees Celsius
CERCLA Comprehensive Environmental Response, Compensation, and Liability Act
CFR Code of Federal Regulations
CHASP Contractor’s Health and Safety Plan
cm centimeter
COC contaminant of concern
cPAH carcinogenic polycyclic aromatic hydrocarbon
CPT cone penetration test
CQAP Construction Quality Assurance Plan
CSL cleanup screening level
cy cubic yard(s)
dBA A-weighted decibels
DMMU Dredged Material Management Unit
DNAPL dense nonaqueous-phase liquid
DNR Washington State Department of Natural Resources
DO dissolved oxygen
DU decision unit
Ecology Washington State Department of Ecology
ENR enhanced natural recovery
ESA Endangered Species Act
ESD Explanation of Significant Differences
FEIS final environmental impact statement
Final Design Final (100 Percent) Design, Lockheed West Seattle Superfund Site Remedial Action, Seattle, Washington

July 2018 Revised Final (100 Percent) Design Report Page viii
FoS factor of safety
GPS global positioning system
HASP Health and Safety Plan
H:V horizontal to vertical
IC institutional control
KCC King County Code
LDW Lower Duwamish Waterway
Lockheed Martin Lockheed Martin Corporation
LSSOU Lockheed Shipyard Sediments Operable Unit
mg/L milligram per liter
MHHW mean higher high water
MLLW mean lower low water
mm millimeter
MTCA Model Toxics Control Act
NCP National Contingency Plan
NOAA-Fisheries National Oceanic and Atmospheric Administration National Marine Fisheries Service
NPDES National Pollutant Discharge Elimination System
NTU nephelometric turbidity unit
OSHA United States Occupational Safety and Health Administration
OSWER (USEPA) Office of Solid Waste and Emergency Response
PAH polycyclic aromatic hydrocarbon
PCB polychlorinated biphenyl
Port Port of Seattle
PSCAA Puget Sound Clean Air Agency
PSR Pacific Sound Resources
RA Remediation Area
RAL remedial action level
RAO remedial action objective

July 2018 Revised Final (100 Percent) Design Report Page ix
RCW Revised Code of Washington
RI/FS remedial investigation and feasibility study
RML residual management layer
RNA regulated navigation area
ROD Record of Decision
SEPA (Washington) State Environmental Policy Act
Site Lockheed West Seattle Superfund Site
SMP Shoreline Master Program
SMC Seattle Municipal Code
SMS sediment management standards
SOW Statement of Work
SQS sediment quality standards
TBC to-be-considered criteria
TBT tributyltin
TI technical impracticability
TSS total suspended solids
U&A Usual and Accustomed
UAO Unilateral Administrative Order
USACE United States Army Corps of Engineers
U.S.C. United States Code
USEPA United States Environmental Protection Agency
WAC Washington Administrative Code
WISHA Washington Industrial Safety and Health Act
WQMP Water Quality Monitoring Plan

July 2018 Revised Final (100 Percent) Design Report Page 1-1
SECTION 1 INTRODUCTION
This Final (100 Percent) Design (Final Design) has been prepared as part of the remedial design
phase for implementation of the remedial action set forth in the Record of Decision (ROD) for the
Lockheed West Seattle Superfund Site (Site; USEPA, 2013) and in the associated Explanation of
Significant Differences (ESD; USEPA, 2015a). This Final Design is required by Section IV.B of
the Statement of Work (SOW), Appendix B to the Unilateral Administrative Order (UAO) (United
States Environmental Protection Agency [USEPA] Docket No. 10-2015-0079/Comprehensive
Environmental Response, Compensation, and Liability Act [CERCLA]) for the Remedial Design
and Remedial Action for the Site (USEPA, 2015b) (Figure 1).
This Final Design is submitted on behalf of the Lockheed Martin Corporation (Lockheed Martin).
The UAO, the ROD and associated ESD, and the USEPA Superfund Remedial Design and
Remedial Action Guidance (Office of Solid Waste and Emergency Response [OSWER] Directive
9355.0-4A) were followed to prepare, and will be followed to implement, the remedial design. The
Final Design builds upon the previously submitted 90 percent design.
Lockheed Martin is conducting the remedial action as a design-build project where the contractor
is working under a single contract with Lockheed Martin to provide both design and construction.
The design-build process eliminates the need for a separate remedial design followed by a
Remedial Action Work Plan since the designers are implementing the construction.
1.1 SITE BACKGROUND
The Site was placed on the National Priorities List on March 7, 2007. Prior to this date, the Site
was listed as a sediment cleanup priority project under State of Washington authority through the
requirements of the Model Toxics Control Act (MTCA). Lockheed Martin submitted the Final
Remedial Investigation/Feasibility Study for the Lockheed West Seattle Superfund Site to USEPA
Region 10 in May 2012 (RI/FS; Tetra Tech, 2012). The RI/FS concluded that sediments within
the Site contained elevated levels of a number of hazardous contaminants. Analytical data from

July 2018 Revised Final (100 Percent) Design Report Page 1-2
surface and subsurface sediment samples indicate that metals, polychlorinated biphenyls (PCBs),
tributyltin (TBT), and polycyclic aromatic hydrocarbons (PAHs) are the most frequently detected
compounds in the study area. Dioxins and furans also were identified as contaminants of concern
(COCs) based on their assumed presence at the Site.
On August 28, 2013, USEPA issued the ROD for the Site based on the area identified in the RI/FS
that warranted remedial action. The ROD presented a Selected Remedy (Figure 2) to address
unacceptable human health risks associated with seafood consumption, net fishing, clamming, and
beach play, as well as ecological risks posed to benthic invertebrates, fish, and birds. The USEPA
Selected Remedy is described in detail in Section 1.3. The cleanup under this ROD represents the
final remedial action for the Site.
In February 2015, USEPA issued an ESD to correct errors in Tables 12 and 23 of the ROD that
set forth Cleanup Levels. The ESD replaced the tables and described the differences between the
ROD and the final details for COC Cleanup Levels.
On April 2, 2015, USEPA issued the UAO for Remedial Design and Remedial Action,
documenting Lockheed Martin’s responsibility for cleanup of the Site. The SOW, attached as
Appendix B to the UAO, defines the work to be accomplished in the remedial design and remedial
action. The final plans and specifications, general provisions, and special requirements necessary
to implement the ROD are developed in the remedial design. The remedial action, the
implementation phase of the ROD, including necessary long-term monitoring and maintenance,
performance monitoring, and implementation of special requirements such as institutional
controls, will be based on the approved remedial design. Lockheed Martin does not currently own,
lease, or otherwise control any of this property as per the 1992 agreement with the Port of Seattle
(Port) (when the property was purchased by the Port from Lockheed Martin), but is responsible to
perform the work described in the UAO.
To support the design for the USEPA Selected Remedy, Lockheed Martin performed a pre-design
field investigation of surface and subsurface sediment, a geotechnical investigation in upland and
offshore areas, structural evaluations, and additional bathymetric and debris surveys in November
2015 and January 2016. The complete report of this investigation can be found in the Pre-Remedial
Design Field Sampling Data Report (Tetra Tech, 2016). The results of this pre-design investigation

July 2018 Revised Final (100 Percent) Design Report Page 1-3
are used to refine the Selected Remedy, as discussed in Section 1.3, and were utilized in
development of this Final Design. Previous site investigations and the most recent design field
investigations are summarized in Section 3.
1.2 LOCKHEED WEST SEATTLE AREA
The Site is located near the confluence of the West Waterway and Elliott Bay, in Seattle,
Washington (Figure 1). The Site is bordered by Elliott Bay on the north, the Harbor Island West
Waterway Operable Unit on the east, Pacific Sound Resources (PSR) Marine Sediment Unit on
the west, and the Port of Seattle (Port) Terminal 5 to the south. The Site includes the in-water
marine sediments where the former Lockheed Shipyard No. 2 was located (the shipway and dry
docks were located in the water over the sediments). The Site also includes a narrow shoreline
intertidal bank (exposed by low tides) defined for this site as areas extending from plus [+]11.3 feet
mean higher high water (MHHW) to minus [-]10 feet mean lower low water (MLLW) along the
northern and eastern shorelines, as well as subtidal sediments (never exposed by low tides) that
extend to -40 to -50 feet MLLW in historically dredged areas. The Site is impacted by tides, with
additional influence from the Lower Duwamish Waterway (LDW), which flows into the West
Waterway. In addition, numerous pilings remain within the footprint of the former shipway, and
pier structures remain along the northern shoreline and in the northwestern portion of the Site.
In total, the Site encompasses 40 acres of aquatic lands, including approximately 33 acres of state-
owned aquatic lands managed by the Washington State Department of Natural Resources (DNR)
and 7 acres of Port-owned aquatic tidelands. The Site and adjacent aquatic areas are designated as
Tribal Usual and Accustomed (U&A) Fishing Areas. The bank and intertidal portions of the Site
are accessible from the water. Access via land is currently restricted due to security fencing around
Terminal 5.
The Site is located in a historically industrialized and commercial area of Seattle. There are several
nearby environmental cleanup projects in the vicinity (Figure 1). The primary land uses near the
Site have been industrial and maritime for over a century. The adjoining area of the West
Waterway includes a federally maintained navigation channel and numerous privately maintained
berthing areas.

July 2018 Revised Final (100 Percent) Design Report Page 1-4
1.3 DESCRIPTION OF REMEDIAL ACTION
In the Lockheed West ROD, USEPA selected a remedy comprising four key elements to address
contaminated sediments at the Site (Figure 2):
1. Removal and disposal of identified debris in shorelines and pilings in the former shipway
2. Sediment remedial action, including sediment removal and disposal, intertidal backfill placement, and residuals management and enhanced natural recovery (ENR) layer placement
3. Institutional controls
4. Long-term monitoring and maintenance
Source control activities were completed previously by others under a separate Order with the
Washington State Department of Ecology (Ecology) and are not part of the USEPA Selected
Remedy. The UAO does not require prevention of releases of hazardous substances originating
outside the boundaries of the Site and not attributable to Site conditions (i.e., recontamination from
off-site sources, as defined in the UAO). The expected outcome of the Selected Remedy is removal
of the most highly contaminated sediments at the Site with concentrations of total PCBs, arsenic,
copper, lead, mercury, carcinogenic polycyclic aromatic hydrocarbons (cPAHs), TBT, and all
other COCs that exceed the Cleanup Levels associated with the Site remedial action objectives
(RAOs; see Section 2.1). Residual risks from the removal actions for these and other COCs would
be mitigated through placement of a 6- to 9-inch layer of clean imported material and use of
institutional controls (ICs).
Sediment remedial action boundaries in the USEPA Selected Remedy have been refined based on
the pre-design field investigation results (Figure 3). An evaluation of the results for sediment
samples collected from the former shipway area during the pre-design investigation found that
PAH contamination at depth is similar to the PAH contamination in sediment samples collected
from the Pacific Sound Resources (PSR) site, indicating that the source of the deeper PAH
contamination in the former shipway area is likely from the adjacent PSR site. Therefore, the
dredging removal depth was determined based on the clean interval above the PAHs found at
depth, thereby leaving the contamination associated with PSR in place. Further discussion of this
refinement and other design refinements is provided in Section 3.6 and in Appendix A, where pre-
design chemistry data and the extent of dredge verification are discussed.

July 2018 Revised Final (100 Percent) Design Report Page 1-5
1.3.1 Design Coordination with the Port
Lockheed Martin is coordinating design and implementation of the remedial action with the Port.
The Port has initiated two projects at the Site. The first project is the T-5 Pile Removal and
Disposal project, which includes: the removal of existing pilings from Piers 23 and 24; removal of
pilings and decking from Piers 25 and 26; and removal of pilings from the former shipway area
between the Inner and Outer Harbor lines. The pilings are to be removed per the lease termination
agreement with DNR, the current manager of the state-owned aquatic lands in this portion of the
Site. The Port’s pile removal project started in fall 2017 and likely will be completed by the middle
of February 2018. This Port project is significant for the design in areas of the Site where the
remedy includes dredging contaminated sediment in the former shipway and placement of an ENR
sand layer over the footprint of Piers 23 and 24. Lockheed Martin’s plans for pile removal within
the shipway are intended to match the area over which the Port will remove pilings. Lockheed
Martin will continue communications with the Port to ensure there is neither an overlap nor a gap
in the shipway areas over which pilings are removed.
The other Port project is modernization of the existing marine cargo facilities at Terminal 5, which
consists of vessel berth deepening, dock and power upgrades, and upland improvements to serve
large cargo vessels. Contingent on city, state, and federal authorizations and approvals of the
project, the anticipated start for construction is mid-2019, with completion expected by 2021.
Upland/landside construction elements would continue throughout this time period while the
proposed in-water wharf improvements would be limited to three consecutive in-water work
seasons to protect endangered species. Lockheed Martin has determined that the location of the
Terminal 5 improvement project does not geographically overlap the remedial action. Lockheed
Martin will continue to track progress of the Terminal 5 project through regular communications
with the Port.
Another major project in progress is the United States Army Corps of Engineers (USACE) Seattle
District’s Seattle Harbor Navigational Improvement East and West Waterways Deepening Project.
The USACE has prepared a Draft Integrated Feasibility Report and Environmental Assessment,
which documents the process of developing potential solutions to evaluate the environmental
impact of deepening the East and West Waterways of the Seattle Harbor (USACE, 2016). The
federal navigation channel of the West Waterway is proposed to be deepened to -57 feet MLLW
July 2018 Revised Final (100 Percent) Design Report Page 1-6
from existing authorized depths of -34 feet MLLW to accommodate the largest ships anticipated
at the Port. The schedule for project implementation is dependent on project authorization and
appropriation of federal construction funds, for which a timeline has not been defined in the
feasibility study (USACE, 2016). Refer to Section 3.1.2 for further discussion of the Port’s T-5
improvement project and the USACE’s Seattle Harbor Navigation Improvement Project.
1.3.2 Design Coordination with Other Cleanup Actions
Port Terminal 5, the primary port facility in the West Waterway, is a 182-acre container terminal
located along the west side of the West Waterway at the mouth of the Duwamish River. Currently,
the Port is modernizing the existing marine cargo facilities at Terminal 5, which consists of vessel
berth deepening, dock and power upgrades, and upland improvements to serve large cargo vessels.
This terminal includes two berths with an overall length of 2,900 feet. Berths currently vary in
depth from -45 to -50 feet MLLW and would be deepened to -57 feet MLLW as part of the planned
modernization. The Port’s current berth-deepening activities do not include any portion of the Site.
A variety of commercial and recreational vessels transit and operate within the West Waterway
navigation channel, including containers, tankers, and breakbulk cargo ships; tugboats moving
alone or with barges/derricks; fishing vessels; bulk cargo vessels; recreational vessels, such as
kayaks, sailboats, and motor yachts; and miscellaneous vessels, such as fireboats, passenger boats,
and research vessels. Additional details are provided in the Section 408 Substantive Compliance
Memorandum (Appendix B).
Other cleanup actions in the vicinity of the Site include Lower Duwamish Waterway (LDW)
activities. USEPA is currently overseeing the remedial design activities on the Lower Duwamish
Waterway Superfund site, along with related remedial activities at Early Action sites in the LDW.
Lockheed West Seattle remediation work will be coordinated with other LDW projects to the
extent applicable. Another adjacent remediation site is the PSR project to the west, where USEPA
is currently performing long-term monitoring. During the implementation stage, coordination will
be needed with other ongoing cleanup work activities, likely to include general navigation, barge
traffic, and transloading facility use.

July 2018 Revised Final (100 Percent) Design Report Page 1-7
1.3.3 Roles and Responsibilities
Lockheed Martin is responsible for completion of the design and implementation of the project
per the UAO. The management roles and responsibilities for the Site cleanup implementation are
defined in the Construction Quality Management Plan (Appendix C) and the Construction Quality
Assurance Plan (CQAP; Appendix D).
1.3.4 Design Coordination with Tribal Fishing
Lockheed Martin has met with the Muckleshoot Tribe to coordinate construction activities to
reduce impacts of construction on Muckleshoot Tribal fishers. In meetings with the Muckleshoot
Tribe, Lockheed Martin has presented the scope and anticipated timing of construction activities
and has made a commitment that no construction activities will be conducted during the Chinook
salmon fishery. Lockheed Martin expects to have met with and reached agreement with both the
Muckleshoot and Suquamish Tribes regarding coordination of Tribal fishing prior to remedial
construction.
During construction, it is anticipated that daily communications with affected Tribes will be
conducted to coordinate the transit of sediment barges to the disposal facilities.
1.4 REPORT ORGANIZATION
The project includes the following actions based on the key elements of the USEPA Selected
Remedy and as defined in the USEPA (2013) ROD.
Design and construct shoreline bank and intertidal sediment remedial actions: Identify debris, failing bulkheads, and pile removal; dredge sediment to the remedial action levels (RAL); and backfill to grade with clean sediment material that promotes colonization by aquatic organisms which may incorporate soft or organic-rich substrates beneficial to salmonids and other Site-specific aquatic organisms (e.g., “fish mix”' or a silt-sand mix).
Design and construct subtidal sediment remedial actions: Removal of subtidal sediment to the RALs, disposal and placement of a 6-inch dredge residuals management layer (RML) in dredged areas, and placement of an ENR layer in remaining subtidal areas.
Handle/transport/dispose of dredged sediments to an upland disposal facility that is consistent with the nature and concentrations of the contaminants found in the materials to be disposed of.
Perform construction monitoring and long-term monitoring.

July 2018 Revised Final (100 Percent) Design Report Page 1-8
The remedial design basis, details, and discussions of the project elements are presented in the
remainder of this document, which is organized into the following sections:
Section 2—Regulatory Requirements
Section 3—Site Conditions
Section 4—Debris and Pile Removal and Disposal
Section 5—Sediment Removal and Disposal
Section 6—Backfill, Residual Management Layer, and Enhanced Natural Recovery Layer
Placement
Section 7—Short-Term Environmental Control Measures
Section 8—Project Permitting and Site Access
Section 9—Construction Schedule, Sequence, and Cost Estimate
Section 10—Institutional Controls
Section 11—Long-Term Monitoring and Maintenance
Section 12—Environmental Sustainability
Section 13—References
This document is also supported by the following appendices:
Appendix A—Pre-Design Chemistry Data Summary and Dredge Extent Verification
Appendix B—Section 408 Substantive Compliance Memorandum
Appendix C—Construction Quality Management Plan
Appendix D—Construction Quality Assurance Plan
Appendix E—Design Drawings
Appendix F—Biological Assessment
Appendix G—Archaeological Work, Monitoring, and Inadvertent Discovery Plan

July 2018 Revised Final (100 Percent) Design Report Page 1-9
Appendix H—Basis of Design Calculations
Appendix I—Debris/Pile Removal Support System Plan
Appendix J—Best Management Practices
Appendix K—Site Management Plan (includes Contingency Plan, Pollution Control Plan,
Transportation and Disposal Plan, Green and Sustainable Remediation Plan, and Climate Change
Adaptation Plan)
Appendix L—Excavation, Dredging, and Backfill Plan
Appendix M—Water Quality Monitoring Plan
Appendix N—Dewatering Plan
Appendix O—Construction Water Management Plan
Appendix P—Field Sampling Plan, Construction and Post-Construction Sediment Monitoring
Quality Assurance Project Plan, and Site-Specific Health & Safety Plan
Appendix Q—Survey Plan
Appendix R—Specifications
Appendix S—Erosion and Sedimentation Control Plan
Appendix T—Permitting and Site Access Plan
Appendix U—Vessel Management Plan
Appendix V—Project Implementation Schedule
Appendix W—Equipment Decontamination Plan
Appendix X—Capital and Operation and Maintenance Cost Estimate
Appendix Y—Institutional Control Implementation and Assurance Plan

July 2018 Revised Final (100 Percent) Design Report Page 1-10
Appendix Z—Long-Term Monitoring and Maintenance Plan

July 2018 Revised Final (100 Percent) Design Report Page 2-1
SECTION 2 REGULATORY REQUIREMENTS
Implementation of the remedial design, as described in the Record of Decision (ROD),
Explanation of Significant Differences (ESD), and Unilateral Administrative Order (UAO) Scope
of Work (SOW), will be conducted in accordance with the Comprehensive Environmental
Response, Compensation, and Liability Act (CERCLA) United States Code [U.S.C.] 9601-96, as
amended, and, to the extent practicable, the National Contingency Plan (NCP), and the
Administrative Record for the Lockheed West Seattle Superfund Site (Site).
Section 121(d) of CERCLA requires selection of a remedial action that is protective of human
health and the environment. The United States Environmental Protection Agency’s (USEPA)
approach to determining protectiveness involves risk assessment, considering applicable or
relevant and appropriate requirements (ARARs), and to-be-considered criteria (TBCs). This
section presents a description of the cleanup objectives, a brief description of the ARARs identified
in Section 2.10.4 of the ROD, as well as TBCs for the Site. ARARs are derived from promulgated
federal standards, or more stringent promulgated state standards. The identification of ARARs was
an iterative process and was considered complete with preparation of the ROD.
The ROD selected a combination of sediment remedial actions, including dredging and disposal,
backfill of intertidal removal areas, residuals management, enhanced natural recovery (ENR) layer
placement, removal of debris and pilings, institutional controls, and long-term monitoring and
maintenance as the remedy for achieving the Site cleanup objectives. Source control activities in
the upland Terminal 5 area were completed previously by others under a separate order with the
Washington State Department of Ecology (Ecology) and are not part of the selected remedy. The
UAO does not require additional source control activities or the prevention of releases of
hazardous substances originating outside the boundaries of the Site and that are not attributable to
Lockheed Martin (e.g., potential releases from nearby sources). See Section 11 for additional
discussion of long-term monitoring and maintenance requirements after the remediation is
completed.

July 2018 Revised Final (100 Percent) Design Report Page 2-2
The Selected Remedy will meet the ARARs, as described further below. However, a technical
impracticability (TI) waiver of the Federal ambient water quality criteria (AWQC) for arsenic is
part of the Selected Remedy because it is technically impracticable for remediation of
contaminated sediments at the Site to measurably improve the overall water quality for arsenic
within the larger Elliott Bay. If it is determined that surface water exceeding AWQC
concentrations is within the site boundaries after the remedial actions are completed, a TI waiver
of the AWQC for other contaminants may also be necessary and will be discussed with USEPA
and Ecology.
Following implementation of the Selected Remedy, the Site would be suitable for its current and
anticipated future use, which includes a navigation channel. However, due to potential ongoing
presence of other contaminant sources throughout Elliott Bay, the Site will not be suitable for
unrestricted consumption of fish and will continue to be subject to the existing Elliott Bay-wide
fish consumption advisory.
2.1 CLEANUP OBJECTIVES
The ROD defined the following Remedial Action Objectives (RAOs) to address the risks posed to
human health and the environment:
Human Health Risks:
RAO 1: Reduce human health risks associated with the consumption of resident seafood by adults and children with the highest potential exposure.
RAO 2: Prevent human health risks from direct exposure (skin contact and incidental ingestion) to contaminated sediments during net fishing, clamming, and beach play.
Ecological Risks:
RAO 3: Prevent risks to benthic invertebrates from exposure to contaminated sediments.
RAO 4: Prevent risks to crabs, fish, and birds from exposure to contaminated sediments.
The ROD and associated ESD set Cleanup Levels for contaminants of concern (COCs). These
levels represent Site-specific concentration limits to be achieved at the sediment surface (i.e., upper
10 centimeters [cm] in subtidal zone, upper 45 cm in intertidal zone) after dredging or excavation

July 2018 Revised Final (100 Percent) Design Report Page 2-3
and placement of the dredge residual management/ENR layers or intertidal backfill, and provide
the basis for meeting the RAOs. The Cleanup Levels for demonstrating compliance are listed in
Table 1.
The RAOs are met in the following ways:
Human Health Risks:
RAO 1 is met when Site-wide average concentrations of COCs in the upper 45 cm of intertidal sediment and in the upper 10 cm of subtidal sediment do not exceed Cleanup Levels that are based on human consumption of seafood caught or gathered at the Site.
RAO 2 is met when Site-wide average concentrations of COCs in the upper 45 cm of intertidal sediment and in the upper 10 cm of subtidal sediment do not exceed the Cleanup Levels that are based on direct contact with sediment during net fishing, Tribal clamming, or beach play.
Ecological Risks:
RAO 3 is met when point-by-point concentrations of COCs in the upper 10 cm of intertidal and subtidal sediments do not exceed Cleanup Levels that are based on protection of benthic invertebrates (Sediment Quality Standards [SQS]1 values).
RAO 4 is met when Site-wide average concentrations of COCs in the upper 10 cm of intertidal and subtidal sediments do not exceed Cleanup Levels that are based on protection of crabs, fish, and birds.
In addition to the Cleanup Levels, construction performance standards for the Site cleanup include
the following:
Remedial Action Levels (RAL)—Contaminant concentrations that, when exceeded, trigger removal of sediment. Contaminant concentrations at the bottom of the dredge prism after dredging or excavation is complete (as defined in the Construction Quality Assurance Plan [CQAP; Appendix D] and before placement of the dredge residual management layer (RML) or intertidal backfill must be equal to or lower than the RAL for chemicals that were identified as risk drivers. The RALs are based on the SQS and cleanup screening levels (CSLs). The RALs and locations where they will be applied are listed in Table 2.
1. ARARs were frozen at the time the ROD was signed (August 2013). Therefore, the revised (2014) Washington State Sediment Management Standards (SMS) terminology is not used at this site because it was not an ARAR at the time the ROD was signed. The CSL and SQS terminology will be used for all work related to the Site.

July 2018 Revised Final (100 Percent) Design Report Page 2-4
Construction Activity Limits—Defined limits on environmental impacts related to construction activities, including AWQC and other ARARs to be defined in the CQAP and associated documents.
2.2 KEY APPLICABLE OR RELEVANT AND APPROPRIATE REQUIREMENTS (ARARS)
Remedial design sampling and analysis evaluations and remedial design construction drawings
and specifications conducted under this SOW must provide sufficient data to ensure that the
requirements of several different regulatory programs are met. As identified in the ROD, the
requirements of the key programs in relation to remedial action for the Site are as follows:
Washington State Model Toxics Control Act (MTCA) (Revised Code of Washington [RCW] 70.105D; Washington Administrative Code [WAC] 173-340): MTCA is applicable or relevant where the substantive requirements are more stringent than CERCLA and the NCP. The more stringent requirements of MTCA include, but are not limited to, acceptable excess cancer risk standards and the default to natural background for final remedies where risk-based threshold concentrations are below background.
Sediment Management Standards (SMS) (WAC 173-204): The SMS are a statutory requirement under MTCA and applicable or relevant and appropriate under CERCLA. The SMS set numerical standards for the protection of benthic marine invertebrates. The Selected Remedy will meet requirements of the SMS. SQS of the SMS are the standard for protection of benthic invertebrates.
Clean Water Act, Section 304(a) (40 Code of Federal Regulations [CFR] 131): Federally recommended Water Quality Criteria that are more stringent than state criteria and that are relevant and appropriate apply to the Site. As noted above, the Selected Remedy includes a TI waiver for the AWQC for arsenic.
Endangered Species Act of 1973 (ESA; 50 CFR 17, 222-224, 226.212 to 402): To protect threatened species under the ESA, including Puget Sound Chinook salmon, environmental windows (or “fish windows”) have been established for Elliott Bay. These are designated periods, generally from October through February, when effects of in-water construction are minimized, largely because juvenile salmon are not migrating through the area. As part of remedial action implementation, USEPA will consult with the National Oceanic and Atmospheric Administration, National Marine Fisheries Service (NOAA-Fisheries), and the United States Fish and Wildlife Service to obtain a Biological Opinion.
2.3 OTHER ARARS
Other ARARs identified in the ROD may impose requirements on the remedial design in addition
to those established by the key ARARs discussed above:

July 2018 Revised Final (100 Percent) Design Report Page 2-5
Washington Water Pollution Control Act—State Water Quality Standards for Surface Water (RCW 90.48; WAC 173-303): State surface water quality standards are applicable where the state has adopted, and USEPA has approved, Water Quality Standards (Aquatic Life Criteria).
Resource Conservation and Recovery Act (40 CFR 260-279), Toxic Substances Control Act (40 CFR 761.61), and Washington State Dangerous Waste Regulations (RCW 70.105; WAC 173-303): Federal and state hazardous waste management regulations, respectively. No known listed or characteristic hazardous wastes are present at the Site. However, if such wastes are encountered during Site cleanup, portions of the Resource Conservation and Recovery Act and Washington State Dangerous Waste Regulations related to hazardous waste determination and analytical testing, and on-site storage, treatment, and disposal, may be ARARs for this project. State dangerous waste is defined more broadly than Federal hazardous waste. In addition, no known Toxic Substances Control Act wastes are present at the Site. If such wastes are encountered during Site cleanup, disposal of PCBs may be applicable.
Solid Waste Disposal Act (40 CFR 257-258) and Solid Waste Handling Standards (RCW 70.95; WAC 173-350): Federal and state regulations that cover nonhazardous waste generated during remedial activities, unless wastes meet recycling exemptions.
Clean Water Act (40 CFR 121.2, 230, 231; 33 CFR 320, 322, 323), Rivers and Harbor Appropriations Act (33 United States Code [U.S.C.] 403, 33 U.S.C. 408), and Hydraulic Code Rules (RCW 77.65; WAC 220-110): Federal and state requirements for in-water dredging, filling, and other in-water construction.
Marine Protection, Research, and Sanctuaries Act (33 U.S.C. 1401-1445) and Dredged Material Management Program (RCW 79.105.500; WAC 332-30-166(3)): Federal and state regulations for dumping of dredged material in open water.
National Pollutant Discharge Elimination System (NPDES; 40 CFR 122, 125) and Discharge Permit Program (RCW 90.48; WAC 173-216, 220, 226): Federal and state point source standards for new discharges to surface water. Remediation discharges must comply with the substantive requirements of NPDES rules. If upland handling of sediment is planned, construction stormwater requirements will be addressed, including development of a stormwater pollution prevention plan and implementation of best management practices. NPDES program and state permitting requirements will be reviewed as part of the project final design.
Coastal Zone Management Act (16 U.S.C. 1451 et seq.) and Shoreline Management Act (WAC 173-16): These federal and state regulations are applicable to construction activities within 200 feet of the shoreline.
Clean Water Act Section 404(b)(1), Migratory Bird Treaty Act (16 U.S.C. 703-712; 50 CFR 10, 17), Eagle Protection Act (50 CFR 22); and City of Seattle Master Plan (Seattle Municipal Code 23.60): In addition to the ESA, these federal and local laws address the conservation of endangered or threatened species. USEPA will consult with the appropriate agencies to obtain Biological Opinions.

July 2018 Revised Final (100 Percent) Design Report Page 2-6
2.4 STATE LAWS AND REGULATIONS (TBCs)
Other requirements to be considered include the following:
Washington Industrial Safety and Health Act: The Washington Industrial Safety and Health Act (WISHA; WAC 296‐155) sets safety standards for construction. This code specifies health and safety standards for responding to releases or substantial threats of release of hazardous substances at hazardous waste sites. WISHA requirements are generally more stringent than United States Occupational Safety and Health Administration (OSHA) requirements. All cleanup activities will adhere to WISHA standards. Detailed health and safety training requirements, and details on how the Contractor will comply with WISHA standards, will be included in the Construction Health and Safety Plan (HASP).
Solid Waste Disposal Regulations: Minimum Functional Standards for Solid Waste Handling (WAC 173‐304) are applicable to non‐hazardous waste management generated during remedial activities. Non‐hazardous sediment will be handled and disposed in accordance with these requirements. The cleanup will use existing permitted disposal and recycling facilities that are compliant with the solid waste disposal regulations and are permitted to accept impacted materials.
State Environmental Policy Act: The State Environmental Policy Act (SEPA; RCW 43.21C and related rules, WAC 197‐11), require an environmental review of proposed project actions, such as construction projects or adoptions of agency plans, that may affect the environment. The purpose of SEPA is to fully and publicly disclose potential impacts, provide opportunity for public input, and ensure potential impacts are considered in decision‐making. National Environmental Policy Act documents and procedures may be used to comply with SEPA requirements. The substantive requirements of SEPA are met by the CERCLA process.
Water Pollution Control Act: The Water Pollution Control Act (RCW 90.48) establishes permitting requirements for point source discharges to surface waters of Washington State. It includes narrative and quantitative limitations for compliance with surface water standards. The Water Quality Monitoring Plan (Appendix M) defines measures to be taken to comply with surface water standards and with requirements of the water quality criteria.
Hydraulic Code Regulations; Construction in State Waters: Regulations governing construction in State waters below the ordinary high-water mark are established by RCW 77.55, Construction Projects in State Waters, and by the Hydraulic Code rules, WAC 220‐110. These regulations provide for protection of fish and shellfish during in‐water construction. The substantive requirements of the regulations will be confirmed through consultation with the state Department of Fish and Wildlife and will be incorporated in planning and design of the cleanup. The requirements will also be addressed by the conservation measures and best management practices (BMPs) identified in Appendix J and the Biological Assessment (Appendix F) prepared as part of ESA Section 7 Consultation with the appropriate agencies.

July 2018 Revised Final (100 Percent) Design Report Page 2-7
Shoreline Management Act: The Shoreline Management Act (RCW 90.58 and related rules) manages appropriate uses and developments along shorelines of the state via state‐monitored, locally administered permitting programs (see additional discussion in Section 2.5.2 related to the King County Shoreline Master Program [SMP]). The act establishes preferences for water‐dependent uses, protection of shoreline ecological resources, and public access with the shoreline jurisdiction, defined as aquatic areas and lands within 200 feet of the ordinary high-water mark. Consistent with state Enrolled Senate Bill 1653, shoreline critical areas are regulated under the local Shoreline Master Program regulations.
2.5 LOCAL CODES AND REGULATIONS (TBCs)
2.5.1 Air Quality Requirements
Air quality requirements for workers are governed by OSHA, and ambient air quality requirements
for the Puget Sound region are governed by the Puget Sound Clean Air Agency (PSCAA). PSCAA
Regulation I includes criteria for visual emissions, suspended particulates less than 10 microns in
diameter, lead, and carbon monoxide. Air monitoring will be conducted to maintain worker and
community health and safety as required by OSHA and as specified in the project HASP (to be
developed at later stages of the project).
2.5.2 King County Code
King County’s SMP (King County Code [KCC] Title 25) manages construction and uses within
the shoreline district. The Site is designated as aquatic shoreline in King County’s updated SMP
dated January 2013. Cleanup activities along the shoreline will be in substantive compliance with
these policies and regulations through the use of dredging, water quality, and erosion control
BMPs; measures to protect fish, marine mammals, and other aquatic species; and implementation
of both worker and community health and safety plans. Under the SMP (KCC 21A.25.190),
dredging and backfilling associated with cleanup actions are allowed. Shoreline stabilization
where the project is remediating a contaminated site is allowed under KCC 21A.25.170.
Potential public access requirements of the SMP are not applicable because the cleanup project
does not establish a new/future public use of the site.
The King County Clearing and Grading Code (KCC 16.82) regulates excavation, grading, and
earthwork within unincorporated King County, as well as stormwater, erosion and sedimentation,
and aquatic habitat impacts/loss. It also protects water quality from adverse impacts associated

July 2018 Revised Final (100 Percent) Design Report Page 2-8
with erosion and sedimentation and critical areas from adverse clearing and grading activities. The
Erosion and Sedimentation Control Plan (Appendix S) defines measures that provide substantive
compliance with these regulations. A summary of temporary erosion and sediment control
measures is provided in Section 7.
King County Noise Code (KCC Title 12.88) governs construction through the timing restrictions
and the noise limits included in the King County noise code requirements (KCC, Chapter 12.88).
This rule defines maximum permissible sound levels based on the zoning of the source. Note that
receiving properties adjacent to the site are within the city of Seattle and would be subject to limits
established in the Seattle Municipal Code (SMC).
The substantive requirements of applicable county regulations have been incorporated in the
planning and design of the cleanup.
2.5.3 Seattle Municipal Code
The City of Seattle Land Use Code (SMC, Title 23) provides codes and standards applicable to
shoreline modifications, specifically within the Seattle Shoreline Master Program Regulations
(SMC Title 23, Chapter 23.60A). Within the Seattle Shoreline Master Program Regulations,
standards applicable to shoreline modification are given within SMC 23.60A, Subchapter III,
Part 4 (Standards Applicable to Shoreline Modifications), 23.60A.172 (Applicable Standards for
Shoreline Modifications).
Standards for dredging are described in SMC 23.60A.182. This section requires that the dredging
operations be designed, located, constructed, and managed to minimize impacts to stability of
slopes on and off the site. SMC 22.170 (Grading Code) requires final graded slopes no steeper
than is safe for the intended use, not steeper than 2 horizontal to 1 vertical; and designing and
constructing the dredged slopes in a manner that will minimize erosion. Cleanup activities along
the shoreline will be in substantive compliance with these policies and regulations.
SMC, Chapter 25.08, restricts maximum permissible sound levels for sound sources located within
the city of Seattle. Note that the receiving property (Port) adjacent to the Site is within the city of
Seattle and would be subject to limits established in the SMC. In addition, the noise‐producing
activity is Construction, as defined by the SMC. Using these assumptions, and based on the

July 2018 Revised Final (100 Percent) Design Report Page 2-9
applicable codes, the maximum permissible sound level for the industrial area is 90 A-weighted
decibels [dB(A)] for industrial noise generation between the hours of 7:00 a.m. and 10:00 p.m. on
weekdays and 9:00 a.m. and 10:00 p.m. on weekends and legal holidays (New Year’s Day,
Memorial Day, Independence Day, Labor Day, Thanksgiving Day and the day after, and Christmas
Day). The maximum permissible sound levels are measured within 50 feet of the equipment.
Specific permissible sound levels associated with various equipment used on construction sites are
described in SMC 25.08.425. Between the hours of 10 p.m. and 7 a.m. during weekdays, and
between the hours of 10 p.m. and 9 a.m. on weekends and legal holidays, the exterior sound level
limits are reduced by 10 dB(A) where the receiving property lies within a residential district of the
City.
Based on the current use classifications for the Site area (heavy industrial or marine industrial),
there are currently no hours of work restriction, and construction activities are assumed to be
allowed 24 hours per day, 7 days per week. Lights may be required for winter work when the sun
sets around 5:00 p.m. Per SMC 23.50.046, performance standards for this project for acceptable
light emissions for receiving properties is 1.0-foot candle as specified for commercial/industrial
areas.

July 2018 Revised Final (100 Percent) Design Report Page 3-1
SECTION 3 SITE CONDITIONS
This section presents information on the background and environmental setting of the Lockheed
West Seattle Superfund Site (Site) and surrounding area. This section also presents a summary of
the existing data for the Site.
3.1 SITE DESCRIPTION, OWNERSHIP, AND USE
The Site encompasses the in-water portion of what was formerly known as Lockheed Shipyard
No. 2, located near the confluence of the West Waterway and Elliott Bay, in the city of Seattle,
Washington (Figure 1).
The Site includes the in-water marine sediments where the former Lockheed Shipyard No. 2 was
located (the shipway and dry docks were located in the water over the sediments). The Site includes
a narrow shoreline bank and intertidal sediments along the northern and eastern shorelines and
subtidal sediments that extend from -40 to -50 feet mean lower low water (MLLW) in historically
dredged areas. It is impacted by tides, with additional influence from the Lower Duwamish
Waterway (LDW) that flows into the West Waterway. In addition, numerous pilings remain within
the footprint of the former shipway and pier structures in the northwestern portion of the Site.
Several other Superfund sites resulting from separate industrial operations are located near the
Site:
Pacific Sound Resources (PSR) Superfund Site borders the Site on the west
Harbor Island Superfund Site, including the following:
Todd Shipyard (currently known as Vigor Shipyard) Sediment Operable Unit on the east side of the West Waterway and northwest side of Harbor Island
Lockheed Shipyard No. 1 Sediment Operable Unit on the west side of Harbor Island along the West Waterway
West Waterway Operable Unit

July 2018 Revised Final (100 Percent) Design Report Page 3-2
East Waterway Operable Unit
LDW Superfund Site, which flows into the West and East Waterways of Harbor Island and into Elliott Bay
In addition to these Superfund sites, the Washington State Department of Ecology (Ecology)
issued state Model Toxics Control Act (MTCA) cleanup orders for the remediation of four areas
(Remediation Area [RA] 1, RA-2, RA-3, and RA-5) located in the Terminal 5 upland area adjacent
to the Site. There is also one upland area (RA-4) associated with the PSR Superfund site. The
predominant cleanup action applied to these upland remediation areas was capping to keep soil
contamination in place and prevent surface water infiltration into the underlying groundwater and
contaminated subsurface soil.
The 40-acre Site includes approximately 33 acres of state-owned aquatic lands and 7 acres of
aquatic tidelands owned by the Port of Seattle (Port), as shown by the color-shaded areas on
Figure 4. The Port-owned tidelands and Port-managed harbor areas are adjacent to the Port’s
Terminal 5 facility upland operations, which include container transfer and handling associated
with marine terminal operations.2 The state-owned aquatic lands include:
18 acres of State Harbor Area in Elliott Bay (harbor area managed by the Washington State Department of Natural Resources [DNR])
8 acres of State Harbor Area managed by the Port under a Port Management Agreement, of which approximately 3 acres are located within the harbor area north of the Site, and 5 acres of harbor area are located east of the Site (Port-managed harbor area)
7 acres of State Waterway in the West Waterway (DNR-managed waterway). The United States Army Corps of Engineers (USACE) has jurisdiction for maintaining the West
2. The Site overlaps the West Waterway, a federal navigation channel and a regulated navigation area (RNA) for the sediment cap associated with the Pacific Sound Resources Marine Sediment Unit adjacent to the former shipway. An RNA is a water area within a defined boundary for which regulations for vessels navigating within the area are established under 33 Code of Federal Regulations (CFR) Section 165.1336 (b). (1) All vessels and persons are prohibited from activities that would disturb the seabed, such as anchoring, dragging, trawling, spudding, or other activities that involve disrupting the integrity of the sediment caps installed in the designated regulated navigation area, pursuant to the remediation efforts of the U.S. Environmental Protection Agency (USEPA) and others in the Pacific Sound Resources and Lockheed Shipyard USEPA superfund sites. Vessels may otherwise transit or navigate within this area without reservation. (2) The prohibition described in paragraph (b)(1) of this section does not apply to vessels or persons engaged in activities associated with remediation efforts in the superfund sites, provided that the Captain of the Port, Puget Sound (COTP), is given advance notice of those activities by USEPA.

July 2018 Revised Final (100 Percent) Design Report Page 3-3
Waterway navigation channel, currently authorized to -34 feet MLLW, which is coincident with the state-platted West Waterway.
3.1.1 Current Site Use
It is anticipated by the Port that container ships will not be off-loaded at this location until 2021.
Occasionally, barges are temporarily moored along the existing pier structures using tug boats. In
addition, non-commercial vessel traffic, such as recreational boats, may pass through the Site.
Commercial vessels operating in the vicinity of the Site are controlled by the United States Coast
Guard and are required to use the established navigational channels and berth approaches.
The Site and adjacent aquatic areas are designated as Tribal Usual and Accustomed (U&A) Fishing
Areas of both the Suquamish and Muckleshoot Indian Tribes. The bank and intertidal portions of
the Site are accessible from the water. Access via land is currently restricted due to security fencing
around Terminal 5.
The current fish advisory for Puget Sound Marine Recreational Area 10 (Elliott Bay) includes no
rockfish consumption and no more than two meals per month of flatfish (Washington State
Department of Health, 2015). The Site is not a major recreational resource compared with other
water bodies in the area, but there is Tribal U&A fishing and some recreational fishing in the area.
3.1.2 Potential Site Future Uses
The Port envisions expanding Terminal 5 pier structures to include a multi-modal container
terminal along the West Waterway. Container ships use the navigational channel and off-load in
the West Waterway at Terminal 5. Port of Seattle and Northwest Seaport Alliance completed a
final environmental impact statement (FEIS) for the Terminal 5 Cargo Wharf Rehabilitation, Berth
Deepening, and Improvements Project in October 2016 (Port of Seattle, 2016). Per the proposed
alternative described in the FEIS, the subtidal sediments in the existing vessel berth area adjacent
to the rehabilitated wharf would be deepened by underwater dredging to a Project depth of -55 feet
MLLW from the current authorized depth of -34 feet MLLW. An additional 1 foot of advanced
maintenance dredge would be completed beyond the project depth in critical and shoaling areas to
avoid frequent redredging. The required project grade is, therefore, -57 feet MLLW. It is also
anticipated that up to an additional 2 feet of allowable overdepth would be dredged, resulting in a
maximum depth of -59 feet MLLW.

July 2018 Revised Final (100 Percent) Design Report Page 3-4
In 2010 and 2011, the Port requested authorization under the Waterway Resource Development
Act to revise the navigation channel from its current authorization (-34 feet MLLW) to deeper
depths. The Port described potential future development in letters to the United States
Environmental Protection Agency (USEPA) in November 2010, May 2011, and September 2011.
The USACE initiated the Seattle Harbor Navigation Improvement Project in response to this
request. The current preferred alternative related to this project is deepening both the West
Waterway and East Waterway to -57 feet MLLW. The Draft Integrated Feasibility Report and
Environmental Assessment was completed in 2016 (USACE, 2016). The remediation activities to
be conducted at the Site would not impact these future improvement projects at and adjacent to the
Site. The location of the Terminal 5 improvement project does not overlap with the remedial
action. Per the Record of Decision (ROD), the portion of the Site within the navigational channel
will be dredged to the Sediment Quality Standards (SQS) remedial action level (RAL). The vertical
extent of contamination above the Cleanup Level is up to an elevation of approximately -52 feet
MLLW. Refer to Section 3.6 for sediment chemical characteristics and Appendix E for 90 percent
design dredging plans. Also see Section 1.3.1 for discussion of design coordination.
In addition, the Tribes have treaty rights for unimpeded/unrestricted fishing, clamming, and access
to the Site. As the aquatic lands manager, DNR is also responsible for permitting water-dependent
uses at the Site.
3.2 PREVIOUS SITE INVESTIGATIONS
Since 1984, an extensive series of studies have been independently conducted by Lockheed Martin
and the Port to investigate the nature and extent of sediment contamination at the Site (Tetra Tech,
2008). Much of this information was compiled by Parametrix (1994a,b) and by Enviros (1990) to
support characterization of the Site as part of harbor development planning by the Port. Available
historical sediment quality information in the vicinity of the Site includes samples collected prior
to 1998 and in 2003 as part of a due diligence investigation (Hart Crowser, 2003a). The Site
remedial investigation fieldwork was conducted from 2006 through 2008 and is summarized in
the Remedial Investigation/Feasibility Study (RI/FS; Tetra Tech, 2012). To support the design for
the Selected Remedy, Lockheed Martin performed a pre-design investigation of surface and
subsurface sediment, a geotechnical investigation in upland and offshore areas, structural
evaluations, and additional bathymetric and debris surveys in November 2015 and January 2016.
July 2018 Revised Final (100 Percent) Design Report Page 3-5
The complete report of this investigation can be found in the Pre-Remedial Design Field Sampling
Data Report (Tetra Tech, 2016). The results of the data summarized in the RI/FS and this pre-
design investigation are used to refine the USEPA Selected Remedy.
3.3 SOURCE CONTROL
Understanding the potential sources of recontamination to the Site is important to determine
whether the Selected Remedy will likely remain protective. Historical shipyard operations at the
Site were discontinued in 1987, and there is no current ongoing source of contamination from
present uses of the Site. However, there are upland and upstream sources of contamination in the
vicinity of the Site. These potential off-site sources could represent future sources of contamination
to the Site.
Surface water and sediment conditions at the Site are influenced by the natural counterclockwise
flow of water and tidal influences in Elliott Bay. Elliott Bay is affected by nearby urbanization,
and overall concentrations of certain contaminants in bay sediments are higher than concentrations
identified as being protective of human consumption of seafood. Thus, contaminated sediment
could migrate to the Site as a result of off-site sediment transport from adjacent areas after
completion of remediation.
Based on sediment sample testing at the PSR site as well as an evaluation performed for the RI/FS
(Tetra Tech, 2012), contaminant of concern (COC) concentrations in Site sediments may reach a
long-term equilibrium level above natural background but still below Sediment Quality Standards
(SQS) concentrations in the post-construction period as a result of elevated sediment
concentrations from Elliott Bay migrating to the Site.
3.4 HABITAT AND NATURAL RESOURCES
The aquatic environment at the Site consists of estuarine waters and sediments. The shoreline
habitat is typical of the industrial shoreline in much of the Duwamish Waterway with armoring
and sheet pile bulkheads, along with broken pilings, deteriorating wooden bulkheads, and debris.
A single, small intertidal beach area of about 2 acres is present along the West Waterway between
the Terminal 5 pier and the South Florida Street Outfall. Current shoreline conditions within the
remainder of the Site boundary indicate a highly modified and impacted industrial shoreline with
little to no natural intertidal habitat.

July 2018 Revised Final (100 Percent) Design Report Page 3-6
Flora and fauna of the in-water area and shoreline include bivalves, crustaceans, and worms in the
fine sediments. Crustaceans (such as shrimp and crabs) and mollusks (clams and snails) are
typically found in coarser sediments. The Site environment also supports birds (such as sandpiper),
crabs, resident fish (such as perch, sculpin, rockfish), as well as anadromous fish (such as salmon).
Puget Sound Chinook salmon are listed as threatened under the Endangered Species Act (ESA),
as noted earlier in Section 2.2. Based on the findings of the RI/FS (Tetra Tech, 2012), critical
habitat does not appear to be present at the Site. However, as part of the Comprehensive
Environmental Response, Compensation, and Liability Act (CERCLA) process, a Biological
Assessment (Appendix F) has been prepared on behalf of USEPA, who consults with the National
Oceanic and Atmospheric Administration, National Marine Fisheries Service (NOAA-Fisheries),
and with the United States Fish and Wildlife Service to show substantive compliance.
There are no known cultural resources, such as Native American graves, sacred sites, historic sites
or structures, or archaeological resources, associated with the Site. An Archaeological Work,
Monitoring, and Inadvertent Discovery Plan for implementation during construction is provided
in Appendix G.
3.5 SITE PHYSICAL CHARACTERISTICS
The Site consists of approximately 40 acres of in-water sediments where the former Lockheed
Shipyard No. 2 was located. It is tidally affected with additional influence from the LDW, which
flows into the West Waterway. The Site is predominantly subtidal, with mudline elevations
extending from -10 feet MLLW to -40 to -50 feet MLLW in historically dredged areas. Shallower
areas are present beneath the former shipyard piers (elevations of -20 to -30 feet MLLW). The
intertidal and shoreline portions of the Site extend from mean high higher water at +11.3 feet
MLLW to -10 feet MLLW.
The Duwamish Estuary and Elliott Bay experienced extensive development and urban growth
during the 20th century. Tidal flats and marshes that once dominated the mouth of the river were
dredged and filled to form Harbor Island and the upland areas of the Site. The shoreline is densely
armored with riprap, and includes wooden bulkheads and steel sheet pile walls. The shipyard used
to have five major piers (remnants of Piers 23 and 24 and all of Pier 25 remain today), three dry
docks, and a shipway. Since closure of the shipyard, the Port has demolished Piers 21 and 22 and

July 2018 Revised Final (100 Percent) Design Report Page 3-7
removed the decking from Piers 23 and 24. Pilings for Piers 23 and 24 and the former shipway
area still exist, and the Port is required to remove pilings between the inner and outer harbor area
per the lease termination agreement with DNR, the current manager of the state-owned lands in
this portion of the Site. A narrow intertidal zone extends along the landward edge of the Site,
wrapping around the eastern and northern shoreline between the West Waterway and the PSR
Superfund site. Numerous pilings within the footprint of the former shipway and pier structures
(remnants of Piers 23 and 24) remain in the northern portion of the Site.
3.6 SEDIMENT CHEMICAL CHARACTERISTICS
Metals, polychlorinated biphenyls (PCBs), tributyltin (TBT), and polycyclic aromatic
hydrocarbons (PAHs) are the most frequently detected contaminants in sediment samples collected
from the Site. The results from the remedial investigation and pre-remedial design investigation
sampling found that the highest concentrations of contaminants in the sediment were generally
located in the area of the former dry docks and former shipway. The concentrations of
contaminants tend to decrease away from these areas toward the Site boundaries. An evaluation of
the results for sediment samples collected from borings advanced in the former shipway area
during the pre-design investigation found that PAH contamination at depth is similar to the PAH
contamination in surface and sediment core samples collected from the Pacific Sound Resources
(PSR) site, indicating likely origin of contaminants from the adjacent PSR site (Figures 5a
through 5d; see Section 3.6.3).
Data from 83 cores and 61 surface grab samples collected during the RI/FS and pre-design
investigations were used to determine the horizontal and vertical extents of contamination for the
design. Nine of the surface grab samples are in the intertidal area of the Site with all other locations
in the subtidal area of the Site. In addition, two samples were collected from the sediment
accumulated on the concrete pad of the shipway. These two cores were not used in determining
the horizontal and vertical extent of contamination across the rest of the Site because the sediment
in this area is physically separate. A summary of the data showing the number of samples with
concentrations above the remedial action levels by site area is presented in Table 3.
The data collected in the pre-design investigation were used to refine the horizontal and vertical
extents of contamination for removal in the following locations (Figure 6):

July 2018 Revised Final (100 Percent) Design Report Page 3-8
The intertidal beach/shoreline area along the West Waterway
The northeast corner of the Site (sample location TT34)
The area off the intertidal beach (TT04)
The areas along Pier 23 (TT20 and Ecology-197)
The shoreline area between Piers 23 and 24
The former shipway area
The former dry dock areas
3.6.1 Horizontal Extent of Contamination
A summary of the chemical analyses for the risk driver COC data for all samples from the historic
investigations, RI, and pre-design investigation is presented in Table 2 of Appendix A. Data
collected during the pre-design investigation was targeted to address data gaps for the horizontal
extents for areas with contamination identified in a small number of samples (intertidal beach and
shoreline areas, northeast corner, former piers 22 and 23, and the former shipway).
Cores collected in the intertidal beach and along the shoreline were used to refine the extent of
removal between +4 feet and -10 feet MLLW. In addition, the extent of existing riprap/rock was
used to refine areas of the shoreline removal. Cores TT-CS127 to TT-CS132 along with the RI
intertidal beach samples were used to refine the intertidal beach removal area up to the riprap-
covered Florida Street storm drain outfall.
Cores collected during the pre-design survey refined the extent of contamination at the northeast
corner of the Site where contamination above the cleanup goals was found during the RI (TT34).
Two new cores around TT34 (i.e., TT-CS137 and TT-CS138) refined the horizontal extents of
sediment contamination to be removed in this area.
In the area of former Pier 22, the pre-design investigation core TT-CS118 refined the extent of
removal to the west from the dry docks area.
Cores and surface sediment samples collected in the area of former Pier 23 around RI locations
TT20 and Ecology-197 were used to refine the extent for removal in these two areas. The pre-
design data allowed for the refinement of the areas around these two points for removal.

July 2018 Revised Final (100 Percent) Design Report Page 3-9
Along the shoreline between former Pier 23 and Pier 24, two cores (TT-CS109 and TT-CS110)
were collected to refine the extent of removal. The extent of removal for this area is refined based
on the contamination present in the one core (TT-CS109) and the concentrations in TT-CS110
being below the Site action levels for removal.
Eight cores (TT-CS101 to TT-CS108) were collected from the former shipway to refine the extent
of contamination for removal in this area. The data from the eight cores along with the intertidal
samples from the RI were used in the design to refine the extent of removal in this area.
3.6.2 Vertical Extent of Contamination in Removal Areas
Depth of contamination in areas for removal was determined from the core profiles and defined as
the bottom of the deepest sample interval with any concentration for the risk-driver COC above
the SQS or CSL depending on the area of the Site for the sample location. Where the collected
core encountered a refusal and the deepest collected interval had concentrations above the SQS or
CSL level, the estimated depth of contamination for the sample location is based on the depth of
the refusal encountered.
The vertical extent of contamination was found to be deepest in the area of the former dry docks,
where the depth of sediment with contamination above the Cleanup Level is up to 10 feet and an
elevation of approximately -52 feet MLLW. The extents of vertical contamination are extrapolated
from the core data to capture the extent of contamination within a prism across the dry dock and
former shipway areas expected to be contaminated based on the similarity of Site features to the
sampling core locations.
Cores collected during the pre-design investigation defined the vertical extent of contamination in
the northeast corner of the Site (TT34), along the western edge of the of the dry dock removal area
(TT30), at the area of the intertidal beach (TT04), and in the areas along Pier 23 (TT20 and
Ecology-197). In addition, the eight cores collected from the former shipway defined the vertical
extents for the removal. In the cores collected at the end of the former shipway area, a gap of
cleaner material appears to be present above a deeper sediment layer with elevated PAH
contamination. The vertical extent of the contamination in the shipway related to the former
shipyard activities is limited to the upper sediment zones, whereas the deeper PAH contamination
appears to be related to other sources, as discussed below.

July 2018 Revised Final (100 Percent) Design Report Page 3-10
3.6.3 Nature and Source of PAHs in Shipway
Deeper cores in the former shipway area of the site had elevated concentrations of PAHs present
at depths below intervals of lower levels of contamination related to the former shipway activities
(see Table 2 of Appendix A). The deeper PAHs are very likely associated with creosote
contamination originating from the PSR site adjacent to the Lockheed West Seattle Superfund Site.
The PSR sediments are capped to isolate the PAH contamination that has migrated offshore from
the creosoting operations that historically took place at this site.
PAHs come from many historic and ongoing sources. The source of PAH contamination can be
determined using the PAH profile and PAH ratios. PAHs can be formed from incomplete
combustion of organic materials (pyrogenic), from petroleum formation processes (petrogenic), or
natural processes in the environment (biogenic). PAHs present in the soil, water, or sediment can
undergo changes (“weathering”) through volatilization, dissolution, biological degradation, or
chemical degradation (including photo-degradation). The lighter molecular weight PAHs are most
susceptible to weathering; therefore, weathering processes reduce the fraction of light PAHs
relative to the heavier PAH compounds (Elmendorf et al., 1994). The evaluation and connection
of PAH profiles can be used to relate contamination between samples and provide information on
potential sources from collected sample data.
Data for core interval samples from PSR sample locations (EB113 and EB012) nearest the former
shipway on the Site (Figure 5a) show a pattern of PAHs consistent with a creosote material of
pyrogenic origin (Upland PSR dense nonaqueous-phase liquid [DNAPL]), with a relatively high
fraction of the total PAHs being lighter PAHs (naphthalene, acenaphthene, phenanthrene, and
anthracene). Figures 5b and 5c show PAH distributions as radar charts, or star plots. These plots
are arranged clockwise from lightest to heaviest PAHs, with naphthalene at the top. These plots
show the similarity in PAH distributions in the deeper sediment samples collected from the
shipway sample locations TT-CS105, TT-CS107, TT-CS108, and TT24-CS with samples from the
PSR site.
The ratio of heavier weight PAHs can be used to determine similarities between the sources of
PAHs in samples. These PAH ratios are generally conservative in that they change little over time
because there is limited degradation of the heavier PAHs in the environment. Two common PAH
ratios used for this purpose are fluoranthene/pyrene and benz(a)anthracene/chrysene (Figure 5d).

July 2018 Revised Final (100 Percent) Design Report Page 3-11
The fluoranthene to pyrene ratios in the deep shipway samples are greater than 1.0, similar to four
of the five PSR core samples, three of the PSR surface sediment samples collected from near the
former shipway, and the Upland PSR DNAPL (Table 4). The right side of the plot of PAH ratios
in Figure 5d shows the clustering of the deeper samples from the former shipway area and those
for sediment cores from the PSR site as well as surface sediment samples from near the PSR upland
shoreline. In contrast, the left side of the plot shows clustering of site surface sediment samples
and surface sediment samples farther away from the shoreline as well as other subsurface sediment
samples away from the PSR-impacted material. These grouping of samples indicate the similarity
between PAHs present at the Site and at the adjacent PSR site and the likely link of source material
contributing to the observed PAH contamination.
The distributions of light, mid, and heavy molecular weight PAH constituents can provide some
indication of similarities between samples. Comparing the ratios of the sum of phenanthrene and
pyrene to the sum of benzo(a)anthracene and benzo(g,h,i)perylene shows that the PSR subsurface
samples and upland PSR NAPL have a value greater than 3.1. Values range from 1.4 to 5.8 for the
deep sample intervals from the shipway, and from 1.3 to 3.6 for the surface samples from the PSR
site. Values for surface samples from the former shipway area range from 0.7 to 2.4 (Table 4).
Data from samples collected in the marine area of the PSR site indicate a likely similarity of
contamination source for these samples and the deeper shipway core samples collecting during the
pre-design investigation.
Based on the PAH profiles and PAH ratios, it is likely that the source for the PAHs found at depth
in the former shipway is similar to that for the PAHs in the PSR marine site and potentially linked
to the DNAPL in the PSR upland area. Therefore, the design set the dredging removal depth based
on the clean interval above the PAHs found at depth, thereby leaving the contamination associated
with PSR in place.
Figure 6 shows refinements to the removal areas from the FS to the current design.
3.7 SEDIMENT PHYSICAL CHARACTERISTICS
The shoreline area is composed of medium sand, shell hash, small- to medium-size cobbles,
medium to large riprap, concrete keel blocks, cut-off and broken-off wood pilings, and debris,
including trash, wire rope, concrete, ductile iron piping, and portions of deteriorated wooden

July 2018 Revised Final (100 Percent) Design Report Page 3-12
bulkheads. Numerous debris piles and multiple pilings are present in the intertidal and subtidal
areas of the former dry docks and shipway.
3.7.1 Existing Bathymetry and Debris
During the pre-design site investigations, the multibeam sonar system provided high-resolution
bathymetry of the project area (Tetra Tech, 2016). Hydrographic images, including elevation
contour lines and a hill-shade three-dimensional representation of the mudline surface, were
developed. The extent of shoreline riprap was determined using data from the high-resolution
bathymetry survey and the side-scan sonar survey that was performed during low tide. The rock
toe generally follows the -10-foot MLLW contour (Figure 3). Bottom features include the presence
of near uniform and widely spaced surface protrusions (humps) under the former dry docks, which
are most prominent under the former Dry Dock #2 area. Previous characterizations of these humps
and recent investigation results, including targeted magnetometer and side-scan surveys, suggested
presence of sand blast grit accumulations (Tetra Tech, 2008, 2016).
The side-scan sonar and magnetometer surveys identified debris items in subtidal areas as tires,
trees, poles, metal debris, and other debris. The magnetometer survey was completed along widely
spaced transect lines to identify areas with concentrated metallic debris. The shoreline survey
identified debris to remove from the shorelines as part of remediation of intertidal areas.
Current bathymetry is used as the base map to design dredge prisms, shoreline and shipway area
remediation, and enhanced natural recovery (ENR) layer placement areas. Design details, dredge
slopes, and remediation volume calculations (e.g., dredge, backfill, ENR) are based on the mudline
elevations determined by the current bathymetry. The extent of rock along the shoreline was
utilized to determine the extent of removal and perform geotechnical stability analysis of shoreline
slopes. Debris survey results were used to identify and quantify the approximate amount of debris
present in the dredge areas to be managed during the remediation and presented in the Design
Drawings (Appendix E). Further details are provided in the Pre-Remedial Design Field Sampling
Data Report (Tetra Tech, 2016).
3.7.2 Geotechnical Properties
Site subsurface conditions were recently investigated through upland and offshore borings, cone
penetration tests (CPT), and geotechnical characterization laboratory testing (Tetra Tech, 2016).

July 2018 Revised Final (100 Percent) Design Report Page 3-13
Overall findings are consistent with the historical investigations conducted at the site since the
1990s (Enviros, 1990; Hart Crowser, 1995; URS, 2003; Hart Crowser, 2003b; Tetra Tech, 2008).
The simplified site profile is composed of an upper layer of 3 to 5 feet of very loose sandy silt
alluvium, followed by a 10- to 20-foot layer of interbedded loose sandy silt and loose to medium
dense silty sand, mostly non-plastic, with rare clay lenses underlain by medium dense to dense
silty sand to a depth of 75 to 100 feet, below which the material becomes very dense. This pattern
is consistent with deltaic deposits of alluvial origin from the Duwamish River system or fill derived
from these materials (Hart Crowser, 2003a).
Pre-design geotechnical field work included CPT soundings to record a continuous subsurface
profile of tip resistance, friction ratio, pore pressure, soil behavior type, and standard penetration
test. Seismic CPT results are presented as shear wave velocity profiles. Selected geotechnical core
samples collected from upland and offshore locations at intervals of every 5 feet were analyzed
for geotechnical properties, including moisture content, organic matter, specific gravity, particle
size analysis, and Atterberg limits. The results were utilized to analyze stability of shoreline slopes
and stability of the sheet pile wall at the former shipway after removal of pilings and after dredging.
The geotechnical data were also evaluated for dredgeability, turbidity controls, and sediment
dewatering. Details of the geotechnical investigation and data are presented in the Pre-Remedial
Design Field Sampling Data Report (Tetra Tech, 2016). Geotechnical properties of sediment to be
dredged are presented in Table 5, and the geotechnical profiles of the Site are included in the basis
of design calculations (Appendix H).
3.7.3 Sediment Dewatering Characteristics
The dewatering tests consisted of mechanical dredging simulation, sediment characterization,
gravity dewatering, and bench-scale testing of sediment mixed with amendments and adsorbents
(Tetra Tech, 2016). The tests were conducted at WaterSolve LLC’s laboratory in Caledonia,
Michigan, in February and August, 2016. After simulation of mechanical dredging, sediment from
three areas within the Site, consisting of the former shipway, Dry Dock #1, and Dry Docks #2/3,
was tested for basic dewatering characteristics (i.e., percent solids, specific gravity, unit weight,
and organic matter). The amendment testing was performed with Calcimite, Portland cement, and
superabsorbent Solve 1880 at different concentrations. The results of dewatering parameters (i.e.,
solids concentration [percentage dry weight], specific gravity, unit weight, and organic matter) are

July 2018 Revised Final (100 Percent) Design Report Page 3-14
summarized in Table 6. All samples failed the paint filter test when no amendment was added
(Table 7). A minimum 4 percent Calcimite or Portland cement or 0.4 percent of Superabsorbent
was needed for the dry dock samples (i.e., “Dry Dock #1” and “Dry Docks #2/3”) to pass the paint
filter test. The Shipway #1 sample required concentrations of 4 percent Calcimite, 6 percent of
Portland cement, or 0.4 percent of Superabsorbent to pass the paint filter test (Table 7).
Gravity dewatering characteristics of sediment samples were also tested, and the results are as
follows:
Shipway #1—The sample was sandy with some black silt, some crushed shell, a few pieces of wood, and decaying organic matter. It had good stackability and held its form with some slumping. The free water was dirty and slow to release. By 20 hours of dewatering, there was little to no free water visible.
Dry Dock #1—The sample was sandy with black silt present. It had good stackability and held its form with no noticeable slumping. The free water was dirty and quicker to release than the Shipway #1 sample. By 20 hours of dewatering, there was little to no free water visible.
Dry Docks #2/3—The sample was sandy with black silt present, with more sand than the Dry Dock #1 sample. It had good stackability and held its form with no noticeable slumping. The free water was cleaner and quicker to release than the Shipway #1 sample. By 20 hours of dewatering, there was little to no free water visible.
Gravity dewatering test results also indicated that all samples dried faster within the first 100 to
120 hours (about 5 days). Solids concentrations and unit weight of each sample at the beginning
and at the end of the gravity dewatering test are summarized in Table 8.
3.8 SHORELINE STRUCTURES
The embedment depth of the sheet pile wall at the northeast corner of the Site was investigated. A
structural condition assessment of the sheet pile walls at the northeast corner of the shoreline and
at the former shipway was performed. This section presents the result of the structural assessment.
3.8.1 Sheet Pile Embedment Depth
Seismic wave records showed two distinct shifts in the character of the data: one at approximately
17.5 feet and another at 47.5 feet from the top of the sheet pile wall. These shifts indicate the
exposed and burial depth of the pilings. Wave action and wind appeared to create high-frequency
noise in the data. Recorded seismic data indicated that the bottom of the sheet pile wall was

July 2018 Revised Final (100 Percent) Design Report Page 3-15
approximately at 50±2.5 feet below ground surface with approximately 15 to 17 feet above
mudline and 30 feet of embedment. Based on this investigation, it was assumed that the total height
of the sheet pile bulkhead wall in the former shipway is about 45 feet with an embedment to
exposed depth ratio of 2:1 in deflection and stability analysis. These analyses are summarized in
Section 4.5 and Section 5.7.
3.8.2 Structural Field Inspection and Testing
The inspected walls were constructed with different sheet pile sections. The wall dimensions were
measured in the atmospheric zone, where the corrosion rate has been minimal. The inspections
focused on the intertidal and splash zones, where corrosion was an obvious concern. No corrosion
protection coating was found on any of the wall components.
At the northeast corner section, more than 3 feet below the top of the wall, the sheet pile is severely
corroded and has a heavy corrosion scale encrusted on the surface within the splash zone. The top
of the wall where minimal corrosion loss appeared was gauged at 0.45 inches. At the shipway, the
original nominal thickness was estimated at 0.375 inches. The wall was severely corroded with
heavy scale encrusted. The ultrasonic wall thickness measurements indicated a wall loss of up to
8 percent in the splash zone at the northeast corner section, and up to 100 percent at the shipway
section. Tensile strength tests were performed at steel coupons collected from the sections where
the original thickness of the walls remained. Current conditions of the sheet pile bulkhead at the
shipway were considered during the stability analysis.

July 2018 Revised Final (100 Percent) Design Report Page 4-1
SECTION 4 DEBRIS AND PILE REMOVAL AND DISPOSAL
The primary purpose of this activity will be to remove pilings and debris along the shoreline and
in areas where such items may hinder dredging (e.g., in subtidal areas and in the former shipway).
The Debris/Pile Removal Support System Plan is provided in Appendix I. Additional wood, metal,
amalgamated sandblast grit and slag debris, and portions of failing wooden bulkheads along the
shorelines also need to be removed. Stability evaluations were performed to determine whether
these materials are necessary to stabilize the bank or support current upland activities. The
removed debris, pilings, and other materials will be disposed of in an approved off-site location.
The debris and pile removal design basis and construction methodology described in the
Debris/Pile Removal Support System Plan (Appendix I) and this section is based on and is
consistent with the primary purpose and performance standards described in the Record of
Decision (ROD). The methods for achieving the performance standards for removal and disposal
of all materials are provided in this section and are detailed in the Construction Quality Assurance
Plan (CQAP; Appendix D). In addition, all in-water work at the Site will be subject to the
applicable or relevant and appropriate requirements (ARARs) and short-term monitoring standards
presented in this design report (Sections 7 and 8), which are further defined in the CQAP and
associated planning documents.
4.1 DESIGN BASIS AND ASSUMPTIONS
The following design basis and assumptions were considered to identify and quantify debris and
pile removal from shorelines and the former shipway area:
The design basis for shoreline debris removal is the overall cleanup of materials that could pose an environmental hazard in the intertidal area.
Large debris removal along shorelines will be followed by placement of quarry spall/riprap in void areas to maintain the integrity of the existing shoreline protection.
The design basis for the former shipway area debris and pile removal is to prepare the area before environmental dredging followed by placement of clean backfill to existing grades.

July 2018 Revised Final (100 Percent) Design Report Page 4-2
All wooden pilings removed from the Site are considered creosote-treated and will be handled and disposed of by following the guidelines established by the Washington Department of Natural Resources (DNR, 2017) and United States Environmental Protection Agency Region 10 (USEPA, 2017).
Existing outfalls and utilities will be protected.
As-built engineering drawings of the former shipway area and other shoreline structures were not located. The quantities are estimated through field survey. All debris shown on the design drawings will be verified in the field by the Contractor.
Refer to the Design Drawings in Appendix E for identified debris to be removed from
shoreline/intertidal areas, existing debris to be removed from subtidal dredge areas, and the pile
removal plan in the former shipway. Debris screening may be needed during handling and disposal
of dredge sediment due to the presence of debris in subtidal dredge areas. Debris handling in
dredge areas is discussed in Section 5 and detailed in the Excavation, Dredging, and Backfill Plan
(Appendix L).
All work associated with debris removal will be performed from the waterside with the exception
of utility closure activities, if applicable. All work will be coordinated/scheduled with the Port of
Seattle (Port).
4.2 UTILITY AND OUTFALL PROTECTION
Existing utilities will be protected during all remedial activities. The Contractor will coordinate
with the Port for utility clearance. There is only one active outfall for stormwater from Terminal 5,
labeled “Florida Street Outfall” in the design drawings. This outfall structure and outfall protection
rocks will be protected. There are abandoned outfalls along the north shore. Lockheed Martin will
not do any work related to abandoned utilities connected to the upland and to the piers that remain
intact.
4.3 SHORELINE DEBRIS REMOVAL
The following debris will be removed from the shorelines:
Large trash, wire rope, concrete, ductile iron piping, and portions of deteriorated wooden bulkheads and broken-off wood pilings
Debris piles of amalgamated sandblast grit and slag

July 2018 Revised Final (100 Percent) Design Report Page 4-3
Abandoned steel frame in intertidal area between Piers 23 and 24
Observations in shoreline areas indicate that the debris overlies existing riprap. In the unexpected
event that evidence of contaminated soil is observed (e.g., staining, odor), USEPA will be
consulted for further actions. Refer to the Design Drawings (Appendix E) and the Debris/Pile
Removal Support System Plan (Appendix I) for the debris to be removed. Items identified in the
design drawings will need to be field verified. Large debris removal along the shorelines will be
followed by backfilling any cavities with riprap/quarry spall to maintain the integrity of existing
shoreline revetment. Refer to Appendix H for stable rock size estimates for this placement.
Debris may be removed with a crane or excavator and placed onto a barge. The work surface on
the barge deck will include a containment basin to handle and segregate debris for transport and
disposal.
4.4 PILE REMOVAL IN FORMER SHIPWAY
Pilings, associated wood structures, and identified sheet piles in the former shipway area within
the Inner Harbor line will be removed during remedial construction. The Port will remove the rest
of the pilings beyond the Inner Harbor line within the Site. Pilings will be removed using
equipment staged on a barge. Removed pilings and other material will likely be placed on a barge
for staging and handling for subsequent transport and disposal.
In 2005, Lockheed Martin completed a similar pile removal action at its former shipyard,
Lockheed Shipyard Sediments Operable Unit (LSSOU) of the Harbor Island Superfund Site (TRC,
2005). The remediation included removal of four piers including about 7,000 pilings, replacement
of an existing deteriorated bulkhead wall, and dredging adjacent to the bulkhead. Lessons learned
from this remedial construction are summarized in Section 4.4.3.
DNR has established best management practices (BMPs) for derelict creosote pile removal and
disposal in Washington State (DNR, 2017). A USEPA Region 10 guidance document also details
BMPs associated with pile removal and placement in Washington State (USEPA, 2016). The
applicable procedures detailed in these BMP guidance documents are applicable to all pile removal
activities (including the Port’s pile removal project) and will be followed during removal of pilings
in the former shipway.

July 2018 Revised Final (100 Percent) Design Report Page 4-4
4.4.1 Pile Extraction
Wood pilings will be removed from the former shipway between the Inner Harbor line and the
Port’s Terminal 5 uplands. Due to the close spacing of the pilings in the shipway and the top of
piling elevations relative to the mudline, some minor excavation may be necessary to facilitate pile
extraction. While use of vibratory extraction is the preferred method to remove pilings, it is
expected that some of the pilings may break and will need to be cut at or near the dredge elevations
due to the deteriorated condition or short extension from mudline. Per USEPA and DNR guidance
documents, broken and damaged pilings that cannot be removed by either the vibratory hammer
or direct pull may be removed with either a clamshell bucket or environmental clamshell in deeper
areas. If the piling breaks at or near the existing substrate and cannot be removed by other methods,
the pilings will be cut at dredge elevation using a pneumatic underwater bucket, a clamshell bucket,
or another type of equipment to be selected by the Contractor. Pilings will be cut off at lowest
practical tide condition and at slack water to reduce turbidity and potential short-term water column
impacts.
Per DNR and USEPA BMPs, the work surface on the barge deck will include a containment basin
for all debris and any sediment removed during pulling. A floating surface boom equipped with
absorbent pads to contain any oil sheens will be deployed to capture floating surface debris and to
control potential creosote releases to the extent practicable. Collected debris will be disposed of,
along with cut-off pilings. Refer to Section 7.4 and Appendix J for further BMPs adapted from
USEPA and DNR guidance documents.
4.4.2 Removal of Other Debris and Structural Components
In the former shipway, there are other scattered wood debris, lateral and longitudinal wood beams,
and remnants of sheet pile walls that require removal to prepare the area for dredging. Estimated
quantities are noted in the Design Drawings. Minor excavation and cutting of wood members at
the Site may be needed.
4.4.3 Lessons Learned from Pile Removal at LSSOU
During demolition and bulkhead construction at LSSOU, there were occasions when pile removal
created localized soil instability (TRC, 2005). Vibratory removal of piling, especially in very dense

July 2018 Revised Final (100 Percent) Design Report Page 4-5
arrays in shipways, can produce a large amount of energy that liquefies sediments to some extent.
In addition, removal of piling creates voids, further reducing soil stability.
When this removal activity was conducted near the deteriorated sheet pile bulkhead, about 50 feet
of the bulkhead failed and began to lean forward several feet. This structure was extremely
corroded, especially at the mudline, and lost nearly all the wall thickness from corrosion, spalling
of corrosion products, and subsequent additional corrosion of the newly exposed surfaces. In
addition, the tie backs were made of steel, which had corroded through in two cases. This structure
was marginally stable prior to demolition of the immediately adjacent north shipway.
At the south shipway, sheets comprising the new bulkhead were driven. Some deflection of the
new bulkhead was noted, and the demolition was stopped until the situation could be addressed. It
was recommended that no pile removal be conducted within 50 feet of existing structures that were
in place and that monitoring for movement be undertaken. For the remainder of the bulkhead, the
recommendation was to alter the demolition/construction sequence so that demolition would be
completed ahead of the bulkhead construction. To protect the shoreline, a temporary wall of large
interlocking concrete ecology blocks was constructed between where the old bulkhead was
removed and the shoreline until the steel sheets could be driven. Most pilings were successfully
removed, and the pilings that were left in place did not inhibit necessary cleanup.
4.5 SHORELINE STABILITY EVALUATIONS
4.5.1 Bank Stability Evaluations
Debris removal is not anticipated to cause any bank stability issues. Per the design criteria, large
debris removal along the shorelines will be followed by reinstallation of quarry spalls and riprap
of void areas to maintain the integrity of the existing shoreline protection. Vertical pilings along
the West Waterway shorelines and around the corner of the Site that do not affect the remedial
action at this location will remain.
4.5.2 Sheet Piles Stability Evaluations
Stability of the sheet pile bulkhead in the former shipway was initially investigated and analyzed
to determine the stability conditions after removal of pilings and after dredging during the 60%

July 2018 Revised Final (100 Percent) Design Report Page 4-6
design studies. Stability analysis after dredging is discussed in Section 5.7.2. Detailed calculations
are included in Appendix H.
Based on the sheet pile embedment depth investigation (Section 3.8.2), it was assumed that the
total vertical height of the sheet pile bulkhead wall in the former shipway is about 45 feet, with an
embedment to exposed depth ratio of 2:1. The total horizontal extent of the sheet pile bulkhead is
about 200 feet. Stability evaluations were performed at three locations where the dredge cuts are
in the range of 6 to 13 feet. A software program, PYWALL, was utilized. The program
automatically generates active earth pressure acting on the wall based on the input geometry and
soil profile. Passive soil resistance due to embedment of the wall is computed automatically by the
program using nonlinear soil-resistance curves. The program provides curves of wall deflection
versus depth, as well as shear force versus depth and bending moment versus depth. To represent
the conditions after removal of pilings, a minimum passive soil resistance was assumed. Refer to
Section 5.7.2 for deflection versus depth estimates under current conditions and after removal of
pilings. The initial analysis indicated that if all the pilings in the shipway were removed without
any attempt to stabilize the nearby sheet pile wall, there would likely be instability of the sheet pile
wall, as had occurred previously during work activities on a similar site. Note that partial removal
of pilings (perhaps followed by backfill) and/or installing temporary wall structures are among a
number of options to stabilize the existing sheet pile wall prior to pile removal. Refer to Section
4.4.3 for lessons learned from pile removal operations completed at LSSOU in 2005. As a result,
the Port of Seattle conducted their own investigation of the sheet pile stability and reached the
same conclusion. The Port’s Geotechnical Report for Terminal 5, Pier 26 Wall Stability (PanGeo,
May 2017; provided in Appendix H) summarizes the study and can be found in Appendix H.
Therefore, the Port of Seattle designed and constructed a mitigation plan in which the soils behind
the sheet pile wall were excavated from the mudline elevation back at a 2H:1V slope followed by
the removal of the upper portion of the sheet pile wall.
Amec Foster Wheeler analyzed the global stability of the mitigated 2H:1V slope and the remaining
portion of the sheet pile wall during dredging. The results indicated stable conditions during
dredging. Further discussion on the stability of the sheet pile wall after dredging is provided in
Section 5.7. Detailed calculations are included in Appendix H.

July 2018 Revised Final (100 Percent) Design Report Page 4-7
4.6 DEBRIS TRANSPORT AND DISPOSAL
Transportation and disposal of debris is described in the Transportation and Disposal Plan, an
element of the Site Management Plan (Appendix K). The work surface on the barge deck will
include a containment basin for all debris and any sediment removed during pulling.
All removed wood pilings are considered creosote-treated. Per USEPA guidance, creosote-treated
wood pilings and sections will be disposed of in a manner that precludes their further use by cutting
them into 4-foot or shorter lengths before disposal. Pilings and other amalgamated slag/sandblast
grit removed from shorelines will be disposed of in a Subtitle D landfill that meets the liner and
leachate standards of the Minimum Functional Standards, Chapter 173-304 Washington
Administrative Code (WAC). Concrete, stone, and metal debris will be segregated, cleaned, and
recycled to the extent practicable at an approved recycling facility. Concrete and metal debris will
be swept and brushed clean of adhering sediment and visually inspected to ensure that it is visibly
clean. Refer to Section 5.10 for handling debris removed during dredging subtidal sediment.

July 2018 Revised Final (100 Percent) Design Report Page 5-1
SECTION 5 SEDIMENT REMOVAL AND DISPOSAL
The primary purpose of dredging is to remove contaminated sediment in specific areas of the
Lockheed West Seattle Superfund Site (Site) to fully accomplish the remedy selected by United
States Environmental Protection Agency (USEPA) in the Lockheed West Seattle Record of
Decision (ROD) (USEPA, 2013) and as outlined in the Unilateral Administrative Order (UAO)
Statement of Work (SOW; USEPA, 2015c).
Contaminated sediment in the intertidal zone (above -10 feet mean lower low water [MLLW] and
below the edge of shoreline protection rock [elevation varies between -10 feet MLLW and 8 feet
MLLW]) and in subtidal zones (below -10 feet MLLW) will be removed by in‐water dredging.
This section provides a discussion of design criteria and assumptions, sediment properties, dredge
design and operations, water management, sediment transloading, and disposal and confirmation
sampling. An overview of the dredge plan is shown in Figure 7. Refer to the Design Drawings in
Appendix E for a complete set of design dredging plans and sections at the Site. Sediment removal
is described in the Excavation, Dredging, and Backfill Plan (Appendix L), and transportation and
disposal are described in the Site Management Plan (Appendix K).
5.1 DESIGN BASIS AND ASSUMPTIONS
The following design basis and assumptions were considered for sediment removal and disposal
design:
The shoreline bank and intertidal zone, shipway, and navigational channel will be dredged to meet the Sediment Quality Standards (SQS) remedial action level (RAL). Portions of the Dry Dock #1 area outside of the navigation area, Dry Docks #2/3, and other localized subtidal areas throughout the Site will be dredged to the cleanup screening level (CSL) RAL. Refer to Table 2 for RALs. The sample intervals below the depth for removal have concentrations of contaminants of concern (COCs) below the RALs, except for the deeper intervals immediately adjacent to the PSR cleanup area. A complete list of sediment sample interval analytical data for the COCs is presented in Table 2 of Appendix A.
Performance standards for sediment removal shall be consistent with the ROD and applicable or relevant and appropriate requirements (ARARs), including the Clean Water

July 2018 Revised Final (100 Percent) Design Report Page 5-2
Act, Rivers and Harbors Act, and Endangered Species Act (ESA) requirements, as discussed in Section 2. The contaminated sediment shall be disposed of in a permitted and USEPA-approved upland disposal site, also approved by Lockheed Martin. All materials removed from the Site must be managed or disposed of in accordance with the Off-Site Rule (Comprehensive Environmental Response, Compensation and Liability Act [CERCLA] Section 121(d)(3)).
Dredge cuts will be to the required depths and areal extent to remove the contaminants. Stability of the final slope configurations will have a factor of safety which equals or exceeds the existing factor of safety.
Generated residuals (sediment disturbed by the cleanup action) and undisturbed residuals will be managed by placement of a clean residual management layer (RML) sand layer.
Dredged areas in the intertidal zone and the shipway will be backfilled to existing grades after removal to minimize loss of aquatic habitat.
5.2 SEDIMENT PROPERTIES
Sediment properties—specifically sediment composition, solids content, cohesiveness, and
organic content—are important parameters to consider in dredge design, selection of dredge
equipment, planning dredge operations, and during sediment handling, dewatering, and disposal.
Geotechnical properties of sediments within the dredge areas are summarized in Table 5 and
discussed below.
5.2.1 Sediment Cohesiveness
Cohesiveness of sediment is an important parameter in managing resuspension of particulates and
selecting the dredge type and operations. In general, finer, less cohesive sediments have the
greatest potential for resuspension. It is also an important parameter in dredge-cut slope stability
analysis, which is discussed in Sections 5.3 and 5.7. Sediment cohesiveness of Site sediment was
evaluated based on soil classifications and Atterberg limit testing data. Sediment to be dredged at
the Site is characterized as low plasticity to non‐plastic, suggesting that typical dredge operations
for resuspension controls will be applicable and special washing measures to clean the dredge
bucket will not be needed.
5.2.2 Sediment Density
Sediment density was evaluated using the boring logs, cone penetration test (CPT) readings (cone
tip and frictional resistance), and laboratory test data. These values indicate the presence of soft,
July 2018 Revised Final (100 Percent) Design Report Page 5-3
fine-grained sediment and loose to medium, dense granular sediment. Sediment density data
indicate that the sediment is dredgeable with standard practice dredge equipment. Refer to
Section 5.8 for dredging methodology to remove Site sediments.
5.2.3 Percent Solids
The percent solids by weight is the ratio of weight of dry solids to total weight of the dredged
material as removed. The percent solids in the material as it is removed and transported by the
dredge will have a major impact on the production rate and the compatibility of the dredging
operation with subsequent handling, treatment, and disposal of the material. Typically, a higher
solids content delivered by the dredge translates to more feasible handling, treatment, and disposal
of water and sediment. Percent solids by weight of sediment in the former shipway and dry docks
was tested during determination of dewatering characteristics of sediment. The results indicated
that shipway sediment has 59 to 62 percent solids, and dry dock sediment 67 to 79 percent solids.
The higher percentage of solids content in dry dock sediments suggest that higher production rates
and less dewatering time could be achieved during dredging dry dock sediment compared to
dredging sediment in the former shipway. Refer to Tables 6 and 8 for detailed data.
5.3 DREDGE PRISM DESIGN
Contaminated sediment will be removed from intertidal and subtidal areas. The design dredge
prism represents the elevations, grades, and horizontal extent of contaminated sediment (i.e.,
sediment with concentrations greater than the cleanup levels) that will be removed to implement
the remedial action. The dredge plan overview is shown in Figure 7. The design neatline dredge
volume is approximately 86,700 cubic yards (cy) over 15 acres and approximately 111,000 cy
including an over dredge of 1 foot across the affected area (Table 9).
5.3.1 Neatline Dredge Depths and Slopes
The design dredge surface is composed of a series of stepped level dredge cuts to reach design
depths to fully remove sediment that exceeds the RALs. Data interpretation, which dictates the
dredge depths, was based primarily on available chemistry data (see Appendix A, Table 2).
Sediment geotechnical properties were also utilized to analyze stable dredge slopes to assist in
developing the prism.

July 2018 Revised Final (100 Percent) Design Report Page 5-4
The dredge design slope represents the slope expected to be stable during construction, prevent
slope failure, and minimize sloughing during implementation. A slope of 3H:1V (three run
Horizontal to one rise Vertical) was selected determined as the default steepest allowable dredge
slope. The temporary dredge cut slopes along a portion of the shorelines and over some of the
existing surface ridges and humps will be 2H:1V based on the existing side slopes and required
dredge depths to meet cleanup levels. Dry dock shorelines and the dredge area adjacent to Pier 24
will be dredged at 2H:1V to dredge contaminated sediment along the slopes. These areas will be
further stabilized following dredging by riprap placement to restore the stable conditions. Refer to
Section 5.7 for detailed discussion. Slopes gentler than 3H:1V were used as much as possible to
mimic existing bottom contours. A submerged dredge-cut slope stability analysis for a slope of
2H:1V slope was also performed. A potential “bathtub effect” was also considered during
development of dredge prisms. The slopes are relatively gentle and the area covered is large. For
example, in the area of former Dry Dock #1, the average dredge cut is 6 feet over about 2 acres.
The high ratio of area versus dredged depth and the designed side slopes tapering into adjacent
elevated mudlines would not create a condition where water would be trapped and cause a bathtub
effect. Geotechnical slope stability analyses of dredge cuts are discussed in Section 5.7, and
detailed calculations are provided in Appendix H.
5.3.2 Extent of Dredging
The extent of dredging was originally defined in the USEPA Selected Remedy based on the extent
of contamination exceeding RALs (SQS and CSLs) determined during the feasibility study (Tetra
Tech, 2008). Pre-design site investigations resulted in refinement of these RAL boundaries and
the required dredge extent. Further discussion is provided in Section 3.6, and an evaluation is
presented in Appendix A, of the dredge design surface relative to the site data and interpreted CSL
and SQS boundaries. Designed dredge cuts were extended to these redefined CSL and SQS
boundaries while maintaining 12 inches of dredge cut or the required dredge depth determined by
the closest core chemistry data (Figure 7). The Field Sampling Plan (Appendix P) details the
sampling that will be conducted to confirm that concentrations of COCs in sediment left in place
after dredging meet the RALs and that concentrations of COCs in surface sediment placed as ENR
or RML meet the Cleanup Levels.

July 2018 Revised Final (100 Percent) Design Report Page 5-5
5.3.3 Overdredge
The equipment to be used for remedial construction has an accuracy of approximately ±0.5 foot;
therefore, an over dredge of up to 1 foot below the neatline elevation is planned.
5.4 SHORELINE/INTERTIDAL SEDIMENT REMOVAL
The intertidal areas are defined as nearshore areas with bathymetric elevations greater than -10 feet
MLLW and below the edge of existing shoreline protection rock. Additional sediment core data
from the pre-design field investigation refined the required dredge depths in shoreline/intertidal
areas. The south beach intertidal dredge area located next to the Port of Seattle’s (Port) Terminal 5
wharf will be dredged to the elevations shown in the design drawings after shoreline debris
removal. Some of the debris (e.g., woody debris, pieces of concrete pilings) is buried and will
likely be removed during dredging. The area to be dredged extends between the edge of existing
shoreline protection rock at approximately +8 feet MLLW and the -10-foot MLLW elevation
contour. The area will be backfilled to the existing grades as discussed in Section 6.2.
The intertidal dredging area near the former dry docks is very narrow, because the toe of rock is
at approximately -2 feet MLLW, and the existing shoreline slope is about 2H:1V to reach the -10-
foot MLLW contour (Figure 7). Areas to be dredged along the shorelines next to Pier 23 and Pier
24 do not include any intertidal area, because the toe of the existing shoreline protection rock
follows the contour at approximately -10 feet MLLW. The intertidal area to be dredged next to
Pier 25 will be backfilled to the existing grades as discussed in Section 6.2. In the former shipway,
the intertidal area portion of the dredge prism covers an area between +10 feet MLLW at the
project boundary and the -10-foot MLLW level. The area will be backfilled to the existing grades
as discussed in Section 6.2. Refer to the design drawings for detailed information.
The majority of intertidal areas (i.e., south beach, adjacent to Pier 25, and the former shipway) are
below 0 feet MLLW and are permanently inundated between tidal cycles. The contamination depth
in the portions that are exposed to tidal cycles are shallow enough that dredging of contaminated
sediment can be completed during a single tidal cycle, pending confirmation sampling. As a best
management practice (BMP), geotextile fabric may be deployed over dredged areas if needed to
control resuspension and to comply with the project’s water quality requirements.

July 2018 Revised Final (100 Percent) Design Report Page 5-6
5.5 FORMER SHIPWAY SEDIMENT REMOVAL
Former shipway sediment will be dredged to the RALs after the derelict pilings and identified
debris are removed from the area. Required dredge depths were determined by the SQS RALs.
The stability of the existing sheet pile wall located on the western side of the former shipway after
removal of 6 to 13 feet of sediment was analyzed (Section 5.7.2). Dredge plan view and dredge
cross sections are provided in the Design Drawings (Appendix E). The area will be backfilled to
the existing grades (see Section 6.2).
5.6 SUBTIDAL SEDIMENT REMOVAL
The subtidal sediment removal area covers areas below -10 feet MLLW to -54 feet MLLW to
achieve RALs, mainly in the dry dock areas and a few other locations in the West Waterway, the
northeast corner of the site, between Pier 23 and the dry docks, and adjacent to Pier 23, Pier 24,
and Pier 25 (Figure 7). Existing bathymetry is very irregular throughout the Site and in the dredge
areas, with the presence of surface protrusions, assumed to be sand blast grit, concentrated within
the footprint of the dry docks. A number of stepped-level dredge cuts are designed to achieve the
RALs at elevations ranging between -33 feet MLLW and -54 feet MLLW. The dredge footprint
was extended to reach the defined SQS and CSL boundaries. RML will be placed over the dredged
areas, as discussed in Section 6. Dredged shoreline slopes along the dry docks and adjacent to
Pier 24 will be stabilized by riprap shoreline protection rock (Section 5.7.1). Dredge plan view and
dredge cross sections in dry docks and other subtidal sediment dredging areas are provided in the
Design Drawings (Appendix E). Refer to Table 9 for a summary of the design dredge volumes.
5.7 SHORELINE STABILITY EVALUATIONS
5.7.1 Bank Stability Evaluations
The slope stability of dredge cuts along the shorelines was originally analyzed as part of the
60 Percent Design and re-analyzed during the 100 Percent Design by Amec Foster Wheeler. These
locations include the West Waterway south beach dredge area, shorelines of the dry docks, the
dredge area adjacent to Pier 24, and the former shipway.
Shoreline slopes along the West Waterway south beach dredge area and former shipway will be
backfilled to the existing grades. The backfill will consist of sand, gravel beach mix, and fish mix.
The gradation of gravel beach mix was designed to withstand wind and water level conditions

July 2018 Revised Final (100 Percent) Design Report Page 5-7
associated with the occurrence of a 50-year return period storm. Refer to Section 6.1 for the design
criterion. The stability calculations incorporated the most recent storm surge flood elevations and
50-year relative sea level change estimates in Seattle; the calculations are documented in
Appendix H. The stability of dredge slopes in the West Waterway south beach dredge area and
former shipway is anticipated to either remain the same as the current conditions or improve due
to backfilling the dredged areas to the existing grades with sand, gravel beach mix, and fish mix.
A slope stability analysis along the profile of the former shipway after backfilling confirmed that
post-backfill slopes would be stable (Table 10).
Representative dredge slopes along the shorelines of the dry docks and near Pier 24 were selected
for stability analysis. Conventional two-dimensional limit-equilibrium analyses were performed
to investigate the stability of the dredge cuts. The computer program SLOPE/W was used to
calculate the factor of safety (FoS) against potential failure. This factor is defined as the ratio of
resisting (i.e., stabilizing) forces to the driving forces trying to displace the slope. A FoS greater
than 1 implies that the slope is theoretically stable. A FoS less than 1 implies that the slope is not
stable and slope movement is possible. The design criterion is to match or exceed the current
stability of slopes the same after the construction under both static and seismic conditions. The
slope stability analyses also checked seismic conditions stability based on a seismic event of 50
percent probability of exceedance in 75 years, which corresponds with a return period of 108 years
(nominal 100 years).
Historical geotechnical data, pre-design geotechnical investigation results, and the Port’s
Terminal 5 modernization project geotechnical basis of design report (Hart Crowser, 2016) were
reviewed to select the stability analysis parameters and the analysis methodology. Slope stability
analysis was performed by defining a minimum slip surface depth of 3 to 5 feet, which removes
any slip surfaces with depths less than the minimum from the results. This is a common method
when analyzing frictional material. Surficial “raveling” types of soil movement will be mitigated
by placement of riprap protection on the dry dock and adjacent to Pier 24 shoreline dredge slope
surfaces.
Slope stability analysis results are summarized in Table 10, and detailed calculations are included
in Appendix H. The results indicate that post-dredge and riprapped slopes are theoretically stable,
with FoS equal to or greater than the current conditions. The FoS values for the seismic stability

July 2018 Revised Final (100 Percent) Design Report Page 5-8
of the existing slopes under seismic loading are currently less than 1.0, while the post-construction
conditions show a slight improvement in the FoS compared to the current conditions, but still
generally below a FoS of 1.0. The results also indicate stability of submerged dredge cut slopes at
2H:1V and stable conditions in the former shipway after backfilling. Refer to Section 6.2 for
details of backfilling the former shipway after dredging.
5.7.2 Sheet Piles Stability Evaluations
Stability of the sheet pile bulkhead in the former shipway was analyzed during the 60 Percent
Design to determine the stability conditions after removal of pilings and after dredging. The
discussion about stability analysis after removal of pilings is summarized in Section 4.5.2 and
detailed calculations are included in Appendix H.
Analysis methodology and assumptions are described in Section 4.5.2. Stability evaluations were
performed at three locations where the dredge cuts are in the range of 6 to 13 feet. The PYWALL
software program was utilized to estimate wall deflections after the removal of the pilings and
after dredging. Deflection versus depth estimates for current conditions, after removal of pilings,
and after dredging are summarized in Table 11. The area will be backfilled to the existing grades;
however, estimated deflections of the sheet pile wall are expected to occur during the construction.
This analysis indicated that the sheet pile wall would be unstable after removal of pilings and
dredging. This finding is consistent with Lockheed Martin’s experience at the Lockheed Shipyard
Sediments Operable Unit (LSSOU), as discussed in Section 4.4.3. In response to the unstable
condition, the Port of Seattle implemented a mitigation approach to reduce the lateral earth
pressure by cutting a portion of the sheet pile wall at the mudline and excavating upland backfill
behind the wall to a 2H:1V slope. These mitigation repairs were performed in mid-2017. The
investigation and design are presented in Appendix H.
The mitigation measures performed by the Port were reviewed by Amec Foster Wheeler and
additional global stability analyses were performed on the mitigated condition (2H:1V slope
extending up from mudline with the lower portion of the sheet pile wall below the mudline
remaining). Slope stability was analyzed for the conditions after removal of the timber piles and
dredging of the sediments in front of the sheet pile wall. Results indicated the slope and remaining
sheet pile wall would be stable as detailed within the analyses found in Appendix H.

July 2018 Revised Final (100 Percent) Design Report Page 5-9
5.8 DREDGE METHOD AND OPERATIONAL CONTROLS
This section provides brief information about the dredge equipment and construction approach.
5.8.1 Dredging Methodology
The Contractor’s selection of dredging equipment is based on the Site and project characteristics:
Contaminated sediment is required to be removed both at intertidal and subtidal areas.
The equipment must be suited for sediment removal both on a slope and a level bed and should be able to dredge to -55 feet MLLW.
The equipment and operations controls should be designed to minimize the generation of dredge residuals and water quality impacts.
The Site is subject to tidal fluctuations, and equipment must maintain correct locations through the tidal changes.
The sediments are typically finer grained but there are substantial amounts of debris within the dredge footprints.
The dredging equipment best suited to the Site conditions is mechanical dredging equipment.
Mechanical dredging offers the following advantages:
Ability to meet project requirements, including compliance with applicable water quality criteria and minimizing sediment resuspension
Ability to achieve higher solids loadings in the dredged material, without necessitating costly and area-intensive dewatering methods
Greater availability of equipment and expertise within the Pacific Northwest
Ability to be used for other remedial activities, such as RML and enhanced natural recovery layer placement.
The dredging methodology is detailed in the Excavation, Dredging, and Backfill Plan
(Appendix L) and is summarized in the following sections.
A typical mechanical dredging sequence consists of the following steps:
Dredging sediment using an environmental bucket or digging bucket with a plated top (for dredging slopes)

July 2018 Revised Final (100 Percent) Design Report Page 5-10
Placing dredged sediment in a haul barge, where dewatering through woven sediment bags occurs (Section 5.9 and Dewatering Plan [Appendix N])
Transporting dredged sediment to an upland off-loading and staging area (Section 5.10)
Dewatering sediment either directly on the haul barge or off-loading sediment to a stockpile area for further dewatering (Section 5.9)
Collecting and treating (if necessary) effluent from the dredge stockpile and discharging it to approved treatment works
Loading the sediment into rail cars and/or trucks for upland transport (see Site Management Plan in Appendix K)
Transporting contaminated sediment to a permitted landfill facility by truck or rail (see Site Management Plan in Appendix K)
5.8.2 Dredge Operations
Dredging operations will be performed over individual dredge units such that required dredge
depths can be verified through the bathymetric surveys and confirmation sampling can be
conducted. The design drawings include a series of dredge areas determined by the location and
dredge depths (Appendix E). Dredging at higher tides in intertidal and shallow subtidal areas will
likely be needed to provide the required draft for the dredge and material barges. Dredging will
progress from upper to lower slope to reduce the possibility of surface recontamination and to
maintain slope stability. The progress of the dredging will be monitored by the Contractor in the
daily reports and progress surveys, and oversight will be provided by USEPA and Lockheed
Martin.
Dredge equipment will be configured with global positioning system (GPS) based, real-time (real-
time kinetic) or equivalent, integrated, computerized horizontal and vertical (x, y, z) positioning
systems to enhance accuracy of dredging and reduce excess dredge volume. Other operational
considerations due to Site characteristics include the following:
There are shallow dredge cuts at the Site (less than 5 feet in most places) that require experienced operators to minimize any over‐dredge beyond that required to achieve RALs.
A minimum number of dredge passes is desired to minimize dredge residuals and sediment suspension.

July 2018 Revised Final (100 Percent) Design Report Page 5-11
Surface debris surveys indicate that most of the debris is present in the dry dock areas. Unknown buried debris will also likely be encountered.
Dredge cut elevations will be monitored in real time to recognize the difference in the dredgeability of loose, fine, unconsolidated sediment and stiff, dense sediment and make any operations adjustments as needed.
Operational controls will be used to limit water quality impacts, recontamination, and dredge
residuals to the extent practicable. These controls include BMPs (Appendix J), water quality
monitoring (Appendix M), and operational adjustments. Refer to Section 7 for a summary of these
controls.
All in-water construction will be conducted during the designated in-water work window unless
an extension is granted. The final work window will be defined and coordinated in consultation
with the Tribes and other resource agencies before implementation.
5.9 SEDIMENT DEWATERING
Sediment dewatering at the Site is described in the Transportation and Disposal Plan in the Site
Management Plan provided in Appendix K. Water quality effects from dewatering will be
monitored according to the Water Quality Monitoring Plan (WQMP; Appendix M).
5.9.1 Barge Dewatering
Dredged sediment will be dewatered by pumping water out of the barges and through a woven
sediment bag (geotube) before being transported to the transload facilities. This process is detailed
in the Dewatering Plan (Appendix N) and the Transportation and Disposal Plan in the Site
Management Plan provided in Appendix K.
5.9.2 Upland Dewatering
Dewatering of the sediment placed on a barge will already be substantially completed prior to
barges being sent to the transload facility for offloading.
At the Lafarge facility sediment and water will transferred to a containment vault. If additional
sediment dewatering is conducted, water will be discharged to a sanitary sewer in compliance with
the facility’s discharge permit and all appropriate rules and regulations.

July 2018 Revised Final (100 Percent) Design Report Page 5-12
At the 8th Avenue facility, water will be decanted from the barges if the sediment is free draining.
If water is decanted from the barge, the water will be discharged to a sanitary sewer in compliance
with the facility’s discharge permit and all appropriate rules and regulations.
5.9.3 Wastewater Treatment
The Dewatering Plan (Appendix N) and the Transportation and Disposal Plan in the Site
Management Plan provided in Appendix K details procedures for treatment of decant water on
barges. Water discharged from either of the transload facilities will be conveyed to a publicly
owned treatment works in accordance with the facilities’ operating permit (Appendix K).
5.10 SEDIMENT TRANSLOAD AND DISPOSAL
The transportation and disposal of dredged material is described in the Site Management Plan
(Appendix K). Dredged material will be placed on haul barges and transported to the Lafarge
cement plant or the 8th Avenue South facility operated by Waste Management on the Lower
Duwamish Waterway.
The debris to be encountered during the dredging will range in size and be managed with the
sediment. A sediment transload facility typically includes barge off-loading and truck or train
loading (for transport to a disposal facility approved by USEPA and Lockheed Martin). Any water
from the barge and sediment stockpiles at the facility will be managed by the transload operation
in compliance with all appropriate rules and regulations.
5.10.1 Sediment Transloading
The Contractor will use existing and permitted transloading facilities to dewater and transport
dredged material to the disposal facility. These transloading facilities include the Lafarge cement
plant and the 8th Avenue South facility operated by Waste Management. Transloading procedures
are detailed in the Site Management Plan (Appendix K).
5.10.2 Disposal
Dredged material will be disposed of at a Subtitle D landfill that has been approved under the
USEPA Off‐Site Rule (CERCLA Section 121(d)(3)) for waste disposal from a Superfund site.
There are several off-site Subtitle D solid waste landfills in the region that are licensed to accept

July 2018 Revised Final (100 Percent) Design Report Page 5-13
dredged sediment from the Site. The landfill facilities proposed for use on this project include the
Columbia Ridge Landfill in Arlington, Oregon, operated by Waste Management, and the
Roosevelt Regional Landfill in Klickitat County, Washington, operated by Republic Services.
Roosevelt Regional Landfill and the Columbia Ridge Landfill are licensed to accept sediments
that have excess water, or wet sediment. The amount of free water that is acceptable over a certain
time period is written into the operating permit of the landfills. Railcars used to transport wet
sediment, if any, may need to be lined to prevent water spillage. The current design assumptions
include dewatering of sediment before transport and disposal to reduce the amount of weight and
the cost of the project.
5.11 DREDGE VERIFICATION AND CONFIRMATION SAMPLING
Dredge verification and confirmation sampling will be performed in accordance with the
Construction Quality Assurance Plan (CQAP) (Appendix D) and the Field Sampling Plan
(Appendix P). During dredging, progress surveys will verify that required dredge elevations have
been met. Based on the progress surveys, in locations where the required elevations have not been
achieved, the Contractor will be required to remove additional material. The completion of
dredging will be determined with a post-dredge bathymetric survey and post-dredge confirmation
sediment sampling. Bathymetric surveys as described in Appendix Q will be completed after
dredging to confirm that the design elevations have been met. After confirmation of achieving the
design depths, sediment samples will be collected for chemical analysis to confirm that impacted
sediments have been removed. All dredging confirmation activities will be done on pre-determined
dredge management units. Refer to the CQAP (Appendix D) and Field Sampling Plan
(Appendix P) for details of the post-dredge bathymetric survey, the post-dredge confirmation
sampling, and the contingency actions if dredge confirmation samples show that COCs exceed the
RALs.

July 2018 Revised Final (100 Percent) Design Report Page 6-1
SECTION 6 BACKFILL, RESIDUAL MANAGEMENT LAYER,
AND ENHANCED NATURAL RECOVERY LAYER PLACEMENT
This section explains the following components of the Selected Remedy for the Lockheed West
Seattle Superfund Site (Site): intertidal area and former shipway area backfill, enhanced natural
recovery (ENR) layer placement, and dredge residual management layer (RML) placement.
The design basis, material specifications, and construction methodology described in this section
are based on and consistent with the primary purpose and performance standards for the ENR and
RML placement as described in the Record of Decision (ROD). Performance requirements will
further be detailed in the Construction Quality Assurance Plan (CQAP; Appendix D) to be
developed at later stages of design.
6.1 DESIGN BASIS AND ASSUMPTIONS
The following design basis and assumptions were considered for backfill of intertidal and shipway,
ENR, and RML placement design:
Dredged intertidal areas will be backfilled to grade, to the extent practical, with clean imported backfill material (i.e., sand, fish mix, and gravel beachfill) that promotes colonization by aquatic organisms.
Intertidal area backfill will incorporate gravel beach mix (i.e., dynamically stable gravel beach) to provide stability in the intertidal zone. The beach mix gradation will be sized to withstand wind and water level conditions associated with the occurrence of a 50-year return period storm.
Chemical concentrations of import material(s) for backfill, ENR and dredge RML placed within the intertidal and subtidal zone will be consistent with the project Cleanup Levels.
ENR and dredge RML will be placed as a 6-inch layer of imported clean material that promotes colonization by aquatic organisms.
July 2018 Revised Final (100 Percent) Design Report Page 6-2
6.2 INTERTIDAL AREA AND FORMER SHIPWAY AREA BACKFILL
Intertidal areas in the south beach area of the Site in West Waterway, in the former shipway, and
in the dredge area next to Pier 25 will be backfilled to the existing grades after dredging. Gravel
beach mix and 6 inches of fish mix will be placed at south beach and Pier 25 dredge areas. Shipway
area will be backfilled with sand as the base layer, followed by gravel beach mix and 6 inches of
fish mix in intertidal areas. The basis of design of intertidal backfill is consistent with typical
mixed-sediment beaches of Puget Sound. The gravel portion of beach mix is expected to form a
stable intertidal zone providing erosion protection from wind/wave forces. The subtidal dredge
area of the former shipway will also be backfilled to the existing grades. Approximate intertidal
and subtidal backfill quantities are summarized in Table 12. Design basis calculations for beach
mix are provided in Appendix H. Refer to the Design Drawings (Appendix E) for plan views and
sections of intertidal backfill.
6.2.1 Backfill Material Specifications
The grain-size specifications for the backfill material are provided in the Specifications
(Appendix R) and the chemical criteria the fill must meet are provided in the Field Sampling Plan
(Appendix P). The backfill for shipway will be imported, clean, granular material free of roots,
large organic material, debris, contaminants, and all other deleterious material. The gravel beach
gradation was evaluated using the daily and 50-year design wave conditions for gravel sizes of
0.5-, 1-, and 1.5-inch stone. An iterative design process using various median gravel sizes was
used to determine an equilibrium beach profile closest to the natural foreshore slope. A gravel
beach mix with median grain size of 1.5 inches was selected at the south beach area in West
Waterway, in the shipway, and small intertidal dredge area adjacent to Pier 25. Over the gravel
beach mix, finer fish mix will be placed to enhance the gravel beach mix and provide a substrate
beneficial to salmonids and other Site-specific aquatic organisms.
In Puget Sound, forage fish are a significant part of the prey base for sea birds and fish populations,
including salmonids identified as Site-specific aquatic organisms (Section 3.4). Forage fish
typically spawn on the upper intertidal zone, approximately between mean tide level and mean
higher high water (MHHW) (Herrera, 2005). Surf smelt, one of the forage fish species, spawn on
substrate ranging in size from 1 to 7 millimeters (mm) in diameter, a size range commonly referred
to as “coarse sand” (2 mm to 5 mm) or “pea gravel” (6 mm to 16 mm). Suitable habitat substrate

July 2018 Revised Final (100 Percent) Design Report Page 6-3
mix gradation as reported in Puget Sound will be incorporated into the gradation and specifications
for the fish mix.
Import backfill material gradation and chemistry testing will be required before acceptance of
materials. Procedures for testing and acceptance of backfill are presented in the Field Sampling
Plan (Appendix P). Pre-construction quarry sampling will be used to determine if the source of
proposed fill materials meets the required specifications and that the levels of contaminants of
concern (COCs) are either undetected or below concentrations that would be deleterious to marine
life when placed in the marine environment. Acceptable levels of contamination are concentrations
below the Cleanup Levels for metals and organics (except PCBs). PCBs must be undetected at the
reporting limits in Table 1.
6.2.2 Placement Methodology
Intertidal backfill will be placed using derrick barge. Work will be planned around the tide
fluctuations to complete the construction. Grading of intertidal backfill is required to achieve
slopes and design thickness specified on the drawings. Subtidal backfill in the former shipway will
be placed by low-energy methods controlling the mass rate and velocity of the material delivery
so it minimally disturbs the substrate, as detailed in the Excavation, Dredging, and Backfill Plan
(Appendix L). The preferred method of placement in the shipway is to drop the material from
above the water surface while swinging the derrick. This method will allow discrete particles to
fall through water column and land on the bottom as opposed to landing in a mass. If elevated
turbidity precludes the release of the ENR and RML from the water surface, then near-bottom
release of the material may be conducted.
6.3 RML AND ENR LAYER PLACEMENT
The primary purpose of placing the dredge residual management layer (RML) and ENR layer is to
provide a clean 6-inch layer of imported material that promotes colonization by aquatic organisms.
In subtidal areas where dredging occurs, placement of the RML will address potential redeposition
of suspended or dislodged contaminated sediment onto sediments during dredging operations. In
areas where dredging does not occur (i.e., the remainder of the subtidal area), placement of an
ENR layer will promote colonization by aquatic organisms. Approximately 9,500 cubic yards (cy)
of RML material will be placed over about 12 acres of dredged area. Note that the rest of the

July 2018 Revised Final (100 Percent) Design Report Page 6-4
dredged area (about 3 acres) includes intertidal dredging and dry dock slopes where either will be
backfilled to the grades (at south beach, adjacent to Pier 25 and shipway) or riprap placed (over
the dry dock dredge slopes). Approximately 18,600 cy of ENR material will be placed over 23.1
acres of the project area that are not being dredged. Refer to Table 12 for preliminary design RML
and ENR placement quantities.
The total ENR and RML material placement within the navigation channel will be 8,600 cy over
10.7 acres. Approximately 950 cy of the 8,600 cy of RML and ENR material will be placed at an
area of 0.65 acre at depths shallower than the authorized channel depth of -34 feet MLLW. After
the construction is completed, the area within the navigation channel shallower than -34 feet
MLLW will be approximately 1.2 acres. Currently, about 1.4 acres of 10.7 acres of the project area
within the navigation channel is shallower than the authorized channel depth of -34 feet MLLW
(see Section 408 Substantive Compliance Memorandum in Appendix B).
6.3.1 RML and ENR Material Specifications
The Contractor selected materials that meet the project’s quality requirements from an existing
commercial source or sources. Sand will consist of clean, naturally occurring rounded or sub-
rounded, well-graded material free from deleterious substances, having hard, strong, durable
particles free from adherent coating and free from clay balls, debris, wood, organic matter, and
other extraneous material. Both RML and ENR material will be graded so that the material is
classified as sandy soil in accordance with ASTM International D2487. Gradation and chemistry
testing will be required before acceptance of materials. The grain-size specifications for the RML
and ENR material are provided in Appendix R. Pre-construction quarry sampling will be used to
determine if the source of proposed fill materials meets the required specifications and that the
levels of COCs are either undetected or below concentrations that would be deleterious to marine
life when placed in the marine environment. Acceptable levels of contamination are concentrations
below the Cleanup Levels for metals and organics (except PCBs). PCBs must be undetected at the
reporting limits in Table 1.
6.3.2 RML and ENR Placement Methodology
The placement of material will generally occur starting at lower elevations and working to higher
elevations. Low-energy placement methods applicable to subtidal backfill of shipway area will be

July 2018 Revised Final (100 Percent) Design Report Page 6-5
used for placement of RML and ENR layers. The preferred method of placement of the RML and
ENR material is to drop the material from above the water surface while swinging the derrick. This
method will allow discrete particles to fall through water column and land on the bottom as
opposed to landing in a mass. If elevated turbidity precludes the release of the ENR and RML from
the water surface, then near-bottom release of the material may be conducted.
The contractor may need to utilize specialized equipment to achieve placement the ENR layer
under or through Piers 23, 24, and 25. Intertidal backfill placement methodology will be applicable
for placement of RML and ENR layers in shallower areas and will require planning the work based
on the tidal fluctuations to complete the construction.
6.4 PLACEMENT VERIFICATION
Placement will be verified as specified in the CQAP (Appendix D). A pre-placement and post-
placement bathymetry survey will be completed to document the placement. A combination of
bathymetry and “rain gauge” buckets will be used to confirm that the layer thickness meets the
design.
Ballasted “rain gauge” buckets will be placed within the decision units (DUs) prior to placement
of the RML and ENR backfill. After backfill placement, the buckets will be retrieved and the depth
of backfill material in the buckets will be measured. An average of the depth of backfill material
in the buckets will be used as the average depth of backfill coverage for the placement. Acceptance
of backfill placement will be based on backfill material being placed to meet design specifications
within each DU. Proper backfill placement will be confirmed based on the following:
Depth of backfill in the “rain gauge” buckets in the placement area
Rain gauge buckets will be placed on the dredged surface at a density of approximately two per
Dredged Material Management Unit (DMMU). The depth in the material in the rain gauge buckets
will meet the following criteria in flat areas (i.e., not on dredge slopes steeper than 3H:1V):
all rain gauge buckets must have a minimum of 4 inches of RML and
the average of all buckets must be a minimum of 6 inches
In areas where there are slopes steeper than 3H:1V, all rain gauge buckets must have a minimum
of 3 inches of RML or ENR material.

July 2018 Revised Final (100 Percent) Design Report Page 6-6
6.5 ENR AND RML EFFECTIVENESS
The placement of the ENR and RML layers will address surface sediments contaminant
concentrations by reducing the exposure for benthic organisms. It is expected that the ENR and
RML material will mix with the existing surface sediments or dredge residuals and will reduce
chemical concentrations. As specified in Field Sampling Plan (Appendix P), additional ENR or
RML material beyond the initial placement will be placed if the ENR or RML do not initially meet
performance standards.

July 2018 Revised Final (100 Percent) Design Report Page 7-1
SECTION 7 SHORT-TERM ENVIRONMENTAL
CONTROL MEASURES
This section describes measures that will be taken to ensure that the remedial construction does
not adversely impact human health and the environment. These measures are also discussed in
Sections 4, 5, and 6 where relevant to specific actions related to the piling, debris, and sediment
removal activities. Short-term environmental impacts of construction will also be mitigated by
implementing best management practices (BMPs). Short-term environmental control measures
and construction BMPs (Appendix J) are summarized in this section.
7.1 SHORT-TERM WATER QUALITY IMPACTS
The Washington Water Pollution Control Act—State Water Quality Standards for Surface Water
(Revised Code of Washington [RCW] 90.48; Washington Administrative Code [WAC] 173-
201A) establishes permitting requirements for point source discharges to surface waters of
Washington State. Based on the use designations of surface waters within the jurisdiction of the
State, numeric water quality parameters and narrative criteria are assigned to a water body to
protect the existing and designated uses. The Water Quality Monitoring Plan (WQMP)
(Appendix M) defines monitoring that will be used to determine compliance with surface water
standards.
Criteria pertaining to marine waters of “Excellent Quality” (WAC 173‐201A‐210; Specific
Classifications—Marine Waters) designated for waters with salmonid and other fish migration,
rearing, and spawning; clam, oyster, and mussel rearing and spawning; crustaceans and other
shellfish (crabs, shrimp, crayfish, scallops, etc.) rearing and spawning are applicable to this project.
The WQMP (Appendix M) describes water quality monitoring during construction and further
sampling and laboratory analysis methodology. In-water construction activities include dredging
of sediments and barge dewatering, removal of pilings and debris, backfilling, residual

July 2018 Revised Final (100 Percent) Design Report Page 7-2
management layer (RML) placement, and enhanced natural recovery (ENR) layer placement in
the dredged area.
Field monitoring of turbidity, dissolved oxygen (DO), pH, and temperature will take place at the
edge of the compliance zone, at an early warning location, and in background (upstream, as
adjusted for the tides) locations during in‐water activities. Water samples may also be collected
for laboratory analysis of sediment contaminants of concern (COCs) and total suspended solids
(TSS), if required by the Section 401 Water Quality Memorandum that will be issued by the United
States Environmental Protection Agency (USEPA). The frequency of sampling and analysis will
be specified in the WQMP.
The anticipated criteria specified in WAC 173‐201A‐210 are summarized below:
Temperature—Per Table 210 (1)(c), the temperature must be below 16 degrees Celsius (°C) for excellent quality aquatic life.
DO—Per Table 210 (1)(d), the lowest 1-day minimum must exceed 6.0 milligrams per liter (mg/L) at the point of compliance. When DO is lower than the criteria in Table 210 (1)(d) (or within 0.2 mg/L of the criteria) and that condition is due to natural conditions, then human actions (i.e., construction) may not cause the DO to decrease more than 0.2 mg/L.
Turbidity—Per Table 210 (1)(e), turbidity must not exceed 5 nephelometric turbidity units (NTU) above background when background turbidity is 50 NTU or less. If background turbidity is greater than 50 NTU, turbidity cannot be increased more than 10 percent above background.
pH—Table 210 (1)(f) states that pH must be between 7.0 and 8.5.
COCs—At the points of compliance, COC concentrations shall not exceed the numeric toxic substances acute and chronic criteria for marine waters (WAC 173‐201A‐240).
The WQMP (Appendix M) details further water quality monitoring requirements to confirm
compliance with water quality standards (as defined by substantive requirements of the Clean
Water Act 401/402 ARAR Memorandum) during in-water construction.
Response actions to water quality criteria exceedances are detailed in WQMP (Appendix M) and
summarized below.
If there is an exceedance of the turbidity criterion during dredge monitoring, the construction team
will review the documented operations at the time of the exceedance to determine whether

July 2018 Revised Final (100 Percent) Design Report Page 7-3
dredging, debris or pile removal, or a non-project activity was occurring and the likely cause(s) of
the excess turbidity. Based on this determination, the construction team may institute one or more
of the following or other best management practices detailed in Appendix J:
1. The dredging process may be adjusted and may include decreasing the velocity of the bucket through the water column and pausing the bucket above the bottom before dredging.
2. Modifying excavator bucket movement over dredge material barge to dislodge material that may adhere to the bucket.
3. Modifying the positioning of barges to maximize draft (prevent grounding).
4. Modification to dredged material barge loading to prevent material spillage.
5. Using the adaptive management process adjust the problem activity in conjunction with discussions with USEPA and monitoring to confirm that the cause of the exceedance has been addressed.
If there is an exceedance of an acute or chronic chemical criterion, USEPA will be consulted as
soon as practicable to determine an appropriate course of action which may include additional
water sampling to determine if there is a continuing exceedance. In addition, construction methods
will be reviewed to determine if modifications are necessary.
7.1.1 In-Water Work Window
In-water work will be performed consistent with the joint regulatory agency-approved fish
protection work windows mitigating salmonid exposure to turbidity and other contaminants by
allowing in-water work to occur only within the Elliott Bay work window (August 1 through
February 15). The final work window will be defined and coordinated in consultation with the
resource agencies and Suquamish and Muckleshoot Tribes before implementation.
7.1.2 Turbidity Control BMPs
Physical conditions at the Site are not likely to affect water quality during remedial construction.
Please refer to the Final Remedial Investigation/Feasibility (RI/FS) for details of currents, tides,
and wave influences in Elliott Bay (Tetra Tech, 2012).
Dredging can result in short‐term turbidity in the water column. Excessive turbidity can be due to
inadequate operator control of the bucket during dredging, bank or side-slope sloughing, scour of

July 2018 Revised Final (100 Percent) Design Report Page 7-4
sediment that sticks to or is captured on the outside of the bucket, and/or release of sediment due
to debris preventing tight closure of the bucket.
Turbidity and other water quality parameters will be monitored to ensure construction activities
are in compliance with Washington State Surface Water Quality Standards (WAC 173-201A), as
specified in the WQMP (Appendix M). Appropriate BMPs will be employed to minimize sediment
loss and turbidity generation during dredging. These are summarized in Sections 7.2 and 7.4, and
detailed in Appendix J.
7.2 EROSION AND SEDIMENT CONTROLS
The work includes implementing erosion and sedimentation control measures, including
stormwater pollution prevention measures to prevent debris, dredged sediment, and contaminated
stormwater from entering the West Waterway and Elliott Bay.
Measures to limit shoreline erosion and sedimentation are provided in the Erosion and
Sedimentation Control Plan (Appendix S). The Dewatering Plan (Appendix N) presents
procedures for the handling excess water that collects within the barge during dredging.
The Contractor will be prepared to install turbidity curtains at appropriate locations to limit
suspended sediment transport and to help meet the water quality requirements, as directed by the
Construction Manager. The curtains will be supported by floats at the top (to keep the top of each
silt curtain above the water surface) and weights at the bottom. The curtains would extend
approximately 5 feet below the water surface. The curtains will only be installed if necessary and
as directed by the Construction Manager based on observed conditions. Full-depth silt curtains are
not practicable at the site due to prevailing currents and tidal exchange.
The following measures will be implemented during intertidal zone construction:
Shorelines will not be used as a staging area for storing construction materials or stockpiling.
Activities will be conducted to minimize siltation of the beach area.
Intertidal backfill will be placed in a manner that will avoid erosion and siltation to the maximum degree possible.

July 2018 Revised Final (100 Percent) Design Report Page 7-5
Majority of intertidal areas (i.e., south beach, adjacent to Pier 25, and shipway) to be dredged are below 0 feet MLLW and permanently inundated between the tidal cycles. The contamination depth in the portions that are exposed to tidal cycles are shallow enough that dredging of contaminated sediment can be completed during a single tidal cycle, pending confirmation sampling. As a BMP, geotextile fabric or granular backfill may be placed over intertidal dredged areas if needed to reduce resuspension and to comply with the project’s water quality requirements. The use of measures to reduce potential resuspension will depend upon prevailing conditions at site. High wave conditions may limit use of such methods.
7.3 NOISE, AIR QUALITY, AND ODOR CONSIDERATIONS
Ambient air quality requirements for the Puget Sound region are governed by the Puget Sound
Clean Air Agency (PSCAA). Air quality monitoring, if required in the Contractor’s Health and
Safety Plan (CHASP), will be performed to protect on-site workers during construction to ensure
compliance with these standards. Temporary erosion and sediment control BMPs will be employed
to prevent air pollution. Dust particles and odors from project activities will be controlled at all
times, including weekends, holidays and hours when work is not in progress.
Seattle Municipal Code (SMC) Chapter 25.08 restricts maximum permissible sound levels for
sound sources located within the City of Seattle. Refer to Section 2.5.3 for sound level restrictions
during construction.
The CHASP will describe measures to be taken and the methods for ensuring that the applicable
standards are met. The CHASP will also describe how community members can voice
complaints/comments during construction.
The transload facilities are aware of the potential for odors emanating from the dredged material
to be a potential nuisance. Although neither transload facility has experienced nuisance odor
complaints, measures to address odor complaints will be developed on a case-by-case basis.
7.4 CONSTRUCTION BMPs
BMPs to be utilized for the implementation of the project are provided in Appendix J and are
summarized here for each separate construction activity.

July 2018 Revised Final (100 Percent) Design Report Page 7-6
7.4.1 Pile Removal BMPs
The following pile removal BMPs are adapted from the USEPA (USEPA, 2016) and Washington
Department of Natural Resources (DNR, 2017) guidance documents.
Prior to commencement of the work, the project engineer or contractor should assess the condition of the pilings, and identify whether pilings will be removed using a barge or upland equipment. The contractor’s work plan must include procedures for extracting and handling pilings that break off during removal. In general, complete extraction of pilings is always preferable to partial removal.
Any longitudinal and transverse beams connecting the pilings will be removed prior to pile removal.
The contractor will initially vibrate pilings to break the friction bond between pilings and soil.
To help minimize turbidity, the contractor will engage the vibrator to the minimum extent required to initiate vertical pile movement, and will disengage the vibrator once pilings have been mobilized and are moving upward.
The pilings will be removed in a single, slow, and continuous motion to the extent possible.
Upon removal from the substrate, pilings will be moved expeditiously from the water to a barge and then offloaded for disposal or recycling if possible.
Pilings should be removed slowly and in a direction that is an extension of the longitudinal centerline of each piling to minimize the disturbance of the bed and the suspension of contaminated sediments into the water column.
Extracted pilings will be placed immediately in a containment basin constructed on the barge or adjacent upland to capture and contain the extracted pilings, adhering sediments, and water.
The extracted pilings will not be shaken, hosed off, left hanging to drip, or made subject to any other action intended to clean or remove adhering material from the pilings.
Pile cutoff will be an acceptable alternative where vibratory extraction or pulling is not feasible as described below. In addition, if a piling is broken or breaks during vibratory extraction, the contractor will employ the following methods:
A chain will be used if practicable to attempt to entirely remove the broken piling.
If the entire piling cannot be removed, the piling will be cut at the mudline or dredge elevation as designated in the plans.

July 2018 Revised Final (100 Percent) Design Report Page 7-7
Pile cutoff can be an acceptable alternative in areas where removal of the existing pilings may result in adverse impact to stability.
Generally, pilings should be cut off at the mudline if sediments are contaminated and the mudline is subtidal, to minimize disturbance of the sediment. If the piling breaks at or near the existing substrate and cannot be removed by other methods, the piling will be cut at dredge elevation using a pneumatic underwater bucket, a clamshell bucket, or another type of equipment to be selected by the Contractor. Sediment will be excavated from around the broken piling using a clamshell bucket. The operator will carefully remove sediment from around the perimeter of the piling as practicable.
Repeated attempts to remove pilings with a clamshell bucket (i.e., “grubbing”) should not occur in contaminated sediments.
Pilings should be cut off at lowest practical tide condition and at slack water. This is intended to reduce turbidity due to reduced flow and short water column through which pilings must be withdrawn.
Hydraulic jetting devices should not be used to move sediment away from pilings, in order to minimize turbidity and releases to the water column and surrounding sediments.
If a piling cannot be removed or breaks off at or near the existing substrate, then the piling should be cut off using a pneumatic underwater bucket, a clamshell bucket, or another type of suitable equipment at dredge elevation. Every effort should be made to properly size the bucket to the job and operate it in ways that minimize sediment disturbance. Areas where pilings are cut off will be covered with USEPA-approved materials to contain the remaining contamination associated with the pilings.
Cut-off pile stubs will be captured whenever feasible, removed, and deposited in the containment basin constructed on the barge or adjacent upland.
Sawdust from cutting pile stubs should be captured whenever feasible, removed, and deposited in the containment basin constructed on the barge or adjacent upland.
A floating surface boom should be installed around the pile extraction site to capture floating piling debris. Floating piling debris will be removed and deposited in a containment basin constructed on the barge or adjacent upland.
The floating surface boom will be equipped with absorbent pads to contain any oil sheens. The absorbent pads will be removed and deposited in the containment basin constructed on the barge or adjacent upland.
A containment basin will be constructed on the barge deck or adjacent upland to receive the pilings, pile stubs, water, sawdust, and any sediment.
The containment basin should be constructed of durable plastic sheeting with sidewalls supported by hay bales or support structure.

July 2018 Revised Final (100 Percent) Design Report Page 7-8
To the extent possible, pile extraction should be conducted during periods when the water currents are low.
The pilings, pile stubs, sawdust, and absorbent pads from the floating surface boom will be removed and disposed of in accordance with applicable federal and state regulations.
The water captured in the containment basin will be removed and disposed of in accordance with the USEPA Water Quality Memo.
The containment basin will be removed and disposed of in accordance with applicable federal and state regulations.
Extracted pilings within the containment basin or disposal container will be cut to size as required by container and disposal contractors. All sawdust and cuttings will be contained within the containment basin or disposal container.
The cut-up pilings, sediments, sawdust, water, absorbent pads from the floating surface boom, and plastic from the containment basin will be packed into a disposal container and transported to an approved upland disposal site.
7.4.2 Spill and Pile Removal Debris Containment
The following BMPs will be employed during pile removal to contain potential spills and debris
that are generated.
Prior to starting any pile removal work, a floating debris boom will be deployed and installed around the clusters of timber pilings (or around a specific area of pilings) to be removed. The debris boom will be spread out adequately to allow it to capture or trap debris falling into and/or floating up onto the water during pile removal activity. Absorbent booms shall be used as needed to manage any observed sheen. The boom will stay in place until any sheen present from removed pilings has been absorbed by the boom. Any longitudinal and transverse beams connecting the pilings will be removed prior to pile removal.
The containment boom around the pile removal area will be appropriately positioned and anchored/tied off.
The boom shall be located at a sufficient distance from all sides of the pile removals to capture pile removal materials and debris.
The work surface on the debris barge deck will include a containment area for all pilings and sediment removed during pile pulling. The barges will have watertight fences composed of ½-inch steel plate, 5 feet in height, or similar as approved by the Project Manager.
Potentially contaminated water will be prevented from re-entering the water once a piling is placed on the barge. Uncontaminated water runoff from outside the containment area

July 2018 Revised Final (100 Percent) Design Report Page 7-9
can return to the waterway. Oil-absorbent materials will be used to remove sheen on the rain or other water inside the contained barges.
Water collected within the containment area will be managed as specified in the USEPA Clean Water Act 401/402 ARAR Memorandum (Water Quality Memo) and the Construction Water Management Plan (Appendix O), which will reflect the requirements of the Water Quality Memo.
Timber pilings will be promptly placed into the barge containment area following removal.
Debris trapped by the deployed debris boom will be collected at the end of each work day or immediately if waters are rough and there is a chance that the debris will escape the boom.
Debris trapped by the deployed debris boom will be transferred onboard the barge into the containment area.
Creosote sheen (generated by extracted creosote timber pilings) trapped in the deployed boom will be collected (using oil-absorbent pads).
7.4.3 Dredged and In-Water Material Placement Operation Control Best Management Practices
The overall goal of the dredging best management practices (BMPs) is to limit the dispersion of
contaminated sediments and the development of dredge‐related residuals while removing the
impacted sediments. In-water residual cover and enhanced natural recover material BMPs will be
utilized to control resuspension of sediments.
7.4.4 Excavation and Dredging BMPs
The following BMPs will be implemented during excavation of the shoreline and during dredging.
7.4.4.1 Shoreline Excavation
The following BMPs will be implemented during shoreline construction.
Check predicted weather for wind or storm conditions that could create large waves. Schedule work for periods predicted to not have high wind or storm events. Monitor weather conditions during performance of work.
Shorelines will not be used as a staging area for storing construction materials or stockpiling.
Shoreline debris will be “picked” piecewise to the extent practical (as opposed to scraping) to reduce beach disturbance.

July 2018 Revised Final (100 Percent) Design Report Page 7-10
Activities will be conducted to minimize siltation of the beach area.
Intertidal backfill will be placed in a manner that will avoid erosion and siltation to the maximum degree possible.
Equipment working in the intertidal zone will operate at least 2 feet back from the actual water line at all times.
Shore-based construction equipment will be kept out of the water at all times.
If any excavation work must be done and requires more than one tidal cycle, then the excavation will be covered with plastic sheeting or geotextile fabric to reduce sediment resuspension during the time that the excavation is inundated, as practicable.
Clear paths of egress from the intertidal area will be maintained at all times.
The construction contractor will be responsible for ensuring that recovery options are available to retrieve equipment that breaks down in the intertidal area before the equipment becomes inundated.
All vehicles, equipment, and petroleum product storage/dispensing areas will be inspected regularly to detect any leaks or spills, and to identify maintenance needed to prevent leaks or spills.
Spill prevention measures, such as drip pans, will be used when conducting maintenance and repair of vehicles or equipment.
If emergency repairs on site are needed, temporary plastic will be placed beneath and, if rain is falling, over the vehicle.
Contaminated surfaces shall be cleaned after any discharge or spill incident following the procedures presented in Appendix K.
Fueling activities will occur in contractor staging areas away from Elliott Bay and the Lower Duwamish Waterway to reduce the potential of a petroleum release to Waters of the State.
Spill prevention and cleanup kits will be provided by the construction contractor and placed in easily accessible locations.
7.4.4.2 Dredging
The following BMPs will be implemented during dredging.
The work will limit migrating salmonid exposure to turbidity by allowing dredging to occur only within the Elliott Bay work window (August 1 to February 15). Allowable turbidity range will be defined in the USEPA Clean Water Act 401/402 ARAR Memorandum.

July 2018 Revised Final (100 Percent) Design Report Page 7-11
Maneuvering of tugs and barges will be kept to the minimum necessary for safe and efficient operation of the dredging and transloading activities to avoid resuspension of sediments due to prop wash.
A pre-dredge survey will be conducted to identify potential debris that may interfere with bucket operation.
Dredge operators will use deliberate and consistent bucket speeds.
The bucket will be paused at the water surface to maintain sediment capture.
Bucket descent will be slowed at least 3 feet above the sediment surface to limit disturbance.
The grounding of barges will be prohibited.
Scour will be minimized by controlling minimal depths for vessel draft and movement.
Glory holing will not be allowed.
Dredge buckets will not be overfilled.
No bottom stockpiling will be allowed.
Leveling of the dredge surface by dragging/sweeping the bucket will not be allowed.
The loaded bucket will be retrieved from the bed at a slow and continuous rate.
The passage of the bucket over open water prior to release of sediment from the bucket into the haul barge will be limited.
Once the bucket is above the water line it can only be opened on the barge.
Barges will not be overloaded; sediment will not spill over the edges of the barges or be above the sidewalls at any time during transit.
Dredging will occur from higher to lower elevations to reduce the potential for sloughing.
Stable cut slopes will be maintained during dredging to reduce the potential for sloughing.
Multiple bites with the dredge bucket will not be allowed.
An environmental bucket will be used to the extent practicable (e.g., use of digging bucket for hard-to-dredge substrate) to reduce the potential for suspension of contaminated sediment during dredging. A sub‐foot geographical positioning system will be used for accurate bucket positioning.

July 2018 Revised Final (100 Percent) Design Report Page 7-12
A grapple or standard clamshell bucket might be most effective at removing denser materials and debris prior to or during dredging. A modified digging or grapple bucket may be required to remove submerged and surface debris and may also be needed for removing denser substrate.
Dredged material will be placed on a barge immediately after removal for gravity dewatering or removal of ponded water by pumping. All water will pass through a filter medium prior to discharge into Elliott Bay.
7.4.4.3 In-Water Backfill Placement BMPs
For placement of ENR material and residual cover layers, the following measures will be followed.
Above-Water Placement:
Material will generally be placed from above water surface as approved by USEPA, using a clamshell bucket in areas where access allows and a telebelt or other method in areas of reduced access such as under piers.
Perform test cap placement surveys to calibrate procedures.
When using a clamshell, the bucket will be open slowly while swinging the bucket thru a predetermined arc to spread the material.
Placement equipment will be equipped with suitable navigation equipment to plan and track placement.
Perform ongoing monitoring of placement to calibrate and adjust procedures as necessary.
Do not use spuds or anchors within areas where ENR material or an RML has been placed to the extent practicable.
Near-Bottom Placement (if above-water placement is not allowed):
Perform test cap placement surveys to calibrate procedures.
Slow the bucket lowering at the water surface and near bottom.
Do not use spuds or anchors within areas where ENR material or an RML has been placed to the extent practicable.
7.4.5 Barge Operations BMPs
General barge operation BMPs are provided below.
Construction barges will be restricted to tidal elevations adequate to prevent grounding of the barge.

July 2018 Revised Final (100 Percent) Design Report Page 7-13
Due to the size of the site and water depths, anchoring in contaminated sediment will need to be accommodated.
If spudding within the PSR RNA, spud locations will be recorded by the Navigation and Positioning System. A nominal thickness of 6 inches of ENR material will then be placed over the area of each spud placement (assuming a 10-foot-diameter circle centered on spud location) by uniformly spreading a volume equivalent to a one-foot thick layer over the area (approximately 3 cubic yards).
Anchoring or spudding within the regulated navigation area will be reduced to the extent practicable and will be discussed with USEPA in advance. Written advance notification to USEPA and the Capitan of the Port (COTP) is required.
Dewatering is not allowed while in transit.
Vessel operation will be restricted to tidal elevations adequate to prevent prop scour disturbance to the contaminated sediments.
Limited, safe propulsion power will be used when maneuvering barges or other vessels to prevent prop scour disturbance to the contaminated sediments.
7.4.6 Sediment Transloading Facility and Disposal Best Management Practices
Dredged material will be placed on haul barges and transported to a permitted sediment
transloading facility. The debris to be encountered during the dredging will range in size and will
be managed with the sediment. There may or may not be a dewatering operation associated with
the transloading facility. Any water from the barge and sediment stockpiles at the transloading
facility will be treated at the facility’s on-site wastewater treatment system in compliance with the
facility’s discharge permit and all appropriate rules and regulations.
Best management practices (BMPs) to ensure the clean and safe transfer of materials at the
transloading facility will be required prior to any handling of sediment. The goals of the BMPs
include:
No spilling of contaminated material into surface water.
No tracking of contaminated material off site or into any area where it may contact water that would be uncontrolled by containment.
No dewatering into the waterway from the barge at the transloading site.

July 2018 Revised Final (100 Percent) Design Report Page 7-14
Preventing material spilling from the truck or train during transport from the transfer facility to the disposal facility.
Specific BMPs for the transloading facilities include:
Loading of sediment and debris into lined intermodal containers will be performed in lined containment areas.
The transloading facilities will be permitted through its industrial Stormwater Pollution Prevention Plan to operate as a transload facility.
Containment areas will be designed so that dewatering water from the transloading operations can be collected separately from other site stormwater.
The dewatering water collected from transloading operations will be disposed of with the other waste generated from the site (included with the sediment for disposal) or sampled, treated, and discharged in accordance with approved permits of the transload facility or disposed at a licensed commercial facility.
Rail cars or trucks will be water tight if the sediment does not pass the paint filter test (Method 9095).
The sides of trucks or rail cars will be protected with shields or spill aprons from waste material that may drop prematurely from transfer buckets.
If not covered securely, trucks or rail cars will not be filled completely, such that a sufficient minimum free board distance will be maintained to prevent overflow.
Inside the transload facility, material deflected from spill aprons will land on secondary containment areas.
Transload facility will be designed with a spill apron to prevent material from falling into the water between the barge and the dock.
The apron must be made of impermeable material and not have seams that would allow leakage into the water.
The apron will collect material dripped from the clamshell, including rainfall, and route it back into the barge or into dock-side containment structure.
The spill apron must be wide enough that material will not fall off the sides and may include wing walls to increase the level of protection.
Material shall not be allowed to accumulate on the spill apron.
The apron must be able to track up and down with the barge during tidal fluctuations in order to prevent separation of the apron from the barge.

July 2018 Revised Final (100 Percent) Design Report Page 7-15
Before moving the crane/excavator, the spill apron and bucket must be decontaminated with a pressure washer and the water captured and contained. Wash water will not be left on the barge.
If solidification/stabilization agents are being used to reduce the spreading of material through splash and dripping, indicate what stabilizer, mixing locations, etc.
The facility must be able to keep the barge tied up close to dock during tidal fluctuations
Decking and all surfaces that can come in contact with dredged sediment and associated water must be made of solid (no slats) impermeable materials.
The travel of buckets used to transfer sediment from barges to trucks or rail cars will be limited such that they are always above the barge, the spill apron, or a lined loading area.
The operator of the equipment used to remove material from the transport barge is required to maintain the swing path of the transfer bucket over the spill apron and dump the transfer bucket in such a way that splashing is minimized.
The operator of the equipment used to load railcars and/or trucks will be required to maintain the swing path of the transfer bucket over a spill apron and to load the railcars and/or trucks in such a way to minimize splashing.
The loading areas will be inspected following loading of each truck and/or railcar. Any spilled material will be promptly cleaned up to minimize tracking of impacted material.
Trucks and rail cars will be thoroughly inspected before the truck or rail car is cleared to leave the containment pad.
Trucks or rail cars will not be overloaded. Underloading may be required to ensure that loss from sloshing does not occur.
The transload area and all equipment used in transloading will be cleaned at a minimum at the completion of the project.
A wheel wash must be installed if sediment is getting on the deck (dock) where trucks or other vehicles are passing through.
Wheel-wash water cannot be allowed to enter surface waters or storm drains. Wheel-wash wastewater must be collected and hauled off for proper disposal or routed to a sanitary sewer with proper local sewer district approval.

July 2018 Revised Final (100 Percent) Design Report Page 8-1
SECTION 8 PROJECT PERMITTING AND SITE ACCESS
This section demonstrates how the project will comply with the permitting requirements identified
in the design and address any real property and easement requirements. Substantive compliance
with applicable permitting requirements was addressed in Section 2 and is summarized below. A
Permitting and Site Access Plan is presented in Appendix T.
8.1 COMPLIANCE WITH ARARs AND TBCs
Substantive compliance with applicable or relevant and appropriate requirements (ARARs) and
to-be-considered criteria (TBC) does not include formal submission of permit applications to the
agencies to provide permits or approvals. Instead, information sufficient to demonstrate
compliance with the requirements will be presented to the United States Environmental Protection
Agency (USEPA) and coordinated with other agencies. Regulatory requirements, project-specific
notes to explain how these regulations apply to the project and how the design and construction
will substantively comply with the regulations are summarized in Table 13 and detailed in the
Permitting and Site Access Plan (Appendix T).
8.2 ACCESS AGREEMENTS
Lockheed Martin Corporation (Lockheed Martin) will coordinate all work elements with the Port
of Seattle (Port). The Lockheed West Seattle Superfund Site (Site) is accessible from the water.
Dredging in Port-owned tidelands and the Port-managed harbor area, and access to the Port
shoreline will be under the terms of a Site Access Agreement signed by the Port and Lockheed
Martin.
Similarly, Lockheed Martin will coordinate with Washington State Department of Natural
Resources (DNR) for the in-water construction work within the DNR-managed harbor area of the
Site. An access agreement with the DNR will be in place before construction.

July 2018 Revised Final (100 Percent) Design Report Page 8-2
8.3 OTHER AGREEMENTS
The Site is within the “Usual and Accustomed” fishing area of both the Suquamish and
Muckleshoot Indian Tribes. Lockheed Martin will coordinate with the Tribes to attempt to
maintain an active fishing presence around the Site from July to December. The Tribes have
indicated that a written agreement will likely be required. This agreement will remain active for
the duration of the project and serve as a basis for coordinating project construction activities with
treaty‐reserved fishing access.
8.4 VESSEL MANAGEMENT
The Vessel Management Plan (Appendix U) describes the various vessels used and their typical
movements during performance of the remedial action. This plan will be provided to the
Muckleshoot and Suquamish Tribes to assist in reducing potential impacts to Tribal fishers.

July 2018 Revised Final (100 Percent) Design Report Page 9-1
SECTION 9 CONSTRUCTION SCHEDULE, SEQUENCE,
AND COST ESTIMATE
This section discusses the main construction elements, preliminary construction schedule,
contracting strategy, construction sequence, and construction cost estimates of the project. Prior to
initiation of in-water work, coordination with the United States Environmental Protection Agency
(USEPA) will be done, such as readiness review meetings and site inspections, to ensure proper
implementation of the approved work plans.
9.1 CONSTRUCTION SCHEDULE
The proposed Project Implementation Schedule is provided in Appendix V. The enforceable
schedule per the Unilateral Administrative Order (UAO) is to complete construction in early 2021.
However, the current plan is to complete work in advance of this deadline. It is expected that
construction will be completed in one in-water construction season in late 2018/early 2019. It is
possible that other project constraints or a revised approach will modify this schedule. If this
occurs, Lockheed Martin will submit a revised schedule to USEPA in a timely manner, with an
explanation of the circumstances requiring the revision and the steps Lockheed Martin took to
minimize any changes to the schedule.
The schedule is based on the in-water work window and the assumptions that all necessary
approvals can be obtained prior to initiation of the work. The final in-water work window will be
defined and coordinated in consultation with the resource agencies and the Tribes before
implementation. The in-water work window is anticipated to occur from August 1, 2018, to
February 15, 2019.
9.2 CONSTRUCTION SEQUENCE
The anticipated on-site construction sequence is summarized in this section. Some activities can
be performed simultaneously. The sequence is subject to change per the Contractor’s planned
operations and the detailed construction schedule. Proper planning and successful completion of

July 2018 Revised Final (100 Percent) Design Report Page 9-2
each task are essential to implement the project within the schedule. The design documents will
be finalized and approved by USEPA per the project schedule before any on-site work begins.
Prior to beginning in-water work, there will be coordination with USEPA, such as readiness review
meetings and site inspections, to ensure proper implementation of the approved work plans.
It is anticipated that the remedy will be completed in a single season. The anticipated construction
sequence is described in the following subsections. The preliminary schedule for the work is
provided in Project Implementation Schedule (Appendix V).
9.2.1 Preliminary Field Work
The first step will be to complete the procurement process for all aspects of the field effort. In
addition, utility clearances along the shoreline will be completed prior to mobilization. Following
that site mobilization will be initiated. Mobilization will include:
Coordinate with Port, United States Coast Guard, United States Army Corps of Engineers, transloading facility, landfill facilities.
Perform preliminary site reconnaissance activities including site access coordination and permitting.
Establish infrastructure necessary for field operations.
Deliver materials/supplies, equipment, and personnel to the project site.
Verify rail/truck haul routes
Prepare removal area site, including installation of in-water environmental controls, temporary erosion and sediment controls, and utility coordination.
Complete pre-removal bathymetric survey to establish baseline conditions.
9.2.2 Remediation
The key steps involved in site remediation are listed below.
Debris and Pile Removal and Disposal: Debris removal along the shoreline will be one of the lead items. The Debris/Pile Removal and Support System Plan (Appendix I) details procedures from removal and disposal.
Sediment Removal and Disposal: The goals for this task include achieving neatline elevations with limited over-dredging and dewatering sediments. The Excavation, Dredging, and Backfill Plan (Appendix L) details procedures for sediment removal

July 2018 Revised Final (100 Percent) Design Report Page 9-3
through transloading. The Site Management Plan (Appendix K) presents details of how material will be transported from the transload facility and disposal plans. Additional sediment removal may be required if chemical performance standards are not met after achieving design dredge elevations. Testing procedures and acceptance criteria are presented in the Field Sampling Plan (Appendix P). Figure 8 shows the planned decision unit dredging sequence.
Backfill, residual management layer (RML), enhanced natural recovery (ENR) layer: ENR material will be placed over 23.1 acres of the project area that is not dredged to reduce surface-weighted average concentrations below the remedial action levels (RALs). Additional backfill will be placed within the intertidal zone and in the subtidal zone. This is detailed in the Excavation, Dredging, and Backfill Plan (Appendix L).
9.2.3 Site Demobilization
Site demobilization will include the removal of equipment and materials, removal of in-water
controls, and decontamination operations. Equipment decontamination procedures are provided in
Appendix W.
9.3 CAPITAL AND OPERATION AND MAINTENANCE COST ESTIMATES
The capital and operation and maintenance cost estimate is provided in Appendix X. Estimated
capital costs for construction and operations is $36,800,000 and the estimated maintenance cost is
$186,000, as detailed in Appendix X. The capital costs are detailed in the table below.
Scope Element Estimate Mobilization/Demobilization $740,000 Construction Management and Field Oversight
$2,736,000
Debris and Piling Removal and Disposal $1,350,000 Sediment Removal and Disposal $18,461,000 Additional Sediment Removal and Disposal $1,464,000 Backfill, Residuals Management, and ENR Layer Placement
$8,501,000
Reporting $203,000 Summary of Capital Costs $33,455,000 10% Contingency $3,345,000 Total Estimated Capital Cost: $36,800,000

July 2018 Revised Final (100 Percent) Design Report Page 10-1
SECTION 10 INSTITUTIONAL CONTROLS
Institutional controls (ICs) are one of the main work elements to address contaminated sediment
at the Site. The institutional controls for the Site are detailed in Appendix Y. There are existing
institutional controls in place for the site. These ICs include the Port of Seattle’s Terminal 5
security fencing, which limits access to the shoreline from the uplands, a regulated navigation area
(RNA) over a portion of the site that restricts anchoring (Figure 3), and a fish consumption
advisory for Marine Area 10. These ICs protect the public from over-exposure to site
contaminants; therefore, no additional ICs are required to be established as part of the remedial
action. If, based on the sampling conducted as part of the remedial action, contamination
attributable to Pacific Sound Resources (PSR) extends beyond the current PSR RNA boundaries
then the RNA would likely be expanded the larger area. An Explanation of Significant Differences
(ESD) may be developed, as determined by USEPA, that will add any PSR contamination
remaining on the Site to the PSR Superfund Site; therefore, eliminating any Lockheed Martin
responsibility for this material.

July 2018 Revised Final (100 Percent) Design Report Page 11-1
SECTION 11 LONG-TERM MONITORING AND MAINTENANCE
To ensure the long-term effectiveness of the constructed remedy, monitoring and maintenance
procedures will be required with contingency actions. The Long-Term Monitoring and
Maintenance Plan is provided in Appendix Z. The monitoring program will be conducted to
evaluate the following:
Determine if the subtidal post-construction sediment surface is at or above post-remediation elevations and
differentiate post-construction recontamination from off-site sources from remedy failure.
The post-construction monitoring at the site will include the following monitoring activities:
Bathymetric survey of the subtidal portions of the Site to confirm post-dredge slope and backfill stability after construction completion and
sediment sampling (top 10 centimeters and potential depositional material) to monitor sediment quality after completion of construction.
Since a majority of the mass of chemical contaminant concentrations above levels of concern will
be removed as part of the remedial action and residual management layer and enhanced natural
recovery materials placed to reduce the exposure for benthic organisms, it is not anticipated that
long-term maintenance of the project will be conducted unless there is significant erosion which
will be discussed with USEPA.

July 2018 Revised Final (100 Percent) Design Report Page 12-1
SECTION 12 ENVIRONMENTAL SUSTAINABILITY
The United States Environmental Protection Agency (USEPA) Region 10’s Clean and Green
Policy (USEPA, 2009) and USEPA Green Remediation strategy (USEPA, 2010, 2012) outline the
goal of comprehensively evaluating cleanup actions to ensure protection of human health and the
environment and to reduce the environmental footprint of cleanup activities to the maximum extent
possible. The Site Management Plan (Appendix K) presents the sustainable/green technologies
identified in the Clean and Green Policy (USEPA, 2009) and their potential applicability to the
planned project.
July 2018 Revised Final (100 Percent) Design Report Page 13-1
SECTION 13 REFERENCES
Elmendorf, D.L., Haith, C.E., Douglas, G.S, and Prince, R.C., 1994. Relative rates of biodegradation of substituted polycyclic aromatic hydrocarbons, in Bioremediation of Chlorinated and Polycyclic Aromatic Hydrocarbon Compounds (Hinchee, R.E., Leeson, A., Semprini, L., and Kee Ong, S., eds.), pp. 188-202, Lewis Publishers, Boca Raton.
Enviros (Enviros, Inc.), 1990. Lockheed Shipyard #2: Sediment Characterization and Geotechnical Study: Report prepared for the Port of Seattle, by Enviros, Inc., Kirkland, Washington.
Hart Crowser, 1995. Geotechnical Engineering Design Study, Southwest Harbor Project, Terminal 5 Expansion, 400 Foot Wharf Expansion, Port of Seattle, Washington: Report prepared for KPFF Consulting Engineers, by Hart Crowser, Seattle, Washington.
, 2003a. Environmental Status Report Lockheed Yard 2 Aquatic Area, Seattle, Washington: Prepared for Lockheed Martin Corporation. April.
, 2003b. Final 100% Remedial Design Submittal Sediment Remediation Lockheed Shipyard #1 Sediment Operable Unit, Seattle WA, Attachment B-1.
, 2016. Geotechnical Engineering Design Study for Terminal 5 Cargo Wharf Rehabilitation, Berth Deepening, and Improvements: Prepared for Port of Seattle. June.
Herrera Environmental Consultants (Herrera), 2005. Marine Shoreline Sediment Survey and Assessment, Thurston County, Washington. Seattle, WA.
PanGeo Incorporated (PanGeo), 2017. Geotechnical Report, Terminal 5 Pier 26 Wall Stability, Seattle, Washington. Prepared for Port of Seattle. May.
Parametrix, 1994a. Southwest Harbor Cleanup and Redevelopment Project, Joint Federal/State Final Environmental Impact Statement: Prepared for U.S. Army Corps of Engineers (Seattle District), the Washington State Department of Ecology, and the Port of Seattle.
, 1994b. Southwest Harbor Cleanup and Redevelopment Project Final Environmental Impact Statement: Technical Appendix A-4 Risk Assessment. November.
Port of Seattle, 2016. Terminal 5 Cargo Wharf Rehabilitation, Berth Deepening, and Improvements Final Environmental Impact Statement: POS SEPA No. 16-08. October.
Tetra Tech, 2008. Final Remedial Investigation/Feasibility Study Work Plan for the Lockheed West Seattle Superfund Site: Prepared for Lockheed Martin Corporation. Revision 3. June.
July 2018 Revised Final (100 Percent) Design Report Page 13-2
, 2012. Final Remedial Investigation/Feasibility Study, Lockheed West Seattle Superfund Site: Prepared for Lockheed Martin Corporation. March.
, 2016. Pre-Remedial Design Field Sampling Data Report, Lockheed West Seattle Superfund Site: Prepared for Lockheed Martin Corporation. May.
TRC Solutions, Inc. (TRC), 2005. Final Remedial Action Completion Report: Lockheed Shipyard Sediment Operable Unit (LSSOU). Harbor Island, Seattle, Washington. Prepared for USEPA Region 10. September.
United States Army Corps of Engineers (USACE), 2016. Draft Integrated Feasibility Report and Environmental Assessment: Seattle Harbor Navigation Improvement Project. August.
United States Environmental Protection Agency (USEPA), 2009. Region 10 Superfund, RCRA, LUST, and Brownfields Clean and Green Policy: Letter issued by D. Opalski, R. Albright, and E. Kowalski. August 13, 2009.
, 2009. Clean and Green Policy: USEPA Region 10 Superfund, RCRA, LUST, and Brownfields. August 2009.
, 2010. Superfund Green Remediation Strategy: USEPA Office of Superfund Remediation and Technology Innovation. September 2010.
, 2012. Green Remediation Best Management Practices: Overview of USEPA’s Methodology to Address the Environmental Footprint of Site Cleanup. March 2012.
, 2013. Record of Decision Lockheed West Seattle Superfund Site: USEPA, Region 10. Seattle, Washington. August 2013.
, 2015a. Explanation of Significant Differences 2013 Record of Decision Cleanup Levels: Lockheed West Seattle Superfund Site. Seattle, Washington. February 2015.
, 2015b. Unilateral Administrative Order for Remedial Design and Remedial Action: Lockheed West Seattle Superfund Site. USEPA, Region 10. CERCLA Docket No. 10-2015-0079. April 2015.
, 2015c. Statement of Work for RD/RA: Appendix B of the Unilateral Administrative Order for Remedial Design and Remedial Action. Lockheed West Seattle Superfund Site. USEPA, Region 10. CERCLA Docket No. 10-2015-0079. April 2015.
, 2016. Best Management Practices for Piling Removal and Placement in Washington State. USEPA Region 10. February 18.
URS, 2003. Final Design PSR Superfund Site Marine Sediment Unit: Prepared for the United States Environmental Protection Agency, Region 10. February.
Washington State Department of Health, 2015. Puget Sound Fish Consumption Advice. September.

July 2018 Revised Final (100 Percent) Design Report Page 13-2
Washington State Department of Natural Resources (DNR), 2017. Derelict Creosote Piling Removal Best Management Practices for Pile Removal & Disposal. Updated January 25.

July 2018 Revised Final (100 Percent) Design Report
FIGURES

July 2018 Revised Final (100 Percent) Design Report
Figure 1 Site Vicinity
Figure 2 Selected Remedy
Figure 3 Remediation Overview
Figure 4 Current Management and Ownership
Figure 5a PSR PAH Contamination in Deep Former Shipway Sediments
Figure 5b PAH Profiles PSR and Deep Shipway Samples CS108 and CS107
Figure 5c PAH Profiles PSR and Deep Shipway Samples CS105 and CS24
Figure 5d PAH Characteristics Ratios
Figure 6 CSL and SQS Boundary
Figure 7 Dredge Plan Overview
Figure 8 Decision Unit Dredge Sequence

P:\LMC\CAD\Project Drawings (ACAD 2016)\Vicintiy Map\LMC Site Vicinity.dwg - Vicinity Map with notes - Dec. 14, 2017 3:27pm - gary.maxwell2
LOCKHEED WEST SEATTLE
SUPERFUND PROJECT
SITE VICINITY
LOCKHEED MARTIN
CORPORATION
Amec Foster Wheeler
Environment & Infrastructure, Inc.
3500 188th St SW, Suite 601
Lynnwood, WA 98037
1
FIGURE
651917003
PROJECT NO.
VARIES
SCALE
DECEMBER 2017
DATE
DR
AW
N B
Y: G
SM
C
HE
CK
ED
B
Y: C
JW
APPROXIMATE SCALE IN FEET
Lockheed
West Site
ELLIOTT
BAY
600030000 12000
APPROXIMATE SCALE IN FEET
10005000 2000
HARBOR
ISLAND
HARBOR
ISLAND
SEATTLE
We
st W
ate
rw
ay O
U
Lockheed
West Site
TS
SO
U
To
dd
Sh
ip
ya
rd
LS
SO
U
Former
Shipyard
Uplands
Port of Seattle
Terminal 5
Pacific Sound Resources
Marine Sediment Unit
Lo
ckh
ee
d
Up
la
nd
s
OU
Ea
st W
ate
rw
ay O
U
LEGEND
LSSOU Lockheed Shipyard
Sediment Operable Unit
TSSOU Todd Shipyard
Sediment Operable Unit
OU Operable Unit

I
N
N
E
R
H
A
R
B
O
R
L
I
N
E
O
U
T
E
R
H
A
R
B
O
R
L
I
N
E
WEST WATERWAY
PIER 26
PIER 22A
PIER 24
PIER 23
PIER 25
FORMER SHIPWAY
LEGEND:
PROJECT BOUNDARY
SHALLOW WATER ZONE BOUNDARY (-10 FT MLLW)
DREDGE BOUNDARY
SHALLOW WATER BACKFILL
SUBTIDAL BACKFILL
ENHANCED NATURAL RECOVERY
RESIDUAL MANAGEMENT LAYER
SHORELINE DEBRIS REMOVAL
RIPRAP
ROCK TOE
USACE FEDERAL NAVIGATION CHANNEL (WEST WATERWAY)
PACIFIC SOUND RESOURCES RELATED CONTAMINATION (APPROXIMATE)
LOCKHEED WEST SEATTLE
SUPERFUND SITE
SELECTED REMEDY
LOCKHEED MARTIN
Amec Foster Wheeler
Environment & Infrastructure, Inc.
3500 188th St SW, Suite 601
Lynnwood, WA 98037
2
FIGURE
6519170003.01.03
PROJECT NO.
1" = 200'
SCALE
November 2017
DATE
DR
AW
N B
Y: G
SM
C
HE
CK
ED
B
Y: C
JW
P:\LMC\CAD\Project Drawings (ACAD 2016)\LMC Site Map 111317.dwg - Remedy - Nov. 29, 2017 2:27pm - gary.maxwell2
APPROXIMATE SCALE IN FEET
2001000 400
REMEDIATION SUMMARY
ELEMENTS
AREA (AC) VOLUME (CY*)
DREDGE
15.090,900
RESIDUAL MANAGEMENT LAYER
12.09,500
SHALLOW WATER BACKFILL
1.213,000
SUBTIDAL BACKFILL
0.22,500
ENHANCED NATURAL RECOVERY
23.118,600
RIPRAP
1.57,500
NOTES:
1. REFER TO DEBRIS HANDLING PLAN FOR DETAILS OF SHORELINE DEBRIS REMOVAL AND DEBRIS IN DREDGE
AREAS.
2. REFER TO FORMER SHIPWAY PILE REMOVAL PLAN FOR PILES REMOVAL BEFORE DREDGING.
3. REFER TO DREDGE DESIGN DRAWINGS FOR NEATLINE DREDGE VOLUMES AND NEATLINE DREDGE DESIGN
DEPTHS.
4. RESIDUAL MANAGEMENT LAYER WILL BE PLACED OVER SUBTIDAL DREDGE AREAS (-10FT MLLW AND
BELOW), EXCEPT DREDGE SLOPES WHERE SHORELINE PROTECTION RIPRAP WILL BE PLACED.
5. INTERTIDAL DREDGE AREAS (BETWEEN 11.3FT MLLW AND -10FT MLLW) IN SOUTH BEACH, FORMER
SHIPWAY, AND ADJACENT TO PIER 25 TO BE BACKFILLED TO THE EXISTING GRADES WITH SAND, GRAVEL
BEACH MIX, AND FISH MIX.
6. SUBTIDAL DREDGE AREA OF FORMER SHIPWAY TO BE BACKFILLED TO THE EXISTING GRADES.
7. ENHANCED NATURAL RECOVERY LAYER TO BE PLACED IN AREAS AS SHOWN.
* NEATLINE DREDGE VOLUME DOES NOT INCLUDE ANY OVERDREDGE VOLUME.
RML AND ENR VOLUMES WERE ESTIMATED WITH 6-INCH SAND LAYER
PLACEMENT OVER AREAS AS SHOWN.

I
N
N
E
R
H
A
R
B
O
R
L
I
N
E
O
U
T
E
R
H
A
R
B
O
R
L
I
N
E
WEST WATERWAY
OPERABLE UNIT
DRY DOCK 1
PIER 26
PIER 22A
DRY DOCK 2
DRY DOCK 3
REGULATED
NAVIGATION AREA
PIER 21
SOUTH
BEACH
FORMER SHIPWAY
PIER 23
PIER 24
PIER 25
LEGEND:
PROJECT BOUNDARY
SHALLOW WATER ZONE BOUNDARY (-10 FT MLLW)
DREDGE TO CSL BOUNDARY
DREDGE TO SQS BOUNDARY
SHALLOW WATER BACKFILL
SUBTIDAL BACKFILL
ENHANCED NATURAL RECOVERY
RESIDUAL MANAGEMENT LAYER
SHORELINE DEBRIS REMOVAL
RIPRAP
ROCK TOE
USACE FEDERAL NAVIGATION CHANNEL (WEST WATERWAY)
PACIFIC SOUND RESOURCES RELATED CONTAMINATION (APPROXIMATE)
Notes:
AC = Acre
CY = Cubic Yard
CSL - Cleanup Screening Level
SQS = Sediment Quality Standard
USACE - United States Army CORPS of Engineers
LOCKHEED WEST SEATTLE
SUPERFUND SITE
REMEDIATION OVERVIEW
LOCKHEED MARTIN
Amec Foster Wheeler
Environment & Infrastructure, Inc.
3500 188th St SW, Suite 601
Lynnwood, WA 98037
3
FIGURE
6519170003.01.03
PROJECT NO.
1" = 200'
SCALE
November 2017
DATE
DR
AW
N B
Y: G
SM
C
HE
CK
ED
B
Y: C
JW
P:\LMC\CAD\Project Drawings (ACAD 2016)\LMC Site Map 111317.dwg - Remdiation Overview - Dec. 19, 2017 9:30am - gary.maxwell2
APPROXIMATE SCALE IN FEET
2001000 400
REMEDIATION SUMMARY
ELEMENTS
AREA (AC) VOLUME (CY*)
DREDGE
15.090,900
RESIDUAL MANAGEMENT LAYER
12.09,500
SHALLOW WATER BACKFILL
1.213,000
SUBTIDAL BACKFILL
0.22,500
ENHANCED NATURAL RECOVERY
23.118,600
RIPRAP
1.57,500
NOTES:
1. REFER TO DEBRIS HANDLING PLAN FOR DETAILS OF SHORELINE DEBRIS REMOVAL AND DEBRIS IN DREDGE
AREAS.
2. REFER TO FORMER SHIPWAY PILE REMOVAL PLAN FOR PILES REMOVAL BEFORE DREDGING.
3. REFER TO DREDGE DESIGN DRAWINGS FOR NEATLINE DREDGE VOLUMES AND NEATLINE DREDGE DESIGN
DEPTHS.
4. RESIDUAL MANAGEMENT LAYER WILL BE PLACED OVER SUBTIDAL DREDGE AREAS (-10FT MLLW AND
BELOW), EXCEPT DREDGE SLOPES WHERE SHORELINE PROTECTION RIPRAP WILL BE PLACED.
5. INTERTIDAL DREDGE AREAS (BETWEEN 11.3FT MLLW AND -10FT MLLW) IN SOUTH BEACH, FORMER
SHIPWAY, AND ADJACENT TO PIER 25 TO BE BACKFILLED TO THE EXISTING GRADES WITH SAND, GRAVEL
BEACH MIX, AND FISH MIX.
6. SUBTIDAL DREDGE AREA OF FORMER SHIPWAY TO BE BACKFILLED TO THE EXISTING GRADES.
7. ENHANCED NATURAL RECOVERY LAYER TO BE PLACED IN AREAS AS SHOWN.
* NEATLINE DREDGE VOLUME DOES NOT INCLUDE ANY OVERDREDGE VOLUME.
RML AND ENR VOLUMES WERE ESTIMATED WITH 6-INCH SAND LAYER
PLACEMENT OVER AREAS AS SHOWN.

REGULATED NAVIGATION AREA
I
N
N
E
R
H
A
R
B
O
R
L
I
N
E
RA5 Former Shipyard
PSR MARINE UNIT
(approximate)
O
U
T
E
R
H
A
R
B
O
R
L
I
N
E
West Waterway OU
Terminal Fence Line
REMEDIATION
LEGEND
Harbor Line
West Waterway OU (approximate)
Pacific Sound Resources Marine Sediment Area (approximate)
Port Managed Harbor Area
WA NDR Managed Waterway /
USACE Managed Federal Navigation Channel
Regulated Navigation Area
WA DNR Managed Harbor Area
Port of Seattle Owned Tidelands
RA5 - Former Shipyard Uplands
Note: OU = Operable Unit
LOCKHEED WEST SEATTLE
SUPERFUND SITE
CURRENT MANAGEMENT
AND OWNERSHIP
LOCKHEED MARTIN
Amec Foster Wheeler
Environment & Infrastructure, Inc.
3500 188th St SW, Suite 601
Lynnwood, WA 98037
4
FIGURE
6519170003.01.03
PROJECT NO.
1" = 300'
SCALE
DECEMBER 2017
DATE
DR
AW
N B
Y: G
SM
C
HE
CK
ED
B
Y: C
JW
P:\LMC\CAD\Project Drawings (ACAD 2016)\LMC Parcels 112717.dwg - Parcels (2) - Dec. 15, 2017 1:04pm - gary.maxwell2
APPROXIMATE SCALE IN FEET
3001500 600
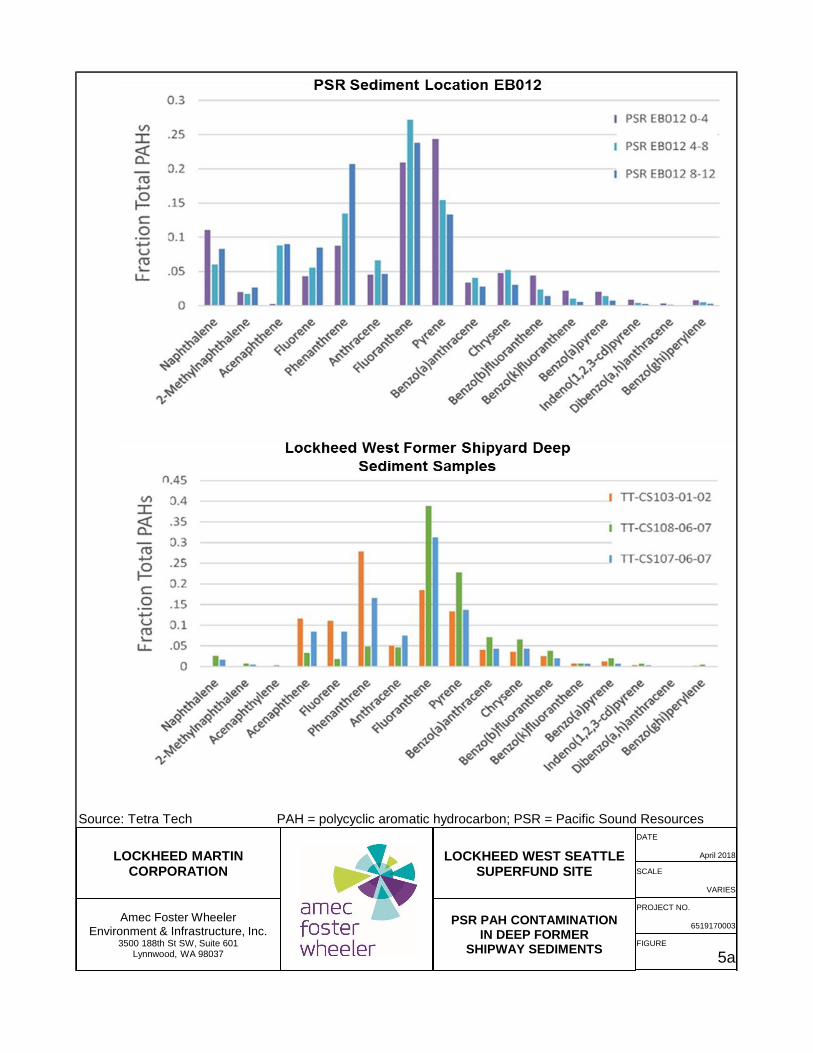
Source: Tetra Tech PAH = polycyclic aromatic hydrocarbon; PSR = Pacific Sound Resources
FIGURE
5a
LOCKHEED MARTINCORPORATION
Amec Foster WheelerEnvironment & Infrastructure, Inc.
3500 188th St SW, Suite 601Lynnwood, WA 98037
LOCKHEED WEST SEATTLE SUPERFUND SITE
DATE
April 2018
PSR PAH CONTAMINATION IN DEEP FORMER
SHIPWAY SEDIMENTS
SCALE
VARIES
PROJECT NO.
6519170003

Source: Tetra Tech PAH = polycyclic aromatic hydrocarbon; PSR = Pacific Sound Resources
LOCKHEED WEST SEATTLESUPERFUND SITE
PAH PROFILES PSRAND DEEP SHIPWAY
SAMPLES CS108 AND CS107FIGURE
5b
Amec Foster WheelerEnvironment & Infrastructure, Inc.
3500 188th St SW, Suite 601Lynnwood, WA 98037
DATE
April 2018
SCALE
VARIES
PROJECT NO.
6519170003
LOCKHEED MARTINCORPORATION
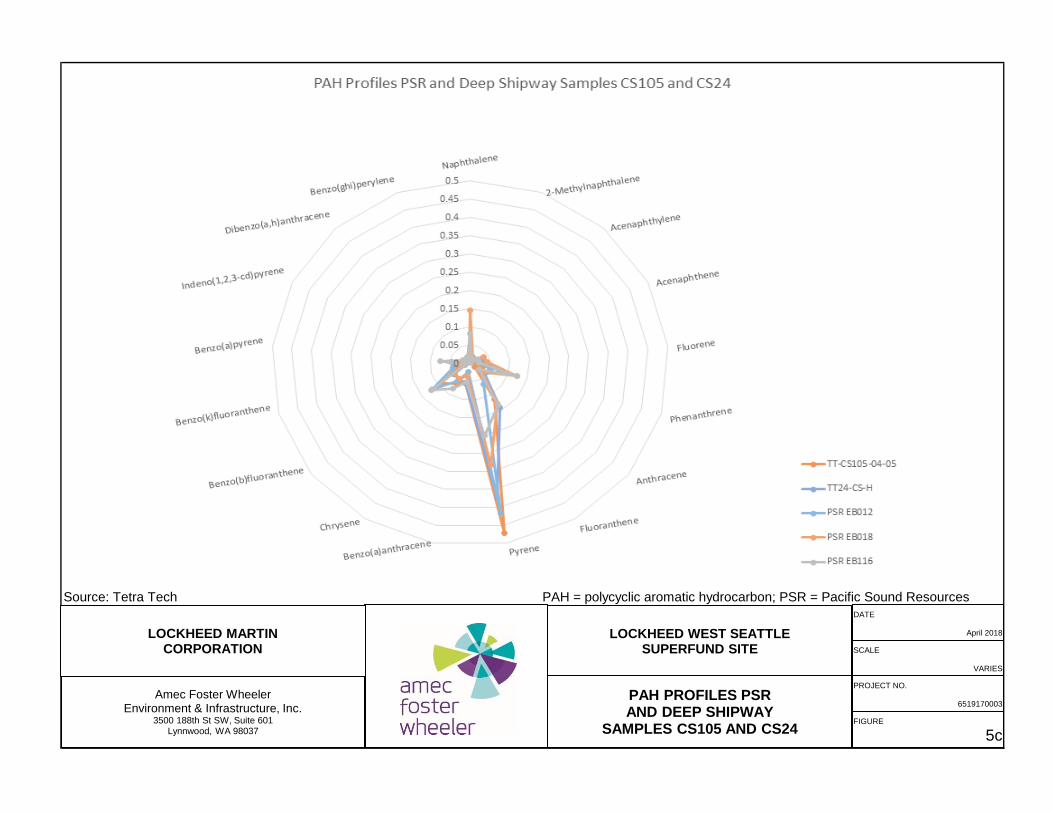
Source: Tetra Tech PAH = polycyclic aromatic hydrocarbon; PSR = Pacific Sound Resources
LOCKHEED WEST SEATTLESUPERFUND SITE
PAH PROFILES PSRAND DEEP SHIPWAY
SAMPLES CS105 AND CS24FIGURE
5c
Amec Foster WheelerEnvironment & Infrastructure, Inc.
3500 188th St SW, Suite 601Lynnwood, WA 98037
DATE
April 2018
SCALE
VARIES
PROJECT NO.
6519170003
LOCKHEED MARTINCORPORATION

Source: Tetra Tech PAH = polycyclic aromatic hydrocarbon
LOCKHEED WEST SEATTLESUPERFUND SITE
PAH CHARACTERISTIC RATIOSFIGURE
5d
Amec Foster WheelerEnvironment & Infrastructure, Inc.
3500 188th St SW, Suite 601Lynnwood, WA 98037
DATE
April 2018
SCALE
VARIES
PROJECT NO.
6519170003
LOCKHEED MARTINCORPORATION

FIGURE
6
LOCKHEED MARTINCORPORATION
Amec Foster WheelerEnvironment & Infrastructure, Inc.
3500 188th St SW, Suite 601Lynnwood, WA 98037
DATEApril 2018
SCALE
VARIES
PROJECT NO.
6519170003
LOCKHEED WEST SEATTLESUPERFUND SITE
CSL AND SQS BOUNDARY
Source: Tetra Tech
Abbreviation(s)CSL = cleanup screening levelSQS = sediment quality standards
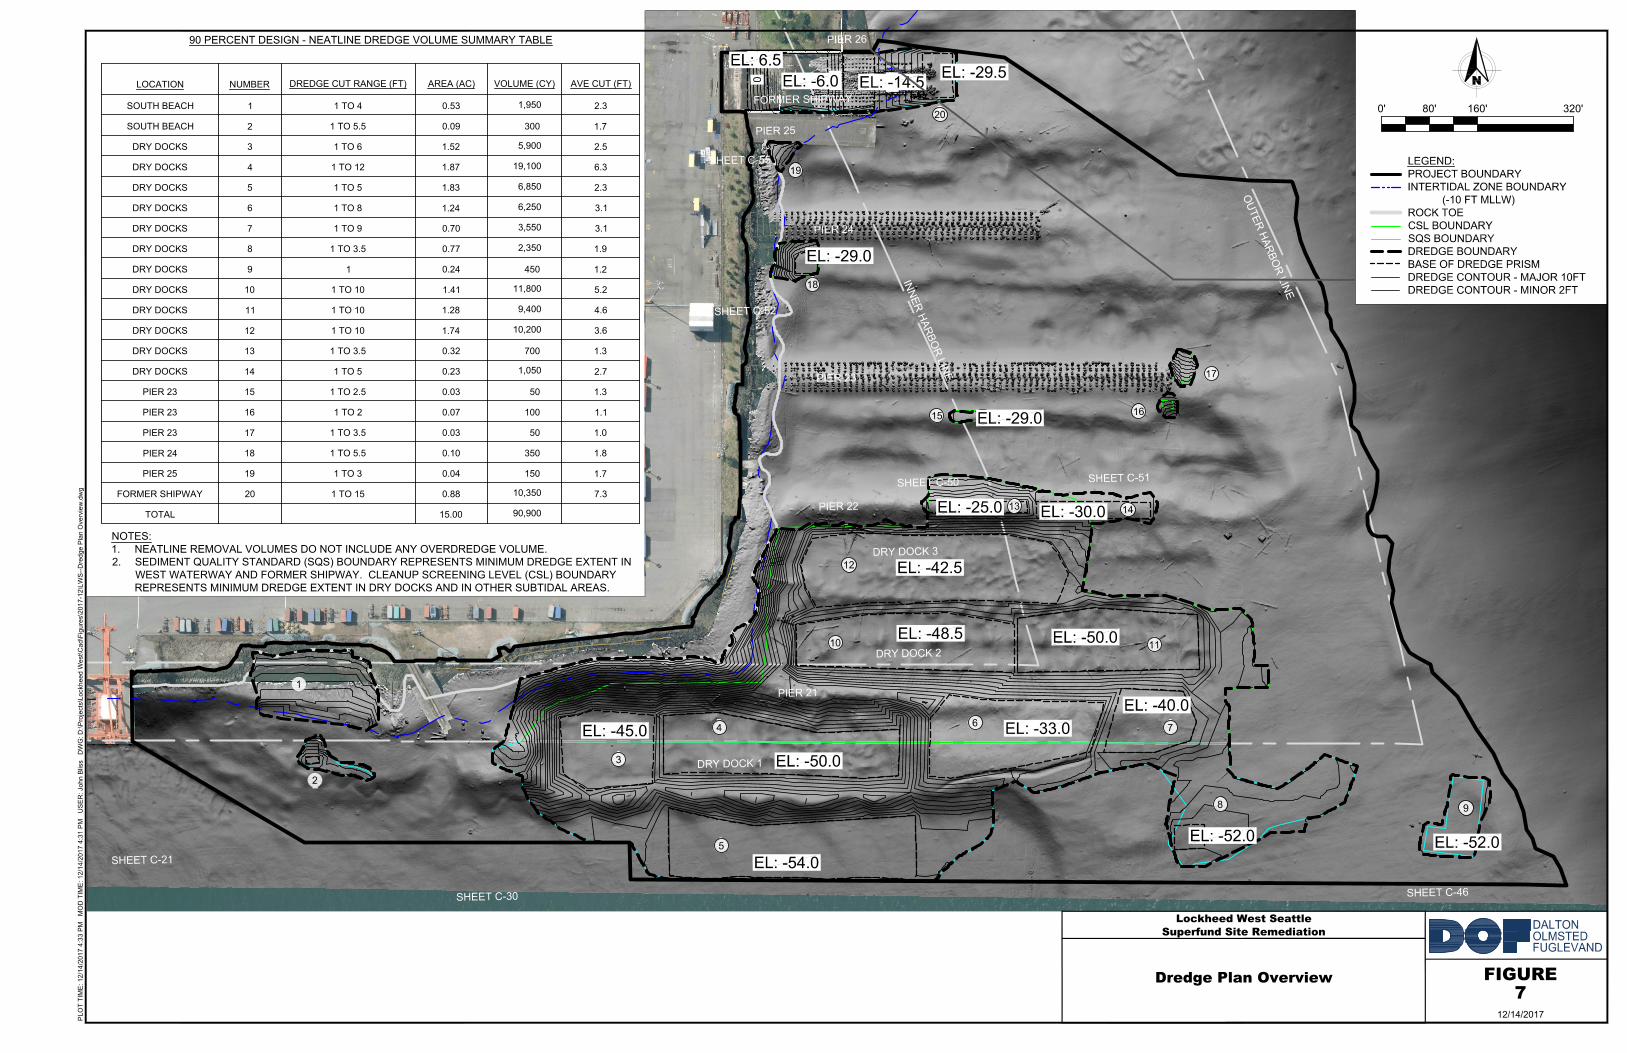
1
2
3
9
15
16
18
19
20
4
5
6
7
8
10
11
12
13
14
17
I
N
N
E
R
H
A
R
B
O
R
L
I
N
E
O
U
T
E
R
H
A
R
B
O
R
L
I
N
E
PIER 21
PIER 22
PIER 23
PIER 24
PIER 25
PIER 26
DRY DOCK 1
DRY DOCK 2
DRY DOCK 3
FORMER SHIPWAY
SHEET C-30
SHEET C-21
SHEET C-46
SHEET C-50
SHEET C-51
SHEET C-52
SHEET C-55
EL: -45.0
EL: -50.0
EL: -33.0
EL: -40.0
EL: -50.0
EL: -48.5
EL: -42.5
EL: -30.0
EL: -25.0
EL: -52.0
EL: -29.0
EL: -29.0
EL: -29.5
EL: -54.0
EL: 6.5
-20
-10
0
EL: -6.0EL: -14.5
EL: -52.0
LEGEND:
PROJECT BOUNDARY
INTERTIDAL ZONE BOUNDARY
(-10 FT MLLW)
ROCK TOE
CSL BOUNDARY
SQS BOUNDARY
DREDGE BOUNDARY
BASE OF DREDGE PRISM
DREDGE CONTOUR - MAJOR 10FT
DREDGE CONTOUR - MINOR 2FT
NOTES:
1. NEATLINE REMOVAL VOLUMES DO NOT INCLUDE ANY OVERDREDGE VOLUME.
2. SEDIMENT QUALITY STANDARD (SQS) BOUNDARY REPRESENTS MINIMUM DREDGE EXTENT IN
WEST WATERWAY AND FORMER SHIPWAY. CLEANUP SCREENING LEVEL (CSL) BOUNDARY
REPRESENTS MINIMUM DREDGE EXTENT IN DRY DOCKS AND IN OTHER SUBTIDAL AREAS.
0' 160' 320'80'
LOCATION NUMBERDREDGE CUT RANGE (FT) AREA (AC) VOLUME (CY) AVE CUT (FT)
SOUTH BEACH 1 1 TO 4 0.53
1,950
2.3
SOUTH BEACH 2 1 TO 5.5 0.09 300 1.7
DRY DOCKS 3 1 TO 6 1.52
5,900
2.5
DRY DOCKS 4 1 TO 12 1.87
19,100
6.3
DRY DOCKS 5 1 TO 5 1.83
6,850
2.3
DRY DOCKS 6 1 TO 8 1.24
6,250
3.1
DRY DOCKS 7 1 TO 9 0.70
3,550
3.1
DRY DOCKS 8 1 TO 3.5 0.77
2,350
1.9
DRY DOCKS 9 1 0.24 450 1.2
DRY DOCKS 10 1 TO 10 1.41
11,800
5.2
DRY DOCKS 11 1 TO 10 1.28
9,400
4.6
DRY DOCKS 12 1 TO 10 1.74
10,200
3.6
DRY DOCKS 13 1 TO 3.5 0.32 700 1.3
DRY DOCKS 14 1 TO 5 0.23
1,050
2.7
PIER 23 15 1 TO 2.5 0.03 50 1.3
PIER 23 16 1 TO 2 0.07 100 1.1
PIER 23 17 1 TO 3.5 0.03 50 1.0
PIER 24 18 1 TO 5.5 0.10 350 1.8
PIER 25 19 1 TO 3 0.04 150 1.7
FORMER SHIPWAY 20 1 TO 15 0.88
10,350
7.3
TOTAL 15.00
90,900
90 PERCENT DESIGN - NEATLINE DREDGE VOLUME SUMMARY TABLE
PLO
T T
IM
E: 12/14/2017 4:33 P
M M
OD
T
IM
E: 12/14/2017 4:31 P
M U
SE
R: John B
liss D
WG
: D
:\P
rojects\Lockheed W
est\C
ad\F
igures\2017-12\LW
S--D
redge P
lan O
verview
.dw
g
DALTON
OLMSTED
FUGLEVAND
Dredge Plan Overview
Superfund Site Remediation
Lockheed West Seattle
12/14/2017
7
FIGURE

O
U
T
E
R
H
A
R
B
O
R
L
I
N
E
WEST WATERWAY
PIER 22A
PIER 24
PIER 23
PIER 25
FORMER SHIPWAY
DU 9
DU 3
DU 4
DU 5
DU 6
DU 7
DU 8
DU 10
DU 16
DU 14
DU 13
DU 15
DU 12
DU 11
DU 1
DU 2
LEGEND:
PROJECT BOUNDARY
ROCK TOE
USACE FEDERAL NAVIGATION CHANNEL (WEST WATERWAY)
DREDGE MATERIAL MANAGEMENT UNIT (DMMU)
DU-2
DU-10
DU-16
DU-15
DU-14
DU-12
DU-13
DU-8
DU-1
DU-7
DU-6
DU-5
DU-4
DU-3
DECISION UNIT DREDGING SEQUENCE
DU-11
LOCKHEED WEST SEATTLE
SUPERFUND SITE
DECISION UNIT
DREDGING SEQUENCE
LOCKHEED MARTIN
Amec Foster Wheeler
Environment & Infrastructure, Inc.
3500 188th St SW, Suite 601
Lynnwood, WA 98037
8
FIGURE
6519170003.01.03
PROJECT NO.
1" = 165'
SCALE
April 2018
DATE
DR
AW
N B
Y: G
SM
C
HE
CK
ED
B
Y: C
JW
P:\LMC\CAD\Project Drawings (ACAD 2016)\LMC Sediment Monitoring.dwg - Fig 8 Dredging Sequence - Apr. 05, 2018 2:11pm - gary.maxwell2
APPROXIMATE SCALE IN FEET
16582.50 330

July 2018 Revised Final (100 Percent) Design Report
TABLES

July 2018 Revised Final (100 Percent) Design Report
Table 1 Summary of Cleanup Levels for Contaminants of Concern in Sediment
Table 2 Remedial Action Levels to Be Achieved at Sediment Surface Following Excavation and Dredging
Table 3 Summary of Remedial Action Level Exceedances
Table 4 PSR Surface Sediment Samples Collected from near the Former Shipway and the Upland PSR DNAPL
Table 5 Geotechnical Properties of Dredge Sediment
Table 6 Sediment Dewatering Parameters
Table 7 Amendment Dewatering—Paint Filter Test Results
Table 8 Gravity Dewatering Test Results
Table 9 Dredge Volume Summary Table
Table 10 Slope Stability Analysis
Table 11 Sheet Pile Wall Deflection Analysis
Table 12 RML, ENR, and Backfill Estimated Volume Summary
Table 13 Applicable or Relevant and Appropriate Requirements and to be Considered Criteria

RAO 4
Ecological5
(0 to 10 cm)100 (RBTC – fish)
n/an/an/an/an/an/an/an/an/a
50 (RBTC – sandpiper)n/a150n/an/a
114 (RBTC – fish)420 (RBTC – sandpiper)
n/an/an/an/an/an/an/an/an/an/an/an/an/an/an/an/a
µg TEQ/kg dw
n/a n/aPoint n/a n/a 260 (SQS)
Chromium No mg/kg dwSubtidal n/a n/a
n/aIntertidal 0.398 (nat. bkgd) n/a n/a
Point n/a n/a n/aCadmium No mg/kg dw
Subtidal 0.398 (nat. bkgd) n/a
n/aIntertidal n/a
Subtidal 2 (nat. bkgd) 37 (RBTC)8
n/aIntertidal n/a n/a n/a
Point n/a n/a 150 (LAET/SL)
n/a n/aPoint n/a n/a 0.41 (SQS)
Antimony No mg/kg dwSubtidal n/a n/a
n/aIntertidal 2 (nat. bkgd) 13 (RBTC)8 n/a
Point n/a n/a n/aDioxins/ Furans Yes ng TEQ/kg dw
Mercury Yes mg/kg dwSubtidal 0.41 (RBTC – child) n/a
n/aIntertidal 400 (RBTC – child)8 n/a n/a
Point n/a n/a 390 (SQS/CSL)Copper Yes mg/kg dw
Subtidal 400 (RBTC – child) n/a
n/aIntertidal 0.17 (RBTC – child)
11 (nat. bkgd) n/a
n/aIntertidal 2,000 (RBTC – child)8 n/a n/a
Point n/a n/a n/a
n/a 57 (SQS)
n/a n/a n/a
Tributyltin Yes µg/kg dwSubtidal 430 (RBTC – child) n/a
n/aIntertidal 11 (nat. bkgd) n/a n/a
Point n/a n/a n/aLead Yes mg/kg dw
Subtidal
Arsenic Yes mg/kg dwSubtidal 7 (nat. bkgd) 7 (nat. bkgd) n/a
9 (nat. bkgd) 550 (RBTC)6 n/aIntertidal 9 (nat. bkgd) 15 (RBTC)7 n/acPAHs YesSubtidal
Point
Intertidal 7 (nat. bkgd) 7 (nat. bkgd) n/aPoint n/a
n/a n/aPoint n/a n/a 12 mg/kg-OC/180 (SQS)
Total PCBs Yes µg/kg dwSubtidal 2 (nat. bkgd) n/a n/aIntertidal 2 (nat. bkgd)
RAO 2
Human Direct
Contact3
(0 to 45 cm)
RAO 3
Benthic Organisms4
(0 to 10 cm)
TABLE 1
SUMMARY OF CLEANUP LEVELS FOR CONTAMINANTS OF CONCERN IN SEDIMENT
COCRisk
Driver? Units1
Spatial Scale
of Exposure2
RAO 1
Human Seafood
Consumption3
(0 to 10 cm)
July 2018 Final (100 Percent) Design Page 1 of 4
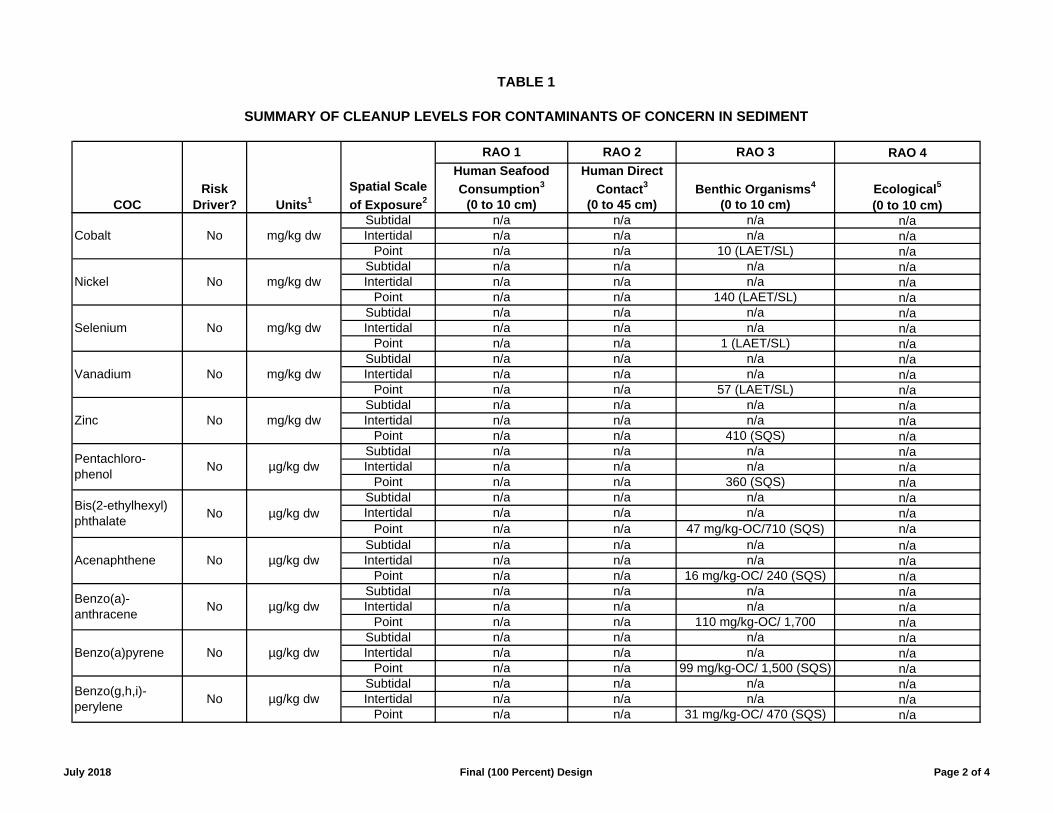
RAO 4
Ecological5
(0 to 10 cm)
RAO 2
Human Direct
Contact3
(0 to 45 cm)
RAO 3
Benthic Organisms4
(0 to 10 cm)
TABLE 1
SUMMARY OF CLEANUP LEVELS FOR CONTAMINANTS OF CONCERN IN SEDIMENT
COCRisk
Driver? Units1
Spatial Scale
of Exposure2
RAO 1
Human Seafood
Consumption3
(0 to 10 cm)n/an/an/an/an/an/an/an/an/an/an/an/an/an/an/an/an/an/an/an/a
n/an/an/an/an/an/an/an/an/an/an/an/a
n/aPoint n/a n/a 99 mg/kg-OC/ 1,500 (SQS)
n/aIntertidal n/a n/a n/a
Point n/a n/a 31 mg/kg-OC/ 470 (SQS)
Benzo(g,h,i)-perylene
No µg/kg dwSubtidal n/a
No µg/kg dwSubtidal n/a n/a
n/aIntertidal n/a n/a n/a
n/aPoint n/a n/a 16 mg/kg-OC/ 240 (SQS)
n/a47 mg/kg-OC/710 (SQS)
Benzo(a)pyrene No µg/kg dwSubtidal n/a n/a
n/aIntertidal n/a n/a n/a
Point n/a n/a 110 mg/kg-OC/ 1,700
Benzo(a)-anthracene
Acenaphthene No µg/kg dwSubtidal n/a n/a n/aIntertidal
n/aIntertidal n/a n/a n/a
Point n/a n/a
Bis(2-ethylhexyl) phthalate
No µg/kg dwSubtidal n/a n/a
n/a n/a
Subtidal n/a n/a
n/aIntertidal n/a n/a n/a
Point n/a n/a 360 (SQS)
n/a n/aPoint n/a n/a 57 (LAET/SL)
Pentachloro-phenol
No µg/kg dwSubtidal n/a n/a
n/aIntertidal n/a n/a n/a
Point n/a n/a 410 (SQS)Zinc No mg/kg dw
Vanadium No mg/kg dwSubtidal n/a n/a
n/aIntertidal n/a n/a n/a
Point n/a n/a 1 (LAET/SL)Selenium No mg/kg dw
Subtidal n/a n/a
n/aIntertidal n/a
Subtidal n/a n/a
n/aIntertidal n/a n/a n/a
Point n/a n/a 140 (LAET/SL)Nickel No mg/kg dw
Subtidal n/a n/a
n/aIntertidal n/a n/a n/a
Point n/a n/a 10 (LAET/SL)Cobalt No mg/kg dw
July 2018 Final (100 Percent) Design Page 2 of 4

RAO 4
Ecological5
(0 to 10 cm)
RAO 2
Human Direct
Contact3
(0 to 45 cm)
RAO 3
Benthic Organisms4
(0 to 10 cm)
TABLE 1
SUMMARY OF CLEANUP LEVELS FOR CONTAMINANTS OF CONCERN IN SEDIMENT
COCRisk
Driver? Units1
Spatial Scale
of Exposure2
RAO 1
Human Seafood
Consumption3
(0 to 10 cm)n/an/an/an/an/an/an/an/an/an/an/an/an/an/an/an/an/an/an/an/an/a
Note(s)1. Unless noted differently in RAO-specific values.2. The spatial scale of exposure is measured as subtidal SWAC, intertidal sediments SWAC, and point measurements at single locations throughout the site (i.e., all subtidal and intertidal sediment locations) or at single locations in intertidal sediment only. The spatial scale is RAO-specific, with site-wide exposures applicable to human seafood consumption, human direct contact, and exposures of fish and crab. Intertidal-only exposures are applicable to human consumption of clams from intertidal areas and exposures of sandpiper. Point exposures are applicable to benthic organisms, which are evaluated at single station locations. The statistical metric for site-wide and intertidal evaluation of alternatives and compliance monitoring is the upper confidence limit on the mean, whereas point exposures are evaluated with concentration data at single locations.
3. Cleanup levels are based on 10-6 cancer risk for carcinogens (e.g., PCBs, cPAHs, arsenic) or on a child exposure hazard quotient of 1 for noncarcinogens (lead, tributyltin, copper). Where cleanup levels are based on carcinogenic risks below background, the background concentration is selected; where no background values are available (chlordanes and DDT), the method detection limit (MDL) is selected.
Subtidal n/a n/a
n/aIntertidal n/a n/a n/a
Point n/a n/a 960 mg/kg-OC/ 14,400 Total HPAH No µg/kg dw
Subtidal n/a n/a
n/aIntertidal n/a n/a n/a
Point n/a n/a 100 mg/kg-OC/ 1,500 Phenan-threne No µg/kg dw
Subtidal n/a n/a
n/aIntertidal n/a n/a n/a
Point n/a n/a 34 mg/kg-OC/ 510 (SQS)
n/a n/aPoint n/a n/a 12 mg/kg-OC/ 180 (SQS)
Indeno(1,2,3-cd)pyrene
No µg/kg dwSubtidal n/a n/a
n/aIntertidal n/a n/a n/a
Point n/a n/a 160 mg/kg-OC/ 2,400 Fluor-anthene No µg/kg dw
Dibenz(a,h)-anthracene
No µg/kg dwSubtidal n/a n/a
n/aIntertidal n/a n/a n/a
Point n/a n/a 110 mg/kg-OC/ 1,700 Chrysene No µg/kg dw
Subtidal n/a n/a
n/aIntertidal n/a
n/aIntertidal n/a n/a n/a
Point n/a n/a 230 mg/kg-OC/ 1,800
Total Benzofluor-anthenes
No µg/kg dwSubtidal n/a n/a
July 2018 Final (100 Percent) Design Page 3 of 4

RAO 4
Ecological5
(0 to 10 cm)
RAO 2
Human Direct
Contact3
(0 to 45 cm)
RAO 3
Benthic Organisms4
(0 to 10 cm)
TABLE 1
SUMMARY OF CLEANUP LEVELS FOR CONTAMINANTS OF CONCERN IN SEDIMENT
COCRisk
Driver? Units1
Spatial Scale
of Exposure2
RAO 1
Human Seafood
Consumption3
(0 to 10 cm)
COC = contaminant of concern Nat. Bkgd = natural backgroundcm = centimeter(s) ng TEQ/kg-dw = nanograms toxicity equivalents per kilogram dry weightcPAH = carcinogenic polycyclic aromatic hydrocarbon PCB = polychlorinated biphenylCSL = cleanup screening level RAO = remedial action objectiveDMMP = dredged material management program RBTC = risk-based threshold concentrationsdw = dry weight SL = screening levelHPAH = high-molecular-weight polycyclic aromatic hydrocarbon SMS = Sediment Management StandardsLAET = lowest-apparent-effect threshold SQS = sediment quality standardsML = maximum level SWAC = surface-weighted average concentrationmg/kg-dw = milligram(s) per kilogram dry weight µg/kg dw = microgram(s) per kilogram dry weightmg/kg-OC = milligram(s) per kilogram, organic-carbon-normalized value µg TEQ/kg dw = microgram(s) toxicity equivalents per kilogram dry weightn/a = compounds do not present a risk for the RAO scenario
7. The cleanup level for intertidal direct contact is based on the lowest for either Tribal clamming or child beach play exposures.8. The cleanup level for intertidal seafood consumption is based on consumption of clams from the intertidal sediment.
Abbreviation(s)
4. Applicable on a point exposure only. Two values for PCBs and PAHs (except total benzofluoranthenes). The first is the organic carbon-normalized SQS value (mg/kg-OC. The second is the dry-weight equivalent based on an average sediment total organic carbon content of 1.5%. For all other compounds, values are dry weight. Under the SMS, sediment cleanup standards are established on a site-specific basis within an allowable range. The SQS and CSL define this range. For chemicals without SMS, LAET and 2LAET values or the SL and ML of the DMMP define this range.
5. Cleanup levels for site-wide exposure are the lowest for either fish or crab; cleanup levels for intertidal exposure are for sandpiper. 6. The cleanup level for site-wide direct contact is based on netfishing.
July 2018 Final (100 Percent) Design Page 4 of 4

TABLE 2
REMEDIAL ACTION LEVELS TO BE ACHIEVED AT SEDIMENT SURFACE FOLLOWING EXCAVATION AND DREDGING
COC Risk Driver? Compliance Zone1 RAL Units Source
Total PCBs Yes 0 to 10 cm12 mg/kg-OC
SQS180 µg/kg dw
Lead Yes 0 to 10 cm 530 mg/kg-dw CSLTributyltin Yes Not applicable
cPAHs Yes Not applicableArsenic Yes 0 to 10 cm 57 mg/kg-dw SQS
Copper Yes 0 to 10 cm 390 mg/kg-dw SQS and CSL
Dioxins/Furans Yes Not applicableMercury Yes 0 to 10 cm 0.41 mg/kg-dw SQS
Chromium No 0 to 10 cm 260 mg/kg-dw SQSCobalt No 0 to 10 cm 10 mg/kg-dw LAET/SLNickel No 0 to 10 cm 140 mg/kg-dw LAET/SLSelenium No 0 to 10 cm 1 mg/kg-dw LAET/SLVanadium No 0 to 10 cm 57 mg/kg-dw LAET/SLZinc No 0 to 10 cm 410 mg/kg-dw SQSPentachlorophenol No 0 to 10 cm 360 mg/kg-dw SQS
Bis(2-ethylhexyl) phthalate No 0 to 10 cm47 mg/kg-OC
SQS710 µg/kg dw
Acenaphthene No 0 to 10 cm16 mg/kg-OC
SQS240 µg/kg dw
Benzo(a)anthracene No 0 to 10 cm110 mg/kg-OC
SQS1,700 µg/kg dw
Benzo(a)pyrene No 0 to 10 cm99 mg/kg-OC
SQS1,500 µg/kg dw
Benzo(g,h,i)perylene No 0 to 10 cm31 mg/kg-OC
SQS470 µg/kg dw
Total Benzofluoranthenes No 0 to 10 cm230 mg/kg-OC
SQS1,800 µg/kg dw
Chrysene No 0 to 10 cm110 mg/kg-OC
SQS1,700 µg/kg dw
Dibenz(a,h)anthracene No 0 to 10 cm12 mg/kg-OC
SQS180 µg/kg dw
Fluoranthene No 0 to 10 cm160 mg/kg-OC
SQS2,400 µg/kg dw
Indeno(1,2,3-cd)pyrene No 0 to 10 cm34 mg/kg-OC
SQS510 µg/kg dw
July 2018 Final (100 Percent) Design Page 1 of 3

TABLE 2
REMEDIAL ACTION LEVELS TO BE ACHIEVED AT SEDIMENT SURFACE FOLLOWING EXCAVATION AND DREDGING
COC Risk Driver? Compliance Zone1 RAL Units Source
Phenanthrene No 0 to 10 cm100 mg/kg-OC
SQS1,500 µg/kg dw
Total HPAH No 0 to 10 cm960 mg/kg-OC
SQS14,000 µg/kg dw
Remedial Action Levels for Dry Docks (Area 4) and Localized Subareas (Area 5)
Total PCBs Yes 0 to 10 cm65 mg/kg-OC
CSL960 µg/kg dw
Mercury Yes 0 to 10 cm 0.59 mg/kg-dw CSL
cPAHs Yes Not applicableArsenic Yes 0 to 10 cm 93 mg/kg-dw CSLLead Yes 0 to 10 cm 530 mg/kg-dw CSLTributyltin Yes Not applicableCopper Yes 0 to 10 cm 390 mg/kg-dw SQS and CSL
Dioxins/Furans Yes Not applicableChromium No 0 to 10 cm 270 mg/kg-dw CSLCobalt No 0 to 10 cm n/a mg/kg-dwNickel No 0 to 10 cm n/a mg/kg-dwSelenium No 0 to 10 cm n/a mg/kg-dwVanadium No 0 to 10 cm n/a mg/kg-dwZinc No 0 to 10 cm 960 mg/kg-dw CSLPentachlorophenol No 0 to 10 cm 690 mg/kg-dw CSL
Bis(2-ethylhexyl) phthalate No 0 to 10 cm78 mg/kg-OC
CSL1,200 µg/kg dw
Acenaphthene No 0 to 10 cm57 mg/kg-OC
CSL860 µg/kg dw
Benzo(a)anthracene No 0 to 10 cm270 mg/kg-OC
CSL4,100 µg/kg-dw
Benzo(a)pyrene No 0 to 10 cm210 mg/kg-OC
CSL3,200 µg/kg dw
Benzo(g,h,i)perylene No 0 to 10 cm78 mg/kg-OC
CSL1,200 µg/kg dw
Total Benzofluoranthenes No 0 to 10 cm450 mg/kg-OC
CSL6,800 µg/kg dw
Chrysene No 0 to 10 cm460 mg/kg-OC
CSL6,900 µg/kg dw
July 2018 Final (100 Percent) Design Page 2 of 3

TABLE 2
REMEDIAL ACTION LEVELS TO BE ACHIEVED AT SEDIMENT SURFACE FOLLOWING EXCAVATION AND DREDGING
COC Risk Driver? Compliance Zone1 RAL Units Source
Note(s)
Abbreviation(s)COC = contaminant of concern n/a = compounds do not present a risk for the RAO scenariocm = centimeter(s) mg/kg-OC = milligram(s) per kilogram, organic-carbon-normalized valuecPAH = carcinogenic polycyclic aromatic hydrocarbon PCB = polychlorinated biphenylCSL = cleanup screening level RAL = remedial action leveldw = dry weight SL = screening levelHPAH = high-molecular-weight polycyclic aromatic hydrocarbon SQS = sediment quality standardsLAET = lowest-apparent-affect threshold µg/kg dw = microgram(s) per kilogram dry weightmg/kg-dw = milligrams per kilogram dry weight
Dibenz(a,h)anthracene No 0 to 10 cm33 mg/kg-OC
CSL500 µg/kg dw
Fluoranthene No 0 to 10 cm1,200 mg/kg-OC
CSL18,000 µg/kg dw
incleno(1,2,3-cd)pyrene No 0 to 10 cm88 mg/kg-OC
CSL1,300 µg/kg dw
1. The Compliance Basis is Subtidal Surface Sediment (point), and is the same for all COCs.
Phenanthrene No 0 to 10 cm480 mg/kg-OC
CSL7,200 µg/kg dw
Total HPAH No 0 to 10 cm5,300 mg/kg-OC
CSL79,500 µg/kg dw
July 2018 Final (100 Percent) Design Page 3 of 3

PCBs
(total)
Surface 6 1 0 1 0 0 0 0
Subsurface 29 0 0 0 7 1 1 0
Surface 13 3 5 1 8 11 7 0
Subsurface 53 4 5 2 10 8 5 2
Surface 13 3 5 1 9 10 8 1
Subsurface 100 19 31 11 39 37 19 5
Surface 6 4 3 0 0 1 2 0
Subsurface 18 12 8 2 6 2 9 0
Surface 4 2 1 0 0 0 0 0
Subsurface 11 3 2 1 3 1 0 0
Surface 24 0 0 0 0 8 5 0
Subsurface 109 4 2 1 4 2 1 0
Abbreviation(s)ENR = enhanced natural recoverycPAH = carcinogenic polycyclic aromatic hydrocarbonPCB = polychlorinated biphenyl
TABLE 3
SUMMARY OF REMEDIAL ACTION LEVEL EXCEEDANCES
South Beach
Dry Docks Dredge Area West Waterway
Dry Docks Dredge Area
Former Shipway Dredge Area
Piers and Shoreline Dredge Areas
ENR Areas
Site Area
Number of Samples > Remedial Action Level
Surface/ Subsurface
Number of Samples Arsenic Copper Lead Mercury
Total cPAH Tributyltin
July 2018 Final (100 Percent) Design Page 1 of 1

Sample ID LPAH/TPAH Phen/TPAHAce+Phen /
TPAHPhen + Pyr/BaA + Bghi F/Pyr C/BaA BaP/BFs Dibenz/Bghi
TT-CS103-00-01 0.06 0.01 0.03 2.41 0.77 0.93 0.37 0.55
TT-CS103-01-02 0.55 0.28 0.39 5.07 1.39 0.9 0.38 0.61
TT-CS103-2 0.58 0.25 0.38 4.81 1.5 0.93 0.39 0.61
TT-CS104-00-01 0.06 0.02 0.02 0.91 0.76 1.17 0.34 0.62
TT-CS104-01-02 0.89 0.13 0.58 5.84 0.75 0.96 0.41 0.34
TT-CS105-00-01 0.14 0.05 0.06 1.34 0.7 1.37 0.46 0.54
TT-CS105-02-03 0.09 0.03 0.04 1.39 0.5 1.1 0.39 0.13
TT-CS105-03-04 0.06 0.02 0.03 3.26 1.35 1.13 0.36 0.4
TT-CS105-04-05 0.09 0.03 0.04 1.93 0.24 1.18 0.39 0.38
TT-CS106-00-01 0.12 0.06 0.06 0.68 0.36 1.66 0.37 0.5
TT-CS106-01-02 0.07 0.02 0.03 1.4 0.85 1.21 0.37 0.66
TT-CS106-2 0.03 0.01 0.01 2.8 1.17 1.25 0.39 0.96
TT-CS107-00-01 0.25 0.08 0.11 1.07 0.35 1.33 0.38 0.4
TT-CS107-03-04 0.13 0.04 0.06 2.88 1.38 0.99 0.41 0.37
TT-CS107-06-07 0.43 0.17 0.25 5.6 2.28 1 0.25 5.42
TT-CS108-00-01 0.13 0.04 0.05 1.28 0.49 1.21 0.46 0.5
TT-CS108-03-04 0.14 0.04 0.07 2.2 0.56 0.9 0.42 0.13
TT-CS108-06-07 0.17 0.05 0.08 3.31 1.71 0.93 0.42 0.43
TT-CS108-2 0.15 0.05 0.08 2.34 0.55 0.92 0.39 0.44
TT25-SS 0.24 0.1 0.12 0.93 0.7 1.6 0.41 0.31
TT25-CS-B 0.14 0.06 0.08 3.57 0.11 1.64 0.41 0.33
TT25-CS-C 0.14 0.05 0.08 2.06 0.19 1.73 0.4 0.3
TT25-CS-J 0.24 0.08 0.12 1.65 0.54 1.53 0.51 0.26
TT25-CS-L 0.18 0.07 0.11 2.73 1.49 1.08 0.46 0.3
Upland PSR DNAPL 0.79 0.27 0.38 8.03 1.7 0.65 0.44 0.48
Former Shipway Area Samples
PSR NAPL Composition (RI)
TABLE 4
PSR SURFACE SEDIMENT SAMPLES COLLECTED FROM NEAR THE FORMER SHIPWAY AND THE UPLAND PSR DNAPL
July 2018 Final (100 Percent) Design Page 1 of 2

Sample ID LPAH/TPAH Phen/TPAHAce+Phen /
TPAHPhen + Pyr/BaA + Bghi F/Pyr C/BaA BaP/BFs Dibenz/Bghi
TABLE 4
PSR SURFACE SEDIMENT SAMPLES COLLECTED FROM NEAR THE FORMER SHIPWAY AND THE UPLAND PSR DNAPL
PSR EB012 0-4 0.35 0.09 0.09 3.14 0.86 1.39 0.31 0.4
PSR EB012 4-8 0.41 0.14 0.23 4.18 1.76 1.29 0.41 0.23
PSR EB012 8-12 0.53 0.21 0.3 6.94 1.79 1.11 0.37 0.25
PSR EB113 0-4 0.7 0.34 0.45 16.9 1.78 0.97 0.32 0.6
PSR EB113 4-7 0.64 0.25 0.36 10.14 1.82 1.16 0.35 0.38
PSR EB001 0.14 0.04 0.06 2.96 1.27 1.15 0.4 0.43
PSR EB002 0.4 0.21 0.23 3.1 1.57 1.55 0.45 0.38
PSR EB009 0.31 0.05 0.06 3.58 1.62 1.39 0.4 0.4
PSR EB012 0.19 0.06 0.08 1.75 0.16 2.44 0.29 0.4
PSR EB018 0.39 0.12 0.16 2.93 0.46 1.37 0.41 0.42
PSR EB116 0.28 0.12 0.15 1.27 0.67 1.58 0.54 0.27
PSR EB126 0.37 0.11 0.14 2.03 0.39 1.45 0.31 0.24
Abbreviation(s)Ace = acenaphthene F = fluorantheneBaA = benzo(a)anthracene LPAH =low-molecular-weight polycyclic aromatic hydrocarbonsBaP = benzo(a)pyrene NAPL = nonaqueous-phase liquidBFs = benzofluoranthenes Pyr = pyreneBghi = benzo(g,h,i)perylene Ph = phenanthreneC = chrysene PSR = Pacific Sound ResourcesDibenz =dibenz(a,h)anthracene RI = remedial investigationDNAPL = dense nonaqueous-phase liquid TPAH = total polycyclic aromatic hydrocarbons
PSR RI Surface Sediment Samples
PSR RI Subsurface Sediment Samples
July 2018 Final (100 Percent) Design Page 2 of 2

Sampling Location /
Dredge AreaExploration Designation Classification
Depth (feet)
Moisture Content
(%)
Organic Content
(%)Specific Gravity PI
Gravel (%)
Sand (%)
Fines (%)
TT-143,S-1 Silty sand (SM) 3.5-4.0 76.4 10.66 2.39 NP 17.8 50.4 31.8
TT-143,S-2 Silt (ML) 9.5-10.0 50.3 NP 78.6
TT-145,S-1 Silt (ML) 3.0-4.0 38.7 0.2 29.1 70.7
TT-145,S-2 Poorly graded silty sand (SP-SM) 5.5-6.5 21 0.73 NP 90 10
TT-146,S-1 Poorly graded sand (SP) 3.0-3.5 22.4 0 97.2 2.8
TT-146,S-2 Silty sand (SM) 5.0-5.5 35 2.75 2.65 23.1
TT-148,S-1 Poorly graded sand (SP) 5.0-6.0 21.9 4.3
TT-148,S-2 Silty sand (SM) 8.5-9.5 36 4.95 2.63 3.1 78.4 18.5
TT-150,S-1 Silt (ML) 5.5-6.0 25.3 2.67 0.6 47.3 52.1
TT-151,S-1 Silty sand (SM) 6.0-7.0 35.6 2.64 0 78.7 21.3
TT-153,S-1 Poorly graded silty sand (SP-SM) 4.0-4.5 25.6 0.1 92.5 7.3
TT-153,S-2 Silt (ML) 6.5-7.0 29.4 54.7
TT-154,S-1 Poorly graded silty sand (SP-SM) 3.5-4.0 44 4.1 2.64 10 32.7 67.3
TT-154,S-2 Silty sand (SM) 6.0-7.0 68.1 0.9 49.7 49.4
TT-154,S-3 Elastic silt (MH) 8.0-9.0 77.7 7.86 2.87 13 7.9 6.1 85.9
Abbreviation(s)PI = Plasticity IndexNP = Non-plastic
Dry Dock
South Beach and West Waterway
TABLE 5
GEOTECHNICAL PROPERTIES OF DREDGE SEDIMENT
Former Shipway
Between Piers 24 and 25
Between Piers 23 and 24
July 2018 Final (100 Percent) Design Page 1 of 1

Sample Percent Solids Specific GravityUnit Weight(g/mL) / (pcf)
Organic Carbon(g C/g Soil)
Shipway #1 61.7 2.4 1.8 / 112 0.0264
Dry Dock #1 67.4 2.5 1.9 / 119 0.0199
Dry Dock #2/3 75.9 2.9 2.1 / 131 0.016
Abbreviation(s)
pcf = pound per cubic feet
SEDIMENT DEWATERING PARAMETERS
TABLE 6
g/mL = gram(s) per milliliterg C/g soil = gram(s) of carbon per gram of soil
July 2018 Final (100 Percent) Design Page 1 of 1

Result
Unit Weight (g/mL) % Solids Result
Unit Weight (g/mL) % Solids Result
Unit Weight (g/mL) % Solids
None Fail 1.8 61.7 Fail 1.9 69.5 Fail 1.9 75.9
Calcimite (20 g, 4%) Pass 1.8 65.6 Pass 1.8 72.1 Pass 2 79.1
Calcimite (5 g, 1%) Fail 1.8 64.2 Fail 1.9 68.9 Fail 2.1 77.7
Portland Cement
(30 g, 6%)
Portland Cement
(20 g, 4%)
Portland Cement
(5 g, 1%)
Superabsorbent
(2 g, 0.4%)
Superabsorbent
(0.5 g, 0.1%)
Note(s)
Abbreviation(s)g = gram(s)g/mL = gram(s) per milliliter
1. Amount added in grams and percentage.
AMENDMENT DEWATERING—PAINT FILTER TEST RESULTS
78.3
Fail 1.7 62 Fail 1.6 66 Fail 1.3 76.9
2.1 78.1
Pass 1.7 1.6
Pass 2.1 80.3
Fail — — Fail 1.9 70.4 Fail
63.5 Pass 1.8 66.5 Pass
— Pass — —
Fail 1.8 65.5 Pass 1.9 70.7
Pass 1.8 65.6 Pass —
TABLE 7
Amendment1
Sediment Sample(each 500 g)
Shipway Dry Dock #1 Dry Dock #2/3
July 2018 Final (100 Percent) Design Page 1 of 1

Sample Initial After
Dewatering Initial After Dewatering
Shipway #1¹ 58.7 92.5 1.6 / 100 1.5 / 94
Dry Dock #1¹ 73.4 93.2 1.9 / 119 1.7 / 106
Dry Dock #2/3² 79.2 94.6 2.1 / 131 1.8 / 112
Note(s)1. Results after 288 hours of dewatering.2. Results after 204 hours of dewatering.
Abbreviation(s)g/mL = gram(s) per milliliterpcf = pound per cubic feet
TABLE 8
Unit Weight(g/mL) / (pcf)
% Solids
GRAVITY DEWATERING TEST RESULTS
July 2018 Final (100 Percent) Design Page 1 of 1

Neatline Volume
Overdredge
Volume1
(cy) (cy)South Beach 1.0 to 5.5 0.6 2,250 1,000
Dry Docks 1.0 to 12.0 13.1 73,650 21,250
Piers 23, 24, & 25 1.0 to 5.5 0.3 650 450
Former Shipway 1.0 to 15.0 0.9 10,150 1,450
Total = - 15 86,700 24,150
Note(s)
Abbreviation(s)
cy = cubic yard(s)
1. Approximate overdredge volume assuming 1-foot cuts.
ac = acre(s)
TABLE 9
DREDGE VOLUME SUMMARY TABLE
LocationDepth of Cut
(feet) Area (ac)
July 2018 Final (100 Percent) Design Page 1 of 1

Location1 Condition2 FoS3
(3 feet)FoS3
(5 feet)Current – Static 1.28 1.32Post-dredge and post-riprap placement – Static
1.39 1.39
Current – Seismic 0.64 0.66Post-dredge and post-riprap placement – Seismic
0.77 0.77
Current – Static 1.42 1.52Post-dredge and post-riprap placement – Static
1.61 1.61
Current – Seismic 0.7 0.75Post-dredge and post-riprap placement – Seismic
0.85 0.85
Current – Static 1.39 1.52Post-dredge and post-riprap placement – Static
1.46 1.46
Current – Seismic 0.7 0.75Post-dredge and post-riprap placement – Seismic
0.86 0.86
Note(s)
Abbreviation(s)
g = acceleration due to gravity
3. FoS = factor of safety for 3 feet and 5 feet minimum slip surfaces.
1. Refer to design drawings for section locations.
FoS = Factor of Safety
2. Seismic = peak ground acceleration of 0.155 g.
TABLE 10
SLOPE STABILITY ANALYSIS
Dry docks (Section B4)
Dry docks(Section B19)
Pier 24 (Section C5)
Submerged dredge slope(Section B6)
Former shipway(Section D2)
Post-dredge – Static 1.48 1.63
Post-backfill – Static 3.94 3.96
July 2018 Final (100 Percent) Design Page 1 of 1

Location1 Condition
Free Height (ft) / Embedment
Depth (ft)2Deflection
(inch)Demand/
Capacity RatioCurrent 5/1 0.3 0.05
After removal of pilings 8/1 0.9 0.12
After dredging 11/1 2.4 0.24
Current 10/1 1.7 0.19
After removal of pilings 13/32 4.6 0.4
After dredging 16/29 10.4 0.71
Current 12/1 3.5 0.32
After removal of pilings 15/30 8.1 0.6
After dredging 25/20 n/a n/a
Note(s)1. Refer to design drawings for section locations.2. Assumed dimensions.
Abbreviation(s)ft = feetn/a = analysis does not converge, which suggests instability
TABLE 11
SHEET PILE WALL DEFLECTION ANALYSIS
Section D3
Section D4
Between D4 and end of sheet pile wall
July 2018 Final (100 Percent) Design Page 1 of 1

Volume
(6-inch, cy)
South Beach 0.1 75
Dry Docks 11.5 9,275
Piers 23, 24 0.2 150
Total 12 9,500
Volume
(6-inch, cy)
Total 23.1 18,600
Volume
(cy)
Intertidal Total
(South Beach, Pier 25, Former Shipway)
Subtidal Total (Former Shipway) 0.24 2,500
Note(s)
Abbreviation(s)
cy = cubic yard(s)ENR = enhanced natural recoveryRML = residual management layer
TABLE 12
RML, ENR, AND BACKFILL ESTIMATED VOLUME SUMMARY
Location Area (ac)
1.2 13,000
Residual Management Layer1
Location Area (ac)
Enhanced Natural Recovery Layer1
Location Area (ac)
Backfill2
ac = acre(s)
1. RML and ENR material for 6-inch layer placement.2. Intertidal backfill includes gravel beach mix and fish mix in south beach and adjacent to Pier 25; sand, gravel beach mix and fish mix in former shipway. Subtidal backfill includes sand only in former shipway.
July 2018 Final (100 Percent) Design Page 1 of 1

July 2018 Final (100 Percent) Design Page 1 of 5
TABLE 13
APPLICABLE OR RELEVANT AND APPROPRIATE REQUIREMENTS AND TO BE CONSIDERED CRITERIA 1
Topic Standard or Requirement Regulatory Citation
Project-Specific Comments/ Substantive Compliance Federal State or Local
Hazardous Waste Cleanup
Washington State cleanup standards
Washington State Model Toxics Control Act (RCW 70.105D; WAC 173-340)
MTCA is applicable or relevant and appropriate where the substantive requirements are more stringent than CERCLA and the NCP. The more stringent requirements of MTCA include, but are not limited to, acceptable excess cancer risk standards and the default to natural background for final remedies where risk-based threshold concentrations are below background.
Project cleanup levels were determined per SMS, a statutory requirement under MTCA and provided in Table 1 and in the ROD (Table 23). These cleanup levels will be attained by dredging contaminated sediments to the Remedial Action Levels and the placement of ENR/RML layer on the remaining sediment.
Confirmation that MTCA cleanup standards are met by conducting Post-ENR and RML Placement Sampling as described in the Field Sampling Plan (Appendix P). The sampling will document post-construction surface sediment chemical concentrations and the plan contains contingencies if surface sediment concentrations do not meet the Cleanup Levels.
Sediment Quality Sediment quality standards, cleanup screening levels
Sediment Management Standards (WAC 173-204)
The SMS are a statutory requirement under MTCA and applicable or relevant and appropriate under CERCLA. The SMS are numerical standards and are used to reduce and ultimately eliminate adverse effects on biological resources and significant health threats to humans from surface sediment contamination. The final remedy will meet requirements of the SMS. The SQS of the SMS are the standard for protection of benthic invertebrates.
Project cleanup levels were determined per SMS, a statutory requirement under MTCA. The remedial design addresses contaminated sediment to meet SMS.
The remedial action has been designed to reduce exposures of aquatic organisms from contaminants in sediments.
The fill material that will be placed will be clean imported material and will not exceed the values presented in Table 2 and Attachment 3 of the UAO (Cleanup Levels to be achieved in surface sediment at the end of construction). All fill materials (excluding riprap) will be sampled and submitted for chemical analyses before being authorized for use (see Field Sampling Plan in Appendix P).
Surface Water Quality Standards
Surface water quality standards
Ambient Water Quality Criteria established under Sections 304(a) of the Clean Water Act (33 U.S.C. 1251 et seq.; 40 CFR 131) http://water.epa.gov/scitech/swguidance/ standards/criteria/current/index.cfm
Washington Water Pollution Control Act— State Water Quality Standards for Surface Water(RCW 90.48; WAC 173-201A)
State surface water quality standards are applicable where the state has adopted, and USEPA has approved, Water Quality Standards (Aquatic Life Criteria), as are the National Toxics Rule standards. Federal-recommended Water Quality Criteria established under Section 304(a) of the Clean Water Act that are more stringent than state criteria and that are relevant and appropriate also apply. Both marine chronic and acute standards are used as appropriate.
Project includes a technical impracticability waiver for the AWQC for arsenic.
Monitoring for relevant AWQC will occur during construction and will be addressed as part of the Water Quality Monitoring Plan (WQMP; Appendix M) and subsequent Clean Water Act 401/402 ARAR Memorandum that will be prepared by USEPA.
Best Management Practices are described in Appendix J. These BMPs primarily focus on reducing turbidity, which is the parameter that has the highest potential for exceeding the water quality criteria due to implementation of the remedial action. It is expected that during construction, water quality will comply with the requirements of the Clean Water Act 401/402 ARAR Memorandum to be issued by USEPA.

July 2018 Final (100 Percent) Design Page 2 of 5
TABLE 13
APPLICABLE OR RELEVANT AND APPROPRIATE REQUIREMENTS AND TO BE CONSIDERED CRITERIA 1
Topic Standard or Requirement Regulatory Citation
Project-Specific Comments/ Substantive Compliance Federal State or Local
Waste Treatment, Storage, and Disposal
Hazardous Waste Management
Resource Conservation and Recovery Act (42 U.S.C. 6901-6992K; 40 CFR 260-279, 265)
Washington State Dangerous Waste Regulations (RCW 70.105; WAC 173-303)
No known listed or characteristic hazardous wastes are present at the Site. However, if such wastes are encountered during Site cleanup, portions of RCRA and Washington State Dangerous Waste Regulations related to hazardous waste determination and analytical testing, and on-site storage, treatment, and disposal may be ARARs to this project. State criteria for dangerous waste are applicable; Federal criteria may be relevant and appropriate.
The Site Management Plan (Appendix K) includes a Contingency Plan (Section 1) and Pollution Control and Mitigation Plan (Section 2) to address this regulation.
If hazardous/dangerous waste is encountered, the remedial action will comply with the state generator rules for accumulating or managing such waste on site for up to 90 days (40 CFR 262; WAC 173-303-17-202). Unanticipated circumstances could necessitate compliance with other hazardous/dangerous waste requirements.
Land Disposal of Waste
Management and disposal of materials containing PCBs
Toxic Substances Control Act (15 U.S.C. 2605; 40 CFR 761.61)
Washington State Dangerous Waste Regulations (RCW 70.105; WAC 173-303, 140, 141)
No known TSCA wastes are present at the Site. However, if such wastes are encountered during Site cleanup, disposal of PCBs may be applicable.
Hazardous waste Resource Conservation and Recovery Act Land Disposal Restrictions (42 U.S.C. 6901-6992K; 40 CFR 268)
No known listed or characteristic hazardous wastes are present at the Site. However, if such wastes are encountered during Site cleanup, portions of RCRA and Washington State Dangerous Waste Regulations related to hazardous disposal would be applicable to this project. State dangerous waste is defined more broadly than Federal hazardous waste.
The Site Management Plan (Appendix K) includes a Contingency Plan (Section 1), Pollution Control and Mitigation Plan (Section 2), and a Transportation and Disposal Plan (Section 3) to address this regulation.
Solid Waste Disposal Requirements for solid waste handling, management, and disposal
Solid Waste Disposal Act (42 U.S.C. 6901- 6992K; 40 CFR 257-258)
Solid Waste Handling Standards (RCW 70.95; WAC 173-350)
Covers nonhazardous waste generated during remedial activities unless wastes meet recycling exemptions.
Dredged material, piling and debris will be disposed of at permitted disposal and recycling facilities that are compliant with the solid waste disposal regulations and are permitted to accept impacted materials (Columbia Ridge and Landfill Roosevelt Landfill).
Sediment transloading will occur at the Waste Management 8th Avenue Facility and Lafarge Facility.
Recyclable steel will be recycled at Seattle Iron and Metals or Schnitzer Steel.

July 2018 Final (100 Percent) Design Page 3 of 5
TABLE 13
APPLICABLE OR RELEVANT AND APPROPRIATE REQUIREMENTS AND TO BE CONSIDERED CRITERIA 1
Topic Standard or Requirement Regulatory Citation
Project-Specific Comments/ Substantive Compliance Federal State or Local
Dredge/Fill and Other In-water Construction Work
Discharge of dredged/fill material into navigable waters or wetlands
Clean Water Act (33 U.S.C. 1341, 1344; 40 CFR 121.2, 230, 231; 33 CFR 320, 322, 323) Rivers and Harbor Appropriations Act (33 U.S.C. 403, 408)
Hydraulic Code Rules (RCW 77.65; WAC 220-110)
Requirements for in-water dredging, filling, or other in-water construction.
The project design includes coordination with Washington Department of Fish and Wildlife. This coordination will address all substantive requirements of the Hydraulic Project Approval permitting process, including evaluation of potential mitigation requirements and definition of work procedures and timing.
These regulations are designed to protect fish and shellfish during in water construction. The requirements are being addressed by:
conducting dredging, piling removal, shoreline excavation and backfill placement activities during authorized construction work windows (August 1 to February 15),
implementing BMPs (Appendix J).
Chapter 220-660-050 (Hydraulic Code Rules) identifies procedures for obtaining a Hydraulic Project Approval and requires, in part, submission of detailed plans (provided in Appendix E) and specifications (Appendix R), and a description of the measures that will be implemented for the protection of fish (BMPs; Appendix J).
All the BMPs detailed in Appendix J are focused on reducing potential impacts to water quality and aquatic organisms.
The Clean Water Act 401/402 ARAR Memorandum meets the intent of 33 U.S.C. § 1341.
A portion of the Site is within the West Waterway. USEPA completed a Section 408 consultation to review the final depths after placement of clean sand layer within the navigation channel (Appendix B). This consultation addresses the substantial requirements of 33 U.S.C. § 408.
Open-water disposal of dredged sediments
Marine Protection, Research and Sanctuaries Act (33 U.S.C. 1401-1445)
Dredged Materials Management Program (RCW 79.105.500; WAC 332-30-166 (3))
Regulates dumping of dredged material in open water.
Project does not include placement of dredged material in open water.
Discharge to Surface Water
Point source standards for new discharges to surface water
National Pollutant Discharge Elimination System (33 U.S.C. 1342; 40 CFR 122, 125)
Discharge Permit Program (RCW 90.48; WAC 173-216, 220, 226)
The dredge return water from the transload facilities will be discharged to publicly owned treatment works and therefore complies with the intent of 33 U.S.C. § 1342 and meets the substantive requirements of the NPDES rules (40 CFR 122 and 40 CFR 125).
The dewatering of dredge material at the transload facilities is detailed in Section 5 of the Dewatering Plan (Appendix N).
The Contractor has prepared and will implement a Pollution Control Plan (Section 2 of the Site Management Plan (Appendix K).
Project BMPs are identified in Appendix J.
The Transportation and Disposal Plan (Section 3 of the Site Management Plan [Appendix K]) covers the transload facilities barge unloading, sediment handling, and water management.

July 2018 Final (100 Percent) Design Page 4 of 5
TABLE 13
APPLICABLE OR RELEVANT AND APPROPRIATE REQUIREMENTS AND TO BE CONSIDERED CRITERIA 1
Topic Standard or Requirement Regulatory Citation
Project-Specific Comments/ Substantive Compliance Federal State or Local
Shoreline Construction and development Coastal Zone Management Act (16 U.S.C. 1451 et seq.)
Shoreline Management Act (WAC 173-16)
These regulations are applicable to construction activities within 200 feet of the shoreline.
The remedial action will reduce exposure to contaminants in aquatic biota over 40 acres of intertidal and subtidal habitats in the West Waterway and the nearshore of Elliott Bay. The intent and expected results of the remedial action will be consistent with the Shoreline Management Act, as well as the Shoreline Master Program of the City of Seattle, by:
Protecting “…the water of the state and their aquatic life...”; and
Protecting shoreline resources.
The proposed remediation project is consistent with the Coastal Zone Management Act since it is designed remove contaminants from the aquatic environment which will lead to improvement of habitats in the coastal zone.
Habitat for Fish, Plants, or Birds
Conserve endangered or threatened species, consult with species listing agencies, evaluate and mitigate habitat impacts
Clean Water Act Section 404 (b)(1) Endangered Species Act of 1973 (16 U.S.C. 1531 et seq.; 50 CFR 17, 222-224, 226.212 to 402); Magnuson-Stevens Fishery Conservation and Management Act (16 U.S.C. 1801-1884) Migratory Bird Treaty Act (16 U.S.C. 703-712; 50 CFR 10, 17) Eagle Protection Act (16 U.S.C. 668; 50 CFR 22)
City of Seattle Master Plan Seattle Municipal Code 23.60
Consult and obtain Biological Opinion.
A Biological Assessment (Appendix F) has been prepared to ensure compliance with the Endangered Species Act by identifying the presence of threatened, endangered, proposed, or candidate species, or their habitat within the vicinity of the cleanup action. USEPA will consult with the National Oceanic and Atmospheric Administration, National Marine Fisheries Service, and the US Fish and Wildlife Service to obtain a Biological Opinion.
BMPs in Section 3.4 of the Biological Assessment will be implemented to minimize and avoid damage to the environment resulting from project operations.
The intent of the Magnuson-Stevens Act is met by the Essential Fish Habitat Assessment that is provided in the Biological Assessment (Attachment C).
The Migratory Bird Treaty Act governs the taking, killing, possession, transportation, and importation of migratory birds, their eggs, parts, and nests. The project is not expected to produce conditions that would result in a take as defined under the Act.
The Bald and Golden Eagle Protection Act of 1940 protects the bald eagle and the golden eagle by prohibiting, except under certain specified conditions, the taking, possession, and commerce of such birds. There are no known bald eagle nests within the buffers recommended by the US Fish and Wildlife Service; therefore, the project is complaint with the act.

July 2018 Final (100 Percent) Design Page 5 of 5
TABLE 13
APPLICABLE OR RELEVANT AND APPROPRIATE REQUIREMENTS AND TO BE CONSIDERED CRITERIA 1
Topic Standard or Requirement Regulatory Citation
Project-Specific Comments/ Substantive Compliance Federal State or Local
Air Quality—TBC
State implementation of ambient air quality standards. Puget Sound Clean Air Agency ambient and emission standards.
Clean Air Act—42 U.S.C. §7401
Washington State Clean Air Act (70.94 RCW) General Requirements for Air Pollution Sources (WAC 173‐400) Puget Sound Clean Air Agency Regulation I, PSCAA Regulation III
Potentially applicable to the cleanup which includes sediment handling.
Off‐site sediment handling and/or treatment/disposal facilities will comply with applicable air regulations and maintain appropriate permits.
BMPs to control dust. Substantive requirements are addressed in the Site Management Plan (Appendix K).
Construction Activities—TBC
Local requirements and standards for construction.
King County Codes: King County Building and Construction Standards (KCC Title 16), King County Clearing and Grading Code (KCC 16.82), Shoreline Master Program (KCC Title 25). Seattle Municipal Code: Dredging (SMC 23.60A), Grading (SMC 22.170), Noise (SMC 25.08), Light (SMC 23.50)
Applicable to design and construction.
KCC Title 16 is considered in design criteria for analysis of shoreline protection.
SMC 22.170 is considered in design criteria for final grade slopes.
BMPs (Appendix J) and an Erosion and Sedimentation Control Plan (Appendix S) will be implemented to control erosion.
Note(s)
1. The Permitting and Site Access Plan (Appendix T) presents a narrative of how the project attains compliance with the ARARs.
Abbreviation(s) ARAR = applicable or relevant and appropriate requirement AWQC = Ambient Water Quality Criterion BMP = best management practice CERCLA = Comprehensive Environmental Response, Compensation,
and Liability Act CFR = Code of Federal Regulations ENR = enhanced natural recovery KCC = King County Code MTCA = Model Toxics Control Act NCP = National Contingency Plan NPDES = National Pollutant Discharge Elimination System
PCB = polychlorinated biphenyl PSCAA = Puget Sound Clean Air Agency RCRA = Resource Conservation and Recovery Act RCW = Revised Code of Washington RML = residual management layer ROD = Record of Decision Site = Lockheed West Seattle Superfund Site SMC = Seattle Municipal Code SMS = sediment management standards SQS = sediment quality standards TBC = To-be-Considered Criteria TSCA = Toxic Substances Control Act
UAO = Unilateral Administrative Order U.S.C. = United States Code USEPA = United States Environmental Protection Act WAC = Washington Administrative Code WQMP = Water Quality Monitoring Plan

July 2018 Revised Final (100 Percent) Design Report
APPENDICES

July 2018 Revised Final (100 Percent) Design Report
Appendix A—Pre-Design Chemistry Data Summary and Dredge Extent Verification
Appendix B—Section 408 Substantive Compliance Memorandum
Appendix C—Construction Quality Management Plan
Appendix D—Construction Quality Assurance Plan
Appendix E—Design Drawings
Appendix F—Biological Assessment
Appendix G—Archaeological Work, Monitoring, and Inadvertent Discovery Plan
Appendix H—Basis of Design Calculations
Appendix I—Debris/Pile Removal Support System Plan
Appendix J—Best Management Practices
Appendix K—Site Management Plan (includes Contingency Plan, Pollution Control Plan, Transportation and Disposal Plan,
Green and Sustainable Remediation Plan, and Climate Change Adaptation Plan)
Appendix L—Excavation, Dredging, and Backfill Plan
Appendix M—Water Quality Monitoring Plan
Appendix N—Dewatering Plan
Appendix O—Construction Water Management Plan
Appendix P—Field Sampling Plan, Construction and Post-Construction Sediment Monitoring Quality Assurance Project Plan, and Site-Specific Health & Safety Plan
Appendix Q—Survey Plan
Appendix R—Specifications
Appendix S—Erosion and Sedimentation Control Plan
Appendix T—Permitting and Site Access Plan
Appendix U—Vessel Management Plan
Appendix V—Project Implementation Schedule
Appendix W—Equipment Decontamination Plan
Appendix X—Capital and Operation and Maintenance Cost Estimate
Appendix Y—Institutional Control Implementation and Assurance Plan
Appendix Z—Long-Term Monitoring and Maintenance Plan


