
Review for Introduction to Remote Sensing:
Science Concepts and Technology
Ann JohnsonAssociate [email protected]
Funded by National Science Foundation Advanced Technological Education program [DUE #1304591. Author’s opinions are not necessarily shared by NSF
“Empowering Colleges: Expanding the Geospatial Workforce”

What is Remote Sensing and how is it used? Passive and Active Remote Sensing Electromagnetic Spectrum and sensor wavelength and their “band numbers” Resolutions – Temporal, Spatial, Spectral and Radiometric Composite images: Pixels, Brightness and Digital Numbers Pixels and its Remote Sensing Signature graphic
Finding and using data – Landsat focused
Lidar – what is it and how can it be used Resources to learn more

USGS DefinitionAcquiring information about a natural
feature or phenomenon, such as the Earth’s surface, without actually being in contact with it.
Sensor can be ground based, aerial or satellite.

Not just a pretty picture! How it can be used!
• Land Use Change• Climate• Disasters
▫ Floods, fires, volcanoes, earthquakes• Forestry• Agriculture• Many more!

Factors to consider when you use remote sensing data to understand or solve a geospatial problem• Scale – or Resolution
▫ Where is the study location?▫ How large is the study are?▫ What is the “size” of features under study?▫ Is this a one time event or over multiple times
over days, months or years?• Access to needed resources:
▫ Data and its cost?▫ Hardware and software and skills to use them
• Why is study important? Important for “real-world use by industry or government - ROI

•Use “sensors” to detect and acquire the “information” about features
The human eye as a sensor and brain
as processor!
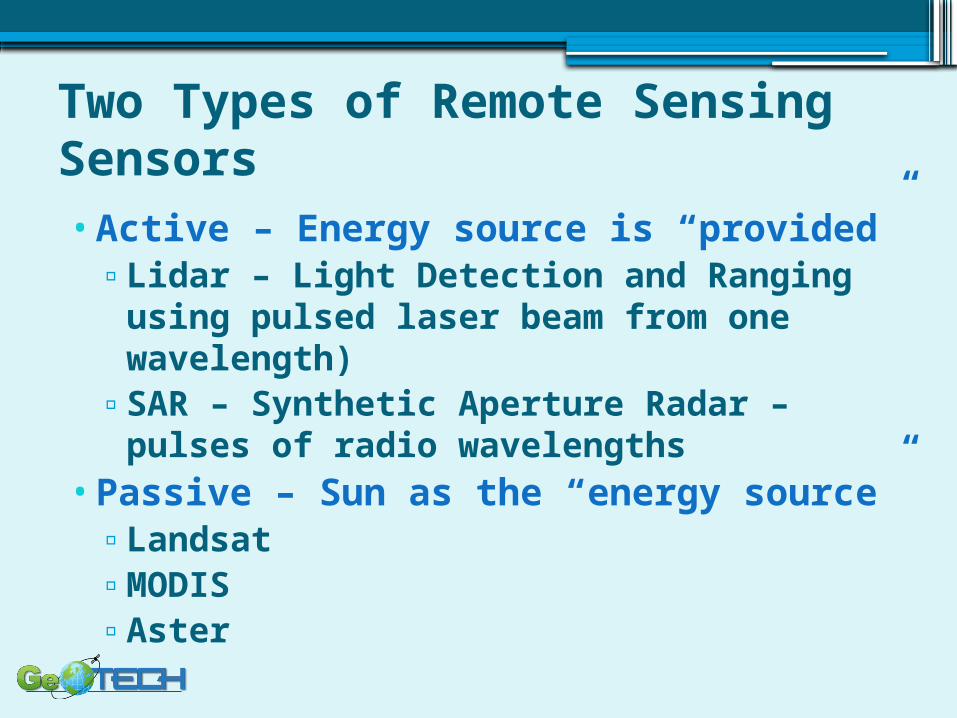
Two Types of Remote Sensing Sensors•Active – Energy source is “provided”
▫Lidar – Light Detection and Ranging using pulsed laser beam from one wavelength)
▫SAR – Synthetic Aperture Radar – pulses of radio wavelengths
•Passive – Sun as the “energy source”▫Landsat▫MODIS▫Aster
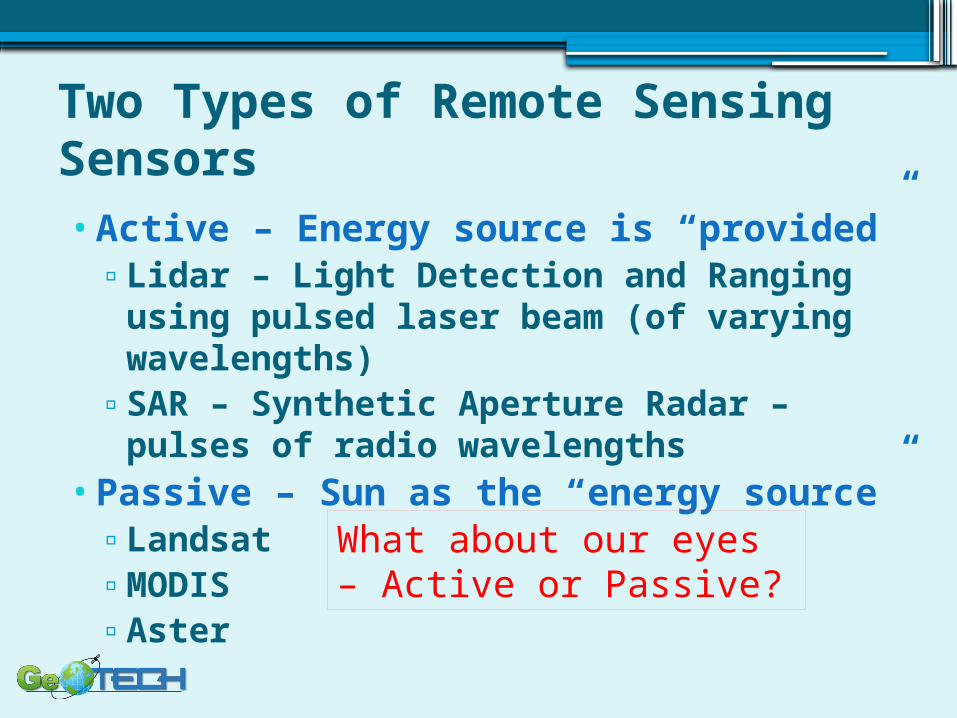
Two Types of Remote Sensing Sensors•Active – Energy source is “provided”
▫Lidar – Light Detection and Ranging using pulsed laser beam (of varying wavelengths)
▫SAR – Synthetic Aperture Radar – pulses of radio wavelengths
•Passive – Sun as the “energy source”▫Landsat▫MODIS▫Aster
What about our eyes – Active or Passive?
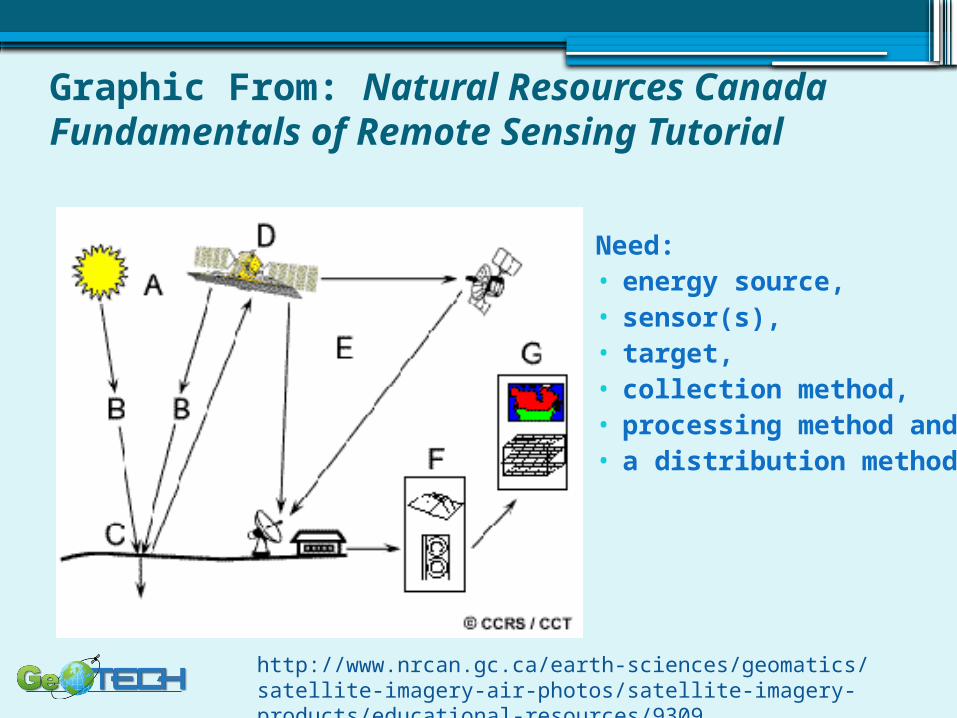
Graphic From: Natural Resources Canada Fundamentals of Remote Sensing Tutorial
Need:• energy source,• sensor(s),• target, • collection method, • processing method and • a distribution method
http://www.nrcan.gc.ca/earth-sciences/geomatics/satellite-imagery-air-photos/satellite-imagery-products/educational-resources/9309

Electromagnetic Spectrum
•NASA Movie http://missionscience.nasa.gov/ems/index.html
•Can download a NASA book on the Tour of the Electromagnetic Spectrum
http://missionscience.nasa.gov/ems/TourOfEMS_Booklet_Web.pdf

crestcrestOne Wavelength
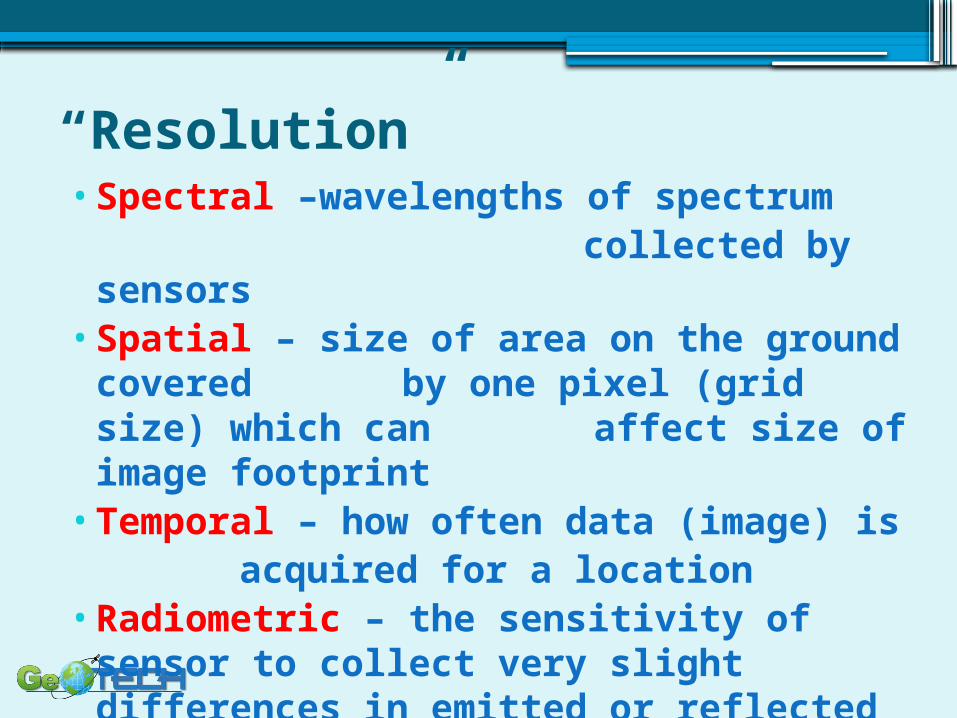
“Resolution”•Spectral –wavelengths of spectrum collected by sensors•Spatial – size of area on the ground
covered by one pixel (grid size) which can affect size of image footprint
•Temporal – how often data (image) isacquired for a location
•Radiometric – the sensitivity of sensor to collect very slight differences in emitted or reflected energy

Landsat SensorsCollect data inspecific Wavelengthsor “Bands”of ElectromagneticSpectrum
• Band 1: 0.45 - 0.52 m (Blue)• Band 2: 0.52 - 0.60 m (Green)• Band 3: 0.63 - 0.69 m (Red)• Band 4: 0.76 - 0.90 m (Near infrared)• Band 5: 1.55 - 1.75 m (Mid-Infrared)• Band 6: 10.4 - 12.5 m (Thermal infrared)• Band 7: 2.08 - 2.35 m (Mid-infrared)
123
6 7 5 4
Our Eyes
Landsat 7
Spectral Resolutions

Spectral Resolutions• SAR; radar• Lidar; 600-1000 nm (some visible and some
infrared)• Multispectral: 450-2300 nm (some visible and
some infrared) LidarMultispectral

Spatial Resolution Comparison – Scale
• High spatial resolution:▫ Meter to sub meter pixels▫ Small objects can be identified▫ Small area for each image footprint
• Moderate spatial resolution▫ Generally 30 meter pixels (Landsat)▫ Object identification generally greater than 30
meters▫ Moderate area image footprint
• Low spatial resolution▫ 1 KM or larger pixels (MODIS)▫ Objects smaller than 1 KM not observable▫ Very large footprint
http://biodiversityinformatics.amnh.org/tool.php?content_id=144

Look at Examples of Different types of Imagery and compare their “footprints” – logon to link below:
http://biodiversityinformatics.amnh.org/tool.php?content_id=144
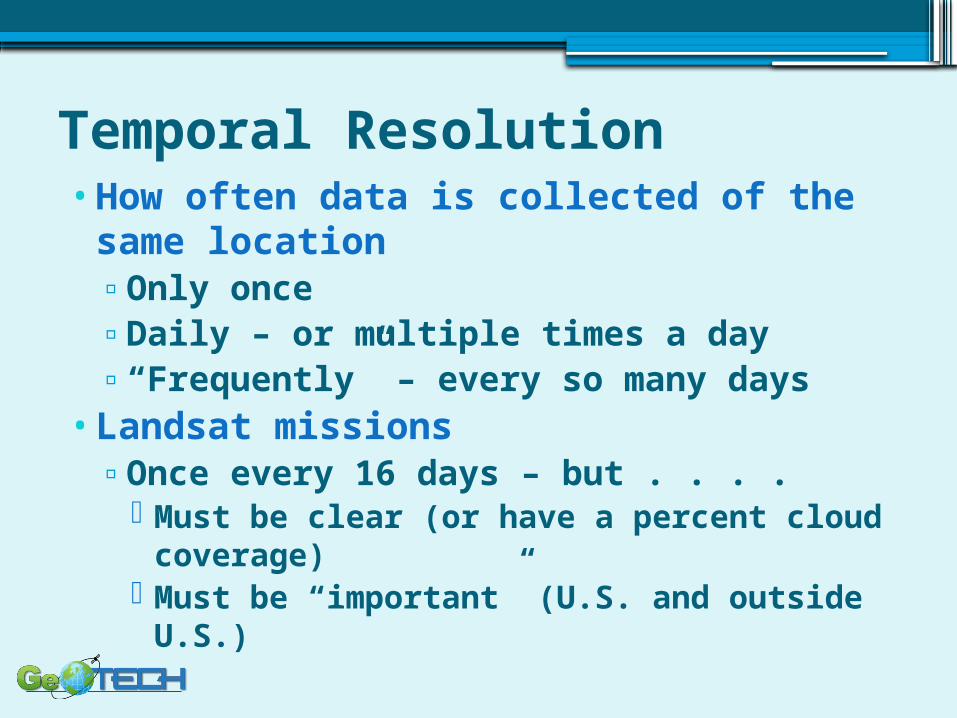
Temporal Resolution•How often data is collected of the
same location▫Only once▫Daily – or multiple times a day▫“Frequently” – every so many days
•Landsat missions▫Once every 16 days – but . . . .
Must be clear (or have a percent cloud coverage)
Must be “important” (U.S. and outside U.S.)

Landsat Image – Orbits (Path and Rows)
View Orbits video

Why focus on Landsat Data?
•Cost •Access•Archive •Tools and other
resources
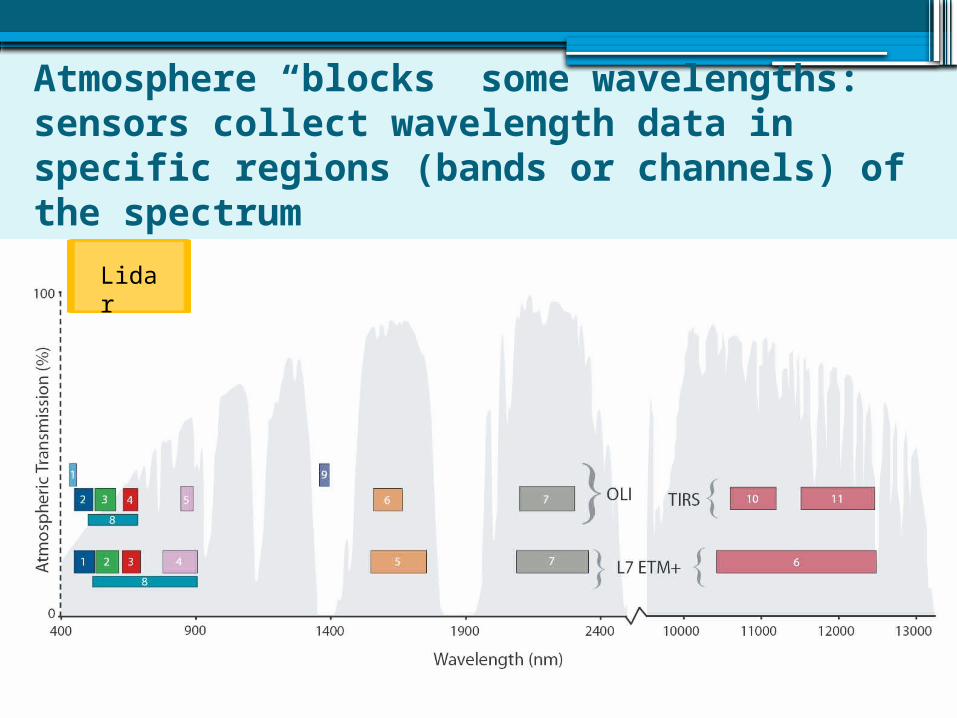
Atmosphere “blocks” some wavelengths: sensors collect wavelength data in specific regions (bands or channels) of the spectrum
Lidar

Gray shading: Wavelength Regions with good transmission
Lidar

What Does “data” look like? Landsat 7 Spectral Bands and “gray scale” values of each band data set
Landsat 7 - Band data comes in as rasters with grayscale values 0 to 255Landsat 8 – more than 4,000 scaled to 55,000 gray values

Radiometric Resolution Ability of a Sensor to
discriminate very small differences in reflected or emitted energy
Pixel Brightness – White to Black in shades of Gray for one band
Digital Number: the numeric values of its Brightness
Landsat 5 and 7 are 8 bit for 256 gray levels (0 to 255)
Landsat 8 is 12 Bit for 4,096 gray levels (scaled to 55,000)
A B
C

Creating Visualizations: CompositesBrightness values (DN) from three Bands are combined and colored on a computer monitor by designating which of the 3 bands will be coded as Red, Blue or Green
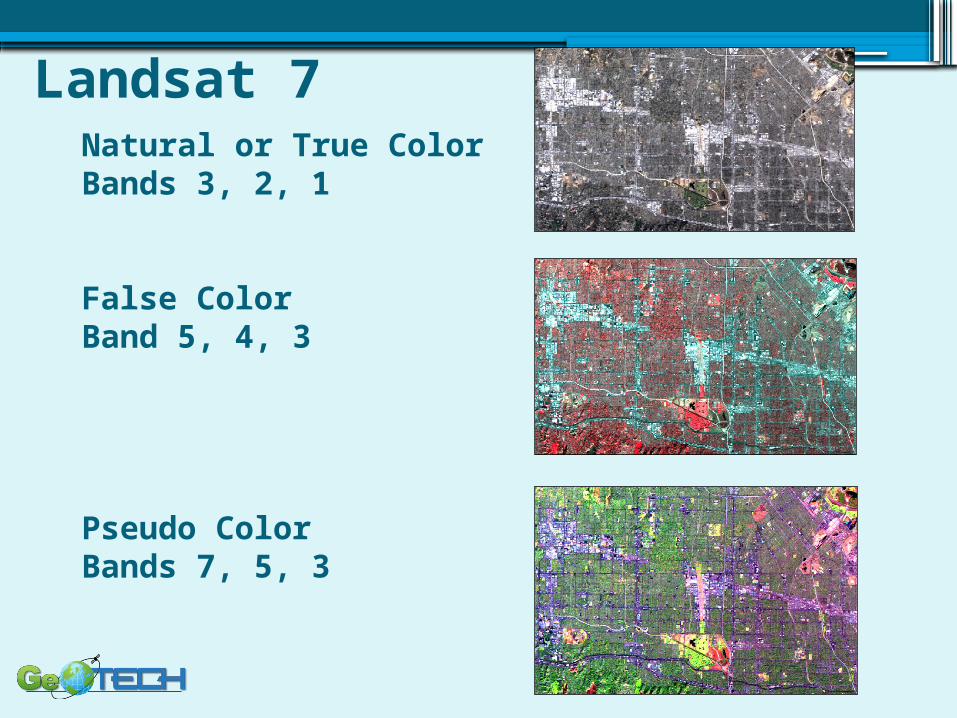
Landsat 7Natural or True ColorBands 3, 2, 1
False ColorBand 5, 4, 3
Pseudo Color Bands 7, 5, 3
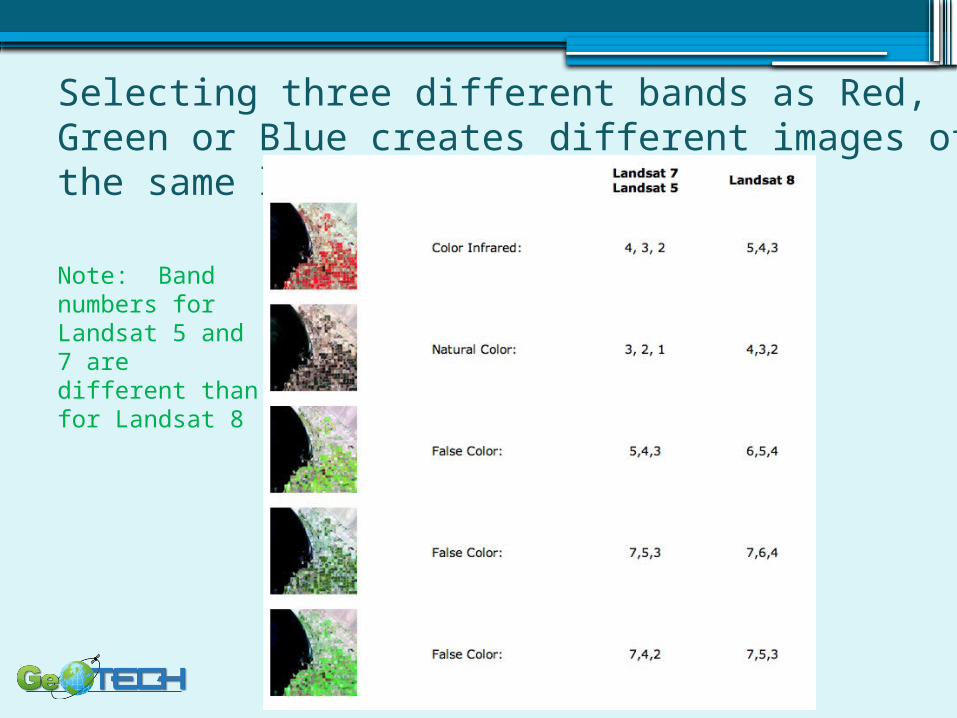
Selecting three different bands as Red, Green or Blue creates different images of the same location
Note: Band numbers for Landsat 5 and 7 are different than for Landsat 8

Resource for Viewing Natural and False Color Composites on USGS Website•http://landsat.usgs.gov/
LDCM_Image_Examples.php
•Go to this site and use the swipe to see the difference using different bands for images from four regions of the U.S.

Change Matters Website•See
http://www.esri.com/software/landsat-imagery/viewer
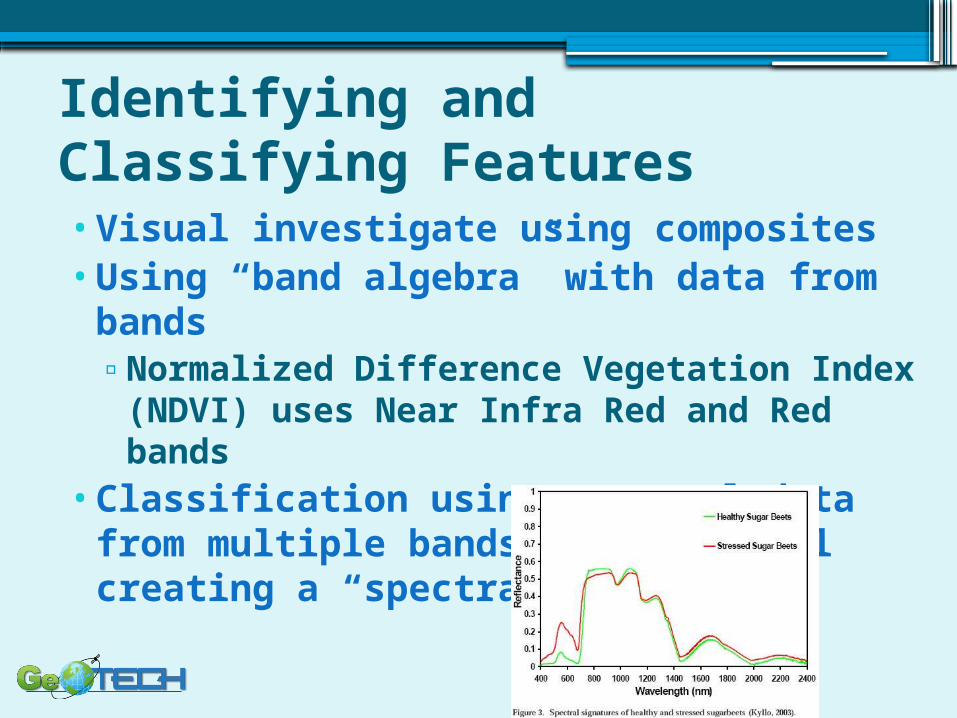
Identifying and Classifying Features •Visual investigate using composites•Using “band algebra” with data from
bands ▫Normalized Difference Vegetation Index
(NDVI) uses Near Infra Red and Red bands
•Classification using spectral data from multiple bands for one pixel creating a “spectral signature”
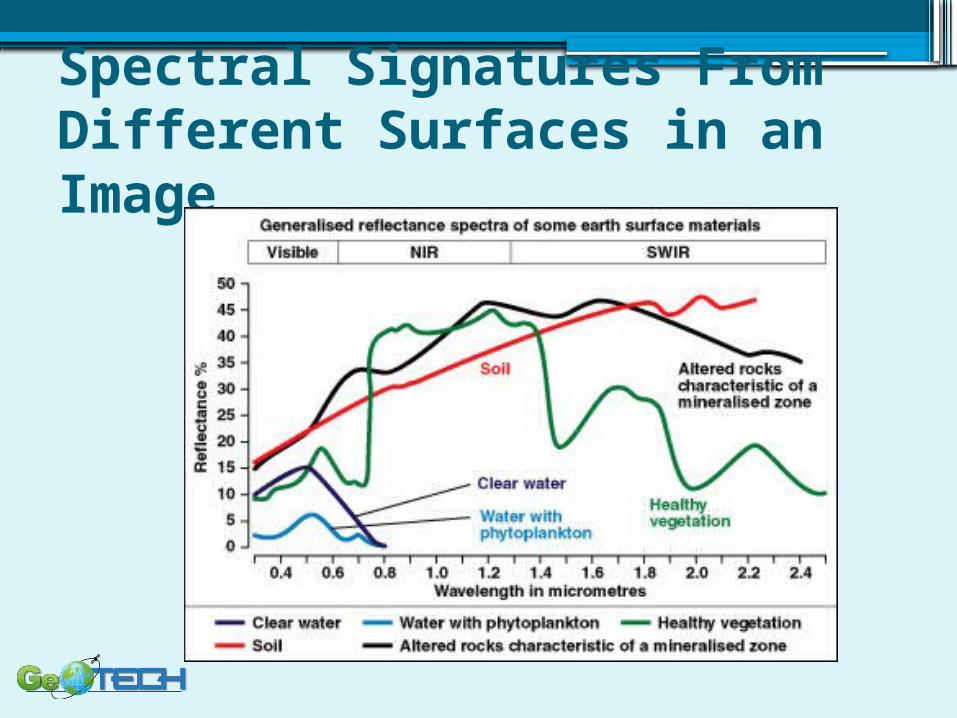
Spectral Signatures From Different Surfaces in an Image

NDVI Leaf
NDVI –Image Analysis and “Greeness” Using NIR and Red Bands

Land Cover Change – and “Greeness” - NDVI

Classification Using Software
•Unsupervised Classification▫User tells Software how many “classes” to
group the image data into and software “gathers like values” into “classes” with similar spectral values
▫User then labels the classes into land use types and may combine classes
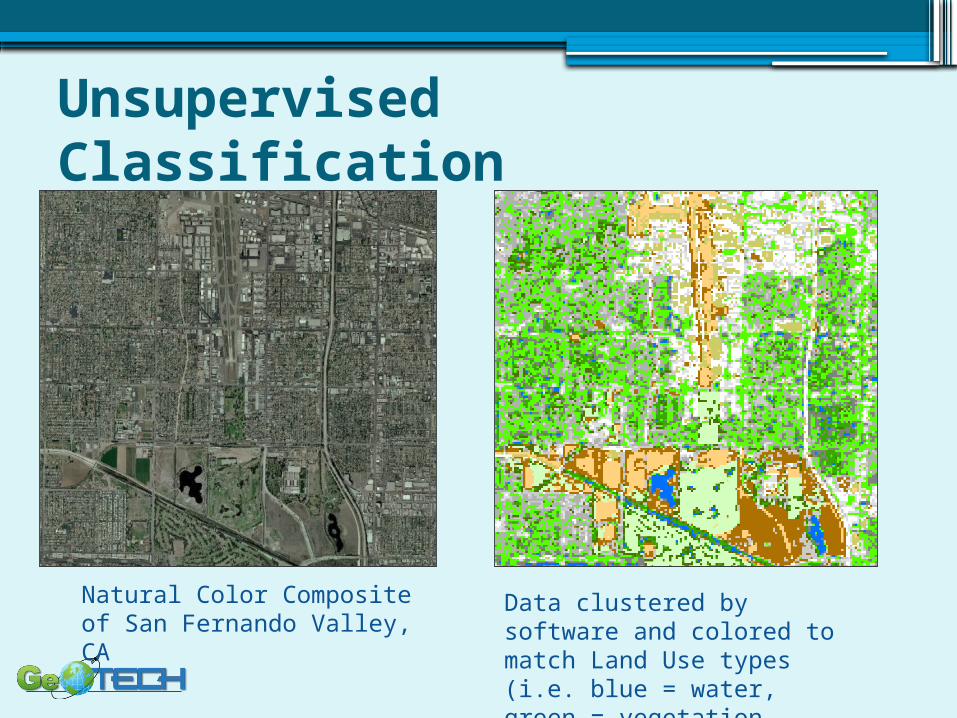
Unsupervised Classification
Natural Color Composite of San Fernando Valley, CA
Data clustered by software and colored to match Land Use types (i.e. blue = water, green = vegetation, etc.)

•Supervised Classification
▫User identifies pixels that are different types of feature (soil, urban, vegetation, etc) and creates a file with spectral information that can be used by software.
▫Software uses spectral value file of the different features and classifies pixels based on the specified land cover types.

So many satellites! Resources:•Satellite Viewer•http://science.nasa.gov/iSat/?
group=visual&satellite=14484
•EarthNow! Landsat Image Viewer▫Real time view as data is collected
showing current path of satellite▫http://earthnow.usgs.gov/
earthnow_app.html?sessionId=fdbe7bc05944802eda2c68d1e603ed8462919
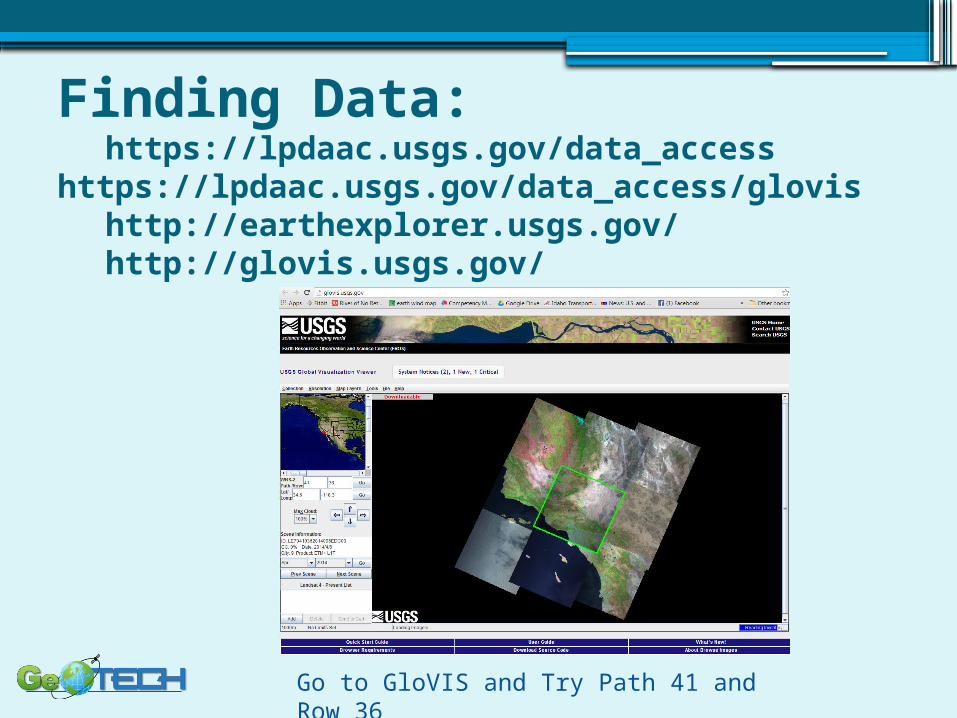
Finding Data:https://lpdaac.usgs.gov/data_access
https://lpdaac.usgs.gov/data_access/glovishttp://earthexplorer.usgs.gov/ http://glovis.usgs.gov/
Go to GloVIS and Try Path 41 and Row 36

Lidar – Active Remote Sensing NOAA Lidar Tutorial: http://www.csc.noaa.gov/digitalcoast/_/pdf/lidar101.pdf

Thank You!Much of the material for this Presentation was
developed by iGETT-Remote Sensing grant from the National Science Foundation (DUE 1205069)
More Exercises:iGETT.delmar.edu
Concept Modules on YouTube Channel atiGETT Remote Sensing Education
Ann [email protected]@kctcs.edu


