SMALL CAP M&A REVIEW FINANCIAL ADVISORS First Quarter 2017
REUTERS / Peter Kujundzic
Latin America Involvement Small Cap Rankings (MM17a) 5
Japanese Involvement Small Cap Rankings (MM15a)
21
https://www.thomsonone.com
6
7
8
9
Chinese Involvement Small Cap Rankings (MM20a)
Hong Kong Involvement Small Cap Rankings (MM12a)
Singapore Involvement Small Cap Rankings (MM14a)
4
22
UK Involvement Small Cap Rankings (MM4a)
French Involvement Small Cap Rankings (MM5a)
Nordic Involvement Small Cap Rankings (MM9a)
Ranking Criteria Summary
Eastern Europe Involvement Small Cap Rankings (MM16a)
20
Indian Involvement Small Cap Rankings (MM21a)
Australia/New Zealand Involvement Small Cap Rankings (MM11a)
First Quarter 2017 | Mergers & Acquisitions | Financial Advisors
Small Cap M&A ReviewTable of Contents
Worldwide Small Cap M&A Deals Intelligence
Worldwide Small Cap Rankings (MM1a)
US Target Small Cap Rankings (MM2a) 3
Canadian Involvement Small Cap Rankings (MM22a)
1
2
European Involvement Small Cap Rankings (MM3a)
19
German Involvement Small Cap Rankings (MM6a)
Italian Involvement Small Cap Rankings (MM7a)
Spanish Involvement Small Cap Rankings (MM8a)
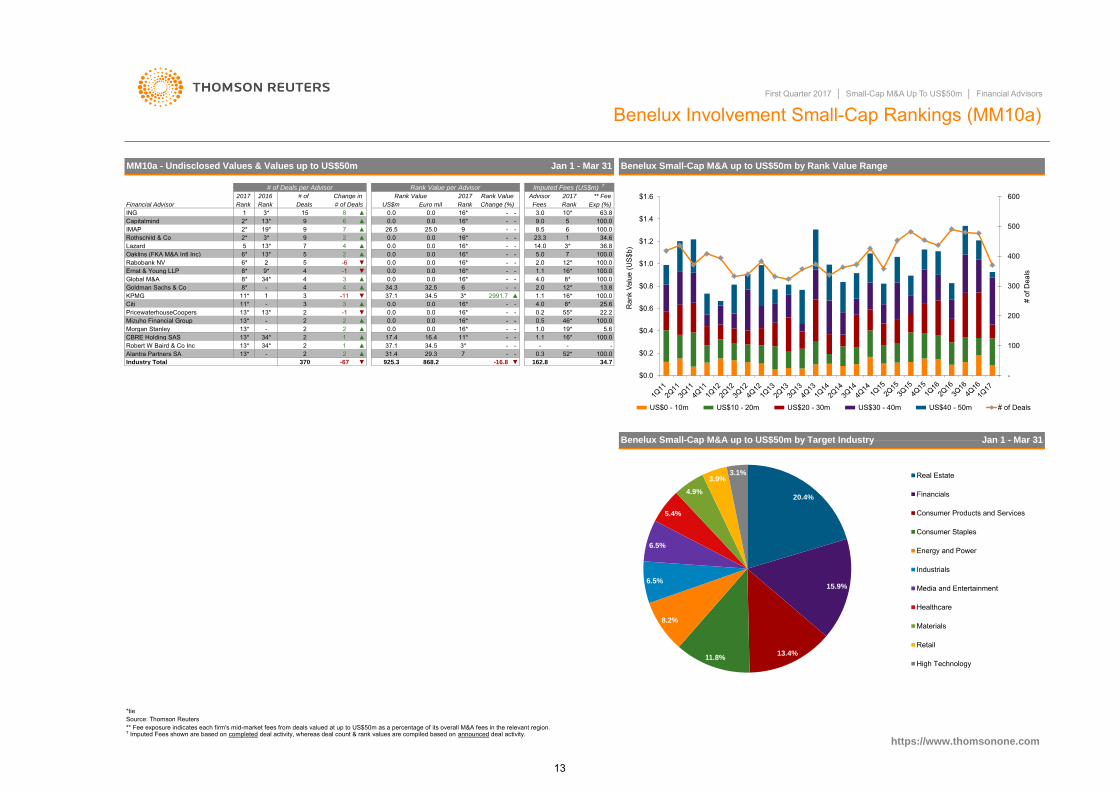
Benelux Involvement Small Cap Rankings (MM10a)
Hochinma Involvement Small Cap Rankings (MM13a)
10
15
16
17
18
11
12
13
14
Worldwide Small-Cap M&A up to US$50m by Rank Value Range
112 -33.8 ▼
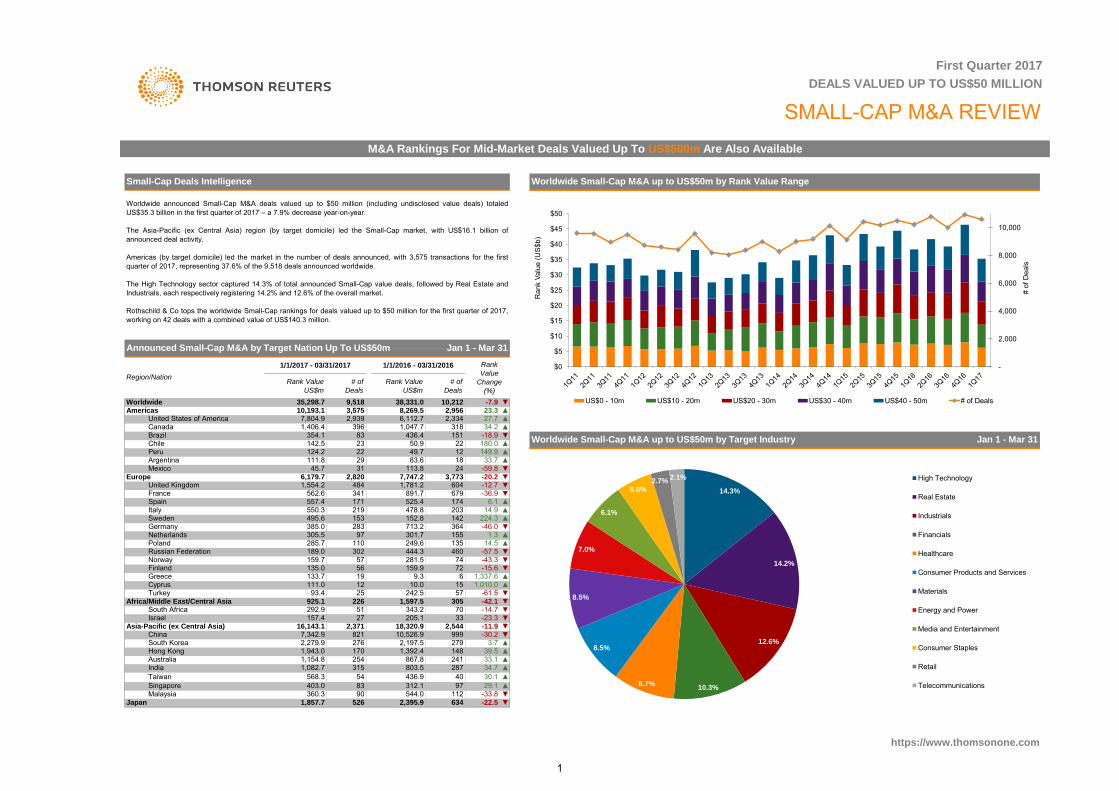
Worldwide announced Small-Cap M&A deals valued up to $50 million (including undisclosed value deals) totaledUS$35.3 billion in the first quarter of 2017 – a 7.9% decrease year-on-year.
The Asia-Pacific (ex Central Asia) region (by target domicile) led the Small-Cap market, with US$16.1 billion ofannounced deal activity.
Americas (by target domicile) led the market in the number of deals announced, with 3,575 transactions for the firstquarter of 2017, representing 37.6% of the 9,518 deals announced worldwide.
The High Technology sector captured 14.3% of total announced Small-Cap value deals, followed by Real Estate andIndustrials, each respectively registering 14.2% and 12.6% of the overall market.
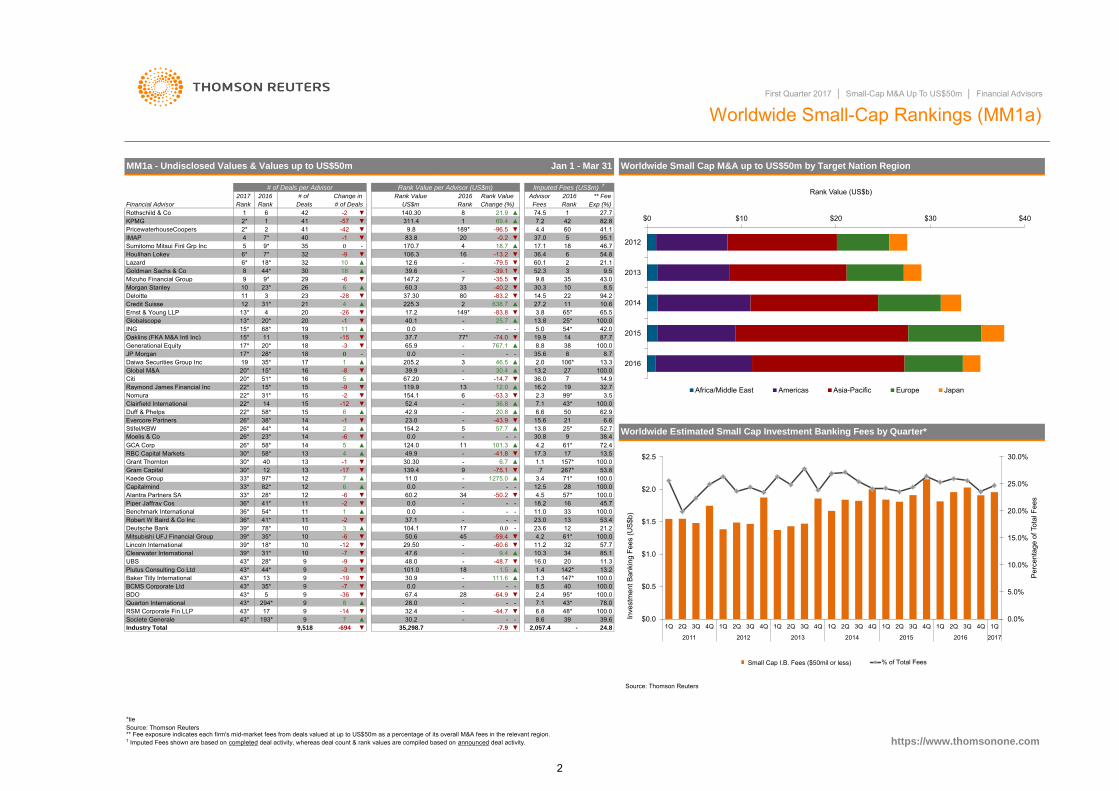
Rothschild & Co tops the worldwide Small-Cap rankings for deals valued up to $50 million for the first quarter of 2017,working on 42 deals with a combined value of US$140.3 million.
Jan 1 - Mar 31
WorldwideAmericas
United States of America 7,804.9
Worldwide Small-Cap M&A up to US$50m by Target Industry
▼
▲
Asia-Pacific (ex Central Asia) -11.9
Brazil
▼
-30.2
▲
Peru
436.450.9
▲
10,193.1
3961,406.4
Chile
Canada
142.5
3,575
124.2
Turkey
Small-Cap Deals Intelligence
Argentina 111.8 29 83.6 18
8,269.5
Rank Value
US$m
China
Israel
Africa/Middle East/Central Asia
16,143.1
157.4292.9South Africa
27
Russian Federation
135.0Finland
Germany
Poland189.0
74
713.2
12
Italy
305.5110
Netherlands
159.7
153283
Sweden
97285.7
Europe
354.1
Mexico 45.7
Spain
22
484
312,8206,179.7
341
385.0
171
57
219
302
557.4550.3
562.6
51
9.3
364301.7
281.5444.3
135
821
159.9
7,342.9
▲10.0
56
25
19
2,371
242.5 57
Greece
93.4925.1 226
Cyprus
305
133.7111.0
United KingdomFrance
Norway
495.6
2,279.9South Korea
1,554.2
▲
72
14.5
1,337.6▼
▼
https://www.thomsonone.com
Singapore
1,082.7
90403.0
634526Japan
54
Malaysia
568.3Taiwan
170
360.3
1,943.01,154.8
83
254315
Hong Kong
IndiaAustralia
1,857.7
First Quarter 2017
DEALS VALUED UP TO US$50 MILLION
SMALL-CAP M&A REVIEW
312.1
279148
205.1
▲▲
29.1
-18.9180.0
▼
1.3
▲
▲
-12.7-20.2
-36.9
▲▼
▼
▼▼
1,047.7 318151
14.96.1
24
478.8
891.7 6791,781.2
174
12
604
Rank Value
US$m
38,331.0 10,212
7,747.2
9,51835,298.7
# of
Deals
83
49.7
2,956
460
Region/Nation
1/1/2017 - 03/31/2017 1/1/2016 - 03/31/2016
2,939 2,334
23
6,112.7
22
113.8
Rank
Value
Change
(%)
34.227.7
-7.9
# of
Deals
▲▼
23.3▲▲
142 224.3
149.9
▲▲
-59.8
203
3,773
33.7
155
803.5
544.0
525.4
6
249.6
33
152.8
2,544
1,597.5
10,526.9
33.1
343.2
241867.8
18,320.9999
2,197.51,392.4
70-42.1-14.7
▼-57.5
-23.3
▲
▼
▼
▲
39.5
15
3.7
▼▼
-43.3
▼
1,010.0
-46.0
-15.6
-61.5
▼
M&A Rankings For Mid-Market Deals Valued Up To US$500m Are Also Available
2,395.9 -22.5
▲97
▲
436.934.730.1
28740
276
Announced Small-Cap M&A by Target Nation Up To US$50m Jan 1 - Mar 31
-
2,000
4,000
6,000
8,000
10,000
$0
$5
$10
$15
$20
$25
$30
$35
$40
$45
$50
# of
Dea
ls
Ran
k Va
lue
(US
$b)
US$0 - 10m US$10 - 20m US$20 - 30m US$30 - 40m US$40 - 50m # of Deals
14.3%
14.2%
12.6%
10.3% 8.7%
8.5%
8.5%
7.0%
6.1%
5.0%
2.7% 2.1% High Technology
Real Estate
Industrials
Financials
Healthcare
Consumer Products and Services
Materials
Energy and Power
Media and Entertainment
Consumer Staples
Retail
Telecommunications
1
Source: Thomson Reuters
*tieSource: Thomson Reuters
21
925*
12.5
50
6.8
▲
-57-42
170.7
0.0
US$m
83.8
140.30
-28 ▼
Imputed Fees (US$m) †
# of Deals per Advisor
Goldman Sachs & Co
Houlihan Lokey2
8.7
7.2
37.0
Advisor
1030.39.8
52.3
36.4
3
53.4
62.9
74.5Fees
43.0
94.2
100.0
100.0147*
47.6
21.1
100.0
9.5
10.665.5
87.742.0
100.0
6
8.5
95.141.1
54.8
43*
71*
61*17
100.0
23.6
1.4
192.3 3.5
53.8100.0
Worldwide Estimated Small Cap Investment Banking Fees by Quarter*
7.1
13.838.472.4
52.76.6
13.5
6.6
57*
4.2▲
13
100.0157*267*
28
45.7100.0
100.016
100.021.2
14.9100.0
13.3
32.7
-
30.8
9
▼
8.8▲
▼27.2
13.83.8
▲
▼
▼
-
▼16.2
20.8
-
638.714.5
▲▲
-53.3
57.7-
-43.9▲
▼
-
16▲
-79.5 60.1
18.7
▼-13.2
▼
4.4
17.1▼-0.2
46.7185
▼
-39.1
27.782.8
▲
-96.5▲
Rank Exp (%)
60421▼
▼9.8 ▼189*
869.421.9-2
7* 32
▼
-
6
4
311.4
12.6106.3
▲6*
10
-▼
35-90
7* -1
Lazard
11
40
2*
32
9*
KPMGRothschild & Co
41
42
8 44* 306*
4
18*18 ▲ -39.6
Mizuho Financial Group 9 9* 29
11
-6 7 -35.5147.2▼ ▼
22
35
▲37.30
-40.2▲23* 26
31*Deloitte 11 3 23
6-83.2
60.3 33Morgan Stanley 10
Credit Suisse 21Ernst & Young LLP
5.0 54*25.7
65*25*
-83.84
38835.6
▲-
-74.0 ▼ 19.9 14
-106*27
15.6
36.012.0
2.0
7
▼
▲99*
13.2
▼ 6154.1
▼ -▲
119.9- -14.7
▲ 3
▼
0.0-
5154.2
205.2
23.0▲Duff & Phelps 22* 58*
▼26*
▼15
Evercore Partners14
Moelis & CoGCA Corp
38* 14
Kaede Group
30*
97*
58*
Plutus Consulting Co Ltd
310
-2
UBS10
11
Lincoln International
39*
36*
9▼▼
▼
0.012
11
-6
-19
-12
--
99
-9101.0
-
24.8
95*
▼▲
1.31343*43*
9
35*
294*43*
-7
7
BCMS Corporate LtdBDO
43*17
Industry Total
▼
Baker Tilly International
Quarton International
** Fee exposure indicates each firm's mid-market fees from deals valued at up to US$50m as a percentage of its overall M&A fees in the relevant region.
-2.4
9
▼
9,518
-36
30.2
43*
193*
9
35,298.7
-14
▼▲
-3
8
Clearwater International
43*28*
5
39* -7
78*
28*
41*
82*
37.11
11
▼-2
▼
Mitsubishi UFJ Financial Group
31*18*
Capitalmind
39*
Deutsche Bank
33*
35*39*
54*
▲
▼
Robert W Baird & Co Inc
43*
43* 944*
1010
36*
▼
-59.4 4.2
1.5
11.2▼
18
4529.50▼
RSM Corporate Fin LLPSociete Generale
-7.9
48*
67.4
▼
-▼
392,057.4
32.4-
7.1
8.6
▲
33
4.5
23.0
32
18.2
-
34▼
https://www.thomsonone.com
13.211.3
-
61*
100.0
85.157.7
100.040
-28.0
-48.7
-
-9.4
-
48.0
0.0
101.3
111.6
--
30.9 -
11
34
-60.6
-
5
3.4.7
1.1
▼
-
-66 -
-50.2
13
11.012
-13
▲139.430.30
▼7
20*
▲
17.3Grant Thornton
4 49.9
26*
15
-85
-
▼
-
17
142*
-
▲
23*
10
-17
16
Stifel/KBW
Global M&A
JP Morgan46.5
0.0
First Quarter 2017 │ Small-Cap M&A Up To US$50m │ Financial Advisors
Change (%)
▼
78.043*
40
28
35*15*51*
▲16
12
▲▲
-1
124.0
13
12▲-▲
60.2
1275.0-75.1
-
▲
50.6
-41.8
▼6.7
26*
30*
-
▼
-
▼-26 ▼
ING 1920
▲
4 2013*
68*
28*17*
-1
15* 11
1817*
-15
17
IMAP
Generational EquityOaklins (FKA M&A Intl Inc)
Sumitomo Mitsui Finl Grp Inc 5
12
Daiwa Securities Group Inc
Globalscope
20*
PricewaterhouseCoopers 2* 2
Rank Value per Advisor (US$m)
▼
141
▼
▲
▼1911
-3
MM1a - Undisclosed Values & Values up to US$50m
18
2017 2016Change in ** Fee
Worldwide Small Cap M&A up to US$50m by Target Nation Region
2016
# of DealsRankFinancial Advisor
2016 # of
20*Raymond James Financial Inc 22*Citi
Deals
19
13* 20*15*
14 -6
-1
Rank
2
-9
44*
-215
6
1515*
-12
58*RBC Capital Markets
14
1422*22*
Nomura 31*Clairfield International
26*
Alantra Partners SAPiper Jaffray Cos
12Gram Capital
33*
36*41*
30*33*
Benchmark International
0.0
-
▼
-
104.1
-64.9
▼
-44.7
† Imputed Fees shown are based on completed deal activity, whereas deal count & rank values are compiled based on announced deal activity.
-694
30.439.9
225.3
20
Worldwide Small-Cap Rankings (MM1a)
Jan 1 - Mar 31
9
16.0
8.5
--
-
77*0.0
100.0
39.6
▲
11.0
10.3
37.7
20
Rank Value
-
36.8
-
-
Rank
Rank Value
52.442.9
--
17.2 149*
65.9
67.2013
767.1
40.1 --
802
0.0
$0 $10 $20 $30 $40
2012
2013
2014
2015
2016
Rank Value (US$b)
Africa/Middle East Americas Asia-Pacific Europe Japan
0.0%
5.0%
10.0%
15.0%
20.0%
25.0%
30.0%
$0.0
$0.5
$1.0
$1.5
$2.0
$2.5
1Q 2Q 3Q 4Q 1Q 2Q 3Q 4Q 1Q 2Q 3Q 4Q 1Q 2Q 3Q 4Q 1Q 2Q 3Q 4Q 1Q 2Q 3Q 4Q 1Q
2011 2012 2013 2014 2015 2016 2017
Per
cent
age
of T
otal
Fee
s
Inve
stm
ent B
anki
ng F
ees
(US$
b)
% of Total FeesSmall Cap I.B. Fees ($50mil or less)
2
*tie
64* 5.8
80.8.2 140* 33.3
2.0 47* 100.061.5
1.3
- -- -
119.4 1 104.8 ▲
▲
- -0.0 - - -
74.5 ▲
0.0 35*
67.2 6
68.1 50.0 35*
Sandler O'Neill Partners 42* 46* 3 0 -
▲GCA Corp 42* 66* 3 1 ▲
Hovde Group LLC 42* 66* 3 1Bailey Southwell & Co LLC 42* 66* 3 1
Deloitte 42* 27* 3 -2 ▼Alvarez & Marsal 42* 35* 3 -1 ▼
- 8.096.315.7
42-
29*
▲
100.013*
0.00 - - 2.6-98* 3 2
▲
2
0.0
Alantra Partners SA 29*
-100.0-
--
- 39*
-- 41
-
24*2.7
8.0
US Small-Cap M&A up to US$50m by Target Industry
0.0 --
100.0100.06.5
-0.0
-
▼
7.3
20.0-6
22.2
-5
▲
▲
66* ▲
0.0
0.0-Oaklins (FKA M&A Intl Inc)
43.2
9.6
326.811.9
9.3
17.7 7
100.0
18
9.2
43.21.7
86.5
17
16
33*
3.0
46
2.4 44
4.5
-
--
1.9
--
-
Source: Thomson Reuters
Chartwell Financial Advisory
100.0
Jan 1 - Mar 31
** Fee exposure indicates each firm's mid-market fees from deals valued at up to US$50m as a percentage of its overall M&A fees in the relevant region.
https://www.thomsonone.com
0.0PJT Partners Inc
† Imputed Fees shown are based on completed deal activity, whereas deal count & rank values are compiled based on announced deal activity.
▲ 27.9
-Deutsche Bank
4
42*
-5
Stephens Inc 29* 46* 4 135*
22.0
-▼
- -4 0
9* -
7,819.9Industry Total 2,940
▲29*KeyBanc Capital Markets IncBCMS Corporate Ltd
BB&T Corp 29* ▲16*
7*-
-184
▼4 2
35*
29*
29* 466*
66*29* 9* 4
4
▼
4 ▲-
-5
4
Wells Fargo & Co 29*
Rothschild & Co 49*
66*4
-
29* 1
2
Fig Partners LLC 29*
PricewaterhouseCoopers46*
29*4
- -14
0.00-23.7-
15.0 23
-
-
3042.9
-
7
35*0.0
66*
17*SunTrust Banks
Pendo Advisors LLC
-
66.0
0.0 --32
- -0.03
KPMG
22*Quarton International 22*
46*7*
▼-1
522*
▲
▼5 ▲5
5
22*
6
▲
11.6
▼
522*
4
5
0.0▼
46* 25
6-
-2-2
--
5.8-
5.55.5
▲-
-▲
--
4.5.6
Jefferies LLC
29*
26
21*
39*12.13.0
2.5 43
35*6
18*
17*
▲18*
22*
15* 7
Lazard▲Citi
27* 13
Global M&A
5Cascadia Capital
13
-
IMAP21
22*22*
▲0.0
-
--
- --
-0.0-
10
-
-
--
0.0
29.5
140*
1.8-
-0.00
▲▼▲
-
-11.928*
98.0 3
9-
13.259*
23.0
305.7
-▼▼
13.4
--88.6
0.0
0.0
10.0
-- --
5*11* 22*
5*8 -
-
0.0
-3 ▼▲
1
Piper Jaffray Cos 11*
▼-32
11*
46*
77
6
AGC Partners 15* 35*
Credit SuisseLincoln International
3
6
8
RBC Capital Markets 15*Robert W Baird & Co Inc
22*
Prairie Capital Advisors Inc8
8
Stifel/KBW 8*
PNC Financial Services Group
9*
11*Morgan Stanley 10
35* -
-43.923.0▲117.4 42.0
0.0
-▼
▼▲
0.00
10.8
-19.5 20 -78.3-
▲ 15
▼-
0.0
-▲
2
35*▲Duff & Phelps 4* ▲6
17* 10Evercore PartnersJP Morgan 7 46*
8* 2
Goldman Sachs & Co 4* 9*
9*3
▲Raymond James Financial Inc ▼-24*
90.0Moelis & Co 3 413 -
12
▼-8
▲▼
Deals # of Deals
16
Financial Advisor Rank Rank
Imputed Fees (US$m) †
# of Deals per Advisor
-
Change (%)
--13.7
Generational Equity1Houlihan Lokey
2
2016
0.0
5-4
-35*
2017
75.1
Rank Value
21.62
22
123
9
1222*
11
10 1
8
4
-6
18* ▼
Barclays
606
18*
-6
0
222*9*
▲
# of Change in
-
8 ▼Fees
29.3US$m
2017
▲
1 8.9
100.0
28.913*42.5
20
Rank
First Quarter 2017 │ Small-Cap M&A Up To US$50m │ Financial Advisors
8.6
Rank Value
Exp (%)
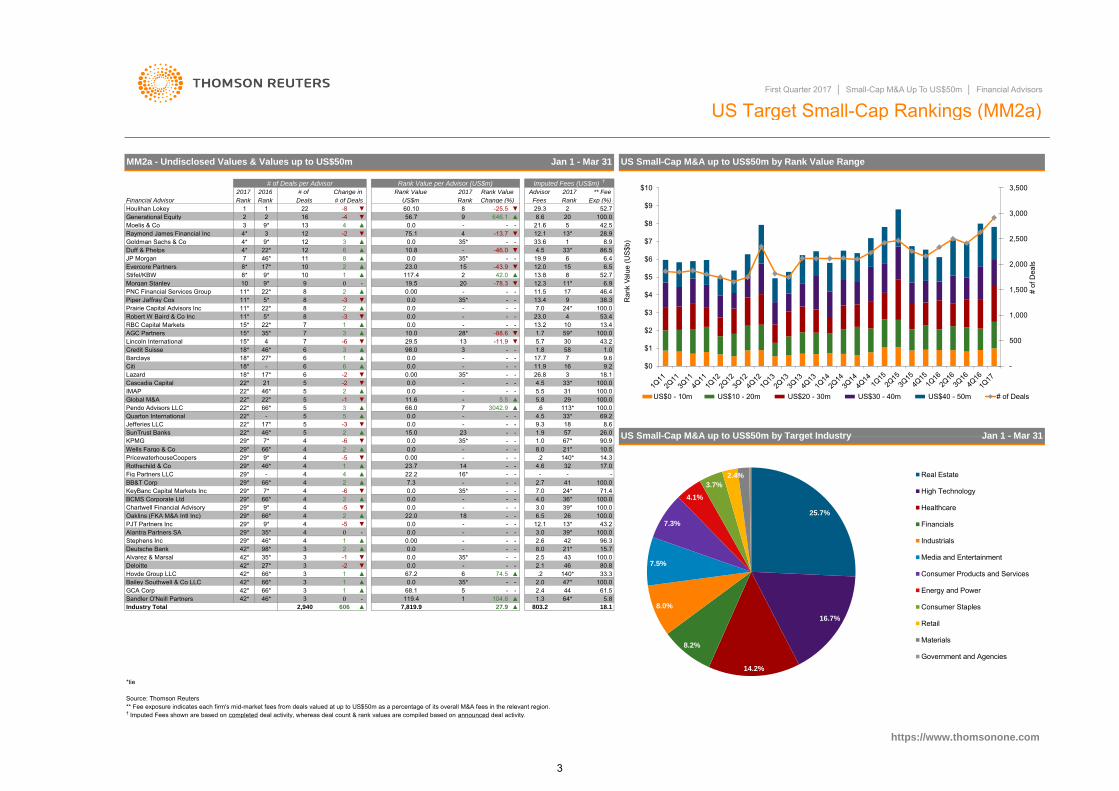
MM2a - Undisclosed Values & Values up to US$50m US Small-Cap M&A up to US$50m by Rank Value Range
US Target Small-Cap Rankings (MM2a)
** FeeAdvisor
-
Rank
12.1
2017
1
Rank Value per Advisor (US$m)
2 52.760.1056.7
4
7.0
113*
58
13.453.4
38.3
4
578.6
100.029
100.0
33*
12.3
6.419.9
8
66.5
11*
12.013.8
100.0
15
-25.5
6.9
33*
52.7
4.5
11.5
646.1
46.4
2.1
-
71.4
90.9
17.0
7.0
-46.0-
33.6
100.0
Jan 1 - Mar 31
▼
67*
.24.6-
18.1
4.0
14.3
1.0
100.0
36*
31
10.5
26.0
100.0
32
1.0
24*
21*
69.2
18.1▲ 803.2
25.7%
16.7%
14.2%
8.2%
8.0%
7.5%
7.3%
4.1%
3.7%
2.4% Real Estate
High Technology
Healthcare
Financials
Industrials
Media and Entertainment
Consumer Products and Services
Energy and Power
Consumer Staples
Retail
Materials
Government and Agencies
-
500
1,000
1,500
2,000
2,500
3,000
3,500
$0
$1
$2
$3
$4
$5
$6
$7
$8
$9
$10
# of
Dea
ls
Ran
k Va
lue
(US
$b)
US$0 - 10m US$10 - 20m US$20 - 30m US$30 - 40m US$40 - 50m # of Deals
3

*tie
† Imputed Fees shown are based on completed deal activity, whereas deal count & rank values are compiled based on announced deal activity.
https://www.thomsonone.com
15.2
Source: Thomson Reuters ** Fee exposure indicates each firm's mid-market fees from deals valued at up to US$50m as a percentage of its overall M&A fees in the relevant region.
Industry Total 611 95 ▲ 2,343.8 30.9 ▲ 99.2
0.0 25* - - 2.0 5*Peter J. Solomon Co Ltd 19* - 1 1 ▲ 100.0- - 1.0 15* 100.0Capitalmind 19* - 1 1 ▲ 0.0 25*
13 -44.8 ▼ .7 25* 100.0100.0
Minvisory Corp 19* 21* 1 0 - 26.42.1 24 - - .1 42*Echelon Wealth Partners 19* - 1 1 ▲
- .5 33* 100.0Tequity Inc 19* - 1 1 ▲ 0.0 25* -- - .5 33* 100.0Duff & Phelps 19* 21* 1 0 - 0.00 25*
25* - - - - --
Goldman Sachs & Co 19* - 1 1 ▲ 0.010.0 17* - - .0 49*Ov2 Securities Inc 19* - 1 1 ▲
- 2.0 5* 100.0Oaklins (FKA M&A Intl Inc) 19* 8* 1 -1 ▼ 0.0 25* -- - - - -RwE Growth Partners Inc 19* - 1 1 ▲ 9.80 19
12 - - .6 28* 100.0-
Quarton International 19* - 1 1 ▲ 28.08.7 21* - - - -Red Cloud Klondike Strike Inc 19* - 1 1 ▲
- .1 42* 100.0INFOR Financial 19* 21* 1 0 - 3.9 23 -- - 1.0 15* 100.0Globalscope 19* 21* 1 0 - 0.0 25*
25* - - .7 25* 100.0100.0
Origin Merchant Partners 19* - 1 1 ▲ 0.00.0 25* - - 1.0 15*Benchmark International 19* - 1 1 ▲
- - - -Lazard 19* - 1 1 ▲ 0.0 25* -- - 1.0 15* 100.0Horizon Partners 19* - 1 1 ▲ 0.0 25*
25* - - 1.0 15* 100.0100.0
BCMS Corporate Ltd 19* 21* 1 0 - 0.00.00 25* - - 1.0 15*Callisto 19* - 1 1 ▲
- - - -Macquarie Group 19* - 1 1 ▲ 0.0 25* -- - - - -M Partners Inc 19* - 1 1 ▲ 8.7 21*
- 1.0 15* 100.0 Canadian Small-Cap M&A up to US$50m by Target Industry Jan 1 - Mar 31Lincoln International 19* - 1 1 ▲ 0.0 25* -- - 1.0 15* 100.0MarshBerry & Co Inc 19* - 1 1 ▲ 0.0 25*
11 - - .6 28* 100.0-
GMP Capital Corp 19* 21* 1 0 - 30.00.0 25* - - - -Marlin & Associates 19* - 1 1 ▲
- - - -Blair Franklin Capital Part 19* - 1 1 ▲ 0.0 25* -- - - - -Clarus Securities Inc. 19* - 1 1 ▲ 0.0 25*
17* - - .0 49* --
AGC Partners 19* - 1 1 ▲ 10.00.00 25* - - - -ING 19* - 1 1 ▲
- - - -Paradigm Capital Inc 19* - 1 1 ▲ 26.1 14 -- - - - -Evercore Partners 19* 21* 1 0 - 0.0 25*
25* - - - - -7.5
JP Morgan 8* 21* 2 1 ▲ 0.013.8 16 - - 1.0 15*Credit Suisse 8* 8* 2 0 -
- - - -HSBC Holdings PLC 8* - 2 2 ▲ 0.0 25* -- - .2 41 100.0Generational Equity 8* 8* 2 0 - 9.2 20
4 - - 3.0 3 78.93.6
IMAP 8* - 2 2 ▲ 50.049.6 6 - - .6 28*Rothschild & Co 8* - 2 2 ▲
- 2.9 4 53.7Piper Jaffray Cos 8* 21* 2 1 ▲ 0.0 25* -- - 1.0 15* 4.5CIBC World Markets Inc 8* 2* 2 -2 ▼ 0.00 25*
15 - - .1 42* 100.0100.0
Ernst & Young LLP 8* 21* 2 1 ▲ 17.269.9 2 - - 1.2 12*Scotiabank 8* 21* 2 1 ▲
- .1 42* 100.0KPMG 8* 4* 2 -1 ▼ 44.8 7 -- - 1.9 10 100.0Raymond James Financial Inc 6* 2* 3 -1 ▼ 89.9 1
25* - - 4.0 1 67.88.6
Houlihan Lokey 6* 8* 3 1 ▲ 0.056.4 3 - - .5 33*National Bank of Canada Fin'l 3* - 4 4 ▲
- .7 25* 13.5Cormark Securities Inc 3* 8* 4 2 ▲ 37.7 9* -9* - - 3.2 2 4.9
4.8BMO Capital Markets 3* 4* 4 1 ▲ 37.7
49.9 5 - - 2.0 5*RBC Capital Markets 2 8* 5 3 ▲- 1.3 11 5.8
Exp (%)
TD Securities Inc 1 8* 6 4 ▲ 43.30 8 -# of Deals US$m Rank Change (%) Fees Rank
2017 Rank Value Advisor 2017 ** Fee
Canadian Small-Cap M&A up to US$50m by Rank Value Range
# of Deals per Advisor Rank Value per Advisor (US$m) Imputed Fees (US$m) †
2017 2016 # of Change in
First Quarter 2017 │ Small-Cap M&A Up To US$50m │ Financial Advisors
Canadian Involvement Small-Cap Rankings (MM22a)
Rank Deals
MM22a - Undisclosed Values & Values up to US$50m Jan 1 - Mar 31
Rank Value
Financial Advisor Rank
19.0%
14.3%
13.0%
10.2%
8.5%
8.1%
7.1%
6.8%
4.5%
4.2% 2.6% Materials
Energy and Power
Industrials
Real Estate
Healthcare
Consumer Products and Services
High Technology
Financials
Consumer Staples
Media and Entertainment
Telecommunications
Retail
-
100
200
300
400
500
600
700
800
900
$0
$1
$1
$2
$2
$3
$3
$4
# of
Dea
ls
Ran
k Va
lue
(US
$b)
US$0 - 10m US$10 - 20m US$20 - 30m US$30 - 40m US$40 - 50m Total # of Deals
4

*tie
0.0 18* - -13.8 16 - -
0.0 18* - -0.0 18* - - 11* 100.0
2.0 6* 21.51.0 11*
▼Goldman Sachs & Co 15* - 1 1 ▲
▲ 18* -Duff & Phelps 15* - 1 1 ▲
1
-3
100.0
Quarton International 15* - 11*0.5
-0.0 18* - -
-16* 100.0
-
100.016* 100.0
1.0
Clairfield International 15* 21* 1 0
1
115* - -0.0
1.0
▼
-
3.5
0.1
--
First Quarter 2017 │ Small-Cap M&A Up To US$50m │ Financial Advisors
0.0
Latin American Small-Cap M&A up to US$50m by Rank Value Range
--
2017
US$m
18*25.0
213*
21*3
3*
2
0.0▲
53
2
HSBC Holdings PLC
▼
-1 ▼0
- 0.51 ▲
KPMG
-1
Lazard 4
21*
Banco Bradesco SA 32
4*11
2
-
21*
11.0
▲14.1
2
-
Change in
▲▼
3▼
-
4*
18*0.00.0
56.4
Rank
18*1*15
-
Source: Thomson Reuters
▲
Jan 1 - Mar 31
21*
5-
-
-
Change (%)
2
2017
18*
2.0
0.11.0
--18*
-4.0-
10
6*
Rank
Scotiabank
National Bank of Canada Fin'lArab Banking Corporation
Artica Participacoes e Assesso 15* 3* 1
-
100.0
4*
-
26.5
2
161.0- --
Stifel/KBW
-
3.0
▲
IMAP
4*
3*-
0.0
11*
-1
-
15.4
-26.50.0
22
1 20.0
▼
** FeeAdvisorRank Value
Imputed Fees (US$m) †
PricewaterhouseCoopersBBVA
4*
4*
17
0.0
Santander 7*Cormark Securities Inc
4*
4*
Rank
1*4*
-5
▲2
18*
56.4
2
4*2-
# of 2017
▲
50.0
2
2
Latin America Involvement Small-Cap Rankings (MM17a)
Rank Value
Rank Value per Advisor (US$m)
Financial Advisor
2015
MM17a - Undisclosed Values & Values up to US$50m
# of Deals per Advisor
2
-50.0
100.0
4
21*
-
3
-
Jan 1 - Mar 31
-Banco Votorantim
Itau Unibanco2.1
Morgan Stanley
-
TD Securities Inc
15*
1Banco do Brasil SABanco BTG Pactual SA
15*
Rank
4*
# of Deals
115*
2
-
4*
0
Deals
15*-
4*
- ▲▲
▲21* 0
▲
7*2
-2
1
1
1 -3
1
1
-11
--2
1
-45
1 11 -1
15*
Industry Total
13*
Global M&A 15* 7*
AlixPartners LLC 15*
18.7
† Imputed Fees shown are based on completed deal activity, whereas deal count & rank values are compiled based on announced deal activity.
▼242 958.1
-
Latin American Small-Cap M&A up to US$50m by Target Industry
-
-
58.2
-
- -
** Fee exposure indicates each firm's mid-market fees from deals valued at up to US$50m as a percentage of its overall M&A fees in the relevant region.
https://www.thomsonone.com
20.0
18*
12*16.01
9*-
6*
14.1
21.5
-
-
--
-
-9*
-
18*
-
--
-
-
11
-
-
14
-
-
-
-
▲
-9
-
Fees
-
0.3
-
- -▲
2.0
15.6-
40.7
--
-21.4
- -
18*
-
15.8
--
▲
-
59.2
-0.3
0.0
-
--
- 18* 100.0
-
21.4
--
1.5
-
1.1
-
1.1
0.2 20 100.0▼
7*
▲
16.1100.0
Exp (%)
-
7*
25.0 6
-18*
18*
0.0▼
1 ▲-
-
Rosenberg Partners Consultores 15* 21.7VGL Finanas Corporativas 15*
-- 1 0.0
15.821.7
12* -- 1 1 ▲Olimpia Partners 15* - 1 1 ▲
BR Partners 15*
Estater Gestao e Financas
Credit Suisse 3*15*
24.3%
20.3%
13.0%
11.4%
9.9%
8.3%
6.7%
3.2% 2.9%
0.0% 4.5%
Materials
Financials
Consumer Products and Services
Energy and Power
Real Estate
Industrials
Healthcare
High Technology
Consumer Staples
Retail
Telecommunications
-
50
100
150
200
250
300
350
400
450
500
$0.0
$0.5
$1.0
$1.5
$2.0
$2.5
# of
Dea
ls
Ran
k Va
lue
(US
$b)
US$0 - 10m US$10 - 20m US$20 - 30m US$30 - 40m US$40 - 50m # of Deals
5
*tie
158* 3
44* 72* 4 1
1
22
100.049*100.0
Invest Corporate Finance SAS 44* - 4 4 0.0 - - 2.5
1 28.867.3
Rank Value per Advisor
▲
-28
-2
Roedl & Partner 44*
Catalyst Corporate Finance - -
▲ 0.0 -
-
-
0.0Evercore Partners 44* 40* 4 -3 -
4
0.0
European Small-Cap M&A up to US$50m by Target Industry
First Quarter 2017 │ Small-Cap M&A Up To US$50m │ Financial Advisors
Rank
Jan 1 - Mar 31
European Small-Cap M&A up to US$50m by Rank Value Range
Fees
184.5
96.4
22*-13
44
19.5
-8
-1 ▼
-2
▲
▼
101*
55
43*9
6
7
6
-22
▼
8
-6
1714*
11* ▼1058*
26.81
-51
72.0▼-3
12
26
32
10*
Clearwater International
PricewaterhouseCoopers
72*14*12
Capitalmind
Grant Thornton
16
10*
3*16
30▼▼
Global M&A
101* 9
99
110 9RSM Corporate Fin LLP 18*
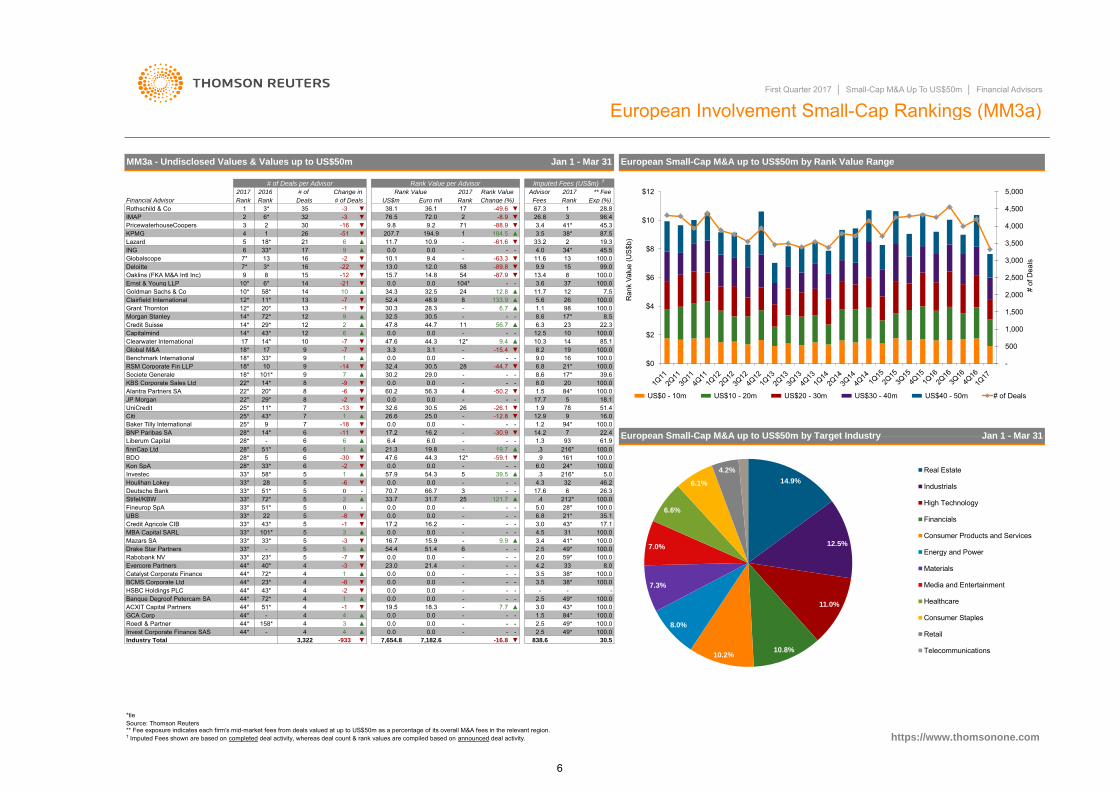
MM3a - Undisclosed Values & Values up to US$50m
5207.7
# of DealsFinancial Advisor Rank
2017 2016
Goldman Sachs & Co 14
KPMG
Oaklins (FKA M&A Intl Inc)
2
ING7*
3
13
-33* 35
-16
18*
Clairfield International
Deloitte
Ernst & Young LLP
7*9
Globalscope
Lazard33*6
15
Rank
# of Deals per Advisor
▼
17
194.94
6*IMAPRothschild & Co
▼ -88.9
929*
1214*
12*
6*
-8.9
12* -713
▼Deals
17
Jan 1 - Mar 31
European Involvement Small-Cap Rankings (MM3a)
# of Change in
2196 -61.6
-
▲ 5.6
-63.3
▲0.0
▲▼
32.5
48.9
▼▲
9.40.0
▼
1.5
1.9▼
6.8
12.9
3.0
1.314.2
▲
-
† Imputed Fees shown are based on completed deal activity, whereas deal count & rank values are compiled based on announced deal activity.
UBS
MBA Capital SARL33*
Credit Agricole CIB33*
33*Mazars SA
-1-8
-16.7
33*
-15.9Drake Star Partners
Source: Thomson Reuters
-
-7
41*1-
9.8
33*
43*
-49.636.1
▼
9.2
11.7 10.9
71
38.176.5
-
-89.8-
▼▼
-87.915.7
-▲
12.0▼
9.913.4
▼ ▼54
13.0
11.724 12.832.5▲104* -- 3.6-21 0.0
8
0.014-12
52.4
14.8
34.3
-20*
12
▼
-14
-1
2
13
▲
-9
14*
33*
711*
8
25*
8
18*
20*29*
-7
14*22*
18* -7
7
Kon SpA
-14*
528*
51*33*
28*
28
51*
Fineurop SpA 33*
33*
51*72*
58*
33*
.3
1.1-
8.2
23*33*
44*
51*
23*BCMS Corporate Ltd
44*
https://www.thomsonone.com
-
-
-
3.4▲
-2.5
3.5
56
-11
6
▲
25
6
57.9
17.2
0.039.5
50
1
3 4.5
5.0
-
-17.2
5 -6
5 ▲
▼
▲
-18
-30-2
▼▲
1
▼
32.4
56.3
26
4-
-60.20.0
-59.1▼
6.419.86.0
▲ 21.3
0.0 - -
-
▲- 6.0
17.6-
.34.3
33*
Stifel/KBW
28*
33*
ACXIT Capital Partners 44*
Deutsche Bank
UniCredit
Societe Generale
28*Liberum CapitalBNP Paribas SA
28*
25*
18*
25*
22*
HSBC Holdings PLC
GCA Corp
KBS Corporate Sales Ltd
Baker Tilly InternationalCiti
Alantra Partners SA
Rabobank NV
176 -
10
▲56.7
1.2
21*
11.6
17.7
5
-
-
-
-
25
▼
-
-3
▲
5
5
Morgan Stanley
Houlihan Lokey
7
33*Investec
BDO
Benchmark International
Credit Suisse
finnCap Ltd
JP Morgan
43*
--
54.4
121.7
43*
---
7.7
-30.9
44*44*
8.00.0
-
0.0
0.0
-
-
-
9.4
▼
--
-
-
-
-26.1-12.8
▲
Change (%)Rank
Rank Value2017
▼10.158
4.0
US$m
-
Euro mil
2
▼
30.330.5
0.0
▲
-10.3
** Fee2017
3.53.4 45.3
Rank Value
3
133.9
233.2
-
-
▼
▲
-
-
-50.2
47.6
0.0
▼
-
28.3
-
▼0.0
6
4
▼
1
-
▼
6
▲
5
5
▼
▼
44.7
44.3
30.529.0
▲▼
▼
6.7
26.6
30.2▼
▲
-44.7
12*-3.1
0.0
-
9.0
9.9
216*
6.8
28*
-
▼
▼
-
838.6
- 2.5
38*
49*
8.6
▼
33
.4▲
51.4
19.7
▲
-
0.0
11
▲
0.0
4
4
▼
72*
▼
▼3,322
4
-
4.2-
-
-
-
-
30.5
38*
-
-
3.0
100.0
59*2.0
94*
17.1
100.0
17*
84*
100.0
-
16.0
100.0
-100.0
21*
49*
18.1
9
100.0
31
78
43*35.1
100.0212*
6
5
1513
37
26
8
1419
20
16
100.0
39.6
100.0
49*
8.0
41*
22.4
100.0100.0
84*
3.5
2.5100.0100.0
100.043*
100.0
1.5-
7,654.8
-15.4
Banque Degroof Petercam SA ▲
100.0161
61.9
32
7
.9
7.5
0 26.3
45.5
12
99.0
17*
46.2
93
216*
100.0
100.02310
5.0
6.3
100.0
100.0
44.3
28
0.0
12.5
98
100.0100.0100.0
0.0
32.6
-
30.5
0.0
8.647.8
3.347.6
-
-
-
0.0
25.0
12*
-
0.0
-
16.2-
0.0
51.40.0
-
** Fee exposure indicates each firm's mid-market fees from deals valued at up to US$50m as a percentage of its overall M&A fees in the relevant region.
100.0
22.38.5
100.0
19.3
Exp (%)
Imputed Fees (US$m) †
38*
100.0
87.5
34*
Advisor
85.1
16.2
-
-54.3
331.7
0.066.7
24*
-
-
-16.8 ▼
5
-
0.0
0.00.0
0.0
70.7
0.0
0.0 0.0
0.0
33.7
0.018.3
7,182.6
▲ 0.0 0.0
23.0 21.4
-933
0.0-
Industry Total
14.9%
12.5%
11.0%
10.8% 10.2%
8.0%
7.3%
7.0%
6.6%
6.1%
4.2% Real Estate
Industrials
High Technology
Financials
Consumer Products and Services
Energy and Power
Materials
Media and Entertainment
Healthcare
Consumer Staples
Retail
Telecommunications
-
500
1,000
1,500
2,000
2,500
3,000
3,500
4,000
4,500
5,000
$0
$2
$4
$6
$8
$10
$12
# of
Dea
ls
Ran
k Va
lue
(US$
b)
US$0 - 10m US$10 - 20m US$20 - 30m US$30 - 40m US$40 - 50m # of Deals
6

*tieSource: Thomson Reuters ** Fee exposure indicates each firm's mid-market fees from deals valued at up to US$50m as a percentage of its overall M&A fees in the relevant region.
2 38.12 ▼ 0.0 - - 11.5
1.8Moelis & Co 26* 66* 0.0 0.0Jefferies LLC 26* 50* 5.8
† Imputed Fees shown are based on completed deal activity, whereas deal count & rank values are compiled based on announced deal activity.
JP Morgan 26* 17*
22*
US$m
0.0
3.6
16.7
2
UK Small-Cap M&A up to US$50m by Target Industry Jan 1 - Mar 31
4
371* 31.6
0.0 26*
4.7 -
22
1
▼
▲
26*
1
▼
1▲
-32
22
▲
▲
29.00.0-3
-
26* -
26*▲ -
-
-
0.0
▼
31.4 25.0
0.0
0.0
-▲2.6
26*26*
▼
19*19*19*
42.1
-6
1
0.0 0.0-
▲
0.0
▼0
19*
19*
66* 3
-
-5
44
3
2
5
-1
-43
▲1
▲
1
▼
-2
▼
▲
▼3
100.0
17*0.0
12*
-
▲
▼-12*
-▼
17*
6.71.3
12*
0.5
0.0
7.3
725.0
0.30.3 99*
10
74*
19*
0.013.7
0.0
12*
12*
6.4
0.00.038.0
▲
▲
57.921.3
0.0
5.1
▲
-42.4-
--
9*9* 19.7 ▲
9*
39.547.0
-62.8
8.6
52.8
19*
19*0.0
6.911.0
0.0
8.8
Rank
7*
17.1
0.0
67*
-99
▼▼▼
-87
66
1
6
▲▼
7
24.63*
38.0▲1 47.6
1
68.2
26.3-14
132
38.1
# of
▲
15 6 20.031.0Fees
1.1
-
▲
8.09.8
32.4
83.10.0
76.5
19*
Rank Value per Advisor
9*11*
# of Deals
0.6
Advisor
9
1
2017
0.8
226*
34*
-
3
2
0.017*
1
-1
-
823 -134Industry Total
Deloitte 17* 34*Catalyst Corporate Finance
Goldman Sachs & Co
Baker Tilly InternationalBDO
17*
2
11*Mazars SA12*
34*
50*12*
5
1
12*
5
-8-15
55
-
5*
9*12*12*
9* 11*
Investec22*27*
Deals
finnCap Ltd
Liberum Capital
8
7*
Financial Advisor
9*
1
7*
KBS Corporate Sales LtdRSM Corporate Fin LLP
6
Benchmark International
KPMGClearwater International
6
3
5*
17*
PricewaterhouseCoopers
4
2016
7*
3*
10
3*
3*- ▲
12
0.09
-▲30.3
-
Change in Rank Value
Jan 1 - Mar 31
2017
RankGBP m Change (%)
# of Deals per Advisor
Rank
-
-
-
▲
-
Rank
MM4a - Undisclosed Values & Values up to US$50m
▲
2
3*
6.7Grant ThorntonRothschild & Co
Shore Capital Group
Canaccord Genuity
IMAP
-
-
First Quarter 2017 │ Small-Cap M&A Up To US$50m │ Financial Advisors
Rank Value
UK Small-Cap M&A up to US$50m by Rank Value Range
100.0
-44.7-
731.0
▼
0.0
0
3*
2017
100.0
38-77.3
▲
▼
-92.6
▲-
0.4
36*
5.0
9.9
761.9
100.0
71*
11*19*9*Ernst & Young LLP 19*
19*NumisCenkos Securities PLC 50*
BCMS Corporate Ltd
66*
34*
26*
▼-4
2
3
Cushman & Wakefield Inc
Arma Partners LLP
Global M&A
Alantra Partners SA 19*26*Carnegie
26*
2
Credit Suisse
Morgan Stanley
26*
https://www.thomsonone.com
26*
2 ▲ING66*
Houlihan Lokey
Evercore Partners
Smith & Williamson GroupStifel/KBW
-
-
Wells Fargo & Co22*
WH Ireland Ltd
2
2
26*
-
-
26*
26*
26*
50*2
266*
34*26*
2
66* 2
226*
26*
17*
Silverpeak LLPDuff & Phelps
-
2.1
8.0
-
100.0
** Fee
100.01.2
100.0
4.5
66*
99*
5
Exp (%)
6.8 6
32.4
UK Involvement Small-Cap Rankings (MM4a)
9.0100.0
0.5
2.5
97*
0.1 109*
163.4
115*
3.5
20
21*15
0.6
0.374*
100.0
11*
100.0
100.0
26*
26*
-
80.0
22.268.2
104*-
18
1.0▼
-0.2
- 3.0
-
0.60
▲
0.0
▲
0.0
▼
0.0
-
0.0
26*
26*
▼
▲10 -
-4
2 2
▲
-
-
319*
2
▲
7*
66*
26*
0.0
0.0
26*
3
20.0
0.0
1.02.0
17.9
26*
Imputed Fees (US$m) †
100.0
35
▼
0.80.5
-
0.0
--
-
-
100.0
-83.3
-
-
-
▲
0.0
▼99*
19.4100.0
100.0100.0
--
23*104* 100.0
100.0
29.014.7
115*
66*
0.2
23*39*
2.0
74*
4.0
-
0.0
100.0
17.9
-
100.0
-
75.7
-
-54.3
-26*
-
26*
0.0
-
71.4
71*100.0
39*
-
0.0
2.712.1
-0.0
26*26*
-15.4
26*
47.6
0.0
0.0
36.2
1.3 1.0
3.315.3
0.0
0.0
0.0
2.9
-
0.0
34
109*
6.3 8
2.1
61.8
2 26*
2 ▲
2,640.3 2,134.5
8.02
Spectrum Corporate Finance LLPOaklins (FKA M&A Intl Inc)
26*
▲
▼26*26*
26*
-511*▲
17* 222
22
LazardSPARK Advisory Partners Ltd
34*
-4-
26*
2 2-4
26*
50*
2 -1-
2
2 0
12 1
26*
CitiMacquarie GroupGlobalscopeCairn Financial Advisers LtdItau UnibancoClairfield International
26*
0.0
-
8.72.6 19
23*- -
- 1.618.7-
26*26*26*
--94.9
26*
66*
-
-
▼▲ 0.0
0.0
0.0 -0.06.0 26* -67.4
▼▲▼ 7.3
▼
▼
- -12.8 10.2 26* -
26*2.5
26* -
3.1
12.8 10.2 26* -72.40.0 0.0
- -
100.0100.0
-10.8 ▼
100.0100.0
2.0 23* 100.00.12.0
23*21* 100.0
2.0
36* 100.021.7
- - -
266.0 34.0
6.3
-
24.74.0 11*
74*
74* 100.026*
-
26*
-
26* - -0.5
0.5
1.20.0 0.0
▲26*
13.5%
11.5%
11.0%
10.8%
10.4%
9.5%
9.2%
6.7%
6.7%
5.4%
4.5% Financials
Media and Entertainment
High Technology
Real Estate
Consumer Products and Services
Healthcare
Energy and Power
Retail
Industrials
Materials
Consumer Staples
Telecommunications
-
200
400
600
800
1,000
1,200
$0
$1
$1
$2
$2
$3
$3
$4
$4
$5
# of
Dea
ls
Ran
k Va
lue
(US
$b)
US$0 - 10m US$10 - 20m US$20 - 30m US$30 - 40m US$40 - 50m # of Deals
7

*tieSource: Thomson Reuters
22*22*
2
-30* --
0.0
--
0.00.0 -0.0
-
-
222* 12* 2
2-22*
Eurallia SARLCV 22* - 2
22* -55*22*
55*
-1
2
30.22.0
0.0
UBS
67.8
3.0
4.0
0.0
▲
0.0
16.4
-
-
-
7
30*-
--
-
0.0
10.0
▼
▼
2* 29*
Eurohold SL 17.0
17.4
0.0
0.0
Accuracy SASCBRE Holding SAS
2
-
Clipperton Finance SARL
-
▲
-
-15
9*2
51.4
-
-
-
-- Jan 1 - Mar 31
† Imputed Fees shown are based on completed deal activity, whereas deal count & rank values are compiled based on announced deal activity.https://www.thomsonone.com
French Small-Cap M&A up to US$50m by Target Industry
206.2
0.2
23*
1.1
1.5
0.468
21*
90
100.034
100.0
100.0
100.0100.0
-341
21*22*1,031.7 969.4
8.9
2.52.0
97*
16*
31 100.0
-
6*8
35*
▼
Imputed Fees (US$m) †
30*
0.0
0.0
2 2
Industry Total
30*24
▼
18.111.7 0.8
0.52.5
29.0
37*
0.5
2.2
71*62.5
2.0- 3.0
▲-
37*76*
192.6
4.53.0
-30.9
-
1.03.0-2.4
-11*
23*
100.0
76*
--
-
-
-
-
-
--
-
-
--
-
--
- -
-
--17
-
18
-
2.7
0.0
-
5.2
6.0
2
-
11*
-
-▲
-
-94.8
-
-
-
-
▲72.1
11*
4141.2
0.0
-0.016.2
2.1-
▼
Rank
17.2
-
-
3.4
3.7
2.2
1.0
27.3
Rank Value per Advisor
Rank Value
18.5
Change (%)
28* ▼
Fees
5
Deals
▼-8▲5
▲
2017
▼
# of Deals
4
14
4
-1
4 -11
▼
▲
▲
▼
▼
▼
▲▼
▲
▲
21*
Edmond de Rothschild Hldg SASycomore Corporate Finance SASTrianon Finance
Global M&A-
0.0
548
MBA Capital SARL
Deloitte
4*
Oaklins (FKA M&A Intl Inc)4*4*
4*
Adviso Partners SAS
Societe GeneraleLazard
-3
2* 66
3
6
Rank
3
-
41.5
** Fee exposure indicates each firm's mid-market fees from deals valued at up to US$50m as a percentage of its overall M&A fees in the relevant region.
8*
Change in
7*
5
-3-61
# of
3
2
2.5
8.9
▲3
▲▲
0.0
55*
37.1
100.0
1-
2
2
US$m
0.0 0.0
8
▼
0.0
33
4 0.0
0.0
11*
-8
▼-1
▲
▼▲
-5
2
-4
-5
15*
3
15*
2
55*-
23
3
10* 55*Banque Degroof Petercam SA
Goldman Sachs & Co
10*
29*
10*Drake Star Partners
1
2
0.0
0.0
-10
0.0
19.9
22*22*22*
22*
0.0-2
# of Deals per Advisor
French Small-Cap M&A up to US$50m by Rank Value RangeMM5a - Undisclosed Values & Values up to US$50m
Credit Agricole CIB
Rank
12*
Rothschild & CoFinancial Advisor
BNP Paribas SA29*
11 3
1
2016
3
Invest Corporate Finance SAS
Financiere Cambon
KPMG 5
10*
ING
3
10*DC Advisory 7*
10*Clairfield InternationalCiti
IMAP
2
Capitalmind
2
-4
-2
2
2
10*
55*10*
100.0
Exp (%)
20
11*
9
24.4
28.8
16*
3
100.03.1
14.26.8
30.3
Rank
French Involvement Small-Cap Rankings (MM5a)
17.1
100.0
13.5
13.025.0
100.0
10
11*
16*
2
Jan 1 - Mar 31
100.0
6*
100.0
4
Rank Value 2017 ** Fee
21*30*
-
100.0
100.0
100.0
100.0
100.0
20.0
71.4
-55.2
100.0
28.0
100.0
Advisor
16.2
Euro mil
0.0
310*
15*
355*
4
7*
5
3
▼-
10*
10*10*
2-
1
0.0
0.0
11.0
0.0
0.0
0.0
34.5
2 5.6
▲
▼
0.0
5 17.2
▼
-1 4.0
-
-
First Quarter 2017 │ Small-Cap M&A Up To US$50m │ Financial Advisors
3*
1.8
0.6
6
2017
0.0
-
0.0
54.4
6.3
0.0
1
0.0
0.0
▲▲
Grant ThorntonNatixis 22*
0.0
2.9
JP Morgan
--
-▼
-
-14.0 ▼19.2%
17.5%
17.4%
14.8%
10.3%
6.4%
5.6%
4.0%
3.2% 2.0% High Technology
Industrials
Consumer Products and Services
Real Estate
Media and Entertainment
Consumer Staples
Materials
Financials
Healthcare
Retail
Telecommunications
Energy and Power
-
100
200
300
400
500
600
700
800
900
1,000
$0.0
$0.2
$0.4
$0.6
$0.8
$1.0
$1.2
$1.4
$1.6
$1.8
$2.0
# of
Dea
ls
Ran
k Va
lue
(US
$b)
US$0 - 10m US$10 - 20m US$20 - 30m US$30 - 40m US$40 - 50m # of Deals
8
*tieSource: Thomson Reuters ** Fee exposure indicates each firm's mid-market fees from deals valued at up to US$50m as a percentage of its overall M&A fees in the relevant region.† Imputed Fees shown are based on completed deal activity, whereas deal count & rank values are compiled based on announced deal activity.
2.0 13* 6.7- - -10* - -
0.0 0.00.0
10*17* - 2 2 ▲Alantra Partners SA 17* 31* 2 1
CorestarPartners GmbH 17* - 2 2 ▲
2Goldman Sachs & Co
17* 16* 2 -1 0.0 0.0
0.0
0.0 0.0
-
- -
2
▲3
Change in
48.6
0.0
46.0
0.0
▲
▲
▼
0.0
9.4
0.0
2017
-
2016
# of Deals per Advisor
10*
-
-
Jan 1 - Mar 31
52*
** Fee
3*
10
-
12
-
2.0
7*
2.8
-- -
45.2- -
-
11
5*26
2.3
2017
German Small-Cap M&A up to US$50m by Target Industry
0.1
2.0
Exp (%)
70.7
▼
▼
Euro mil
10*
10*
7
-
--
13*
--
10*0.0
10*
10*
-
-10*
10*
0.0
-
-
0.0
-
-
0.0
-
10*
66.70.0
https://www.thomsonone.com
-5
VR Corporate Finance GmbH
Global M&A
Oaklins (FKA M&A Intl Inc)
-2 ▼
8*8*
12*
Quarton International 8*
8* 9*
16*0.0
0.03
▲-
-
3
-16*
0.031*
0.0 -15.2-8*
-
-
---
10*
10*0.0
14.4-
-
-
-10*
--
1 -
-
-
10*
10*
10*
-
10* -
-
10*
-
10*
-
2
3.0
3.0
7*
4*
8* ▼
▲
0.0
0.0
3
0.0
▲
20.0
0.0 10*
0.0
0.00.0
--
▲
▲
0.0
▼
0.0 0.0
▼-4
-23
31*
12
21*
-2
-9
1
3
3
31
38* 21*
2*
Rank
Capitalmind
21*2*
Rank
IMAP 2*
Roedl & Partner
Clairfield InternationalRaymond James Financial Inc
Houlihan LokeyGlobalscope
4 ▼▲
-2 0.0
US$m
-
17*
2* 4*
# of
Financial Advisor
1 10.15
2
0
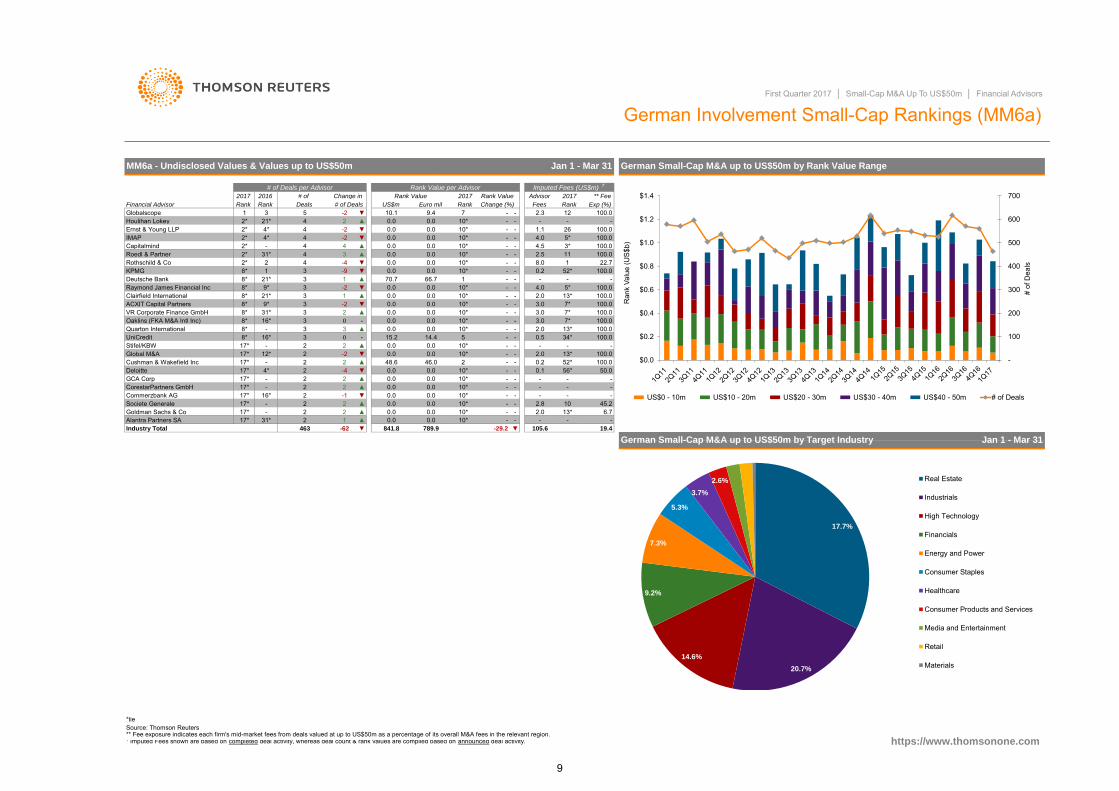
MM6a - Undisclosed Values & Values up to US$50m
Cushman & Wakefield Inc
-2
4
First Quarter 2017 │ Small-Cap M&A Up To US$50m │ Financial Advisors
9*
24*
0
3
0.0
2-
2
0.0
KPMG
8*
Ernst & Young LLP
10*
Deutsche Bank
Rothschild & Co
-2▲
0.0
2*
0.0
4
42*
8*
4
3Deals
17*
UniCredit
17*
-
-
Rank Value
Rank Value per Advisor
GCA Corp 17*
17* -
ACXIT Capital Partners
3
2Stifel/KBW
Deloitte0.2
2.0
0.2
3.07*
0.5 34*
5*-
4.0
German Small-Cap M&A up to US$50m by Rank Value Range
-
2017
Jan 1 - Mar 31
217*
Commerzbank AG ▼Societe Generale
2-4
0.0▲0.0
▲2
-
Fees
1.1
13*
56*
100.0
100.0
100.0
100.0-
50.0
Rank
-
100.0
100.0
-
52*
105.6
-
100.0
Imputed Fees (US$m) †
22.7
Rank
-
13*
100.0
100.0100.0
100.01
100.0
100.0100.0
100.0
Advisor
-
German Involvement Small-Cap Rankings (MM6a)
--
0.0
-▼
4.0
2
-
841.8 789.9
8.00.0
4
42.5
▼
-
-
-0.0
4.5
# of Deals Change (%)
-62 19.4-29.2Industry Total 463
-
0.0 -
Rank Value
▼
17.7%
20.7%
14.6%
9.2%
7.3%
5.3%
3.7%
2.6% Real Estate
Industrials
High Technology
Financials
Energy and Power
Consumer Staples
Healthcare
Consumer Products and Services
Media and Entertainment
Retail
Materials
-
100
200
300
400
500
600
700
$0.0
$0.2
$0.4
$0.6
$0.8
$1.0
$1.2
$1.4
# of
Dea
ls
Ran
k Va
lue
(US$
b)
US$0 - 10m US$10 - 20m US$20 - 30m US$30 - 40m US$40 - 50m # of Deals
9

*tieSource: Thomson Reuters
79.5 45.8
- - -4.0 3* 71.4
2.0 7* 100.0
-
0.7 28 100.0- - -
0.2 35* 100.01.0 14* 100.0
- - -- - -
35* 100.01.0 14* 100.0
14* 100.0
2.41.0
14* 100.0
30*
100.0
0.0 0.0 15* - -9.6 8.9 9* -
676.4 634.3 21.1 ▲
0.0 0.0 15* - -
0.0 0.0 15* - -28.8 27.0 6 -41.3 ▼
11.6 11.0 8 - -0.0 0.0 15* - -
0.0 0.0 15* - -0.0 0.0 15* - -
0.0 0.0 15* - -0.0 0.0 15* - -
0.0 0.0 15* - -8.2 7.5 12* - -
0.0 15* - -0.0 0.0 15* - -
9 ▲
12* -73.1 ▼0.0 0.0 15* -0.0
JP Morgan 17* 19* 1 0 -VSL SpA 17* - 1 1 ▲Robert W Baird & Co Inc 17* - 1 1 ▲Alantra Partners SA 17* 4 1 -5 ▼Oaklins (FKA M&A Intl Inc) 17* - 1 1 ▲GCA Corp 17* - 1 1 ▲Translink Corporate Finance 17* - 1 1 ▲UBS 17* 12* 1 -1 ▼Equita SIM SpA 17* 12* 1 -1 ▼CDI Global 17* - 1 1 ▲Ethica Corporate Finance SpA 17* 8* 1 -2 ▼Clairfield International 17* 12* 1 -1 ▼Globalscope 17* 19* 1 0 -Hideal Partners 17* - 1 1 ▲Santander 17* - 1 1 ▲
▼ 0.0
1 ▲- 1
- 1 119*
21.60.0
30.5
32.5
9.6
32.6
1.2
30.5
Transcapital 17*▼
Global M&A 17*0.0
Euro mil Change (%)
8.9 9*
15*
15*
-
-
2*
-
-
Rank
-
Jan 1 - Mar 31
-0.0-3
▲
-8.4 7.9
-
▲
-
15*
-
0.0
-
-62.2
0.0 15*
▼11
0.015* -0.0 0.0
2.3
3.0
6
4.0
-
0.5
2.0
-
-1
Rank
1.0-26.1
6.0
1.4
▼
--12
0.0
50.0
34
-
-68.5
-
-
-
8.2
US$m
Advisor
2.0
Italian Involvement Small-Cap Rankings (MM7a)First Quarter 2017 │ Small-Cap M&A Up To US$50m │ Financial Advisors
2*
** Fee
-
1- 1 1
6* 1 -312* 1 -1
▲ 0.00.0
1
0.0 15*7.5
0.0
1
19*1
-
** Fee exposure indicates each firm's mid-market fees from deals valued at up to US$50m as a percentage of its overall M&A fees in the relevant region.
-
4*
30.0
▲
0.0
-
-
15*
-
15*
-
-
1.014*
1.0
14*
-
0.1 38*
0.2
https://www.thomsonone.com
-
14* 100.01.0
Jan 1 - Mar 31
14*
Italian Small-Cap M&A up to US$50m by Target Industry0.5
1.0
15* -15* -
100.0
100.01.0
271
17*
-
17*
Cascadia Capital 17*
Nomura17*
Mittel SpA 17*
17*
Kon SpA
KPMGRothschild & Co
2
Credit Suisse
7*3*
UniCreditMorgan Stanley
3*
3
3*
7*
GBS Finanzas SA
2017
Rank
9*
19*
2
0.0
0.0
▲31.80.0
▲ 0.0
▲
0.0-
4*
6*
1
-
-
-
Fees
-
-
Rank Value per Advisor
5.9
-0.0
30.0
15* -
7*
30*3*
7*
2.0
19*3
1
0
1.019*
1
# of Deals per Advisor
▲
# of Deals
Italian Small-Cap M&A up to US$50m by Rank Value Range
LazardFinancial Advisor
▲Deals
64-2
# of
1 ▼
7
5
8*
5
52-
-
35*
30.5 100.0
5
2
12
- 32.3100.0
100.0
14*
1.00.0
10.2
1.01.0
0.0
0.3
100.0
15.5
100.0
12.7
100.0
100.0
Exp (%)
55.6
100.0
14*14*
13
100.0-
14*
55.675.0
-
Rank Value
14*
Rank Value 2017
33.30.6 29
Imputed Fees (US$m) †
17*
1IMAP
1
4
-PricewaterhouseCoopers 13*
Spada Partners
Goldman Sachs & Co
-
8*
Unione di Banche Italiane Scpa
13*
9*
13*
17*
Deutsche Bank 17*
Arkios Italy SpA
17*
Jones Lang LaSalle Inc
9*DVRCapital SpA
Bain & Co
Ernst & Young LLP
Societe Generale
Banca IMI (Intesa Sanpaolo) 17*
Credito Emiliano
-
▲
3
3
▲
2
2
▲55 5
2
4
▲
▼
0
0.0
0
▼
Rank
Change in
12*▼
2016 2017
Fineurop SpA
3
-22
5.0
13*
▲
3*
2
0
33
9*
--
Mediobanca
19*
-
MM7a - Undisclosed Values & Values up to US$50m
▲
32.5
† Imputed Fees shown are based on completed deal activity, whereas deal count & rank values are compiled based on announced deal activity.
-
-
0.5
-
-
-
15*
-
1.0-
15*
14
15*
20.07*
-
-
-
7
-0.0
0.0 15*
5.6
-
-▲1
1 0.0-0.0
0.0
BBVA
2
11
31.8
▼
-
1-15*
17* ▲
0
0.0
-10.0
0.5
100.0
100.0
-
-
-
-
100.0-
30*
-
100.030*
58.8- -
--
100.0
14*
0.0 15*1
15*0.0
0.00.0
15*
0.0-3
37.0
Industry Total
0.0
2
0
23.2%
14.2%
13.0% 12.1%
8.1%
7.5%
6.4%
5.5%
4.5% 3.0% 2.5% Financials
Industrials
Energy and Power
Real Estate
Consumer Products and Services
Retail
Materials
Healthcare
High Technology
Consumer Staples
Media and Entertainment
-
50
100
150
200
250
300
350
$0.0
$0.2
$0.4
$0.6
$0.8
$1.0
$1.2
# of
Dea
ls
Ran
k Va
lue
(US$
b)
US$0 - 10m US$10 - 20m US$20 - 30m US$30 - 40m US$40 - 50m # of Deals
10

*tie
Source: Thomson Reuters
- -- -1.0-
10* - 1 110* 1
-▼
0.0▲ -0.0 0.0 8*
Spanish Small-Cap M&A up to US$50m by Target Industry
100.0-
- 12*
1.0
0.0
100.0
Jan 1 - Mar 31
12* 100.0
** Fee exposure indicates each firm's mid-market fees from deals valued at up to US$50m as a percentage of its overall M&A fees in the relevant region.
-73.8 ▼
-
-
-
-
Rank Value
10*
▼
Stifel/KBW
10* 7* 110*
5
▼
† Imputed Fees shown are based on completed deal activity, whereas deal count & rank values are compiled based on announced deal activity.
Societe Generale 0.0
https://www.thomsonone.com
ING 10*
20*-1
Optima Corporate SLBNP Paribas SA
Citi0
1 -110* -
LazardMontalban Atlas Capital
Alantra Partners SA
1
-4
10*
10*Drake Star Partners 10*
-31
1
IREA Corporate Finance
1-
Sagent Advisors Inc-
10* -
20* 0
-
Fees
Ernst & Young LLP9
# of
DeloitteChange (%)
Spanish Small-Cap M&A up to US$50m by Rank Value Range
** Fee2016Rank Value Advisor
18.120*
40.0
3 31.0-
2 ▲
1
2*
3
3 2
7*
2
2
5
8*0.0
2▲
1-6
0.00.0
-2
2*
-1
7*7*
11
0.00
0.0
8*1
0.0
▲
▼ 0.0
0.0
0
--
-
1.6-0.0
0.0
8*8*
Morgan Stanley
10*Evercore Partners10*
GBS Finanzas SA
Houlihan Lokey
10*10*
Santander
KPMG
BBVA
Norgestion
3*
6*
6*
Rothschild & Co6*
3*
1
-1
▲10.0
-
0.01 8*
0.0
Financial Advisor Rank
2016
US$m
8*
-80.0
Spanish Involvement Small-Cap Rankings (MM8a)
75.0
Euro mil
--
Rank Rank
7 6.7Exp (%)
3*9*20171
Rank Value per Advisor
2017
-
0.08*
1.611
64.07*
# of Deals per Advisor Imputed Fees (US$m) †
- 4
-
-52.6
9*
100.0
100.0
-
100.0
2 48.2
100.0
1.40.1
100.033.323
100.02.071.4
- -
-
100.012*
100.0- -
-
27.9
27.8
3
100.0
-
5*
2
Change in
1Rank
PricewaterhouseCoopers
Eurohold SL
10# of Deals
▲
8*2
1
2
-4
▼
13.0
▼▼
▲
-8*
8*
29.4 -
32.1 -
-
-
1.0-
3.0-
▲30.0
-
-
0.7
0.0
55.7
-
-
-
2.0
-1.0
4.0-
- -
18
▼
-
0.0
Deals
-
6*
1
10*10*
-
0.0 -
0.0
-
17.0
-8*
-0.0
187.3
First Quarter 2017 │ Small-Cap M&A Up To US$50m │ Financial Advisors
MM8a - Undisclosed Values & Values up to US$50m
1
8*
8*
8*
-
7*
2017
0.0
12.0
-
▲
1 10.0
28.0
▲
21.0
16.3
▲
0.0
Jan 1 - Mar 31
-
3.60.2 21*
19--
0.90.4
5*
12*
5*
19.78*4
0.06 -15.4
1 1 ▲ 0.01 0 -
0.0- 2.0
0.0
0.0
0.00.0
0.0
▲▼
- 1 1 ▲
6- 1
Oaklins (FKA M&A Intl Inc) 10* 20* 0
Goldman Sachs & Co
0.0326.4
643.2
8*
20* 1
0.0 0.0
- -
--
8* -
-
-8* -
-
-0.8
---
8*
-10.6Industry Total 223 -14 ▼ 684.8 29.0
14.2%
14.1%
12.9%
12.8%
9.9%
9.7%
6.5%
6.3%
6.0%
5.0% 2.6%
Real Estate
Media and Entertainment
Consumer Staples
High Technology
Energy and Power
Financials
Telecommunications
Retail
Materials
Consumer Products and Services
Industrials
-
50
100
150
200
250
300
350
$0.0
$0.2
$0.4
$0.6
$0.8
$1.0
$1.2
# of
Dea
ls
Ran
k Va
lue
(US
$b)
US$0 - 10m US$10 - 20m US$20 - 30m US$30 - 40m US$40 - 50m # of Deals
11
*tie
Source: Thomson Reuters
0.0
1,208.6 1,133.6 10.0 ▲13* - -0.0
- -0.0 0.0 13* -
-46 ▼
Jefferies LLC 17* 24* 1 0 -
BDO 17* 11* 1 -2 0.00.0
-5
-
0
▼ 0.0
13*
0
-
13*
13*
-
40*
-
0.0 13*
13* - -
1.0
15*
7*
15*
--
--
-3
--
-
13*
13*13*
13*
▲▲
6
-
1
-
5
-
7*
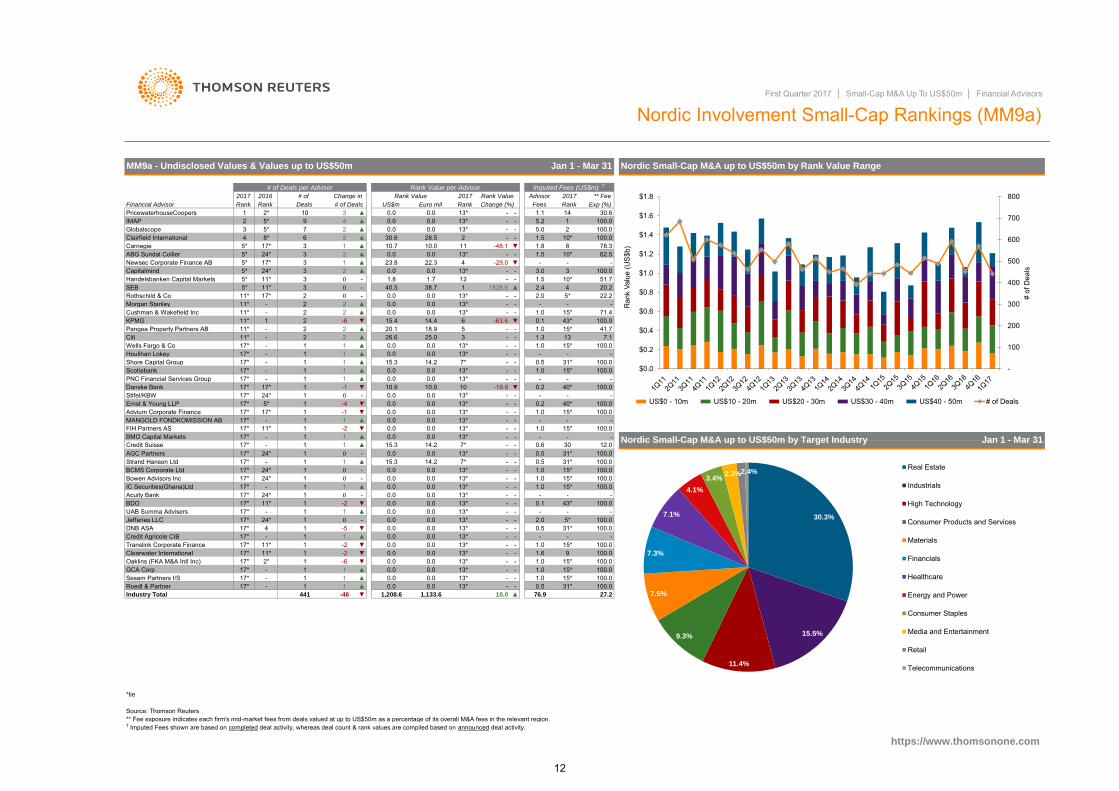
Nordic Involvement Small-Cap Rankings (MM9a)
Rank
-
Jan 1 - Mar 31
-63.611*
100.0
** Fee
Rank
-
Nordic Small-Cap M&A up to US$50m by Target Industry
5*-
https://www.thomsonone.com
100.0
27.2
1
-
441
1
1
24*15*
-
17* -
17* 1▲- 1▲
11
Shore Capital Group
17* -
ScotiabankPNC Financial Services Group
17*Houlihan Lokey
17* -
-
Citi 11* - 2
KPMG 11*- 2Pangea Property Partners AB
2Rothschild & Co 011* 2
Cushman & Wakefield Inc 11* - 2
0
Handelsbanken Capital Markets 35*3
Morgan Stanley 11* -17*
2
5* 17*3
SEB 5* 11*-
2
24* 23Newsec Corporate Finance ABCapitalmind 5* 24*
3
▲6
Rank Value per Advisor
-
2017
13*
3Clairfield International 28.5
1 ▲
1 -6
Danske Bank
ABG Sundal Collier
17*
0.0
-
13*
4
17*
1828.6
0.0 13*IMAP
18.9
Wells Fargo & Co
Rank Value
-
1.5-
Change (%)
-
31*
1.3
0.1 100.0
100.0
100.0
Jan 1 - Mar 31
-
▼
17* 4
1 ▲1
-
-
-
-
▼
-1
-
▼0.0
13*
40*Stifel/KBW
1
BMO Capital Markets
17*FIH Partners AS
-11*
117*
-
1.0 15*
-
100.0
43* 100.0
-0.2
0.5
-
1.0
43*
2.0
100.015*
-
15*-
1.0
7.1
--
1.0
78.3
10*
71.4
5*
1.5
62.5
-
1.013*
--
2.0
0.0
-2
17*
17*
0.0▲
1 ▲0.0
2
14.2
11
2
1 ▲
13*
1113*
▲
14.4
1
10.70.0
38.7
22.3 40.0
0.0
1.7 1240.5
MM9a - Undisclosed Values & Values up to US$50m
Rank
13*
0.0
2
10.0
-
Strand Hanson LtdAGC Partners
Bowen Advisors Inc 24*
24*
Acuity Bank
17*
DNB ASA
Industry Total
17*17*
** Fee exposure indicates each firm's mid-market fees from deals valued at up to US$50m as a percentage of its overall M&A fees in the relevant region.
17*
-
17*17*
1
-13*▲
0
0.00
-BCMS Corporate Ltd
IC Securities(Ghana)Ltd
24*
UAB Summa Advisers
-
Credit Suisse
14.2
1
17*
MANGOLD FONDKOMISSION AB1
1
17*
1Ernst & Young LLP
17*
1
-4
14.2
0.0
▲
-
▲▼
1
9
2017
▼
1
-
2 ▲
1
Globalscope
-
Euro mil
0.03
5*
Rank Deals
5* 17* 1
▲
0.075*
Carnegie8* 24
Nordic Small-Cap M&A up to US$50m by Rank Value Range
▲ -Fees
# of Deals per Advisor
0.023.8
0.0
Advisor2016
US$m
2
102*
# of
Advium Corporate Finance
Change in
▼
2PricewaterhouseCoopers
5*
▲
▼
# of Deals
1
-
0.0
-117*
24*-
17*
-1 0
1
1 0.0
-
▲51.7
15*
1 15.3
-
0.0
1
--
13*-
-
0.1
▼
--
-
-
13*
-19.9
-
-
7*
8
100.021
10*
30.614
First Quarter 2017 │ Small-Cap M&A Up To US$50m │ Financial Advisors
2017
1.1
1.55.0
▲
30.6 -100.0
Financial Advisor
-
2
10*-48.1
13* -
3.0
-
-29.0
1.8
13*
-
100.0-
-
0.210
-
13*
-
2.4
-
-
4
-
1.0
100.0
20.222.2
▼
-
-
▼
-
-
-
-
--
-
-
0.5
9
12.0
100.0
100.0
100.0
100.0
41.7
100.0
100.0
Exp (%)
-
15*100.0
-
100.0
31*0.5
-
3
15*
-
5.2
-
1.0
-
13
Imputed Fees (US$m) †
-
31*
30
-
0.5
76.9
-15*
15*
31*
-
0.5 31*
13*
▲
13*
-
0.0
13*0.0
1
0.0 -
0.0
0.0
-
0.0
0.0
26.6 25.0
10.9
0.0
0.0
0.0
0.0
† Imputed Fees shown are based on completed deal activity, whereas deal count & rank values are compiled based on announced deal activity.
15.420.1
0.0
15.3
0.0
0.0
0.00.0
0.6
1.0
-
0.0
0.0
Rank Value
1.8
10.0
100.0- 1.0
100.015* 100.0
0.00.0 0.0 13*
Roedl & Partner 17* - 1 1 ▲Sesam Partners I/S 17* - 1 1 ▲
- 1.0 15* 100.0- - 1.0
GCA Corp 17* - 1 1 ▲ 0.0 0.00.0 0.0 13* -
13* -Oaklins (FKA M&A Intl Inc) 17* 2* 1 -6 ▼
100.0
0.00.0
0.0
0.0
0.0 - 1.6-0.0
0.0
▼ 0.0
0.0
0.0
0.0
0.0
▲0.0
▲
15.3
3
▲
11* 0
15* 100.0Clearwater International 17* 11* 1 -2 ▼ 13*
13* - -- -
1.0Translink Corporate Finance 17* 11* 1 -2 0.00.0 0.0 13* - - -Credit Agricole CIB 17* - 1 1 ▲
30.3%
15.5%
11.4%
9.3%
7.5%
7.3%
7.1%
4.1%
3.4% 2.3% 2.4%
Real Estate
Industrials
High Technology
Consumer Products and Services
Materials
Financials
Healthcare
Energy and Power
Consumer Staples
Media and Entertainment
Retail
Telecommunications
-
100
200
300
400
500
600
700
800
$0.0
$0.2
$0.4
$0.6
$0.8
$1.0
$1.2
$1.4
$1.6
$1.8
# of
Dea
ls
Ran
k Va
lue
(US
$b)
US$0 - 10m US$10 - 20m US$20 - 30m US$30 - 40m US$40 - 50m # of Deals
12
*tie
2
Benelux Small-Cap M&A up to US$50m by Rank Value RangeJan 1 - Mar 31
Jan 1 - Mar 31
-
- 1.0 5.61.1
† Imputed Fees shown are based on completed deal activity, whereas deal count & rank values are compiled based on announced deal activity.
11
-2
255
9*▲
2
-
-34* 4
# of
-
4
4
13*7
Rank
▲
▲
3.0
Change in
Deals
# of Deals per Advisor
# of Deals
-
25.6
100.0
100.0
36.8
100.0
** Fee
100.0
52*0.3
Imputed Fees (US$m) †
55*100.0
12* 13.8
Benelux Involvement Small-Cap Rankings (MM10a)
63.8
34.6
100.0
3*
100.0
16*
-
-
2991.71 33
-11
-
-
29.3
▲▲
4
234*34*
2
2
-6
Source: Thomson Reuters
▼
2
3
Benelux Small-Cap M&A up to US$50m by Target Industry
Robert W Baird & Co Inc-
1.1
7
https://www.thomsonone.com
** Fee exposure indicates each firm's mid-market fees from deals valued at up to US$50m as a percentage of its overall M&A fees in the relevant region.
16*
▲
16*2
-1▲
0.0
3
-17.4
▼16*
0.00.0▲
16*
0.0
0.0
-0.0
0.0-
-
37.1 34.5
▼
0.0
34.537.134.3
0.0
0.0
16.4
▼-0.0
-1 16*
25.0 9
16*0.0
▲4 16*16*▲
0.0
26.5
0.0
919* ▲
0.06
2
8
0.0
CapitalmindING
0.0▲
2016
2*
2017
Euro mil
▲13*1 3*
Financial Advisor Rank
53*
6*
13*
IMAP 2*
Rabobank NV
Rothschild & CoLazardOaklins (FKA M&A Intl Inc)
PricewaterhouseCoopers 13*
KPMG 11*
6*
2*
8*
Goldman Sachs & Co8*
Ernst & Young LLPGlobal M&A
Citi 11*13*
13*13*
CBRE Holding SASMorgan Stanley 13*
13*
Mizuho Financial Group 13*-
Alantra Partners SA
MM10a - Undisclosed Values & Values up to US$50m
8*0.0
-
-6
0.0
9
0.0
7
-
46*
-
9
-
19*
-16*-
22
3*31.4
▲
--
Rank Value
510*
9.0
Rank
-
2.0
8*
8*16*
3*-
-
-
-
-
-
22.2
16*
11*
100.0
4.0100.0
75.0
4.0
-
23.314.0
1.1▲
0.50.2
Fees
-
2.0
1
16*
Exp (%)
6
Advisor 2017
34.7
16*
-
-
First Quarter 2017 │ Small-Cap M&A Up To US$50m │ Financial Advisors
--
12*
8.5
2017
16*
0.00.0
Rank Value per Advisor
US$m Change (%)
-16.8 162.8
-
32.5
Rank Value
0.0
0.0
100.0
Rank
15
-
▼Industry Total 370 -67 ▼ 925.3 868.2
20.4%
15.9%
13.4% 11.8%
8.2%
6.5%
6.5%
5.4%
4.9%
3.9% 3.1% Real Estate
Financials
Consumer Products and Services
Consumer Staples
Energy and Power
Industrials
Media and Entertainment
Healthcare
Materials
Retail
High Technology
-
100
200
300
400
500
600
$0.0
$0.2
$0.4
$0.6
$0.8
$1.0
$1.2
$1.4
$1.6
# of
Dea
ls
Ran
k Va
lue
(US
$b)
US$0 - 10m US$10 - 20m US$20 - 30m US$30 - 40m US$40 - 50m # of Deals
13
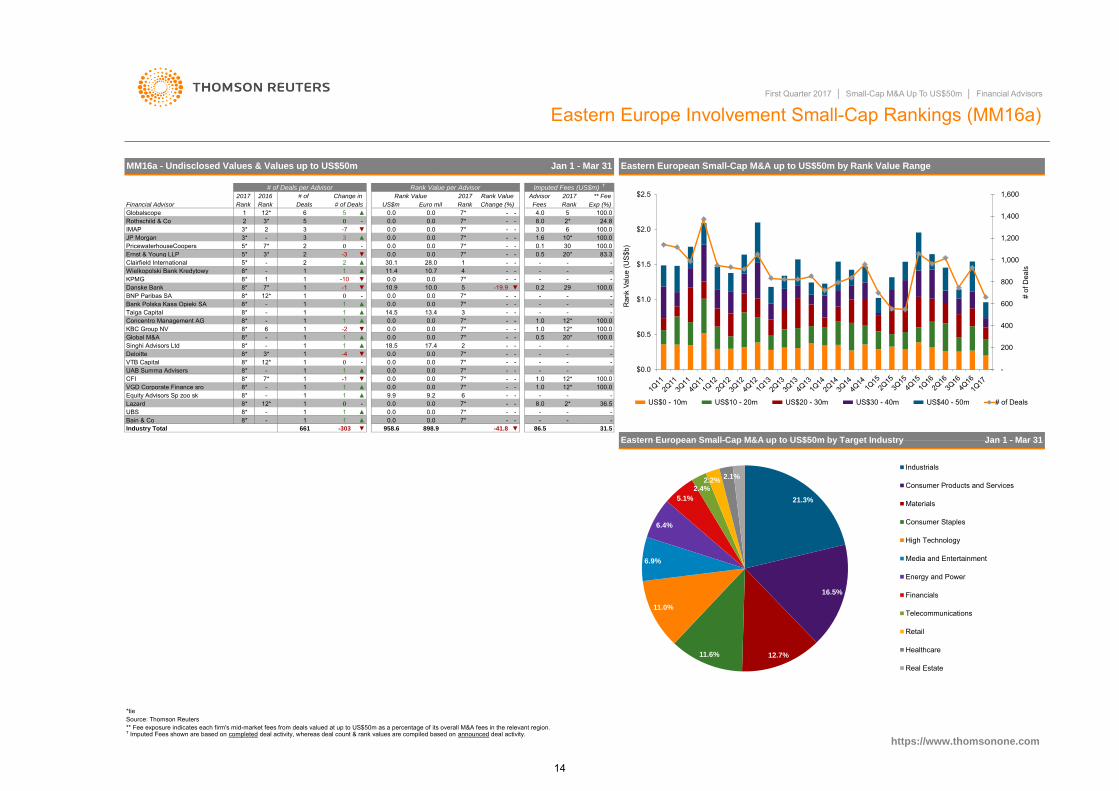
*tieSource: Thomson Reuters
-41.8 ▼ 86.5 31.5Industry Total 661 -303 ▼ 958.6
- - -- - -
- - -
1.0
2* 36.58.0
12*
-
100.01.0 12* 100.0
-- - -- - -
- -0.0 7* - -
-
-
Deloitte 8* 3* 1 -4 ▼VTB Capital 8* 12* 1 0 -
0.0
UAB Summa Advisers 8* - 1 1
0.0 7*
0.0
7*
-
7*
-
-
Rank
4.0
0.0
0.5
0.0 7* -
7* -
-9.20.0
-0.0
0.0 0.0
0.07*
-1
VGD Corporate Finance sro 8* -▼
▲-Equity Advisors Sp zoo sk 8*▲
8* 7* 1 -11 1
▲
-1
Bain & Co 8* -
CFI
1
UBS 8* -012*8*Lazard
7* -
** Fee exposure indicates each firm's mid-market fees from deals valued at up to US$50m as a percentage of its overall M&A fees in the relevant region.
Eastern European Small-Cap M&A up to US$50m by Target Industry Jan 1 - Mar 31
Eastern European Small-Cap M&A up to US$50m by Rank Value Range
-
** Fee
6
Euro mil
-2 -
Eastern Europe Involvement Small-Cap Rankings (MM16a)
Rank Value
0.0
-
-
0.0
0.0
https://www.thomsonone.com
Deals
MM16a - Undisclosed Values & Values up to US$50m
0.0 0.0
5
-Singhi Advisors Ltd 8*
# of Deals
-
8*
# of Deals per Advisor
7*
1-
1
1
▲
1
2
11
-
0.0--9.9
7* - -0.0
0.0
898.9
Global M&A
Fees
- 3.0
0.0
-
5
-7*
-7*
Advisor
-
20*
-
Jan 1 - Mar 31
8.0
-
-
0.0
1.0
-
6
-
-
-3
1.0-
7*
--
-
-
-
0.5
-
† Imputed Fees shown are based on completed deal activity, whereas deal count & rank values are compiled based on announced deal activity.
Change in
56
1
-73
12*
▲1
▼▲
-
PricewaterhouseCoopers
1
7*
Rank
-
3*
3*
Financial Advisor
2
Rank
0.0
2017 2016
18.5▲
▲
7*
0.0
# of
0
17.40.0
0.0
0.0
11.4
14.50.0
0.0
0.0
0.0
7*
7*
10.0
10.70.0
28.0
0.010.0
0
US$m
0.0
Rank Value
▲ 0.00.0
0.0332
30.1
10.9
2▲▼
2
-10-1
▲
▲
1 ▲▼
1
11
1
-
▲
▼
-8*
5*
-2
1
▼
--
-
1
0
KBC Group NV
Bank Polska Kasa Opieki SA
1
Taiga Capital
6
1
118*
8*
8* 12*
Globalscope
3*JP Morgan
Rothschild & Co
-
2
8*Concentro Management AG
8*
5*5*
KPMG8*Danske Bank
Wielkopolski Bank KredytowyClairfield InternationalErnst & Young LLP
BNP Paribas SA
8*
1
IMAP3*
1
-3
0.00.0
100.020*
5
First Quarter 2017 │ Small-Cap M&A Up To US$50m │ Financial Advisors
-
- -
100.0
-
Exp (%)
100.0
-
-
100.0
100.0100.0
-
-
2* 24.8
-
12*12*
-
1.6
-
2017
10*
83.3
100.0
30
--
100.07*
4
7*
---
-
Rank Value per Advisor
0.0
- -
7*
7*
-
Change (%) Rank
-
0.1
- -7*
2017
Imputed Fees (US$m) †
-
-
-
-19.9
13.4
▼ 29
-
0.2
-
21.3%
16.5%
12.7% 11.6%
11.0%
6.9%
6.4%
5.1%
2.4% 2.2%
2.1%
Industrials
Consumer Products and Services
Materials
Consumer Staples
High Technology
Media and Entertainment
Energy and Power
Financials
Telecommunications
Retail
Healthcare
Real Estate
-
200
400
600
800
1,000
1,200
1,400
1,600
$0.0
$0.5
$1.0
$1.5
$2.0
$2.5
# of
Dea
ls
Ran
k Va
lue
(US
$b)
US$0 - 10m US$10 - 20m US$20 - 30m US$30 - 40m US$40 - 50m # of Deals
14
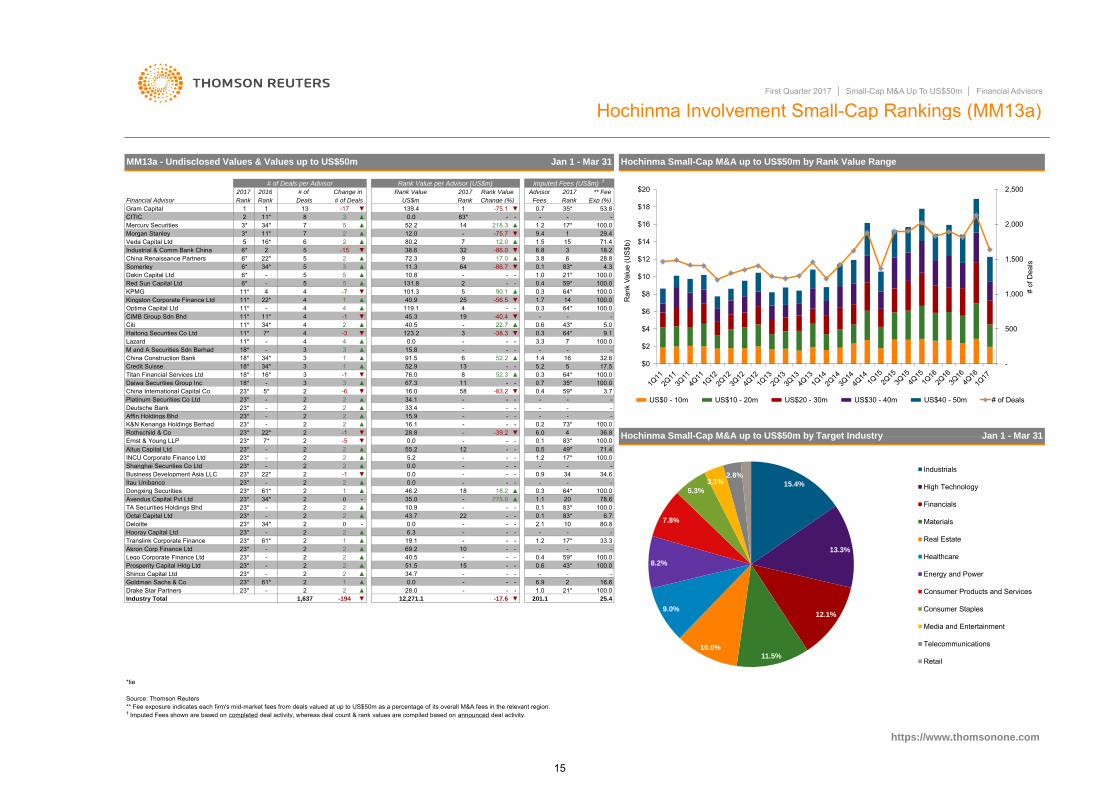
*tie
Source: Thomson Reuters
25.4▼ 12,271.1 -17.6 ▼ 201.1Industry Total 1,637 -194
- -- - -▲
-0.4 59*0.6 43*
-40.5
▲
51.534.70.0
28.0
-
23*
-
Platinum Securities Co Ltd 23*
Affin Holdings Bhd
Credit Suisse
Akron Corp Finance Ltd 23* -
Rothschild & Co
Lego Corporate Finance Ltd 23*
▼
23*23*
23*
▼
MM13a - Undisclosed Values & Values up to US$50m
13
Ernst & Young LLP
Translink Corporate Finance
Altus Capital Ltd
Dongxing Securities
23*
▲
123.2
91.5
4
52.9▲
4
-1
-
-
Morgan Stanley
▲
76.0
▲
0.9
6.9
▲
-
-
-
- - --
-
† Imputed Fees shown are based on completed deal activity, whereas deal count & rank values are compiled based on announced deal activity.
0.3
12.0
0.0
Hochinma Small-Cap M&A up to US$50m by Rank Value Range
Imputed Fees (US$m) †
100.0-
First Quarter 2017 │ Small-Cap M&A Up To US$50m │ Financial Advisors
Rank
0.7
-
0.6
-▼
0.4
-0.3
21* 100.0
1.4
59*
-73*
16.6-
-
1.0
-
58-
-
10- -
-
-
5
34.6
-
100.0
https://www.thomsonone.com
Jan 1 - Mar 31Hochinma Small-Cap M&A up to US$50m by Target Industry22*▼
-
-
-
0.1
15
▲
-1
0
▲
2
▲
▲ 69.219.1▲
▲▼
15.9 - -2
-
-33.4 -34.1 -
0.4
-2Deutsche Bank
5*- 2
2-23*
52.3
-83.2China International Capital Co
▲▲
22
▼- 1167.3▲
▼-6 16.0
8
China Construction Bank
3Titan Financial Services Ltd 18*18* 3
16* -13Daiwa Securities Group Inc
-3
33
18* 34* 1
34* 23
6 ▲18* 34* 1
▼-
-0.0 -
15.83 3
4-40.5▲
M and A Securities Sdn Berhad 18* -Lazard 11*
11*
-
CIMB Group Sdn Bhd
4Haitong Securities Co Ltd 11* 7*4
11* 11*Citi
4 119.140.91
11* 4 ▲▲22*▼ 5
5-7
4 -56.590.1
▲101.3131.8
22*5
4
556*
11* 4
6*2 -15
CITIC
11*34*11*
▲3* 7 ▲
Mercury Securities
China Renaissance Partners6*
▲216* 6
▲▼
2
1
58
Industrial & Comm Bank China5
Gram Capital
3*
5
2
2
Rank
Change in
3
-
Red Sun Capital LtdDakin Capital Ltd 6* -
Kingston Corporate Finance LtdKPMG
-
2
** Fee exposure indicates each firm's mid-market fees from deals valued at up to US$50m as a percentage of its overall M&A fees in the relevant region.
0.0
-5 6411.33 ▲
▲ 10.85
52.2
34*Somerley
Goldman Sachs & Co
7
2016
Optima Capital Ltd
3272.3
▲
-
6*
3.3
▲
-
35*
-
-
-
80.2
28.8
-
-40.4
52.2
-
-86.017.0
38.6
Change (%)
83*
# of Deals per Advisor
-75.1
45.3 ▼
-38.3
--
-
▲
-
▲▲23*
2-
61*
2
23*
23*
23*
-2
2-
61*Drake Star Partners
2
-
Prosperity Capital Hldg Ltd
223*
223*
-2
▲
-▼
23*
2
2
2Deloitte 23*
Shinco Capital Ltd
2
-
2
Octal Capital Ltd
Hooray Capital Ltd
23*
Shanghai Securities Co Ltd
11*
22*
23*
Deals # of Deals
27*
2
2-1
-
-23*
K&N Kenanga Holdings Berhad
139.4
2
1
▼
▲
-17
2
2
2
-
23*
2 -5
34*-
2
Avendus Capital Pvt Ltd
Business Development Asia LLC
23*
23*
INCU Corporate Finance Ltd
2
0.1
-75.7 ▼
-
19
25
-
▲
-
- 6.0
64*
▼
1.255.2
-
--
100.0
0.012
-
0.3
-
-39.2 ▼ 4
0.5
34
18▲
-
--
-
64*
-
5.0-
-
7
21*
32.6
- 1.0
0.3▲
17*
17*
100.0
100.0
4
22.7
2
9
2017
Rank
218.3
1
- -
Advisor
1.5
5.2
3.8
▼
Jan 1 - Mar 31
14
Exp (%)
** Fee
Rank
2017
US$mFinancial Advisor
# of
▼▲7Veda Capital Ltd
14
1 13
12.0
-
1
0.3
0.7
1.7
16
1.2
1536
-
6.8
9.4▲
18.2
-
-
-- 1.2
-2
2
2
0.143.7
6.3
-
2
-
-
0.0
-
2
23* 61*
23*
-
2
21
5.2
-86.7
16.1
22
--
4.3
64*
100.0
-
100.0
43*
100.0
Rank Value
35*
Hochinma Involvement Small-Cap Rankings (MM13a)
100.0
2017
28.8
29.471.4
100.0
100.0-
18.2
-
-
71.4
9.1
3.7
-
36.8
-
64*
49*
59*
--
2
33.3
-
-
100.0
53.8
17.5
64*
83*
100.0775.0
10.9
▲ 46.235.0
▲
-
-0.0 -
▼
83* 100.0
-
-
100.00.2
-
78.6-- 83*
83*
20
80.810-
TA Securities Holdings Bhd 2 ▲ 100.06.7▲
2
17*
-0.0
--
▲-34* 2
1
0
Itau Unibanco
Rank Value
-
Rank Value per Advisor (US$m)
2.1
0.11.1
Fees
-
-
15.4%
13.3%
12.1%
11.5% 10.0%
9.0%
8.2%
7.8%
5.3%
3.1% 2.8%
Industrials
High Technology
Financials
Materials
Real Estate
Healthcare
Energy and Power
Consumer Products and Services
Consumer Staples
Media and Entertainment
Telecommunications
Retail
-
500
1,000
1,500
2,000
2,500
$0
$2
$4
$6
$8
$10
$12
$14
$16
$18
$20
# of
Dea
ls
Ran
k Va
lue
(US$
b)
US$0 - 10m US$10 - 20m US$20 - 30m US$30 - 40m US$40 - 50m # of Deals
15

Industry Total
*tieSource: Thomson Reuters
- -
Drake Star Partners 21* - 1 1 ▲Royal Excalibur Corporate Fin 21* - 1 1 ▲Grand Moore Capital Ltd 21* - 1 1 ▲Fortune Financial Capital Ltd 21* - 1 1 ▲Alliance Capital Partners Ltd 21* 24* 1 0 -
Industrial & Comm Bank China 21* 24* 1 0
- --
Industry Total
11*
11*
- 1Karl Thomson Holdings Ltd
F.E. Corporate Finance Advisor
-
1
▲
21*
21*
347 6
1
1
▼-
21*
▲
-
21*
Deutsche Bank 21* - 10
1Guotai Junan Securities 1
-
1
-
3
8*
21*
21*
2
9*
Messis Capital LtdDonvex Capital Ltd
24*
9*
GF Securities 24*11*
21*
Prosperity Capital Hldg Ltd
PricewaterhouseCoopers
21*
11*
-
-
11*
2
2Akron Corp Finance LtdLego Corporate Finance Ltd
-
Dongxing Securities 11*-
Shinco Capital Ltd
Platinum Securities Co Ltd-
Hong Kong Involvement Small-Cap Rankings (MM12a)
100.0
-
0.6
2017
25*-
-
100.0
-
Hong Kong Small-Cap M&A up to US$50m by Target Industry
14*
110.5
100.0
-
Advisor
-86.7
-
-
https://www.thomsonone.com
Hong Kong Small-Cap M&A up to US$50m by Rank Value Range
26.4
0
11
34.71
22-
▼
19 --
-24 ---
-
51.5
26.5▲39.6
▲0.6
17*▲
69.2
40.9
-
▲
-2
13
-
2
-
-
---
5
1
-10
17*40.5
▲2
-
16.7-
20
--
-
▲
▲4
4
2
Jan 1 - Mar 31
2
2
1
▲▲
▲
Kingston Corporate Finance LtdRed Sun Capital Ltd
Citi
1*
5*
Titan Financial Services Ltd
2
21
Altus Capital Ltd 11*
-9*
9*
4
Haitong Securities Co LtdChina Construction Bank
5*
Optima Capital Ltd
1*
Veda Capital Ltd
8*
▲
MM12a - Undisclosed Values & Values up to US$50m
INCU Corporate Finance Ltd
▲
▲
-
42*
-
-
-
25*
2017
-
-11
-
---
-5.9
0.00.0
1
▲
-1
-
-
8-
-
--
-
-
14
-
-
** Fee exposure indicates each firm's mid-market fees from deals valued at up to US$50m as a percentage of its overall M&A fees in the relevant region.
1
-
† Imputed Fees shown are based on completed deal activity, whereas deal count & rank values are compiled based on announced deal activity.
43.76.3 -
-1
-
-
Change (%)
-0.7
First Quarter 2017 │ Small-Cap M&A Up To US$50m │ Financial Advisors
Rank Value
▼
▲-
119.1▲
-35.776.073.6
2
3
46.22
▲-1
2
55.26
▲-
95.2
Hooray Capital Ltd 11*
-
Octal Capital Ltd -
11*
11*- 2
-2
2
8*
1*9*
2016
5-
Rank
1*1*1*
Rank
5*
555
9*
-Gram CapitalDakin Capital Ltd
Financial Advisor
2017
Deals
4*
3Somerley
Jan 1 - Mar 31
42*
5-31.9
1▼
FeesRank
2 -16
▲
▼
0.1
-0.4
▲ 30
50.5
91.5 4
10.8
Rank Value per Advisor (US$m)
▲
2
# of
4
3
# of Deals per Advisor
# of Deals
▲▼
▲
-
Rank Value
7
▲
1.00.0
25*1
1
▲
▲
▲▲
1
1
▲
40.5
131.8
Exp (%)Rank
1.7
42* 4.3
** Fee
Imputed Fees (US$m) †
71.4
10*
100.0100.05*
1.5
63.61.0
2
0.1
31*
31*
6.7
100.0
-
0.1
0.3
100.0
7.3 -
0.0
-
6.5 -
-
-
-
-
0.3
31*
-
1.2
-
0.3
-
0.3 60.04
100.0
-
80.2
-
3
-
52.2 1.4
14*
30.3
725.0
21* 9*
Baker Tilly International 21* -
Clairfield International 1
- --
21* -
▲
139.4
Change in
11.3
2
US$m
1
1
▲
Wallbanck Brothers Sec (HK) 21* - 1 11
VC Capital Ltd -
Sumitomo Mitsui Finl Grp Inc 21* - 1Asia Investment Management Ltd 21* - 1 ▲
Mitsubishi UFJ Financial Group 21* - 1 1 0.026.4
221.2
-
▲
BB&T Corp 21* - 1 1
5
Lazard 21* -
BaoQiao Partners Capital Ltd
13.6100.00.3
▼▲
-
1
100.0
32.6
-
14*
▲
31*31*
31*
- -- -
0.0 - - -15.5 29 -47.5 ▼46.9 11* 18.4 ▲0.0 - - -
26.4 25* - -43.4 15 174.7 ▲33.2 21 - -4.2 - - -
30.6 22 - -28.0 23 - -
100.01.0 5* 100.00.0 50*
0.2 38*
-1.0 5* 100.00.1 42* 100.0
0.0 50*
10*
-1.0 5* 100.00.2 38* 100.0
- -
0.2
3,534.4
100.0- - -- - -
0.7
0.6 50.0- - -
11.6
- -- - -
▲
-
--
38* 100.0
- -▲
-1 1 ▲ 0.0 - -- -
- - --- -
Highbury Partnership Pty Ltd 21* - 1 1 0.0 - -
42* 100.0Anglo Chinese Corp Finance 21* - 1 1 ▲ 25.8 -
11*9.1 - - - 0.1
- 0.1 42* 100.021* - 1 1 ▲
46.9 -Zhaobangji Intl Capital Ltd 21* - 1 1 ▲
48.2 28.8
17.3%
14.1%
13.0%
10.1%
9.8%
8.1%
7.6%
6.9%
5.9%
4.4% Financials
Industrials
Real Estate
High Technology
Energy and Power
Consumer Staples
Consumer Products and Services
Healthcare
Materials
Media and Entertainment
Telecommunications
Retail
-
50
100
150
200
250
300
350
400
450
500
$0.0
$0.5
$1.0
$1.5
$2.0
$2.5
$3.0
$3.5
$4.0
$4.5
$5.0
# of
Dea
ls
Ran
k Va
lue
(US$
b)
US$0 - 10m US$10 - 20m US$20 - 30m US$30 - 40m US$40 - 50m # of Deals
16
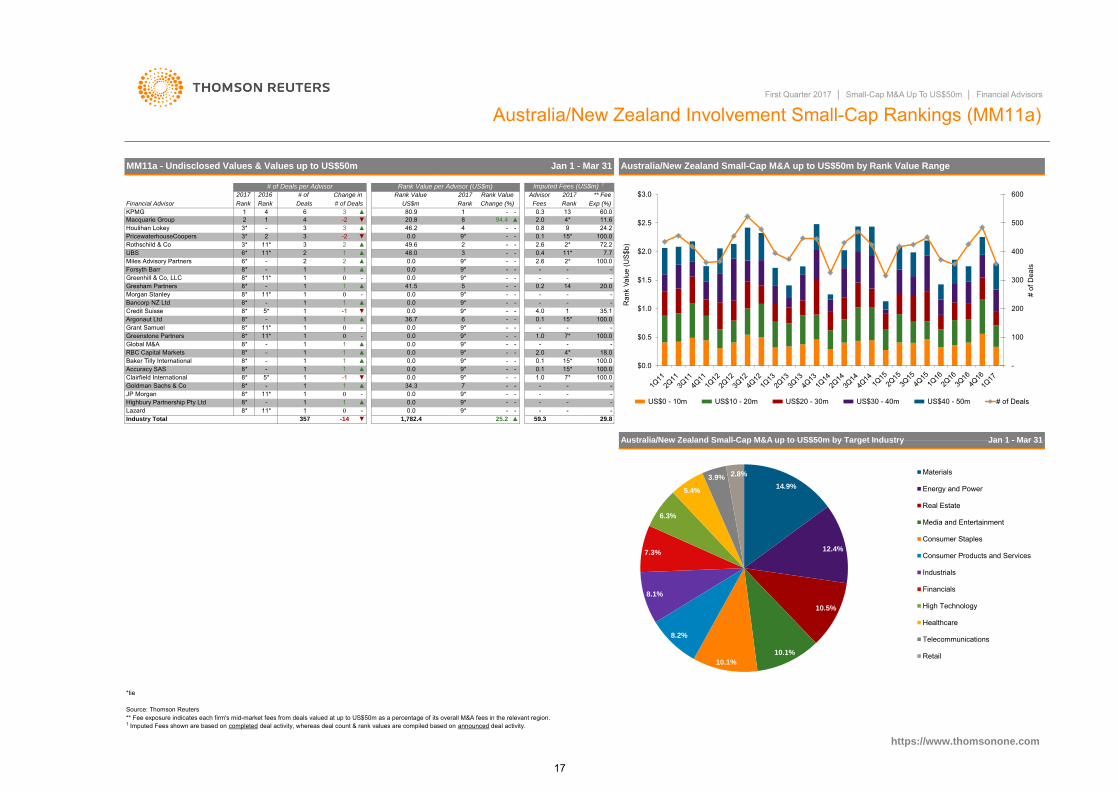
*tie
Source: Thomson Reuters
- - -
1.0 7*
- -
100.0- - -- -
Clairfield International 8* 5* 1 -1 ▼Goldman Sachs & Co 8* - 1 1 ▲JP Morgan 8* 11* 1 0 -Highbury Partnership Pty Ltd 8* - 1 1 ▲Lazard 8* 11* 1 0 -
-0.0
0.0 9* - -34.3 7 - -
9* - -
0.0 9* - -0.0 9* -
29.8Industry Total 1,782.4 25.2
8*
0.0
8*
8
8*
8*
# of Deals per Advisor
3*49.6
3
4
-2
5* -1
2
10.0-
8*8*
1
3
6*
1
-
3* -
Rank
KPMGRank
9*
Rank Value
US$m
20.8
-
357 -14 ▼
15*
▲ 59.3
--
94.4
Rank
Jan 1 - Mar 31Australia/New Zealand Small-Cap M&A up to US$50m by Target Industry
▲0.4
0.0
Rank Value
24.2
** Fee
11.62.0131
▲
Deals
Imputed Fees (US$m) †
Advisor2017 2017
Jan 1 - Mar 31
https://www.thomsonone.com
4*
11*
Rank
9
2*
Change (%)
80.9 - 0.3
MM11a - Undisclosed Values & Values up to US$50m
Financial Advisor
-
2017
Rank Value per Advisor (US$m)
Australia/New Zealand Involvement Small-Cap Rankings (MM11a)
Australia/New Zealand Small-Cap M&A up to US$50m by Rank Value Range
-
46.2
48.0
-▲0.0
▲
▼2
Gresham Partners0
2.6-
2.61 ▲
-
9*3UBS
▲2
6*
11* --
-
Greenhill & Co, LLC 8*
--
49* --
9*-
0.01
▲9*
36.7▲
1 41.5 -
--9*
-
- -▲
▼
0.0
-
4.0-
1.0-
-9*
-
14
Exp (%)
-
100.0
- 111*
2
2
1
-
# of Deals
# of
Fees
2016 Change in
Houlihan Lokey
1 ▲-2
6 3▼
Rothschild & CoPricewaterhouseCoopers
Miles Advisory Partners11*11*
Macquarie Group
3*
7*-
-- -
35.1
- -
100.0
100.0
100.0- 18.0
15*
-
20.0-
15*
-
-
-
5
1
- 1 6
-
0.10.1
9*0.00.0
9*
-
15*
-
0.1
-Morgan StanleyBancorp NZ Ltd
8*Grant Samuel
343
8*
Forsyth Barr
-
Accuracy SAS
11*
1
Greenstone Partners
2
Argonaut Ltd
18*
-
0
1RBC Capital Markets
** Fee exposure indicates each firm's mid-market fees from deals valued at up to US$50m as a percentage of its overall M&A fees in the relevant region.
Baker Tilly International
0.01
1
▲
Credit Suisse
8* -
▲9*
1
0.8
1
100.0-
-
0.2--1
2
0
0
1
1
-0.0
9* -
2*0.1
7.772.2
First Quarter 2017 │ Small-Cap M&A Up To US$50m │ Financial Advisors
-
60.0
† Imputed Fees shown are based on completed deal activity, whereas deal count & rank values are compiled based on announced deal activity.
2.08* -
- ▲1
1
8*
11
11*Global M&A - -
-
0.0 -0.0 -
-
-
-
4*
▲ 100.09* -
0.0 9*
14.9%
12.4%
10.5%
10.1%
10.1%
8.2%
8.1%
7.3%
6.3%
5.4%
3.9% 2.8% Materials
Energy and Power
Real Estate
Media and Entertainment
Consumer Staples
Consumer Products and Services
Industrials
Financials
High Technology
Healthcare
Telecommunications
Retail
-
100
200
300
400
500
600
$0.0
$0.5
$1.0
$1.5
$2.0
$2.5
$3.0
# of
Dea
ls
Ran
k Va
lue
(US
$b)
US$0 - 10m US$10 - 20m US$20 - 30m US$30 - 40m US$40 - 50m # of Deals
17
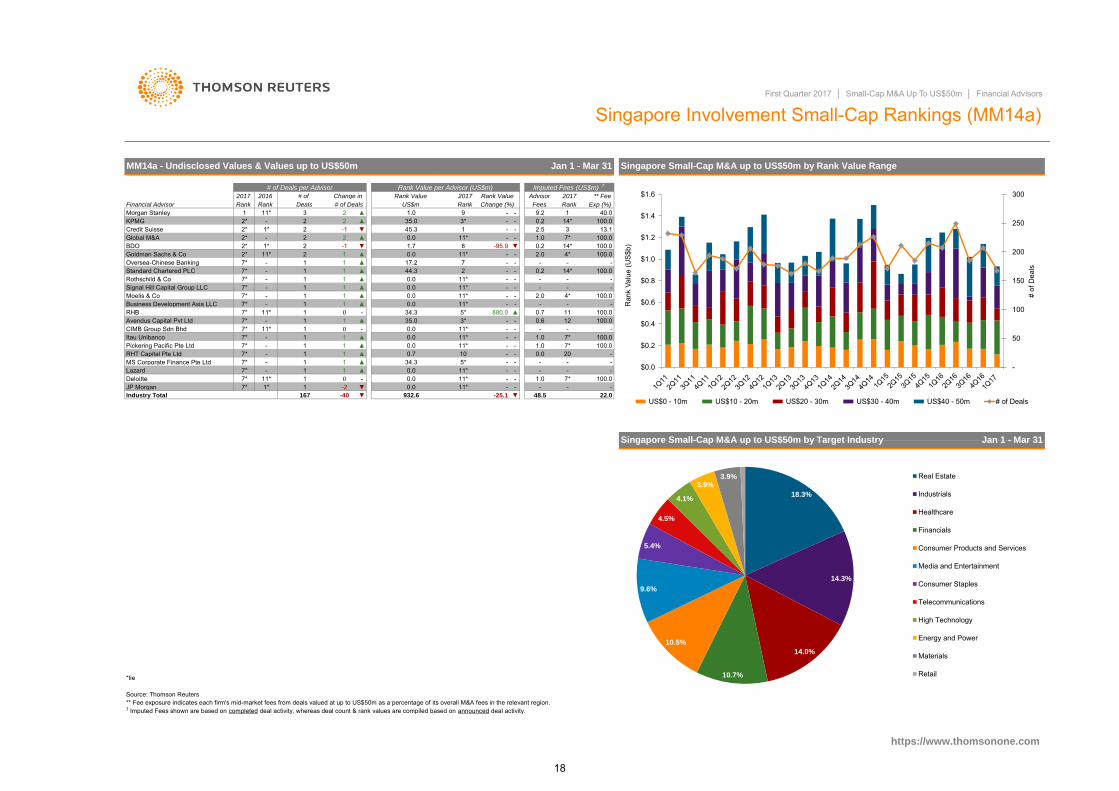
*tie
Source: Thomson Reuters
22.0
0.2
11*
Industry Total 167 -40 ▼ 932.6
0.0 -0.2
▲
https://www.thomsonone.com
MM14a - Undisclosed Values & Values up to US$50m
-
1
# of Deals
2▼
▲1Goldman Sachs & Co
-
44.3
11
-1
11*
45.3
7
35.0
0.0▲
81 0.0-1
--95.9
1.0Rank
0.0
Advisor
-2.0-
9.20.2
1.0
-9
1.7
-
Fees
Singapore Small-Cap M&A up to US$50m by Rank Value Range
Exp (%)
40.0
100.0
100.0100.0
11*2
-
--2.5 13.1
100.0
-
3* 14*1
7*11*--
-
-100.0
-
2*
11
▲
17.24*--
100.0
-
-
14*
100.011
-
Singapore Small-Cap M&A up to US$50m by Target Industry
0.7
100.01.0
12-
▼
100.0
Jan 1 - Mar 31
-
Oversea-Chinese Banking
2* -
11*
-
-7*
▼
- -
-11*
- -
** Fee exposure indicates each firm's mid-market fees from deals valued at up to US$50m as a percentage of its overall M&A fees in the relevant region.
1 ▼
-
** Fee
14*
--
880.0 ▲
-
-
-
-
2.0
-
3
Rank
1
0.6
-4*
Financial Advisor
2*
2*
Global M&A
--
--
Rank Deals
3
22
1
-
0
# of 2017
11*
1
2
# of Deals per Advisor
2
100.00.0
-7*
0.0
11*
-25.1
1.0
20
48.5
11*1
2016
-
Rank Value
34.3
First Quarter 2017 │ Small-Cap M&A Up To US$50m │ Financial Advisors
Jan 1 - Mar 31
7*
-7*
1
1
RHB
7*
0
0.0
Change in
1
0.0
7*
-
100.0
--
JP Morgan 7*
▼
-
7*
KPMG
Rank US$m
Singapore Involvement Small-Cap Rankings (MM14a)
20172017
Rank Value per Advisor (US$m)
2-1
▲2
1*2
▲
Credit Suisse 2*
▲
MS Corporate Finance Pte Ltd 7*
▲
1*
3*
1 0 0.0
1
▲
-
▲
Avendus Capital Pvt Ltd 7* -
11*
CIMB Group Sdn Bhd 11*Itau Unibanco
LazardDeloitte
7*
▲
▲
35.0
1
Signal Hill Capital Group LLC
Morgan Stanley
7*
7*
7*
BDO
7*
Pickering Pacific Pte Ltd
7*
Standard Chartered PLCRothschild & Co
Business Development Asia LLC
7*
† Imputed Fees shown are based on completed deal activity, whereas deal count & rank values are compiled based on announced deal activity.
7*
Moelis & Co 7*
RHT Capital Pte Ltd
-1
11*
1
1
1- 1 ▲
▲0.0
1
-2
1
1
1*
-
1
1 1
-
1.0
▲1 ▲ 0.7
--
-
5*
-
-
-
-
-5* -
-
11*
11* -
-
10
11*
11*
-
-
-11*
Rank Value
Change (%)
0.0
34.3
-
- -
-
Imputed Fees (US$m) †
-0.0
- -0.0
18.3%
14.3%
14.0%
10.7%
10.5%
9.6%
5.4%
4.5%
4.1%
3.9% 3.9% Real Estate
Industrials
Healthcare
Financials
Consumer Products and Services
Media and Entertainment
Consumer Staples
Telecommunications
High Technology
Energy and Power
Materials
Retail
-
50
100
150
200
250
300
$0.0
$0.2
$0.4
$0.6
$0.8
$1.0
$1.2
$1.4
$1.6
# of
Dea
ls
Ran
k Va
lue
(US
$b)
US$0 - 10m US$10 - 20m US$20 - 30m US$30 - 40m US$40 - 50m # of Deals
18

*tieSource: Thomson Reuters
† Imputed Fees shown are based on completed deal activity, whereas deal count & rank values are compiled based on announced deal activity.
1
▲
12
Jan 1 - Mar 31
14*
5
Japanese Small-Cap M&A up to US$50m by Target Industry
5
▼
0.021*
21*
21* 2
-
0.0 -71.8
-
▲
0.0 33*0.0
7
-
0.0
-1
-78.6
0.5
-
1.1
1.0
-
--
160.9
--17.0
▲
-▼
▼
13
▼▲
23
3
-9 0.0
1.556*
29*
25
21*-
56*
-2.0
0.1
75.0
100.0
▲
# of Deals per Advisor
-
316*17.3
29*11*
45*2.6
3
6
1.0
Rank Value per Advisor (US$m)
14
19*
2
0.1
-
19*
-
-45* 100.027*
100.0100.0es Networks Co Ltd 0.514*
-
3.5
Growin Partners Inc
36* 25
25*IMAPCiti 16*
22
--
-0.0-
▼-69.4-80.3
-
▼
236* 12 ▲
▲Global M&A 21* - 2Lincoln International
-27.8▲
-ING 21* 36* 2
- 11.024.4
19*-10
1
▼3
8 3Frontier Management Inc 16*
Mitsubishi UFJ Morgan Stanley 21* -YAMADA & PartnersDeloitte 16*
30
0
216*
4.0▲
7.30.0▲
19*
36*-
4 4
-▲4 24.0
2.4 -
1
▲AGS Consulting Co Ltd
0.0 -19.3 7
Ernst & Young LLP 12* 25*12*12*
KPMG 22.30.0
▼-1166
10 ▼-6
9* 10 -5
6*
Mitsubishi UFJ Financial Group
1-3
147.2
950.6
149.5
▼
▲9
11
9* 3
7*
Mizuho Financial Group
7*4*
9
Maxus Corporate Advisory Inc
1* 35
11PricewaterhouseCoopers
6
2016
17
6.2
9*GCA Corp
-411.0
2
101.0
6
-54.7
88.0
100.046.5
143.4
1.4
193
100.0
9.51
Imputed Fees (US$m) †
100.0
2.2
https://www.thomsonone.com
46.77
4*
1Rank Exp (%)
** Fee
29
Nomura
Rank
Japanese Involvement Small-Cap Rankings (MM15a)
-35.5
2017
Jan 1 - Mar 31
2017
Sumitomo Mitsui Finl Grp Inc ▲Fees RankRankFinancial Advisor
Advisor
18.7
▼ 54.2
26
Change in
10
42.213.321*
15*0.8
29*
41
2017
13.2
2
100.0
0.9
▼47.6
100.0
36.0
17
1.0-
-
2.0
MM15a - Undisclosed Values & Values up to US$50m
Deals
0
# of Deals US$m
3Daiwa Securities Group Inc45
CLARIS CAPITAL 21*
Sangyo Sosei Advisory Inc
Kaede Group
Tokyo Financial Advisers
16*
21* 19*Azone Partners
6*
19*21*
Sumitomo Mitsui Trust Holdings
Plutus Consulting Co Ltd
-
12
170.7
# of
205.2714*
-61*
3.0
2 -2
2.7
▲
-
-
Rank Value
1
1.5
2
▲
First Quarter 2017 │ Small-Cap M&A Up To US$50m │ Financial Advisors
Japanese Small-Cap M&A up to US$50m by Rank Value Range
8
4
▼-59.4
Change (%)
-- - -
2-11 -
▼
-36.4
** Fee exposure indicates each firm's mid-market fees from deals valued at up to US$50m as a percentage of its overall M&A fees in the relevant region.
-
2.3
17.1
100.043.5
-
100.0-
▼
▲
Rank Value
-
▲
56*-
29*
1275.0
2-
36*▼
-
- - 0.5 45*4.0
100.0100.0
3.0 15*
▼
-
-
-
33*
-
-
31.1
-
11*
▼
▲
9-74.3
42.9
2▲
▼
0.1
Alantra Partners SA 21* 36* 2 1
▼-1
▲ - 100.01.0
-
40
100.0
▼ 217.2715 -145 ▼ 2,490.2 -18.6 28.7Industry Total
19.9%
12.7%
12.5%
11.0%
11.0%
9.0%
7.0%
5.2%
4.9%
3.6% 3.2% High Technology
Industrials
Consumer Products and Services
Media and Entertainment
Materials
Real Estate
Financials
Consumer Staples
Healthcare
Retail
Energy and Power
Government and Agencies
-
100
200
300
400
500
600
700
800
900
1,000
$0.0
$0.5
$1.0
$1.5
$2.0
$2.5
$3.0
$3.5
# of
Dea
ls
Ran
k Va
lue
(US$
b)
US$0 - 10m US$10 - 20m US$20 - 30m US$30 - 40m US$40 - 50m # of Deals
19
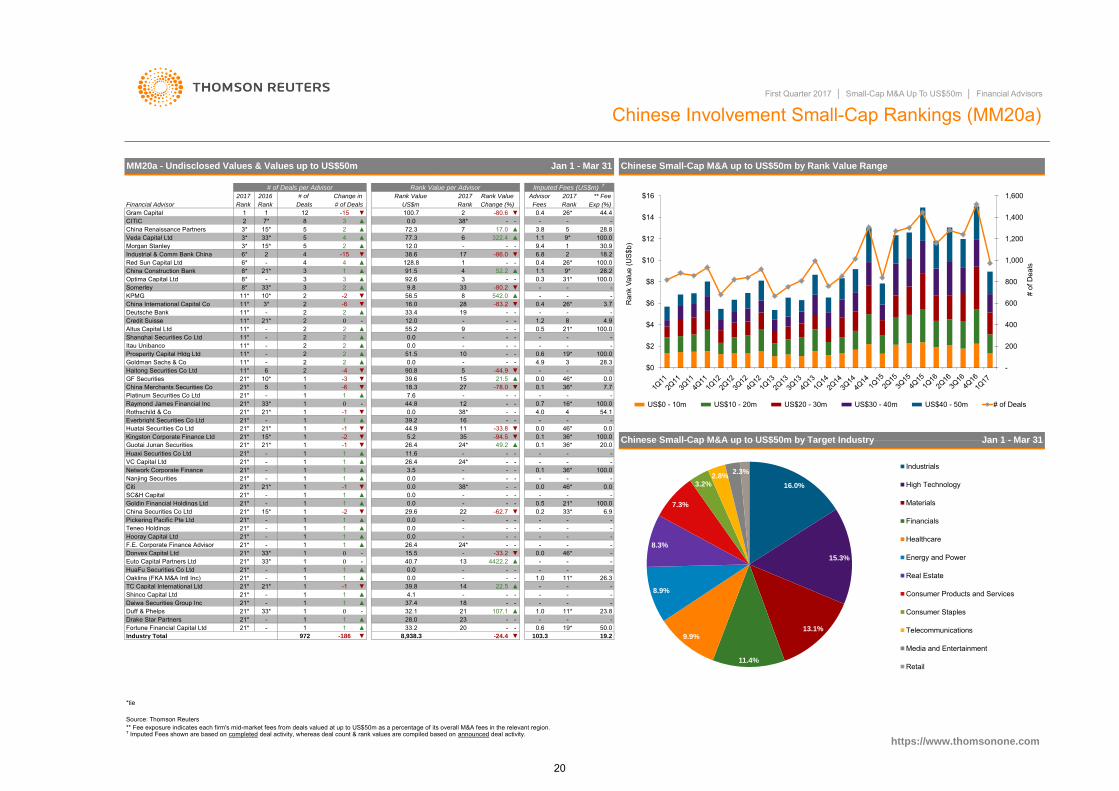
*tie
Source: Thomson Reuters
1.0 11* 23.8
- -
0.0
--
--
46*
19*
-
-
0.4 26*
-
▲
21* -
Raymond James Financial Inc21* -
-
Platinum Securities Co Ltd
21*
Goldin Financial Holdings Ltd 21* -
21* 1 -1SC&H Capital 21* - 1
China Securities Co Ltd 21* 15* 1 -2 ▼1 1
▼
▲
1 1
▲1
- 1 1 ▲
Pickering Pacific Pte Ltd 21* - 1 1 ▲
21*
China Merchants Securities Co 21*
Nanjing Securities
Huatai Securities Co Ltd 21*
Network Corporate Finance 21*
Citi
-
Teneo Holdings 21*
-
Hooray Capital Ltd 21*
Donvex Capital Ltd 21* 33* 1 0
F.E. Corporate Finance Advisor 21*
Euto Capital Partners Ltd 21* 33* 1 0 -
55.2
HuaFu Securities Co Ltd 21* - 1 1 ▲
21* 1 -1 ▼Oaklins (FKA M&A Intl Inc) 21* - 1 1 ▲
21* - 1TC Capital International Ltd 21*
▲
1
0.0 -
1 1 ▲
1 1 ▲
0.0
0
Daiwa Securities Group Inc 21* - 1 1 ▲Shinco Capital Ltd
Chinese Involvement Small-Cap Rankings (MM20a)
4-
Chinese Small-Cap M&A up to US$50m by Rank Value Range
† Imputed Fees shown are based on completed deal activity, whereas deal count & rank values are compiled based on announced deal activity.
0.0
-
▲
-
-Duff & Phelps 21*
Everbright Securities Co Ltd
1
Optima Capital Ltd
12.0
-10
72.3
https://www.thomsonone.com
7.6
15
33*
8* -China Construction Bank 3 1
1
Red Sun Capital Ltd 6* -
12.038.6
15* 5 2 ▲77.3
12
▲
1928
-9
4 4
4
▲ 92.6
33.416.0
4128.8▲ 1
▲
--
-- -0.6
-- -
-
- -
100.0-
0.7 16*
-
- - --
-33.8 ▼
** Fee exposure indicates each firm's mid-market fees from deals valued at up to US$50m as a percentage of its overall M&A fees in the relevant region.
-
▲4.0
21* 39.2
1
0.0▲
▼
-
21.518.3
51.5
-44.9
-
27
-28.0
0.0 38* - -
--
▲
12
1 1
▲▼ 5.2
46*44.9 11
38*16
-
Chinese Small-Cap M&A up to US$50m by Target Industry
--
-
0 -
1 -1 ▼
54.1-
44.8Rothschild & Co 21* 21* 1 -1
21* 33*▼
11 1 ▲
-65 1 -78.0 ▼ 0.1 36* 7.70.0▼ ▲GF Securities 21* 10* 1 -3 39.6
4.9 3▼
▲90.8 5
--
28.3- 2 2▼Haitong Securities Co Ltd 11*
Prosperity Capital Hldg Ltd 11* - 2 2
-46 2Goldman Sachs & Co 11*
100.0
- - -
-
-11* - 2 2 ▲
-0.00.0
2 -- - 0.5 21* 100.0
Itau Unibanco
Altus Capital Ltd 11* - 2 2Shanghai Securities Co Ltd 11* - 2
Credit Suisse 11* 21* 2 0
-- - - 1.2 8 4.9
-83.2- - -
▼ 0.43* 2 -6 ▼Deutsche Bank 11* - 2 2 ▲
Somerley
3.7-- -
26*China International Capital Co 11*KPMG 11* 10* 2 -2 ▼
8* 33* 3 2 ▲856.5
9.8 33- 0.3
-80.2
28.2
▼
-
100.0-
542.0--
100.0
▲
52.231*9*▲ 1.1
3▲8* 21*
3 391.5
6* 2 4 -15 ▼ 217
Veda Capital Ltd 3* 33* 59.4
18.2Morgan Stanley 3*Industrial & Comm Bank China 6.8
-▼ -86.0
17.0 ▲
-1.1
30.9
5
1
-
▲
0.0 -38*7 28.8
▲ 100.06 322.43.8
9*2
-- -China Renaissance Partners 3* 15* 5
7* 8
Change (%)
First Quarter 2017 │ Small-Cap M&A Up To US$50m │ Financial Advisors
Financial Advisor
** Fee# of 2016
US$m
2017
Deals # of Deals
3 ▲CITIC 2
MM20a - Undisclosed Values & Values up to US$50m
100.7Gram Capital 1
Rank Value per Advisor
▼
# of Deals per Advisor
Rank
-15Rank
2 0.4▼
Advisor
Jan 1 - Mar 31
Rank Value
Exp (%)
26*Rank
-80.6 44.4
- -
-
Rank ValueChange in 2017
-
Imputed Fees (US$m) †
FeesRank
2017
-
0.00.0
100.0
0.1
- -
36* 100.00.0
Jan 1 - Mar 3124* 49.2
▼
-0.0 0.0
- ---
-
0.0
26.4
-
-0.1
-
--
0.0 - -
-33.224* -
▼35
26.4
-
29.6
0.0 - - -
15.5 -
0.0
▼40.7 13
22
-
- - -4422.2
39.8 14 22.5 ▲
-62.7
▲
-
--
-
-
32.1 21 107.1-
6.9
4.1 - -
-100.0
0.0-94.5
▲
- -0.5 21*0.2 33*
-
- -
37.4 18
-- - -
36* 20.0
36*
46*-
-- - -
- - -- - -
- - -1.0 11* 26.3
0.0 46*
11.6 -
- -
3.5 - - -
-
Kingston Corporate Finance Ltd 21* 15* 1 -21 -1 ▼
- 1 1 ▲VC Capital Ltd 21* - 1 1 ▲
- 1 1 ▲
Huaxi Securities Co Ltd 21*Guotai Junan Securities 21* 21*
26.4 24* - -
0.6 19* 50.0
-- -
0.1
Industry Total 972 -186 ▼ 8,938.3 -24.4 ▼ 19.2
Drake Star Partners 21* - 120 - -23
103.3
33.2Fortune Financial Capital Ltd 21* - 1 1 ▲
16.0%
15.3%
13.1%
11.4%
9.9%
8.9%
8.3%
7.3%
3.2% 2.8%
2.3% Industrials
High Technology
Materials
Financials
Healthcare
Energy and Power
Real Estate
Consumer Products and Services
Consumer Staples
Telecommunications
Media and Entertainment
Retail
-
200
400
600
800
1,000
1,200
1,400
1,600
$0
$2
$4
$6
$8
$10
$12
$14
$16
# of
Dea
ls
Ran
k Va
lue
(US$
b)
US$0 - 10m US$10 - 20m US$20 - 30m US$30 - 40m US$40 - 50m # of Deals
20

*tieSource: Thomson Reuters
Positron Consulting Svcs Pvt 7* -
▲GCA Corp 7* 8* 1 0 -Daiwa Securities Group Inc 7* - 1 1
▲Drake Star Partners 7* - 1
Jan 1 - Mar 31
Change in
Rank Value per Advisor
MM21a - Undisclosed Values & Values up to US$50m
# of
Avendus Capital Pvt Ltd 2*
2017 2016 Rank Value 2017 Rank Value Advisor
Imputed Fees (US$m) †
2017 ** Fee
Financial Advisor Rank Rank Deals # of Deals US$m Rank Change (%) Fees Rank Exp (%)
Lazard 1 - 3 3 ▲Ernst & Young LLP 2* 2 2 -4 ▼
0.6 15*-
0.0 15* -0.0 -
KPMG 2* 4* 2 -1 ▼ 992.7 ▲ 0.2-15* -
6* 2 0 - 35.0 344.8 1
19.1 8* -775.0 ▲ 1.1
- 1.2 33.38Translink Corporate Finance 2* 8* 2 1 ▲Deloitte 2* 6* 2 0 - 1* 100.015*
- -13 - --
Systematix Corporate Services 7* - 1 1 ▲Rothschild & Co 7* - 1 1 - 1* 22.5
▲ 0.0 -Signal Hill Capital Group LLC 7* - 1 1 15* - -
-UBS 7* - 1 1 -8* 1 0 30.0-
Kotak Mahindra Bank Ltd 7* - 1 1 15*ICICI Bank Ltd 7* 8* 1 0 21*-- 17.7 0.2
1.0▲ -
3 1 -3 2▼
100.07* - 1
100.0
100.0-
-
Jan 1 - Mar 31
† Imputed Fees shown are based on completed deal activity, whereas deal count & rank values are compiled based on announced deal activity.
https://www.thomsonone.com
** Fee exposure indicates each firm's mid-market fees from deals valued at up to US$50m as a percentage of its overall M&A fees in the relevant region.
Indian Small-Cap M&A up to US$50m by Target Industry
100.0
58.8
-
921*
-
100.0-
0.6-34.3 15*0.0
10*
-
- 2.0
-
▲ 28.8 2.0
78.6
-0.5
-
100.0-
-
100.0
Ambit Corporate Finance 7*
17*
-
-
-4*
6
26
--
--
--
18.5
15*
0.0-
2.0
-
15*
-25.0 7 -
-
10
Indian Involvement Small-Cap Rankings (MM21a)
-11
▲ 0.0
0.0
-
-
Globalscope 7* - 1 1
1 ▲
▲Singhi Advisors Ltd 7*
0.0 15*
0.1
-
Indian Small-Cap M&A up to US$50m by Rank Value Range
First Quarter 2017 │ Small-Cap M&A Up To US$50m │ Financial Advisors
- 1 1 ▲
# of Deals per Advisor
-Business Development Asia LLC 7* 8* 1 0
▼37.2-
Axis Bank Ltd 7*Morgan Stanley
-
0.0 15* -Citi 7* - 1 1 ▲ - - -Amidas Partners Inc 7* - 1 1 ▲ 0.0 15* - - 1.0 10*Benchmark International 7* - 1 1 ▲ 0.0 15* - - 1.0 10* 100.0
Mark Corp Advisors Pvt Ltd 7* - 1 1 ▲ 0.7 14 - - - - -Wodehouse Capital Advisors 7* - 1 1 ▲ 0.0 15* - 100.0CapitalSquare Advisors Pvt Ltd 7* - 1 1 - -
- 1.0 10*
7.1 12- -- -
▲
30.0 4*
1 1 ▲ 0.0
0.0
15*1 1
1 ▲
21* 100.0
-
-
0.0 15*- -
15* - --
100.0-
1.0 10*0.3 20
- -
100.019.1 8* - -
17.7 ▲Industry Total 362
--
- 0.254.4 40.1
Sparrow Business Solutions LLP 7* -11 ▲ 1,235.1
18.0%
15.8%
13.9%
9.8%
9.6%
9.2%
7.4%
4.0%
3.7%
3.4% 3.0%
Industrials
Real Estate
High Technology
Materials
Consumer Staples
Financials
Consumer Products and Services
Media and Entertainment
Retail
Healthcare
Telecommunications
Energy and Power
-
2,000
4,000
6,000
8,000
10,000
12,000
14,000
16,000
18,000
0.0
2.0
4.0
6.0
8.0
10.0
12.0
14.0
16.0
Ran
k Va
lue
(US
$b)
US$0 - 10m US$10 - 20m US$20 - 30m US$30 - 40m US$40 - 50m # of Deals
# of
Dea
ls
21
-
-
-
-
-Asia-PacificCatherina Guinto-RoldanTel: +81 3 6441 1142E-mail: [email protected]
Japan -Kaori Motohashi Tel: +813 6441 1142
-
https://www.thomsonone.com
While Thomson Reuters has used reasonable endeavors to ensure that the information provided in this document is accurate and up to date as at the time of issue, neither Thomson Reuters nor its third party content providers shall be liable for any errors, inaccuracies or delays in the information, nor for any actions taken in reliance thereon, nor does it endorse any views or opinions of any third party content provider. Thomson Reuters disclaims all warranties, express or implied, as to the accuracy or completeness of any of the content provided, or as to the fitness of the content for any purpose to the extent permitted by law. The content herein is not appropriate for the purposes of making a decision to carry out a transaction or trade and does not provide any form of advice (investment, tax, legal) amounting to investment advice, nor make any recommendations or solicitations regarding particular financial instruments, investments or products, including the buying or selling of securities. Thomson Reuters has not undertaken any liability or obligation relating to the purchase or sale of securities for or by any person in connection with this document.
© 2017 Thomson Reuters. All rights reserved.
Thomson Reuters and the Thomson Reuters logo are registered trademarks and trademarks of Thomson Reuters and its affiliated companies. Any third party name or mark herein belongs to the relevant third party.
E-mail: [email protected]
Any Involvement league tables include deals where the target, acquiror, or either ultimate parent are domiciled (nation of headquarters) in the specified region or nation.
Financial and legal advisors receive full credit for each deal on which they provide financial or legal advisory services, unless they represent minority sellers or advise on only a portion of the transaction or Thomson Reuters has not been made aware of their participation in that transaction. For pending transactions, advisors to targets of multiple bids receive credit for the transaction agreed to or, in the absence of an agreement, the value of the highest offer.
League tables, commentary, and charts citing announced activity are based on Rank Date and include intended, pending, partially complete, completed, pending regulatory, and unconditional transactions. Rank Date is defined as the earliest public announcement of when a value can be applied to a transaction.
E-mail: [email protected]
A tender/merger transaction is considered to be effective at the time of consummation of the merger or the date on which it is declared wholly unconditional.
Deals with undisclosed dollar values are rank eligible but with no corresponding Rank Value. Non-US dollar denominated transactions are converted to the US dollar equivalent at the time of announcement of terms.
E-mail: [email protected]
Announced league tables include all deals that were announced between January 1, 2017 and March 31, 2017 and of which Thomson Reuters was made aware. All current data and previous year's data is as of 6:00am EST on April 10, 2017.
Ewelina JareckaTel: +44 (0) 207 542 2246
If you would like to participate in the submissionprocess, receive quarterly press releases, or havequestions about league table criteria pleasecontact:
Europe, Middle East & Africa
Robert LevineAmericas
League tables include rank eligible mergers, acquisitions, repurchases, spin-offs, self-tenders, minority stake purchases and debt restructurings.
Ranking Criteria Summary
First Quarter 2017 │ Small-Cap M&A Up To US$50m │ Financial Advisors
Tel: +1 646 223 5682
22
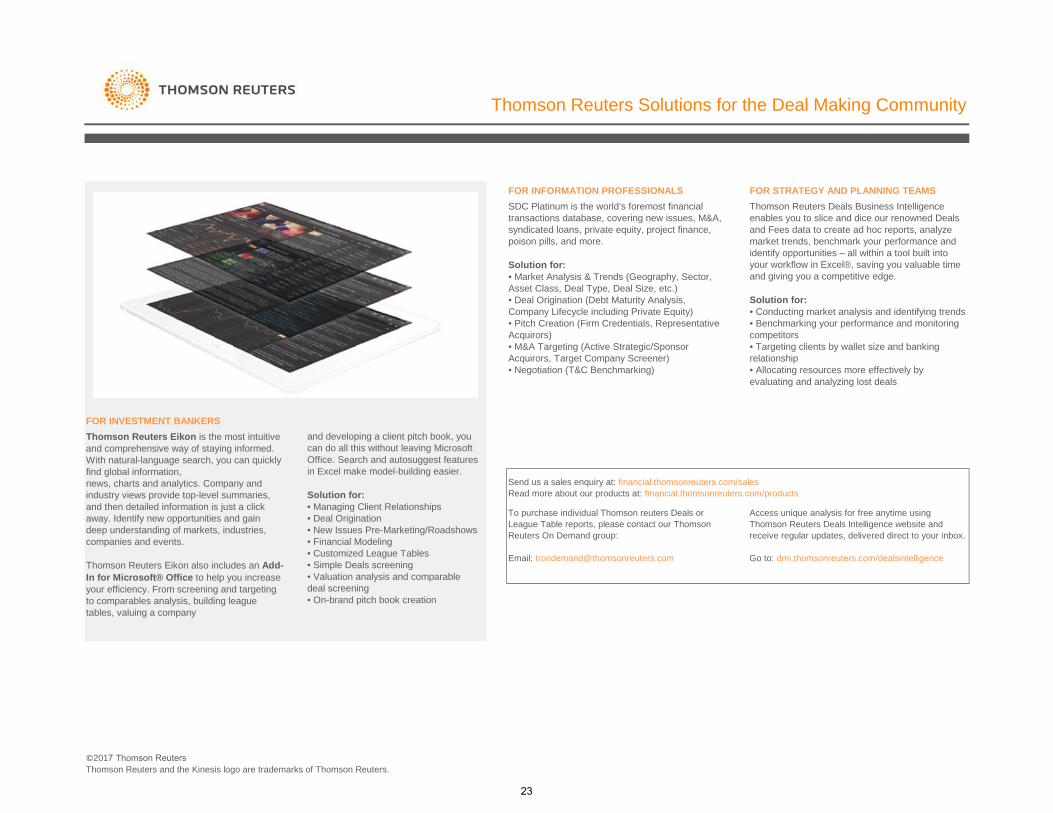
Thomson Reuters Solutions for the Deal Making Community
FOR STRATEGY AND PLANNING TEAMSFOR INFORMATION PROFESSIONALSSDC Platinum is the world’s foremost financial transactions database, covering new issues, M&A, syndicated loans, private equity, project finance, poison pills, and more.
Solution for:• Market Analysis & Trends (Geography, Sector,Asset Class, Deal Type, Deal Size, etc.)• Deal Origination (Debt Maturity Analysis,Company Lifecycle including Private Equity)• Pitch Creation (Firm Credentials, Representative Acquirors)• M&A Targeting (Active Strategic/SponsorAcquirors, Target Company Screener)• Negotiation (T&C Benchmarking)
Thomson Reuters Deals Business Intelligence enables you to slice and dice our renowned Deals and Fees data to create ad hoc reports, analyze market trends, benchmark your performance and identify opportunities – all within a tool built into your workflow in Excel®, saving you valuable time and giving you a competitive edge.
Solution for:• Conducting market analysis and identifying trends• Benchmarking your performance and monitoring competitors• Targeting clients by wallet size and banking relationship• Allocating resources more effectively by evaluating and analyzing lost deals
FOR INVESTMENT BANKERS
evaluating and analyzing lost deals
Send us a sales enquiry at: financial.thomsonreuters.com/salesRead more about our products at: financial.thomsonreuters.com/products
To purchase individual Thomson reuters Deals or League Table reports, please contact our Thomson Reuters On Demand group:
Email: [email protected]
Access unique analysis for free anytime using Thomson Reuters Deals Intelligence website and receive regular updates, delivered direct to your inbox.
Go to: dmi.thomsonreuters.com/dealsintelligence
Thomson Reuters Eikon is the most intuitive and comprehensive way of staying informed. With natural-language search, you can quickly find global information,news, charts and analytics. Company and industry views provide top-level summaries, and then detailed information is just a click away. Identify new opportunities and gain deep understanding of markets, industries, companies and events.
Thomson Reuters Eikon also includes an Add-In for Microsoft® Office to help you increase your efficiency. From screening and targeting to comparables analysis, building league tables, valuing a company
and developing a client pitch book, you can do all this without leaving Microsoft Office. Search and autosuggest features in Excel make model-building easier.
Solution for:• Managing Client Relationships• Deal Origination• New Issues Pre-Marketing/Roadshows• Financial Modeling• Customized League Tables• Simple Deals screening• Valuation analysis and comparabledeal screening• On-brand pitch book creation
©2017 Thomson ReutersThomson Reuters and the Kinesis logo are trademarks of Thomson Reuters.
23


