
Using Information Systems in
Pharmacovigilance
PromotionofAdverseDrugReactionReporting
Doctoral Program in Clinical and Health Services Research
PhD Student
Fernanda Inês de Carvalho Pereira Ribeiro Vaz
Supervisor Co-supervisors
Ricardo João Cruz Correia Cristina Maria Nogueira da Costa Santos
Jorge Manuel Junqueira Polónia


Professores Catedráticos: Professores Catedráticos Jubilados e Aposentados:
Manuel Alberto Coimbra Sobrinho Simões Alexandre Alberto Guerra Sousa Pinto
Maria Amélia Duarte Ferreira Álvaro Jerónimo Leal Machado de Aguiar
José Agostinho Marques Lopes António Augusto Lopes Vaz
Patrício Manuel Vieira Araújo Soares Silva António Carlos de Freitas Ribeiro Saraiva
Alberto Manuel Barros da Silva António Carvalho Almeida Coimbra
José Manuel Lopes Teixeira Amarante António Fernandes Oliveira Barbosa Ribeiro Braga
José Henrique Dias Pinto de Barros António José Pacheco Palha
Maria Fátima Machado Henriques Carneiro António Manuel Sampaio de Araújo Teixeira
Isabel Maria Amorim Pereira Ramos Belmiro dos Santos Patrício
Deolinda Maria Valente Alves Lima Teixeira Cândido Alves Hipólito Reis
Maria Dulce Cordeiro Madeira Carlos Rodrigo Magalhães Ramalhão
Altamiro Manuel Rodrigues Costa Pereira Cassiano Pena de Abreu e Lima
Rui Manuel Almeida Mota Cardoso Daniel Filipe de Lima Moura
José Carlos Neves da Cunha Areias Daniel Santos Pinto Serrão
Manuel Jesus Falcão Pestana Vasconcelos Eduardo Jorge Cunha Rodrigues Pereira
João Francisco Montenegro Andrade Lima Bernardes Fernando Tavarela Veloso
Maria Leonor Martins Soares David Henrique José Ferreira Gonçalves Lecour de Menezes
Rui Manuel Lopes Nunes Jorge Manuel Mergulhão Castro Tavares
José Eduardo Torres Eckenroth Guimarães José Carvalho de Oliveira
Francisco Fernando Rocha Gonçalves José Fernando Barros Castro Correia
José Manuel Pereira Dias de Castro Lopes José Luís Medina Vieira
António Albino Coelho Marques Abrantes Teixeira José Manuel Costa Mesquita Guimarães
Joaquim Adelino Correia Ferreira Leite Moreira Levi Eugénio Ribeiro Guerra
Raquel Ângela Silva Soares Lino Luís Alberto Martins Gomes de Almeida
Manuel António Caldeira Pais Clemente
Manuel Augusto Cardoso de Oliveira
Manuel Machado Rodrigues Gomes
Manuel Maria Paula Barbosa
Maria da Conceição Fernandes Marques Magalhães
Maria Isabel Amorim de Azevedo
Mário José Cerqueira Gomes Braga
Serafim Correia Pinto Guimarães
Valdemar Miguel Botelho dos Santos Cardoso
Walter Friedrich Alfred Osswald

i
Acknowledgements
Reading for a PhD becomes a great adventure in one’s professional and personal life. It would
have been impossible to achieve without the valuable help and encouragement of some special
individuals to whom I am extremely grateful.
I would like to express my deep gratitude to my supervisor, Professor Ricardo Correia, who was
the first to encourage me to pursue this endeavour. His support, confidence and guidance
enabled me to finish my PhD thesis with contentment. I believe that our conversations and the
discussions on the topic of my thesis have been more enlightening than the thousands of scientific
papers I have read over the past years.
I also would like to thank my co-adviser Professor Cristina Santos for her support and assistance.
Together with Professor Ricardo Correia, she always trusted my capacity and ability to successfully
conclude these studies. It has been an enriching experience to work side-by-side on this project.
In addition, I am grateful to Professor Jorge Polónia, my second co-adviser, for his confidence and
dedication to this project, despite his very busy agenda, he always managed to find a moment for
me.
To Professor Altamiro da Costa Pereira, head of the Health Information and Decision Sciences
Department and Director of the Doctoral Program in Clinical and Health Services Research, I
would like to thank the opportunity that he provided by allowing me to accomplish this doctorate,
during some of my working hours as a Coordinator for the Northern Pharmacovigilance Centre.
We can’t do much without the support of our friends. These lines are for them, who were always
by my side, supporting me, making me smile when facing and solving problems. I particularly
would like to thank Ana Marta Silva, Camila Dias, Daniel Pereira, Patrícia Alves, Pedro Farinha,
Pedro Rodrigues, Matilde Monteiro Soares, Madalena Oliveira (always by my side!) and Teresa
Alves (as usual, in the same boat, at the same time…that’s our story!). I am also grateful to all my
colleagues at the Health Information and Decision Sciences Department for the extraordinary
work environment and their daily support. Working with kind people that share a common
interest despite their different positions and backgrounds is not only extremely enriching but also
makes a big difference.
Finally, a big thank you to the most important people in my life: my family. Thank you very much
Mum and Dad for your constant support, helping daily with the kids and for your unconditional
love. All my love goes to my husband and children, who are my reason for living and my daily
inspiration. Thank you for being there and for forgiving me all the absences while completing this
PhD study. I love you all very much and day by day even more!

ii
List of Co-Authors
Ricardo João Cruz-Correia 1, 2
Cristina Maria da Costa Santos 1, 2
Jorge Manuel Junqueira Polónia 1, 3
Ana Marta Matos Silva 1, 3
Altamiro Manuel da Costa Pereira 1, 2, 3
Pedro Pereira Rodrigues 1,2
Fabrício Barbosa 4
Domingos Alves 5
1. Centre for Research in Health Technologies and Information Systems (CINTESIS) University of Porto, Portugal.
2. Health Information and Decision Sciences Department (CIDES), Faculty of Medicine, University of Porto, Portugal.
3. Northern Pharmacovigilance Centre, Faculty of Medicine, University of Porto, Portugal.
4. Oswaldo Cruz Foundation (FIOCRUZ), Rio de Janeiro, Brazil.
5. Faculty of Medicine of Ribeirão Preto, University of São Paulo, Brazil.

iii
Abbreviations
ATC - Anatomical Therapeutic Chemical classification system.
ADR - Adverse Drug Reaction(s)
AERS - Adverse Events Reporting Systems
AE - Adverse Events
ARIMA - Autoregressive Integrated Moving Average
CDSS - Clinical Decision Support Systems
CIDES - Health Information and Decision Sciences Department
CINTESIS - Centre for Research in Health Technologies and Information Systems
CPARA - Catálogo Português de Alergias e Reações Adversas (Portuguese catalog of allergies and
adverse reactions)
EHR - Electronic Health Record(s)
EPR - Electronic Patient Record(s)
EMA - European Medicines Agency
FMUP - Faculdade de Medicina da Universidade do Porto (Faculty of Medicina, University of
Porto)
FDA - Food and Drug Administration
FIOCRUZ - Oswaldo Cruz Foundation
GEDII - Grupo de Estudo da Doença Inflamatória Intestinal (Study Group of Inflammatory Bowel
Disease)
HL7 - Health Level Seven
INFARMED - Autoridade Nacional do Medicamento e Produtos de Saúde, IP (National Authority of
Medicines and Health Products, IP)
IS - Information Systems
ISO - International Organisation for Standardisation
MA - Marketing authorization
PPV - Positive Predictive Value
RAM - Reações Adversas a Medicamentos (adverse drug reactions)
SIRAI - Sistema de Informação de Reações Adversas e Incidentes (Information System for
Adverse Reactions and Incidents)
TTA - Time to causality assessment
ULSM - Unidade Local de Saúde de Matosinhos (Health Local Unit of Matosinhos)
UFN - Unidade de Farmacovigilância do Norte (Northern Pharmacovigilance Centre)
USA - United States of America
VPP - Valor Positivo Preditivo (Positive Predictive Value)
WHO - World Health Organisation

iv

v
Index of tables
Table 1. Comparison of the variables included in three pharmacovigilance databases (Food and
Drug Administration: FDA; European Medicines Agency: EMA and Portuguese Northern
Pharmacovigilance Centre: UFN), grouped in main entities/sections (patients, problems, products
and reporters) .................................................................................................................................. 27
Table 2. Project identification .......................................................................................................... 43
Table 3. Qualitative analysis of the projects .................................................................................... 46
Table 4. Effect of Intervention on increased ADR reporting ............................................................ 47
Table 5. Estimated values of each approach .................................................................................... 60
Table 6. Number and costs of ADRreports obtained with each intervention .................................. 63
Table 7. Number and costs of serious, ADR classified with a high degree of causality and
unexpected ADR reports obtained with each intervention ............................................................. 64
vi
Index of figures
Figure 1. Flowchart of study selection ............................................................................................. 41
Figure 2. Number of publications by year ........................................................................................ 42
Figure 3. Rate (ADR reports after/ADR reports before) of ADR report increase (95% IC) ............... 48
Figure 4. Timeline of the studied approaches .................................................................................. 59
Figure 5. Total number of ADR reports received in the Northern Pharmacovigilance Centre during
the studied period, per trimester (in green, those obtained with protocols) ................................. 62
Figure 6. Two examples of hyperlinks in a computer desktop (back image), and on an Electronic
Patient Record (front image)............................................................................................................ 73
Figure 7. Diagram describing the hospitals and hospital centres of the Portuguese northern region
included and excluded from the study. ........................................................................................... 75
Figure 8. Evolution of ADR reports (total and just on-line) in hospitals with the intervention. The
quarters were adjusted for the time of intervention. 5 hospitals centres implemented the
hyperlink on Dec. 2007, 2 on Jan. 2008, 1 on Feb., 1 on Mar., 1 on Apr. And 1 on May ................. 76
Figure 9. Evolution of ADR reports in the excluded hospitals (with cooperation protocols) and in
the hospitals that did not install the hyperlinks .............................................................................. 77
Figure 10 Information flow .............................................................................................................. 86
Figure 11 Screen shot of the ADR section on the GEDII electronic health record. .......................... 87
Figure 12 Drugs involved in the reported ADR ................................................................................ 89
Figure 13. Screen shot of the Bayesian network .............................................................................. 97
Figure 14. UFN website 2005-2016 ................................................................................................ 104
Figure 15. UFN website 2016 ......................................................................................................... 104
Figure 16. Screen shot of the online patients reporting form (ADR screen). ................................ 106
Figure 17. User interface of the ADR reporting app (first screen). ................................................ 107
Figure 18. User interface of the ADR reporting app (suspected drug screen). .............................. 107

To Clara and João, the two most extraordinary projects I have ever started!

2

3
INDEX
Acknowledgements ........................................................................................................................ i
List of Co-Authors .......................................................................................................................... ii
Abbreviations ............................................................................................................................... iii
Index of tables ............................................................................................................................... v
Index of figures ............................................................................................................................. vi
Resumo da tese ............................................................................................................................. 5
Thesis abstract............................................................................................................................... 9
Achievements and background ................................................................................................... 13
Chapter 1. General introduction ................................................................................................. 15
1.1 Spontaneous adverse drug reaction reporting ................................................................ 15
1.2 Thesis general aims .......................................................................................................... 17
1.3 Thesis structure ................................................................................................................ 17
Chapter 2 – State of the art ......................................................................................................... 19
2.1 Abstract ............................................................................................................................ 19
2.2 Pharmacovigilance Informatics ........................................................................................ 21
2.3 How to Promote Adverse Drug Reaction Reports Using Information Systems – a Systematic Review and Meta-Analysis .......................................................................................................... 33
Chapter 3 - Promoting ADR reports: Comparison of different approaches ................................ 53
3.1 Abstract ............................................................................................................................ 56
3.2 Introduction ..................................................................................................................... 57
3.3 Methods ........................................................................................................................... 58
3.4 Results .............................................................................................................................. 62
3.5 Discussion ......................................................................................................................... 65
Chapter 4 - Promoting spontaneous ADR reporting in Hospitals using a hyperlink to the on-line reporting form. ............................................................................................................................ 67
4.1 Abstract ............................................................................................................................ 70
4.2 Introduction ..................................................................................................................... 71
4.3 Methods ........................................................................................................................... 72
4.4 Results .............................................................................................................................. 76
4.5 Discussion ......................................................................................................................... 77
Chapter 5 – Using webservices to link electronic clinical records to pharmacovigilance databases ..................................................................................................................................................... 81
5.1 Abstract ............................................................................................................................ 84
5.2 Introduction ..................................................................................................................... 85
5.3 Methods ........................................................................................................................... 86
5.4 Results .............................................................................................................................. 88
5.5 Discussion ......................................................................................................................... 90
Chapter 6 - Decision support tool ............................................................................................... 93

4
6.1 Abstract ............................................................................................................................ 95
6.2 Introduction ..................................................................................................................... 96
6.3 Methods ........................................................................................................................... 96
6.4 Preliminary results ........................................................................................................... 97
Chapter 7 - Ongoing and future work ......................................................................................... 99
7.1 Abstract ............................................................................................................................ 99
7.2 Managing several players at several institutions dealing with the same adverse event. A pilot-study called SIRAI. ............................................................................................................. 100
7.3 Social networks and portals for patients and healthcare professionals ........................ 103
7.3.1 Creation of the personal area on the UFN website ................................................. 104
7.3.2 ADR online reporting form for consumers ............................................................... 106
7.4 App for ADR reporting .................................................................................................... 107
Chapter 8 – General discussion ................................................................................................. 109
References ................................................................................................................................. 111
Annex ........................................................................................................................................ 117

Resumo / Abstract
5
Resumo da tese
As decisões na área da segurança do medicamento são tomadas através de revisões regulares,
baseadas sobretudo na informação disponibilizada pelos sistemas de farmacovigilância que
assentam fundamentalmente na notificação espontânea de Reações Adversas a
Medicamentos (RAM). Estas notificações são feitas de forma voluntária pelos profissionais de
saúde e pelos utentes. O sistema de notificação espontânea de RAM tem a enorme mais-valia
da deteção precoce dos problemas de segurança dos medicamentos, mas sofre da grande
limitação decorrente da sub-notificação. Estima-se que apenas cerca de 10% das reações
adversas que ocorrem sejam efetivamente notificadas às Autoridades Reguladoras, nos países
desenvolvidos. Para combater este problema, os sistemas de farmacovigilância têm
desenvolvido várias estratégias, devendo os sistemas de informação ser encarados como uma
oportunidade nesta área, uma vez que constituem uma presença central no nosso quotidiano,
nomeadamente ao nível das instituições de saúde.
O objetivo desta tese é investigar estratégias para promover a notificação de RAM utilizando
os sistemas de informação para facilitar o processo. Esta investigação é constituída por seis
estudos, com os seguintes objetivos individualizados: 1) estabelecer o estado da arte sobre o
uso de sistemas de informação na notificação espontânea de RAM; 2) comparar diferentes
estratégias de promoção da notificação de RAM, determinando o seu custo/efetividade; 3)
promover a notificação espontânea de RAM entre os profissionais de saúde que exercem
atividade em hospitais, através de hyperlinks diretos para o formulário de notificação online; 4)
implementar e avaliar o consumo de um webservice por um registo clínico eletrónico
habitualmente utilizado por um grupo que participa num estudo multicêntrico na área da
gastroenterologia; 5) aperfeiçoar o processo de avaliação de causalidade das notificações de
RAM utilizando um modelo de apoio à decisão; 6) criar a área pessoal do notificador no
website da unidade de farmacovigilância, tornando a notificação de RAM uma atividade
motivadora e informativa.
Para estabelecer o estado da arte sobre o tema em estudo, foi elaborada uma revisão
sistemática (Capítulo 2) sobre a utilização dos sistemas de informação em farmacovigilância,
através das bases de dados bibliográficas das áreas científicas da saúde e das tecnologias de
informação. De um total de 3865 artigos selecionados na pesquisa inicial, 33 artigos foram
incluídos na análise, descrevendo 29 projetos diferentes. Foi efetuada uma meta-análise com 7
dos 29 projetos, para calcular a medida agregada do aumento da notificação de RAM,
Resumo / Abstract
6
obtendo-se o valor de 2.1 (significando que as intervenções duplicaram o número de RAM
notificadas).
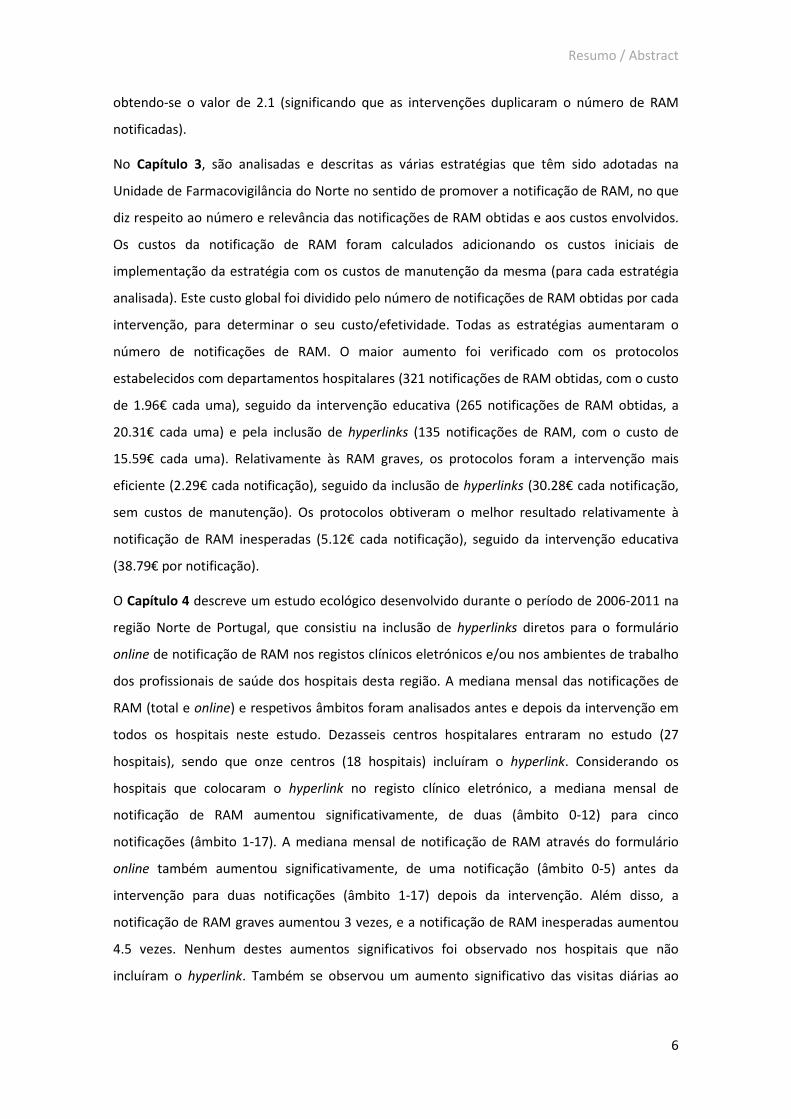
No Capítulo 3, são analisadas e descritas as várias estratégias que têm sido adotadas na
Unidade de Farmacovigilância do Norte no sentido de promover a notificação de RAM, no que
diz respeito ao número e relevância das notificações de RAM obtidas e aos custos envolvidos.
Os custos da notificação de RAM foram calculados adicionando os custos iniciais de
implementação da estratégia com os custos de manutenção da mesma (para cada estratégia
analisada). Este custo global foi dividido pelo número de notificações de RAM obtidas por cada
intervenção, para determinar o seu custo/efetividade. Todas as estratégias aumentaram o
número de notificações de RAM. O maior aumento foi verificado com os protocolos
estabelecidos com departamentos hospitalares (321 notificações de RAM obtidas, com o custo
de 1.96€ cada uma), seguido da intervenção educativa (265 notificações de RAM obtidas, a
20.31€ cada uma) e pela inclusão de hyperlinks (135 notificações de RAM, com o custo de
15.59€ cada uma). Relativamente às RAM graves, os protocolos foram a intervenção mais
eficiente (2.29€ cada notificação), seguido da inclusão de hyperlinks (30.28€ cada notificação,
sem custos de manutenção). Os protocolos obtiveram o melhor resultado relativamente à
notificação de RAM inesperadas (5.12€ cada notificação), seguido da intervenção educativa
(38.79€ por notificação).
O Capítulo 4 descreve um estudo ecológico desenvolvido durante o período de 2006-2011 na
região Norte de Portugal, que consistiu na inclusão de hyperlinks diretos para o formulário
online de notificação de RAM nos registos clínicos eletrónicos e/ou nos ambientes de trabalho
dos profissionais de saúde dos hospitais desta região. A mediana mensal das notificações de
RAM (total e online) e respetivos âmbitos foram analisados antes e depois da intervenção em
todos os hospitais neste estudo. Dezasseis centros hospitalares entraram no estudo (27
hospitais), sendo que onze centros (18 hospitais) incluíram o hyperlink. Considerando os
hospitais que colocaram o hyperlink no registo clínico eletrónico, a mediana mensal de
notificação de RAM aumentou significativamente, de duas (âmbito 0-12) para cinco
notificações (âmbito 1-17). A mediana mensal de notificação de RAM através do formulário
online também aumentou significativamente, de uma notificação (âmbito 0-5) antes da
intervenção para duas notificações (âmbito 1-17) depois da intervenção. Além disso, a
notificação de RAM graves aumentou 3 vezes, e a notificação de RAM inesperadas aumentou
4.5 vezes. Nenhum destes aumentos significativos foi observado nos hospitais que não
incluíram o hyperlink. Também se observou um aumento significativo das visitas diárias ao
Resumo / Abstract
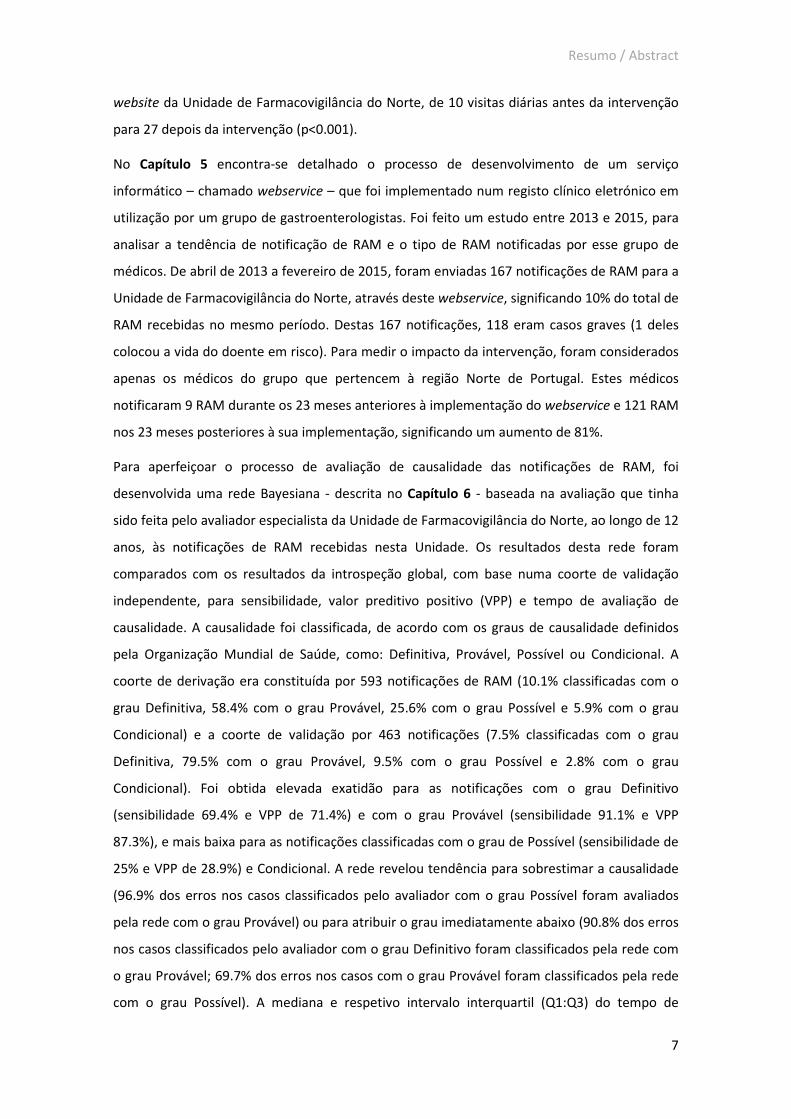
7
website da Unidade de Farmacovigilância do Norte, de 10 visitas diárias antes da intervenção
para 27 depois da intervenção (p<0.001).
No Capítulo 5 encontra-se detalhado o processo de desenvolvimento de um serviço
informático – chamado webservice – que foi implementado num registo clínico eletrónico em
utilização por um grupo de gastroenterologistas. Foi feito um estudo entre 2013 e 2015, para
analisar a tendência de notificação de RAM e o tipo de RAM notificadas por esse grupo de
médicos. De abril de 2013 a fevereiro de 2015, foram enviadas 167 notificações de RAM para a
Unidade de Farmacovigilância do Norte, através deste webservice, significando 10% do total de
RAM recebidas no mesmo período. Destas 167 notificações, 118 eram casos graves (1 deles
colocou a vida do doente em risco). Para medir o impacto da intervenção, foram considerados
apenas os médicos do grupo que pertencem à região Norte de Portugal. Estes médicos
notificaram 9 RAM durante os 23 meses anteriores à implementação do webservice e 121 RAM
nos 23 meses posteriores à sua implementação, significando um aumento de 81%.
Para aperfeiçoar o processo de avaliação de causalidade das notificações de RAM, foi
desenvolvida uma rede Bayesiana - descrita no Capítulo 6 - baseada na avaliação que tinha
sido feita pelo avaliador especialista da Unidade de Farmacovigilância do Norte, ao longo de 12
anos, às notificações de RAM recebidas nesta Unidade. Os resultados desta rede foram
comparados com os resultados da introspeção global, com base numa coorte de validação
independente, para sensibilidade, valor preditivo positivo (VPP) e tempo de avaliação de
causalidade. A causalidade foi classificada, de acordo com os graus de causalidade definidos
pela Organização Mundial de Saúde, como: Definitiva, Provável, Possível ou Condicional. A
coorte de derivação era constituída por 593 notificações de RAM (10.1% classificadas com o
grau Definitiva, 58.4% com o grau Provável, 25.6% com o grau Possível e 5.9% com o grau
Condicional) e a coorte de validação por 463 notificações (7.5% classificadas com o grau
Definitiva, 79.5% com o grau Provável, 9.5% com o grau Possível e 2.8% com o grau
Condicional). Foi obtida elevada exatidão para as notificações com o grau Definitivo
(sensibilidade 69.4% e VPP de 71.4%) e com o grau Provável (sensibilidade 91.1% e VPP
87.3%), e mais baixa para as notificações classificadas com o grau de Possível (sensibilidade de
25% e VPP de 28.9%) e Condicional. A rede revelou tendência para sobrestimar a causalidade
(96.9% dos erros nos casos classificados pelo avaliador com o grau Possível foram avaliados
pela rede com o grau Provável) ou para atribuir o grau imediatamente abaixo (90.8% dos erros
nos casos classificados pelo avaliador com o grau Definitivo foram classificados pela rede com
o grau Provável; 69.7% dos erros nos casos com o grau Provável foram classificados pela rede
com o grau Possível). A mediana e respetivo intervalo interquartil (Q1:Q3) do tempo de
Resumo / Abstract
8
avaliação de causalidade foi de 4 dias (2:8) utilizando a rede e de 8 dias (5:14) através da
introspeção global.
O Capítulo 7 (concretamente, o subcapítulo 7.3.1) descreve o trabalho que continua a ser feito
na criação da área pessoal do notificador no website da Unidade de Farmacovigilância do
Norte. Atualmente, esta área já apresenta ao utilizador as suas próprias notificações de RAM
submetidas online. Pretende-se ainda desenvolver um modelo de comunicação entre a
unidade de farmacovigilância e os seus notificadores, fornecendo informação técnica sobre a
reação adversa notificada e o medicamento suspeito. Após ter este modelo operacional,
pretendemos (como trabalho futuro) avaliá-lo através de uma série de indicadores (por
exemplo: aumento das notificações de RAM, aumento das visitas ao site, entre outros). Este
trabalho não foi ainda concluído.
Muito trabalho pode ser desenvolvido para melhorar as atividades de farmacovigilância
através dos sistemas de informação. Soluções promissoras podem passar pela integração das
bases de dados de farmacovigilância nos registos clínicos eletrónicos usados habitualmente
pelos profissionais de saúde, evitando que estes tenham trabalho adicional para submeter
uma notificação de RAM. A inclusão de hyperlinks diretos nos registos clínicos eletrónicos e/ou
nos ambientes de trabalho dos computadores dos profissionais de saúde para o formulário de
notificação online de RAM é uma forma simples e custo-efetiva de alterar o comportamento
dos profissionais de saúde relativamente à notificação de RAM e pode ser facilmente
implementado nas instituições de saúde. Os sistemas de informação podem ainda ajudar na
melhoria das atividades de rotina em farmacovigilância, melhorando a comunicação entre as
Unidades de farmacovigilância e os seus notificadores. É também possível acelerar o processo
de imputação de causalidade e subsequente feedback, utilizando métodos Bayesianos.
Resumo / Abstract
9
Thesis abstract
Decisions in the area of drug safety are made through regular reviews, based on available
information from pharmacovigilance systems, which are mostly based on Adverse Drug
Reactions (ADR) reports, voluntarily made by healthcare professionals and consumers. The
ADR reporting system has the great value of early detection of drug safety problems, but also
has a major limitation due to under-reporting. It is estimated that only about 10% of ADR that
occur are actually reported to regulatory authorities in developed countries. To counter this
problem, pharmacovigilance systems have been instituted to ensure that detected ADR are
effectively reported to the regulatory authorities. The use of information systems is currently
central in most of our lives, namely in healthcare institutions, and therefore represents an
opportunity.
The aim of this thesis is to investigate strategies to promote ADR reporting using information
systems to facilitate the process. It comprises the following six study aims: 1) to assess the
state of the art regarding the utilisation of information systems in spontaneous ADR reporting;
2) to compare different approaches promoting ADR reporting and to determine their
cost/effectiveness; 3) to promote spontaneous ADR reporting among healthcare professionals
working in hospitals using hyperlinks to ADR online reporting forms; 4) to implement and
evaluate the consumption of a webservice by the usual electronic health record used by a
gastroenterologist multicentre study group; 5) to improve the ADR report causality assessment
using a decision support tool and 6) to create a personal area in a pharmacovigilance website
for each person that submits an ADR, aiming to turn the ADR reporting act into a motivating
and informative activity.
A systematic review was performed regarding the use of information systems in
pharmacovigilance, in bibliographic databases of the scientific fields of healthcare and
information technology, as described in Chapter 2. From a total of 3865 articles, 33 articles
were included in the analysis, describing 29 different projects. We also performed a meta-
analysis on 7 of the 29 projects, to calculate the aggregated measure of increased ADR
reporting, with an overall measure of 2.1 (meaning that the interventions doubled the number
of ADR reports).
Several approaches taken by the Northern Pharmacovigilance Centre to promote ADR
reporting are analysed and described in Chapter 3, regarding the number and relevance of
ADR reports obtained and the costs involved. The costs of ADR reporting were calculated by

Resumo / Abstract
10
adding the initial costs and the running costs of each intervention. These costs were divided by
the number of ADR reports obtained with each intervention, to assess its cost/effectiveness.
All the approaches increased the number of ADR reports. The biggest increase was noted with
protocols in hospital departments (321 ADR reports obtained, costing 1.96€ each), followed by
an educational approach (265 ADR reports, 20.31€/report) and a hyperlink approach (136 ADR
reports, 15.59€/report). According to serious ADR, the protocol approach was the most
efficient, costing 2.29€/report, followed by the hyperlink approach at 30.28€/report (with no
running costs). Concerning ADR unexpectedness, the best result was found with the protocol
approach (5.12€/report), followed by the educational approach (38.79€/report).
Chapter 4 describes an ecological study performed in northern Portuguese hospitals from
2006 to 2011. We included hyperlinks to the online ADR report form either on Electronic
Patient Records or on computer desktops. The median of spontaneous ADR reports (total and
online) per month and the respective ranges were analysed before and after the intervention
in all hospitals in this study. Sixteen hospital centres were involved in the study (27 hospitals).
Eleven centres (18 hospitals) included the hyperlinks. Considering the hospitals with hyperlink
access to the Electronic Patient Records, the median ADR reports per month increased
significantly, from two (range 0-12) to five reports (range 1-17). The median of ADR reports per
month using the online form also increased significantly, from one (range 0-5) before the
intervention to two (range 1-17) after it. Moreover, serious ADR increased by 3-fold, and non-
previously described ADR increased by 4.5-fold. None of these significant increases were
observed in the hospitals where the hyperlink was not installed. We also found a significant
increase in daily UFN website visits, from 10 before the intervention to 27 after it (p < 0.001).
Chapter 5 focuses on the creation of a webservice and its implementation in an electronic
health record already in use by a group of gastroenterologists. A study was performed
between 2013 and 2015 to analyse the trends of ADR reporting and also the type of ADR
reported. From April 2013 to February 2015, 167 ADR reports were sent to the Northern
Pharmacovigilance Centre through the webservice, meaning 10% of the total of ADR reports
received in the same period. Of these 167 ADR, 118 cases were serious (one of them life-
threatening). According to the northern region of Portugal, the studied physicians reported 9
ADR during the 23 months prior to webservice implementation and 121 ADR during the 23
months after webservice implementation, i.e. an increase of 81%.
To improve the process of causality assessment, a Bayesian network was developed, as
described in Chapter 6. Network development was based on completely filled ADR reports,
evaluated by the Portuguese Northern Pharmacovigilance Centre expert over 12 years, and

Resumo / Abstract
11
compared with global introspection on an independent validation cohort for sensitivity,
positive predictive value (PPV) and time to causality assessment (TTA). Causality was classified
as Definitive, Probable, Possible or Conditional, according to the World Health Organisation
causality assessment. The derivation cohort included 593 ADR reports (10.1% Definitive, 58.4%
Probable, 25.6% Possible and 5.9% Conditional) with a validation cohort including 463 reports
(7.5%, 79.5%, 9.5% and 2.8%, respectively). High accuracy was reached for reports with
Definitive causality (69.4% sensitivity, 71.4% PPV) and Probable causality (91.1%, 87.3%), but
this was lower for reports with Possible (25%, 28.9%) and Conditional (15.4%, 50%)
classification. The network tends to overrate causality (96.9% of errors in Possible cases
classified as Probable) or give the level immediately below (90.8% of errors in Definitive cases
classified as Probable; 69.7% of errors in Probable cases classified as Possible). The median
(Q1:Q3) TTA was 4 (2:8) days using the network and 8 (5:14) days using global introspection.
The creation of a personal area within the UFN website was created and is described in
Chapter 7 (specifically, subchapter 7.3.1). We intend to design a model of communication
between the pharmacovigilance centre and its users, providing technical information about
the reported adverse reaction and the suspected drug. We expect to have the model in
operation on the UFN website and evaluate its use through a set of indicators (e.g. increase in
ADR reports, increase of website visits, etc.). This work is ongoing.
Much work can be done using information systems to improve pharmacovigilance. The
authors see this as a promising solution the integration of pharmacovigilance databases with
the habitually used electronic health records, avoiding an extra workload to submit an ADR
report. The inclusion of hyperlinks to on-line ADR reporting forms on computer desktops and
in Electronic Health Records is an easy and cost-effective way to change healthcare
professional behaviours regarding spontaneous ADR reporting and can be easily implemented
in healthcare institutions. Information systems can also improve pharmacovigilance routine
activities, improving the communication between pharmacovigilance centres and its reporters.
It is possible to accelerate the process of causality assessment and subsequent feedback using
Bayesian methods.

12
Achievements and background
13
Achievements and background
Working in pharmacovigilance for the last 12 years, it was fairly easy to choose this PhD
theme, as I have always aimed to change the paradigm of spontaneous adverse drug reaction
(ADR) reporting, from the idea of a passive and boring process to something appealing and
simple to do. Considering the increasing use of information systems (IS) among healthcare
institutions, it became clear that we could use IS to change the way people see the
pharmacovigilance system. In this process, the contribution of my supervisor, Prof. Ricardo
Correia, was crucial as he who always aroused my curiosity regarding the use of IS to promote
spontaneous ADR reporting.
The development of this PhD thesis allowed me to face some challenges related to the
differences between the structure of healthcare professionals’ knowledge and the specific
needs of electronic records. In this sense, I have participated in some discussion groups, both
national and internationally (namely the FHIR/OpenEHR[1] and HL7[2] working groups), aiming
to create a standard way in which information should be kept in the ADR registry.
In June 2014, I participated in the HL7 pharmacy group meeting, where the International
Organisation for Standardisation (ISO) draft of the international standard for ‘Requirements for
electronic prescriptions’ was discussed. This document remained under discussion for several
months.
Contributions were also made to the last OpenEHR discussion, which took place in July 2014. It
was focused on ADR definition, its characteristics and what should be kept during the
registration of a ADR. At the moment, discussion is ongoing regarding the clinical content of
the archetypal adverse reaction (FHIR/OpenEHR). Variables such as substance, status,
seriousness, reaction type and certainty are under debate.
Nationally, important input was provided by this PhD team to the review of national legislation
for the registration of allergies and adverse reactions (the Portuguese Catalogue for Allergies
and Adverse Reactions - CPARA, in Portuguese). For this purpose, we created an archetypal
Open EHR for the registry of ADR and allergies.
Another study developed during the PhD period, but not included in this thesis, was the
creation of a list of ‘alert drugs’ to help hospital pharmacies detect ADR. For this purpose, a list
of drugs was developed, adapted from Otero et al [3] and Classen et al
[4], that should alert
pharmacists to potentials ADR when the drugs are prescribed by physicians. The drugs
included were chosen because they are used as specific treatments for ADR or as antidotes.

Achievements and background
14
This list is now available on the Northern Pharmacovigilance Centre website[5] and, at the time
of its disclosure, it was widely disseminated. It includes 16 drugs and their corresponding
identifier codes to allow for easier integration on the IS used by pharmacies.
With all these small studies, together with the work developed to conclude this PhD thesis, it is
my aim to increase the ADR reporting rate and to start changing the paradigm of
pharmacovigilance in Portugal.

Chapter 1. General introduction
15
Chapter 1. General introduction
1.1 Spontaneous adverse drug reaction reporting
Most pharmacovigilance systems are based on spontaneous reporting of ADR[6]. Although
there are some criticisms about this method and its known limitations, I strongly believe that
spontaneous ADR reporting remains as an irreplaceable method of tracking a drug’s safety
profile.
Spontaneous ADR reporting has several limitations, as it suffers from incomplete data and, in
many cases, inadequate data quality. Also, it depends on the motivation of healthcare
professionals and consumers to report, which is not always easy to promote. The consequence
of this is underreporting, which is a huge problem in all developed countries. It is estimated
that only about 10% of the ADR that occurr are effectively reported to the regulatory
authorities[7]. Another problem related to spontaneous ADR reporting is the difficulty of
identification. If it is difficult to identify that an adverse event was caused by a drug, it will be
even harder to report it.
However, this method as many advantages that should be highlighted. First of all, it involves all
the drugs available to the whole population, during all the entire drug life cycle, unlike the
situation with clinical trials. Rare and chronic ADR are mainly detected after drug
commercialisation and, most of the time, through spontaneous ADR reporting.[8]
In recent years, data mining processes have been developed and tested in pharmacovigilance
activities, through the detection of associations between drugs and adverse events. Although
this could be a very efficient method to detect adverse events, we believe that important
information, spontaneously reported as an ADR, would never be equal the information
recovered from big databases. In fact, when one decides to report an ADR, the event/reaction
is usually carefully described. Besides, ADR reporting systems emphasise among healthcare
professionals and consumers the concept and the importance of drug safety surveillance.
Moreover, this method allows for describing how the adverse event affected the well-being of
the patient[9].
For all these reasons, I believe that data mining processes and computerised searches for ADR
stored in databases will never replace spontaneous ADR reporting, but will rather complement
it.

Chapter 1. General introduction
16

Chapter 1. General introduction
17
1.2 Thesis general aims
Globally, this thesis main aims are: to analyze strategies performed to increase spontaneous
ADR reporting, to create tools to facilitate ADR reporting using IT and to create tools to
improve pharmacovigilance activities. A secondary aim is to create the personal area on UFN
website.
1.3 Thesis structure
This PhD Thesis is organised into eight chapters, some of them in the form of published or
submitted scientific papers.
The two first chapters include the Introduction and the State of the Art, setting our studies
within the framework of international research. Both of these chapters were published in
scientific publications, the first published as an encyclopaedia chapter and the second as a
scientific paper.
The four subsequent chapters (3-6) describe studies performed as part of our research
programme; two of them were published in scientific journals and one as an oral
communication at a scientific international meeting.
Therefore, the document refers to some ongoing and future work, beyond the limits of the
PhD, but within the same scope. Finally, the last chapter consists of the Discussion.

18

Chapter 2. State of the Art
19
Chapter 2 – State of the art
2.1 Abstract
Many studies have been performed worldwide to improve pharmacovigilance activities, some
of them using information systems (IS). This chapter intends to frame our research within the
state of the art (subchapter 2.2), covering the introduction and background of the thesis. We
have also performed a systematic review with a meta-analysis on the use of IS to promote ADR
reporting (subchapter 2.3).
The first work presented on this section was published, in an extended version, as an
encyclopaedia chapter in the Encyclopaedia of E-Health and Telemedicine; a reprint can be
found in the Annex. The systematic review was published at BMC Medical Informatics &
Decision Making and a reprint can also be found in the Annex.

20
Chapter 2. State of the Art / Pharmacovigilance informatics
21
2.2 Pharmacovigilance Informatics
Inês Ribeiro-Vaz, Fabrício Alves, Ana Silva, Domingos Alves, Ricardo Correia
Encyclopedia of E-health and Telemedicine 2015

Chapter 2. State of the Art / Pharmacovigilance informatics
22
Chapter 2. State of the Art / Pharmacovigilance informatics
23
2.2 Pharmacovigilance Informatics

Chapter 2. State of the Art / Pharmacovigilance informatics
24
Introduction
All medicines have adverse effects, most of them unknown until the drug commercialization.
As so, it is crucial to keep strategies to monitor the drug safety. Pharmacovigilance is the
activity of drug surveillance, after its launch in the market, with the main goal of public health
protection, ensuring that the drug benefit outweighs its risks. Worldwide, pharmacovigilance
systems are mostly based on spontaneous Adverse Drug Reactions (ADR) reports made by
healthcare professionals and consumers. Spontaneous ADR reporting has been described as an
essential method to detect drug safety signals; however, underreporting is a major issue
undermining the effectiveness of spontaneous reports. Several studies suggest that less than
10% of detected ADR are effectively reported to medicines regulatory authorities [e.g. Food
and Drug Administration (FDA), European Medicines Agency (EMA), etc][7, 10].
Tools used in pharmacovigilance are continually evolving and, worldwide, Information Systems
(IS) to promote ADR reporting or to detect ADR occurred in healthcare institutions have been
tested and used, such as software that allow voluntary and automated detection of ADR, tools
that analyse clinical databases or Web sites that actively inform healthcare professionals[11].
In addition to signal detection, IS can also be used to encourage and facilitate reporting of
suspected ADR, such as the creation of on-line reporting forms, development of tools to collect
safety data from electronic health records (EHR), among others.
In this chapter, it will be described some tools to automatically detect ADR, or encourage ADR
spontaneous report.
Background
Adverse Drug Reactions (ADR) (defined as a response to a medicinal product which is noxious
and unintended [6]) are a well-recognized public health problem worldwide, and a major cause
of death and hospitalization in developed countries[12]. It is estimated that about 6,5% of the
hospitalizations are related to ADR[13]. Besides, in the USA, about 100.000 people die each year
due to ADR[12], and in Europe this annual mortality rate increases to 197.000[14]. ADR can be
expressed in many ways and with different degrees of seriousness. An anaphylactic shock
caused by penicillin is an example of a serious ADR (a serious ADR is any untoward medical
occurrence that at any dose: results in death, requires inpatient hospitalisation or prolongation
of existing hospitalisation, results in persistent or significant disability/incapacity or is life-
threatening[6]). Another type of ADR, not always recognized as such, is the drug
ineffectiveness, for example, a vaccination failure. This can be (or not) related with a product

Chapter 2. State of the Art / Pharmacovigilance informatics
25
quality issue and should be reported when detected in order to allow the regulatory
authorities to take appropriate decisions.
Rare and long term ADR are difficult to detect during the drug development stage. Only when
the drug begins to be used by a large population after marketing authorization it is possible to
detect new ADR not previously identified during clinical trials. In reality, it is known that the
safety of a new drug cannot be established until it has been on the market for several years[8].
Exceptionally, in a pandemic scenario, drug launch is urgent and, in this particular case, can be
justifiable that drug safety profile is not well established. In this scenarios, it is even more
important that all the detected ADR are reported (serious or not, expected or not). It is,
therefore, essential to keep drugs under close surveillance, after its commercialization,
through a pharmacovigilance system, to continuously evaluate their safety profile. In most of
the European countries, pharmacovigilance system is based on spontaneous ADR reports,
which is passive method, made by healthcare professionals and, since July 2012, also by
consumers [15]. These reports can be made using paper, telephone, e-mail or through an on-
line form and consist of a description of an Adverse Event (AE) apparently caused by a
medicine.
To reverse the problem of underreporting of ADR, which is felt in most developed countries,
several strategies have been tested[10, 16, 17]. Particularly, some studies were developed focused
on educational interventions to raise awareness on the importance of ADR reporting[18-20] and
showed to be very effective increasing the quantity and relevance of spontaneous ADR reports
(among health professionals). However, these studies involved a large financial and personal
outlay and the authors concluded that the effect was lost after a few months[10, 21].
In a recent American study, the authors developed a signal-detection strategy that combines
the Adverse Event Reporting System (AERS) of the regulatory Authority (FDA) and EHR, by
requiring signaling in both sources, with promising results[22]. Another study used the
unstructured clinical notes included in EHR to detect ADR through a computerized system. The
authors concluded that data mining can be used for hypothesis generation and for rapid
analysis of suspected AE risk[23].
With a similar aim, a recent study used a physician’s network, created through a mailing list, to
send regular emails to doctors, with humorous component attached with informative
component, recalling the importance of reporting their suspected ADR[24]. The results showed
that this type of intervention has impact on the number of ADR reports made by these
professionals (the study did not assess the relevance of reported ADR). In France, it is being
Chapter 2. State of the Art / Pharmacovigilance informatics
26
done a work that tries to facilitate the act to ADR reporting, habitually considered a tedious
process by health professionals. The authors are using the information contained in EHR to
make the semi-automatic filling of ADR notification forms. The objectives of this ongoing study
is to increase the rate of ADR report, as well as improving the quality of information submitted
to regulatory authorities[25].
Information Systems in Pharmacovigilance
Although some authors consider that ADR spontaneous reports suffers from latency and
inconsistency, it is still considered as the most valuable method to early detect drugs safety
problems. In fact, most of the decisions concerning to drug safety are triggered by daily ADR
spontaneous reports. As so, Regulatory Authorities consider as crucial importance to achieve
the greatest number of ADR reports possible and with high data quality.
The promotion of ADR report among healthcare professionals is a huge task, as it is necessary
to regularly recall the importance of ADR reporting and, simultaneously, develop tools to
facilitate this duty. Pharmacovigilance centres worldwide develop several strategies to
continuously promote the importance of ADR reporting, as workshops, post-graduate courses,
and also to make it easier, as development of online reporting forms, inclusion of electronic
reporting systems into the hospital Information Systems (HIS), direct hyperlinks to online
reporting forms, among others.
Along with the promotion of spontaneous ADR reporting, some systems are being tested to
detect signals of adverse reactions in large databases, as hospitals databases, epidemiologic
databases, or even among social networks.
Although the adoption of different strategies, it is consensual the need to obtain the highest
quantity and quality of information about the safety of marketed drugs, for the protection of
public health.
Another important issue in this field is the need to discuss/harmonize what should be recorded
during an ADR report.
When analyzed the databases from the FDA, EMA and the Portuguese Northern
Pharmacovigilance Centre (UFN, in portuguese), all of them with the same purpose of
recording ADR reports, it was possible to realize that the variables are different between the 3
databases, as seen in the Table 1.

Chapter 2. State of the Art / Pharmacovigilance informatics
27
Table 1. Comparison of the variables included in three pharmacovigilance databases (Food and Drug Administration: FDA; European Medicines Agency: EMA and Portuguese Northern Pharmacovigilance Centre: UFN), grouped in main entities/sections (patients, problems, products and reporters)
Section Variable FDA EMA UFN
Patient
Patient identifier � � �
Age at the time of event � � �
Date of birth � � �
Sex � � �
Weight � � �
Problem
What kind of AE, product
problem or error did you
encounter?
- Adverse event
- Product use error
- Product problem
- Problem with Different Manufacturer
of the Same Medicine
--- ---
Outcomes Attributed to AE
- Death - Life-threatening - Congenital anomaly/birth defect - Disability or permanent damage - Hospitalization - Required intervention to prevent
permanent impairment/damage - Other serious
- Fatal - Not recovered - Recovered with
sequelae - Recovering - Recovered - Unknown
- Fatal - Not recovered - Recovered with
sequelae - Recovering - Recovered - Unknown
ADR Seriousness
--- - Yes - No
- Death - Life-threatening - Congenital anomaly - Results in persistent
or significant incapacity
- Hospitalization - Other serious
Date of event � � �
Describe events, problem, or
product use error � � �
Relevant test/laboratory
data, including dates � --- ---
Product
Product name � � �
Label strength � � �
Manufacturer � � �
Date of use � � �
Reason for use � � �
Problem went away after use stopped or dose reduced?
- Yes - No - Does not apply
--- �
Problem returned after person started taking or using the product again?
- Yes - No - Does not apply
--- �
Do you still have the product in case we need to evaluate it?
- Yes - No - Returned to Manufacturer
--- ---
Reporter Reporter name � --- �
Address � � �
�or list of options: Variable exists; ---: Variable does not exist.

Chapter 2. State of the Art / Pharmacovigilance informatics
28
For example, the concept of outcome for the FDA form as a similar meaning to the concept of
seriousness for the two European databases analyzed. On the other hand, for these two
databases, outcome means the evolution of the patient regarding the adverse scenario.
Active debate is maintained about this subject, aiming to create a standard to the information
that should be kept during the ADR registry.
Promotion of Adverse Drug Reaction Reporting
Integration of pharmacovigilance system databases with other healthcare IS seems to be an
obvious way to improve the knowledge about drugs safety. In fact, healthcare providers insert
a lot of information in their EHR about ADR, which is not shared with pharmacovigilance
systems. Every approach that promotes drug safety surveillance without increasing the
workload of healthcare professionals, one of the main reasons for not reporting ADR, should
be considered.
The creation and implementation of webservices to collect this information is one of the
possible solutions for this problem. This solution is being tested in a Portuguese multi-center
research project, in the field of gastrointestinal diseases[26], with promising preliminary results
(See chapter 5). In this case, the physicians insert the usual clinic information during the
appointment with the patient, and then, they only have to authorize the transmission of
anonymized information about drug-related problems to the pharmacovigilance system. This
tool allows ADR reporting without the need to fill the ADR reporting form and with no
additional administrative work for the physician other than the normal registry of clinic patient
data.
This solution is also available to be included in commercial prescription software. For the
implementation of these webservices, it was necessary to map the form entries used by the
doctors with the online ADR reporting form developed by the pharmacovigilance system, so
that the information is correctly collected. This mapping would be easier if a standard as the
one described in the previous section was already in use.
An ADR electronic reporting system included into a IS was developed in a Spanish hospital[27],
allowing healthcare professionals (pharmacists, physician and nurses) to report suspected ADR
through their usual IS. The biggest advantage of this system is that some data (already
included in the IS) appears as default values into the form, which expedites the system and
reduces transcription errors[28]. All the reports made by this system are reviewed by a
pharmacist, which is responsible to confirm the included data and to report the case to
Chapter 2. State of the Art / Pharmacovigilance informatics
29
pharmacovigilance system. This might be a disadvantage, as some cases may be lost and not
actually sent to regulatory authorities.
Another strategy that can be easily adopted is the inclusion of hyperlinks in the EHR to the
online ADR reporting form. This solution was tested between 2006 and 2010, in an ecological
study performed in 16 Portuguese hospitals centres[16]. The hyperlinks were included in either
EHR or on computer desktops. Considering the hospitals with hyperlink included in the EHR,
the median ADR reports per month significantly increased, from two (range 0–12) to five
reports (range 1–17). The median of ADR reports per month using the online form also
increased significantly, from one (range 0–5) before the intervention to four (range 1–17) after
it. Moreover, serious ADR increased 3-fold, and non-previously described ADR increased 4.5-
fold. None of these significant increases were observed in the hospitals where the hyperlink
was not installed. It was also found a significant increase in daily pharmacovigilance centre
website visits, from ten before the intervention to 27 after it (p<0.001). The increase in ADR
reporting shows that the inclusion of hyperlinks to online ADR reporting forms is an easy way
to change health professional behavior with regard to spontaneous ADR reports. Furthermore,
this solution seems to be cost effective, when compared with other strategies to increase ADR
report, as it has no running costs (after the hyperlink implementation, there are no additional
costs to the pharmacovigilance system). (See chapter 4)

Chapter 2. State of the Art / Pharmacovigilance informatics
30
Clinical Decision Support and Alerting Systems
Informatics can be used in pharmacovigilance activities to support and alert healthcare
professionals during their daily work. With the IS extensively used in health care institutions,
all the improvements that can enhance patient safety should be taken into account. Clinical
Decision Support Systems (CDSS), providing intelligently filtered knowledge in real-time,
should be used in this area to improve public health and health care[29]. Besides, systems that
triggered alerts of possible ADR can also be integrated in the IS with the same goal.
Many systems are used and tested worldwide to alert health providers about suspected ADR,
which can help in the detection of drug safety problems. The exploitation of computer
programs used in hospitals as a support in the detection of possible ADR[3, 4] is one of these
systems. With this purpose, work has been developed in order to create lists of drugs used as
ADR signals to support the detection of ADR in hospitals. The included drugs were chosen as
they are mostly used as antidotes or therapeutic interventions for possible ADR. Furthermore,
there are also lists of diagnosis that triggers an alert for possible ADR in the computer systems.
These diagnoses indicate diseases that are mainly caused by drugs and, therefore, are signals
of possible ADR. Besides the drugs and diagnosis, also laboratory values can help in ADR
detection. In fact, some ADR are characterized by laboratory abnormalities, so the monitoring
of these values can be an improvement in the promotion of drug safety among hospitalized
patients. The main goal is to incorporate the described lists in the software used in the hospital
pharmacies in order to be triggered an ADR alert each time an alerting drug is prescribed, or
each time an alerting diagnosis is made or even each time a laboratory result reaches a
suspected toxicity value[30, 31].
It has been advocated that EHR should be provided with CDSS in order to maximize its benefits
to patient safety[29]. These CDSS are being used to inform physicians during the prescription
about identified drug-drug interactions[32], patient allergies[33] or to support the prescribing
decision[34, 35]. CDSS integrated in the computerized physician order entry (CPOE) can
effectively prevent potential harmful medication errors and ADR [36, 37].
In particular, a Dutch CDSS is being in use at the hospital pharmacy to support hospital
pharmacist to select patients at risk of ADR, and its effectiveness was evaluated[38]. For this
purpose, the system retrieves data from IS, and uses clinical rules. During the study period, the
CDSS generated 2650 safety alerts, 270 (10%) of them were considered as relevant. In these
cases, the pharmacist contacted the physician or nurse and in 204 (76%) cases this led to an
Chapter 2. State of the Art / Pharmacovigilance informatics
31
advice to prevent a possible ADR. Most alerts were generated with clinical rules linking
pharmacy and laboratory data (1685 alerts).
Pharmacovigilance should use informatics to promote and complement spontaneous ADR
reporting. Worldwide, some strategies has been performed to reach this goal, as described in
the next sub-chapter (sub-chapter 2.3).

Chapter 2. State of the Art / Systematic Review and Meta-Analysis
32

Chapter 2. State of the Art / Systematic Review and Meta-Analysis
33
2.3 How to Promote Adverse Drug Reaction Reports Using
Information Systems – a Systematic Review and Meta-Analysis
Inês Ribeiro-Vaz, Ana-Marta Silva, Cristina Costa Santos, Ricardo Cruz-Correia
BMC Medical Informatics & Decision Making. 2016

Chapter 2. State of the Art / Systematic Review and Meta-Analysis
34

Chapter 2. State of the Art / Systematic Review and Meta-Analysis
35
2.3 How to Promote Adverse Drug Reaction Reports Using
Information Systems – a Systematic Review and Meta-Analysis

Chapter 2. State of the Art / Systematic Review and Meta-Analysis
36
Abstract
Background: Adverse drug reactions (ADRs) are a well-recognized public health problem and a
major cause of death and hospitalization in developed countries. The safety of a new drug
cannot be established until it has been on the market for several years. Keeping drug reactions
under surveillance through pharmacovigilance systems is indispensable. However,
underreporting is a major issue that undermines the effectiveness of spontaneous reports. Our
work presents a systematic review on the use of information systems for the promotion of
ADR reporting. The aim of this work is to describe the state of the art information systems
used to promote adverse drug reaction reporting.
Methods: A systematic review was performed with quantitative analysis of studies describing
or evaluating the use of information systems to promote adverse drug reaction reporting.
Studies with data related to the number of ADRs reported before and after each intervention
and the follow-up period were included in the quantitative analysis.
Results: From a total of 3865 articles, 33 articles were included in the analysis; these articles
described 29 different projects. Most of the projects were on a regional scale (62%) and were
performed in a hospital context (52%). A total of 76% performed passive promotion of ADR
reporting and used web-based software (55%). A total of 72% targeted healthcare
professionals and 24% were oriented to patient ADR reporting. We performed a meta-analysis
of 7 of the 29 projects to calculate the aggregated measure of the ADR reporting increase,
which had an overall measure of 2.1 (95% IC 1.7-2.6), indicating that the interventions doubled
the number of ADRs reported.
Conclusions: We found that most of the projects performed passive promotion of ADR
reporting (i.e., facilitating the process). They were developed in hospitals and were tailored to
healthcare professionals. These interventions doubled the number of ADR reports. We believe
that it would be useful to develop systems to assist healthcare professionals with completing
ADR reporting within electronic health records because this approach seems to be an efficient
method to increase the ADR reporting rate. When this approach is not possible, it is essential
to have a tool that is easily accessible on the web to report ADRs. This tool can be promoted by
sending emails or through the inclusion of direct hyperlinks on healthcare professionals’
desktops.

Chapter 2. State of the Art / Systematic Review and Meta-Analysis
37
Background
Adverse drug reactions (ADRs) are a well-recognized public health problem worldwide and a
major cause of death and hospitalization in developed countries[12]. Rare and long-term ADRs
are difficult to detect during the drug development stage. Detecting new ADRs not previously
identified during clinical trials is only possible when the drug begins to be used by a large
population after marketing authorization (MA). The safety of a new drug cannot be established
until it has been on the market for several years [8]. As such, it is indispensable to keep drug
reactions under close surveillance after commercialization through a pharmacovigilance
system to continuously evaluate the drug’s safety profile. In most countries, the
pharmacovigilance system is based on spontaneous ADR reports made by healthcare
professionals and consumers [15]. These reports can be made using paper, telephone, e-mail or
through an on-line form and consist of a description of an adverse event apparently caused by
a medicine. Spontaneous ADR reporting has been described as an efficient method to detect
drug safety signs [39]; however, underreporting is a major issue that undermines the
effectiveness of spontaneous reports. Several studies have suggested that less than 10% of
detected ADRs are effectively reported to medicine regulatory authorities [10, 40].
Worldwide, systems using informatics to promote ADR reporting or to detect the occurrence
of ADRs in healthcare institutions have been tested and used, such as computer programs that
allow voluntary and automated detection of ADR [4, 41] informatics tools created to analyse
clinical databases [42] or websites that actively inform healthcare professionals [43].
In addition to signal detection, information and communication technologies can also be used
to encourage and facilitate reporting of suspected ADR.
In the present work, a systematic review is presented on the use of information systems in
pharmacovigilance. Our main goal is to describe the state of the art information systems for
the passive or active promotion of adverse drug reaction reporting.

Chapter 2. State of the Art / Systematic Review and Meta-Analysis
38
Methods
Eligible studies
Studies describing or evaluating the use of information systems to promote adverse drug
reaction reports were selected.
Review team
The review team is composed of two pharmacists who are experts in pharmacovigilance (Inês
Ribeiro Vaz (IV) and Ana Marta Silva (AS)) and the computer scientist Ricardo Cruz Correia (RC),
who is an expert in medical informatics.
Search methods
Studies were searched in April 2014 in the bibliographic databases. We developed a search
query that included the concepts adverse drug reaction, adverse drug reaction reporting
system, pharmacovigilance and information system. Only articles written in English,
Portuguese or French were included. We did not establish any criteria for the publication date.
Four distinct bibliographic databases were searched: Medline (via PubMed); ISI (ISI Web of
Knowledge); IEEE (IEEE Xplore) and Scopus. The query search string used in Medline® was
((ADR OR "adverse drug reaction" OR "adverse drug reactions" OR "adverse drug event" OR
"adverse drug events" OR "adverse dug effect" OR "adverse drug effects") OR
“pharmacovigilance”). A similar query was used in the other databases and was adapted to the
search engine.
Selection of studies for the review
The first selection was based on the study title and abstract (when available). Two reviewers
on the review team (IV and AS) were involved in study selection and read all titles/abstracts.
The study was considered eligible when at least one of the reviewers decided that the
title/abstract mentioned the key concept of using information systems for ADR reporting. In
cases of disagreement, a consensus meeting was held with the third reviewer (RC) to decide
whether the article should be selected.
The second phase of study selection was based on the full text. The team leader (IV) reviewed
each full-text article. In this stage, articles were excluded based on the following criteria: (1)
the articles were only focused on medication errors; (2) the articles focused on ADR detection;
(3) the articles were studies without any information system implemented; (4) the articles
were studies concerning data quality; (5) the articles were studies focused on website

Chapter 2. State of the Art / Systematic Review and Meta-Analysis
39
usability; (6) the articles were only the authors’ reflections on the theme; (7) the articles were
studies only related to incidents that occurred in health institutions; (8) the articles were
studies concerning signal detection and (9) the articles were studies concerning electronic
transmission between the authority and other institutions (pharmaceutical companies or
regional pharmacovigilance centres).
The articles remaining after this review were included in the final statistical analysis.
These articles were grouped into research projects to avoid the distortion created by multiple
papers describing the same project (Figure 1). All statistical analyses were based on the
projects and not on the articles.
Definition of variables
The variables examined in these reviews were related to the projects, papers and information
systems described in each project.
We used the following data for project identification: (1) project number; (2) Information
system name (if any); (3) country; (4) publication date; (5) type of study and (6) reference(s).
According to the description of the projects, the following variables were analysed:
1. Area covered by the project (i.e., region, country, or hospital)
2. Type of action promoted by the project (passive promotion of ADR reporting or active
promotion of ADR reporting)
3. Type of software (i.e., web-based or mobile)
4. Type of institution (i.e., regulatory authority or universities)
5. Target (healthcare professionals or patients)
6. Type of medicine (all, vaccines, chemotherapy, or others)
7. Type of ADR (all/serious ADRs based on the World Health Organization seriousness
criteria[44])
Statistical analysis
The inclusion criteria for the quantitative analysis were the availability of data related to the
number of ADRs reported before and after each intervention and a follow-up period.
Studies that only disclosed the increased ADR rate and studies that reported zero ADRs before
the project implementation were excluded because it was not possible to perform the analysis
in these cases.
Chapter 2. State of the Art / Systematic Review and Meta-Analysis
40
For each study with available data, the rate of ADRs reporting increase (quotient between ADR
reports after and ADR reports before) and the respective 95% confidence intervals were
calculated. A rate of ADR reporting increase equal to 2 indicated that the ADR reports doubled
after the intervention. Conversely, a rate of ADR reporting increase equal to 1 indicated that
the number of ADR reports after the intervention was equal to the number of ADR reports
before the intervention. The aggregated rate of the ADR reporting increase was calculated
with the inverse variance method using a random effects model and a forest plot was
presented. The confidence intervals, aggregated rate of ADRs and forest plot were performed
using a Microsoft Excel spreadsheet. The description of the Microsoft Excel spreadsheet and
the respective statistical methods used were described by Neyeloff[45].
Results
Our search method found 2519 articles in PubMed, 68 in IEEE, 2603 in ISI and 192 in Scopus.
After eliminating duplicate articles, 3835 articles were selected.
Two reviewers (IV and AS) read all 3835 titles/abstracts. In cases of disagreement, which
occurred with 151 articles, a consensus meeting was held with the third reviewer (RC) to
decide whether the article should be selected.
A total of 643 studies were excluded because they were not related to pharmacovigilance, 85
were excluded because they were not related to information systems and 2993 were excluded
for other reasons (mostly because their focus was on data mining in large databases instead of
ADR reporting).
A total of 114 of the 3835 articles were selected in this first selection based on the title and
abstract.
The team leader (IV) reviewed each of the 114 full-text articles. After this review, 33 articles
remained for the final statistical analysis. At this stage, most of the articles were excluded
because: (1) they were only related to medication errors; (2) they were focused on ADR
detection; (3) they were studies without any information system implemented; (4) they were
studies concerning data quality; (5) they were studies focused on website usability; (6) they
were only authors’ reflections on the theme; (7) they were studies only related to incidents
that occurred at health institutions; (8) they were studies concerning signal detection or (9)
they were studies concerning electronic transmission between the authority and other
institutions (pharmaceutical companies or regional pharmacovigilance centres).

Chapter 2. State of the Art / Systematic Review and Meta-Analysis
41
These 33 articles were grouped into 29 distinct research projects to avoid the distortion
created by multiple papers describing the same project (Figure 1.). All statistical analyses was
based on projects and not on articles.
Figure 1. Flowchart of study selection
Table 2 lists all 29 projects, their country, the number of publications, the publication year and
the journal. The country with the most published projects was the USA (11), followed by the
United Kingdom (3).
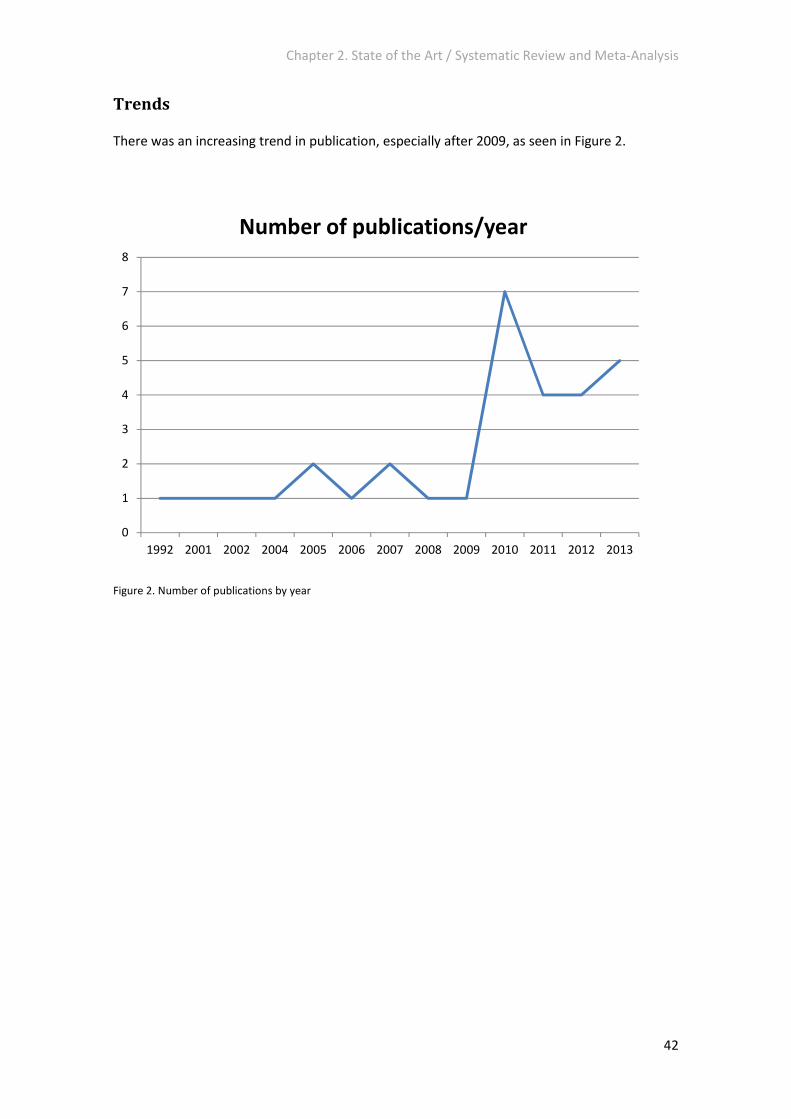
Chapter 2. State of the Art / Systematic Review and Meta-Analysis
42
Trends
There was an increasing trend in publication, especially after 2009, as seen in Figure 2.
Figure 2. Number of publications by year
0
1
2
3
4
5
6
7
8
1992 2001 2002 2004 2005 2006 2007 2008 2009 2010 2011 2012 2013
Number of publications/year

Chapter 2. State of the Art / Systematic Review and Meta-Analysis
43
Table 2. Project identification
Project number System name
(if any) Country
Number of
publications
Publication
date(s) References Journals
4 USA 1 1992 [4] Hospital pharmacy 28 France 1 2001 [46] Fundamental & Clinical Pharmacology 11 Japan 1 2002 [47] Yakugaku Zasshi-Journal of the Pharmaceutical Society of Japan 17 USA 1 2004 [48] American Journal of Health-System Pharmacy
2 USA 3 2005, 2007 [49-51] Journal of Clinical Oncology, Journal of American Medical Information Association
22 USA 2 2005, 2006 [52, 53] Biosecurity and Bioterrorism-Biodefense Strategy Practice and Science, Health Expectations
10 USA 1 2007 [54] Journal of the American Medical Informatics Association 9 MEADERS USA 2 2007, 2010 [55, 56] Annals of Family Medicine, AMIA Annual Symposium proceedings
21 Spain 1 2008 [27] Annals of Pharmacotherapy 7 Sweden 1 2009 [57] European Journal of Clinical Pharmacology
5 Canada 1 2010 [58] International Journal of Medical Informatics 13 Canada 1 2010 [59] Vaccine 18 USA 1 2010 [60] Pharmacoepidemiology and Drug Safety 19 United Kingdom 1 2010 [61] Archives of Disease in Childhood 23 ALIAS USA 1 2010 [62] Contemporary Clinical Trials 27 Taiwan 1 2010 [63] Value in Health 8 United Kingdom 1 2011 [64] Journal of Psychiatric and Mental Health Nursing
12 Serbia 1 2011 [65] Drug Safety 14 France 1 2011 [66] Therapie 15 USA 1 2011 [67] Paediatrics 6 United Kingdom 1 2012 [68] Drug Safety
16 Korea 1 2012 [69] Yonsei Medical Journal. 20 Portugal 1 2012 [16] Drug Safety
25 USA 1 2012 [70] 2012 Ninth International Conference on Information Technology: New Generations
1 Cambodge 1 2013 [71] Journal of Medical Internet Research 3 Netherlands 1 2013 [72] Studies in health technology and informatics
24 SALUS France 1 2013 [73] Studies in health technology and informatics 26 Spain 1 2013 [74] International Journal of Clinical Pharmacy 29 Denmark 1 2013 [75] European Journal of Hospital Pharmacy-Science and Practice

Chapter 2. State of the Art / Systematic Review and Meta-Analysis
44
Qualitative analysis
The qualitative variables analysed in each project are listed in Table 3 and described below.
Globally, we found that there was an increase in the publication of projects over the study
period, with 4 projects published before 2001, 4 projects between 2005 and 2007, 8 projects
between 2008 and 2010 and 13 projects between 2011 and 2013.
Geographic area covered by the projects
Most of the projects were regional (62%), followed by national projects (34%). We found only
1 international project based on Facebook®. This international project was developed in the
last time period (2011-2013).
Areas covered by the projects
Most of the projects (52%) were developed in hospitals, followed by community projects
(21%). A total of 14% covered primary care institutions and 10% (3 projects) were developed
for use in any type of healthcare institution. One project was dedicated to a multicentre
clinical trial. We also found that all of the projects oriented to the community were developed
in the last three years (2011-2013).
Types of actions promoted by the projects
The majority of the projects passively promoted ADR reporting (76%); the remainder actively
promoted reporting (24%).
Types of software
More than half of the projects (55%) used web-based technology and 41% used electronic
health records. Only one project used mobile phone technology. There was an increasing trend
in software using web-based technology over all of the time intervals considered. The mobile
technology appeared during the last time period.
Types of institutions promoting the studies
Most of the projects were promoted by hospitals and universities (31% ex aequo). There were
4 projects developed by national institutions (not regulatory) and 5 projects implemented by
regulatory authorities.

Chapter 2. State of the Art / Systematic Review and Meta-Analysis
45
Targets
A total of 72% of the projects were geared to healthcare professionals, 24% to patients and
one project was geared to both targets. Most of the projects targeting patient ADR reporting
were developed in the last years considered (2011-2013).
Types of medicine
Most of the projects (72%) covered all medicines, but 17% were specific to vaccines. There
were also projects specific to reporting ADRs due to chemotherapy, human albumin and
radiopaque agents (1 project for each of these medicines).
Types of ADR
Only a small percentage of the projects were specific for serious adverse drug reactions. The
majority (93%) covered all ADR.

Chapter 2. State of the Art / Systematic Review and Meta-Analysis
46
Table 3. Qualitative analysis of the projects
Variable Time period Total
(%) Project numbers <2004
4 projects
2005-2007
4 projects
2008-2010
8 projects
2011-2013
13 projects
Geographic area covered by the project
Regional 4 3 5 6 18 (62) 2, 4, 5, 7, 8, 10, 11, 13, 14, 16, 17, 20, 21, 22, 26, 27, 28, 29
National 0 1 3 6 10 (34) 1, 3, 6, 9, 15, 18, 19, 23, 24, 25 International 0 0 0 1 1 (3) 12
Area covered by the project
Hospital 4 2 5 4 15 (52) 2, 4, 5, 8, 11, 13, 17, 18, 20, 21, 22, 26, 27, 28, 29
Community 0 0 0 6 6 (21) 1, 3, 12, 14, 15, 16 Primary care 0 2 1 1 4 (14) 6, 7, 9, 10 Other healthcare institutions (different
from hospitals or primary care) 0 0 1 2
3 (10) 19, 24, 25
Clinical trials 0 0 1 0 1 (3) 23
Type of action promoted by the project
Passive promotion of ADR reporting 3 3 6 10 22 (76) 4, 5, 6, 8, 9, 10, 11, 14, 15, 16, 17, 18, 19, 20, 21, 22, 23, 24, 25, 26, 27, 29
Active promotion of ADR reporting 1 1 2 3 7 (24) 1, 2, 3, 7, 12, 13, 28
Type of software
Web-based 1 3 6 6 16 (55) 2, 3, 5, 7, 9, 12, 13, 14, 15, 16, 19, 20, 22, 23, 27, 28
System inside the Electronic Health Record
3 1 2 6 12 (41) 4, 6, 8, 10, 11, 17, 21, 24, 25, 26, 18, 29
Mobile 0 0 0 1 1 (3) 1
Type of institution promoting the study Hospital 2 1 3 3 9 (31) 2, 4, 8, 17, 18, 21, 26, 27, 29 University 1 1 3 4 9 (31) 5, 10, 11, 12, 13, 19, 20, 24, 25 National institution 0 2 0 2 4 (14) 1, 9, 15, 22 Regulatory authority 1 0 1 3 5 (17) 6, 7, 14, 16, 28 Other* 0 0 1 1 2 (7) 3, 23
Target
Healthcare professionals 4 2 7 8 21 (72) 4, 6, 7, 8, 9, 10, 11, 13, 14, 16, 17, 18, 19, 21, 23, 24, 25, 26, 27, 28, 29.
Patients 0 2 1 4 7 (24) 1, 2, 3, 5, 12, 20, 22 Healthcare professionals and patients 0 0 0 1 1 (3) 15
Type of medicine
All 4 1 5 11 21 (72) 3, 4, 5, 6, 7, 8, 9, 11, 12, 14, 16, 17, 18, 19, 20, 21, 24, 25, 26, 28, 29
Vaccines 0 2 1 2 5 (17) 1, 10, 13, 15, 22 Chemotherapy 0 1 0 0 1 (3) 2 Human albumin 0 0 1 0 1 (3) 23 Radiopaque agents 0 0 1 0 1 (3) 27
Type of ADR
All 4 4 8 11 27 (93) 2, 4, 5, 6, 7, 8, 9, 10, 11, 12, 13, 14, 15, 16, 17, 18, 19, 20, 21, 22, 23, 24, 25, 26, 27, 28, 29
Serious 0 0 0 2 2 (7) 1, 3 *Other institutions are: Clinical trial team (project 23) and website producer (project 3)

Chapter 2. State of the Art / Systematic Review and Meta-Analysis
47
Quantitative analysis
From the 29 projects analysed, seven projects met the criteria for inclusion in the quantitative
analysis (meta-analysis). The criteria used were the availability of data related to the number
of ADR reported before and after each intervention and a follow-up period.
From the seven projects included in the quantitative analysis, six had the same follow-up
period (12 months) and only one (project 14) differed on this item (18 months of follow-up).
The results are described in Table 4.
Table 4. Effect of Intervention on increased ADR reporting
Study ADR reports before ADR reports after Rate CI lower CI upper
Project 14 287 415 1,44 -0,18 3,07
Project 7 89 111 1,25 -0,51 3,00
Project 29 30 162 5,4 4,56 6,24
Project 6 3279 4716 1,44 -0,20 3,072
Project 17 118 294 2,49 1,25 3,73
Project 27 20 62 3,1 1,99 4,21
Project 20 82 212 2,58 1,37 3,80

Chapter 2. State of the Art / Systematic Review and Meta-Analysis
48
We performed a meta-analysis with these seven projects to calculate the aggregated measure
of the ADR reporting increase. The overall measure was 2.1 (95% IC 1.7-2.6), which indicated
that the interventions performed in the analysed projects doubled the number of ADR reports
(Figure 3).
Figure 3. Rate (ADR reports after/ADR reports before) of ADR report increase (95% IC)
Projects 14, 7 and 6, which had similar ADR reporting increases, used different approaches.
The authors of project 14 assessed an online ADR reporting form, in project 7 the authors send
repeated e-mails with ADR information to healthcare professionals and project 6 evaluated the
inclusion of a reporting system inside the clinical information system.
Four of the information systems that contributed to the improvement of ADR reporting used
web-based technology. Two used an online reporting form (Project 14 [66] and Project 27 [63]) to
facilitate ADR reporting. A Swedish group opted to evaluate the effect of repeated emails to
health care professionals that contained attached ADR information (Project 7 [57]). A
Portuguese study tested the inclusion of hyperlinks to the online ADR reporting form on
hospitals’ electronic patient records (Project 20 [16]) to facilitate access to the ADR form.
-1 0 1 2 3 4 5 6 7ADR reports decreases ADR reports increases
Project 14
Project 7
Project 20
Project 27
Project 17
Project 6
Project 29
Overall

Chapter 2. State of the Art / Systematic Review and Meta-Analysis
49
Three projects explored the use of electronic health records to directly report the ADRs
(projects 29, 6 and 17). Among these, project 29 [75], which had the best result in terms of the
ADR reporting increase, was a system that completed the ADR report whenever a physician
required assistance.

Chapter 2. State of the Art / Systematic Review and Meta-Analysis
50
Discussion
Although a limited number of projects was included in our work (n=29), our data suggest that
the number of projects that aimed to promote ADR reporting using information technologies
increased over time.
Study selection was performed as a manual review; this approach caused a huge workload
because we obtained more than 3000 articles. An optimized query would reduce the workload
but lose sensitivity.
As expected, most of the projects that aimed to promote adverse drug reactions reporting
were developed in hospitals and tailored to healthcare professionals. In fact, most of the
serious ADRs were detected in hospitals and reported by healthcare professionals[72]. For
example, in Europe direct reporting (ADRs reported by patients) has only been allowed for
every country since 2012[76]. This finding may also explain why most of the projects that
targeted direct ADR reporting were developed in the last three years of the study period
(2011-2013)[65, 67, 71, 72].
Most of the authors chose to develop systems for the passive promotion of ADR reporting
because busy healthcare professionals only submit their suspected ADR if it does not increase
their workload[55, 77]. Active promotion of ADR reporting is difficult and not always ethically
acceptable because no material reward can be given to the reporters. Thus, projects that
aimed to actively promote ADR reporting involved teaching sessions[50] or e-mails containing
ADR information[46, 57, 59, 72].
Our results suggested that there was an increasing trend in the use of web-based software to
promote ADR reporting, which could be explained by the dissemination of internet use.
Nevertheless, mobile technology was also appearing.
Most of the retrieved projects covered all medicines and ADR, whereas only a few were
specific. However, we found 5 projects dedicated to vaccine adverse reactions[52, 54, 59, 67, 71] and
in the last three years two projects were developed to specifically report serious ADR[71, 72].
The institutions that primarily promoted this work were universities and hospitals because
universities have the know-how to perform these actions and hospitals have specific needs to
be solved. However, regulatory authorities have been increasing their involvement in the
development of this type of project.
A limitation of this study is that a grey literature search was not performed. However, we think
that this lack does not cause a large bias because regulatory authorities are less likely to

Chapter 2. State of the Art / Systematic Review and Meta-Analysis
51
produce this type of project. When regulatory authorities are involved in projects of this scope,
they usually associate with universities and hospitals that have a greater incentive to publish.
Based on our quantitative analysis, we can conclude that all of the projects analysed increased
the ADR reporting numbers (most by approximately two-fold). We found two projects that
increased ADR reporting by more than two-fold [63, 75], perhaps because their basal values were
much lower compared with the other five projects. A similar effect was noted previously in
two other studies when the same population of health care professionals was exposed to the
same educational interventions two different times [18, 20]. After the first intervention, the
authors achieved a much higher effect and ADR reporting increased compared to the second
intervention due to the differences in the initial values.
In our quantitative analysis, we found a limitation concerning the aggregation of the
information because we found only 7 studies that provided data concerning its impact on the
increase in ADR reporting. These data were not available for the other studies even after we
contacted the authors. However, we did not identify any variable that could distinguish these 7
projects from the other 22 projects. We must reiterate the importance of providing
quantitative data when publishing studies focused on interventions that aim to promote ADR
reporting.
Worldwide underreporting of ADR is a major concern, and many institutions are aware that it
is feasible to use information systems to improve ADR reporting. The most commonly used
platform is web-based and exhibits an increasing trend, but interventions inside electronic
health records also have the potential to improve pharmacovigilance activities and particularly
ADR reporting. Direct ADR reporting is being increasingly taken into account when the aim is to
improve information on drug safety.
Based on our results, we believe that it would be useful to adopt a system to assist healthcare
professionals with completing ADR reporting within electronic health records because this
approach seems to be an efficient method to increase the ADR reporting rate. When this
approach is not possible, it is essential to have a tool that is easily accessible on the web to
report ADR. This tool can be promoted by sending emails or through the inclusion of direct
hyperlinks on healthcare professionals’ desktops.
Chapter 2. State of the Art / Systematic Review and Meta-Analysis
52
Conclusions
Our systematic review allowed us to note some facts about interventions that aim to improve
ADR reporting using information systems. According to our aggregation analysis, these
interventions doubled the number of ADR reports. We also found that most projects passively
promoted ADR reporting (facilitating the reporting process) and the countries involved in this
type of project were Northern America countries (USA and Canada), European countries and in
a smaller number Far East countries.
Authors’ contributions
Inês Vaz and Ricardo Correia were responsible for the development of the query.
Inês Vaz also performed data collection and was the team leader for article screening and the
writing of the manuscript.
Ana Silva performed the article screening.
Ricardo Correia was involved on the article selection when there was disagreement between
the other two reviewers (Inês Vaz and Ana Silva).
Cristina Santos performed the quantitative analysis.
All four authors were involved in the writing of the manuscript, discussion and the revision of
the whole article.
Acknowledgements
The authors would like to thank Daniel Pereira for the development of the informatics tool
used for the abstract/title screening.
Competing interests: The authors declare that they have no competing interests.

Chapter 3. Promoting ADR reports: Comparison of different approaches
53
Chapter 3 - Promoting ADR reports: Comparison of
different approaches
Inês Ribeiro-Vaz, Cristina Costa Santos, Ricardo Cruz-Correia
Rev Saude Publica. 2016

Chapter 3. Promoting ADR reports: Comparison of different approaches
54
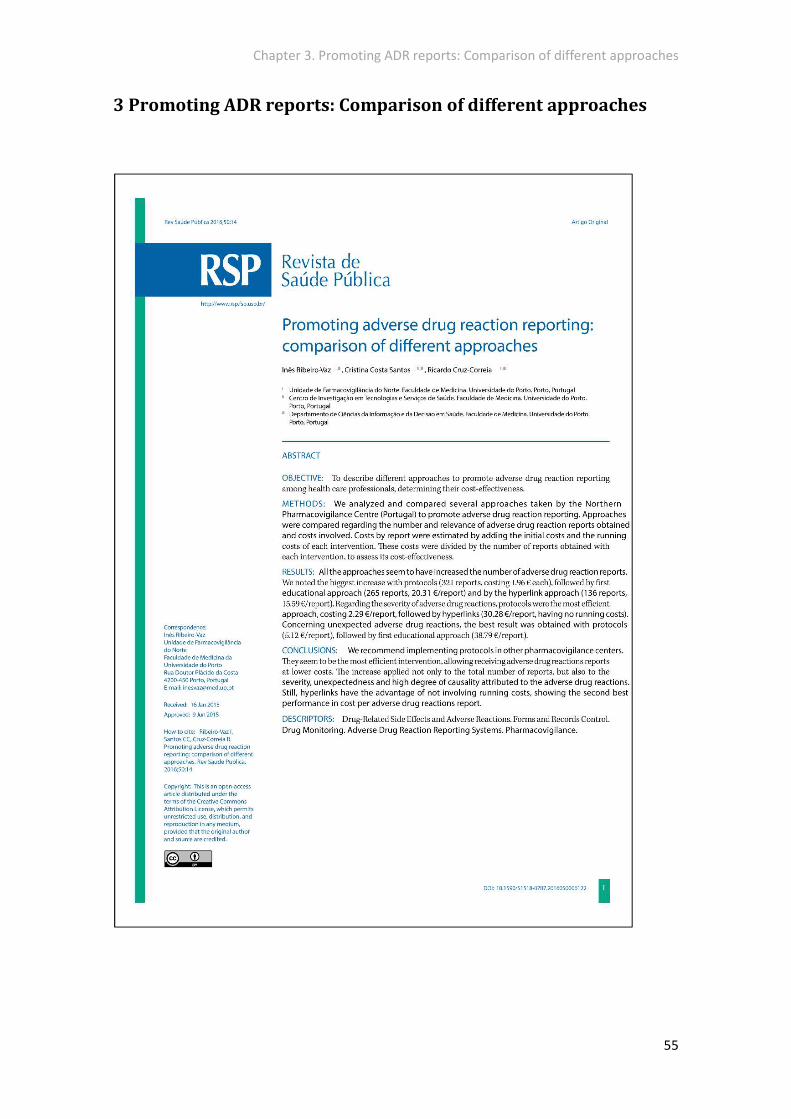
Chapter 3. Promoting ADR reports: Comparison of different approaches
55
3 Promoting ADR reports: Comparison of different approaches

Chapter 3. Promoting ADR reports: Comparison of different approaches
56
3.1 Abstract
Objective: To describe different approaches to promote adverse drug reaction reporting
among health care professionals, determining their cost/effectiveness.
Methods: We analyzed and compared several approaches taken by the Northern
Pharmacovigilance Centre (Portugal) to promote adverse drug reaction reporting. Approaches
were compared regarding the number and relevance of adverse drug reaction reports
obtained and costs involved. Costs by report were estimated by adding the initial costs and the
running costs of each intervention. These costs were divided by the number of reports
obtained with each intervention, to assess its cost-effectiveness.
Results: All the approaches seem to have increased the number of adverse drug reaction
reports. We noted the biggest increase with protocols (321 reports, costing 1.96 € each),
followed by first educational approach (265 reports, 20.31 €/report) and by the hyperlink
approach (136 reports, 15.59 €/report). Regarding the severity of adverse drug reactions,
protocols were the most efficient approach, costing 2.29 €/report, followed by hyperlinks
(30.28 €/report, having no running costs). Concerning unexpected adverse drug reactions, the
best result was obtained with protocols (5.12 €/report), followed by first educational approach
(38.79 €/report).
Conclusions: We recommend implementing protocols in other pharmacovigilance centers.
They seem to be the most efficient intervention, allowing receiving adverse drug reactions
reports at lower costs. The increase applied not only to the total number of reports, but also to
the severity, unexpectedness and high degree of causality attributed to the adverse drug
reactions. Still, hyperlinks have the advantage of not involving running costs, showing the
second best performance in cost per adverse drug reactions report.

Chapter 3. Promoting ADR reports: Comparison of different approaches
57
3.2 Introduction
Adverse drug reactions (ADR) are inherent to medicines use [78], and most of them can only be
detected after the commercialization of the drug [8]. In fact, during clinical trials, rare reactions
are hardly detected, as well as the ones associated with chronic utilization of the drug. It is also
difficult to predict the drug effect among special populations (pregnant, children, elderly), as
they usually are not part of the clinical research.
Because of these limitations, post-marketing surveillance is essential, which is why most
countries have pharmacovigilance centres for monitoring of detected ADR. The fundamental
tool used by these centres is the spontaneous report of ADR, made by healthcare professionals
and consumers. This method consists in describing an adverse episode suspected to be caused
by one or more drugs, and provides valuable information to the regulatory health authorities,
which is important for the decisions about marketed medicines. The biggest problem of this
method is the underreporting, ie, ADR are detected but not reported to national regulatory
health authorities. Most developed countries suffers from this problem [10, 40], and Portugal is
not an exception [19]. Worldwide, many approaches have been completed to combat the major
problem of ADR underreporting, such as regular visits to health professionals [79], questionnaire
studies [80], educative interventions (including workshops, meetings and presentations) [19, 81, 82],
among others.
This study aims to describe several approaches that intended to improve ADR reporting and
determine the cost-effectiveness of each one of them.
Chapter 3. Promoting ADR reports: Comparison of different approaches
58
3.3 Methods
From its creation (in 2000) to 2003, Northern Pharmacovigilance Centre, a Portuguese regional
pharmacovigilance centre, had an extremely low rate of ADR reports, about 43 ADR reports
per year/1 million of inhabitants. We realize this value is very low, when compared with the
World Health Organization (WHO) recommendation for an Optimal National Centre which is,
at least, 200 reports per year/1 million of inhabitants1.
To reach its objectives, in 2004, the Centre established a collaboration protocol (protocol
approach) with the Immunoallergology Department of a Central Hospital (located on the same
street as the Centre), in order to collect every suspected case of ADR emerged in appointments
related to drug allergies. This collaboration includes regular visits of the pharmacovigilance
staff to the Immunoallergology department, to collect the detected cases in ADR report forms,
under the physician supervision. Then, the form is signed by the physician and it follows the
normal course of all the ADR spontaneous reports. This approach was replicated two more
times, in 2007 and 2009, in two other immunoalergology departments, one from a specialized
hospital (pediatric hospital, located at 6 km from the Centre), and another from a central
hospital (located 11 km from the Centre). These three protocols remain active.
A study conducted in 2004 provided educational interventions (educational approach) for
physicians and pharmacists [19, 20]. Those interventions were based on a previous case-control
study that identified the reasons for underreporting [83, 84]. The educational approach includes
workshops about pharmacovigilance at health care professionals’ working places.
Since the effect of educational interventions decreased over time, the authors of the
previously described work promote reinforcement interventions (educational and telephone
approach). We started a new study in 2007, also among physicians and pharmacists. This study
consisted not only in outreach interventions (workshops), but also in telephone interviews [17,
18]. The phone interviews followed a script about ADR and the importance of reporting. Details
are described in a previous publication [18].
Meanwhile, we propose a new approach: the inclusion of a hyperlink (hyperlink approach) to
an online ADR reporting form on hospitals' electronic patient records (EPRs). The main aim of
this study, performed from 2006 to 2010 was to evaluate the impact of these hyperlinks on the
number of spontaneous ADR reports[16]. The inclusion of hyperlinks began in December 2007
and continued over the following five months.
1 Farmacovigilância em Portugal. Lisboa: INFARMED - Autoridade Nacional do Medicamento e Produtos de
Saúde, I.P.; 2004.

Chapter 3. Promoting ADR reports: Comparison of different approaches
59
The temporal distribution of all these approaches is shown in Figure 4
Figure 4. Timeline of the studied approaches
In the present work, we analyzed the number of ADR reports obtained with each one of the
described approaches. We know exactly which ADR reports were originated at the three
departments participating in the protocol intervention and analyzed them separately. Four
physicians were involved.
The first educational intervention (in 2004) involved three hospitals, 26 healthcare centres and
73 pharmacies. About 900 healthcare professionals attended these interventions [19]. About
340 healthcare professionals (physicians and pharmacists) attended the second intervention
(second workshop + telephone, both in 2007). Five healthcare centres, two hospitals and 40
pharmacies received the telephone intervention, and 16 healthcare centres, 2 hospitals and 23
pharmacies were intervened with the 2nd educational intervention.
For the hyperlinks, we estimated 15,000 health care professionals potentially affected by the
intervention, as this is the total number of professionals working at the 12 participating
hospital centers (corresponding to 22 hospitals). It was the first exposure to any intervention
for eight of these hospital centers.
The variables analyzed were: type of approach, ADR relevance, initial costs of the
interventions, running costs of the interventions, and costs per ADR report. Each of these
variables is described as follows.
Type of approach: hyperlink approach, protocol approach, educational and telephone
approach.
Number of ADR reports obtained with each intervention: the difference between ADR reports
received two years after the intervention and ADR reports received two years before the
intervention.

Chapter 3. Promoting ADR reports: Comparison of different approaches
60
ADR relevance: we adopted the following criteria: (1) ADR seriousness; (2) ADR expectedness;
and (3) causality attributed to the ADR report. A serious ADR is any untoward medical
occurrence that results in death, requires inpatient hospitalization or prolongation of existing
hospitalization, results in persistent, or significant disability or incapacity, or is life-
threatening2. An unexpected ADR is the one which the nature or severity is not consistent with
domestic labeling or market authorization, or expected from characteristics of the drug2.
According to the causality attributed we considered that an ADR was more relevant if it was
evaluated with one of the 2 higher degrees of causality: Definitive/certain or probable (the
evaluation of the likelihood that a medicine was the causative agent of an observed adverse
reaction)2.
Interventions initial costs: We consider as initial costs the expenses needed for the
establishment of the approach, as educational material and staff working hours. These costs
are described in Table 5.
Table 5. Estimated values of each approach
Approach
Initial costs Annual running costs
Value Description Value Description
protocol approach 150€ pharmacovigilance and
clinical services staff
working hours
240€ fuel, material and
pharmacovigilance and
clinical staff working
hours
hyperlink approach 2120€ pharmacovigilance and
software development
staff working hours
--- ---
educational approach 200€ educational material and
pharmacovigilance staff
working hours
2500€ fuel, material and
pharmacovigilance staff
working hours
telephone approach 400€ telephone calls during the
pilot-study and
pharmacovigilance staff
working hours
800€ telephone calls,
material and
pharmacovigilance staff
working hours
Interventions running costs: Annual running costs are the expenses needed for the
continuation of the projects, as fuel, material and staff working hours. These costs are
described in table 1. In our study, we did not consider the normal (daily) costs of ADR reports
processing, as we only meant to compare the costs involved to obtain ADR reports.
2World Health Organization. The Uppsala Monitoring Centre Uppsala WHO Collaborating Centre for
International Drug Monitoring [09 Aug 2013]; Available from: http://www.who-
umc.org/DynPage.aspx?id=22682.
Chapter 3. Promoting ADR reports: Comparison of different approaches
61
Costs per ADR report: Costs for ADR report were calculated adding initial costs and running
costs. Initial cost per ADR report were obtained by dividing initial costs by the difference
between the ADR reports received two years after the intervention and ADR reports received
two years before the intervention (which we consider to have been the number of reports
earned with each intervention). Running costs were obtained by dividing the running costs of
the two-year intervention by the number of notifications earned with each intervention. To
assess the cost/effectiveness of each intervention, we considered these added costs (initial +
running costs), as this total means the total cost of each ADR obtained in two years following
each intervention.
The pharmacovigilance center website uses a web server and has audit trails that read each
site visit since 2006. These audit trails are processed using the Webalizer program
(www.webalizer.org) to estimate site hits, user logins and visits. ADR reports obtained by these
approaches are included in a database. We collect them by selecting the report date and
origin.
We presented the total number of reports received in each quarter during the period studied.
For each health institution, ADR reports made before and after the intervention, if any, were
measured.
To examine whether each intervention increased the ADR report trend, an interrupted time
series analysis using autoregressive integrated moving average (ARIMA) was performed using
quarter data of ADR reports, as well as each intervention (first and second educational
approach, telephone approach, and hyperlink approach) as dichotomous variables (before and
after intervention).
We performed an additional analysis with the hyperlinks approach, to consider the institutions
exposed to any type of intervention for the first time. With this sub-analysis we intended to
isolate the ADR reports obtained with each intervention.
This study was approved by the local Ethics Committee of the Faculdade de Medicina of the
Universidade do Porto (Process PCEDCSS-FMUP 08/2014, approved in May 7, 2014).

Chapter 3. Promoting ADR reports: Comparison of different approaches
62
3.4 Results
We found an increasing trend in the number of ADR reports received by the Northern
Pharmacovigilance Centre (UFN) during the studied period: 2000-2012. The number of annual
ADR reports increased from the year in which the first interventions were made (2004) to the
end of the study period (Figure 5).
Figure 5. Total number of ADR reports received in the Northern Pharmacovigilance Centre during the studied period, per trimester (in green, those obtained with protocols)
Excluding the ADR reports obtained with the protocols approaches, the only intervention that
significantly increased the ADR report trend was the first educational approach, in the first
quarter of 2004 (p<0.001).
We did not found a significantly increase in the ADR report trend in the second educational
approach in second quarter of 2007 (p=0.203). The telephone approach also failed to
significantly increase ADR reporting in third quarter of 2007 (p=0.243). With the hyperlink
approach we observed a slight increase in the ADR reporting, although without statistical
significance (p=0.193).
Educational EducationalProtocol Protocol Protocol
TelephoneHyperlink
0
50
100
150
200
250
300
350
400
Feb2001
Dec2001
Oct2002
Aug2003
Jun2004
Apr2005
Feb2006
Dec2006
Oct2007
Aug2008
Jun2009
Apr2010
Feb2011
Dec2011
Oct2012

Chapter 3. Promoting ADR reports: Comparison of different approaches
63
All the approaches increased the number of ADR reports, when we compare the two years
before with the two years after the interventions. We noted the biggest increase with the
protocol approach (321 ADR reports obtained), followed by the first educational approach,
with 265 ADR reports obtained, and by the hyperlink approach, with 136 ADR reports. For the
hyperlink approach, we isolated the institutions exposed to an intervention for the first time;
these cases obtained 141 ADR reports.
According to the initial costs involved, our results suggest that the protocol approach is the
most cost-effective, costing 0.47€ per ADR report, followed by the first educational approach
costing 0.78€ per ADR report. Analyzing running costs, the hyperlinks approach is the most
favorable, having none. On the other hand, we can conclude that the second educational
approach is the intervention that entails more costs, with 123.81€ per report (Table 6.)
Table 6. Number and costs of ADRreports obtained with each intervention
Approach Intervention ADR Costs (€) per report
Before After 2 years 1 year 1 year 2 years Initial costs Running costs
(2 years) Total
Protocols 0 0 204 117 0.47 1.49 1.96 Hyperlinks 153 120 277 132 15.59 0.00 15.59
Hyperlinks NPE* 68 47 146 110 15.03 0.00 15.03
Educational 1st workshop 36 24 257 68 0.78 19.53 20.31 Pharmacies 2 8 110 25 1.60 40.00 41.60
Healthcare centres 25 7 102 17 2.29 57.47 59.77
Hospitals 9 9 45 26 3.77 94.34 98.11
Phone Interview 47 26 87 34 8.33 33.33 41.67 Pharmacies 23 10 37 14 22.22 88.88 111.11
Healthcare centres 3 1 8 2 66.67 266.67 333.33
Hospitals 21 15 42 18 16.67 66.67 83.33
Educational 2nd workshop 54 40 106 30 4.76 119.05 123.81 Pharmacies 39 25 69 18 8.70 217.39 226.09
Healthcare centres 10 13 26 6 22.22 555.55 577.78
Hospitals 5 2 11 6 20.00 500.00 520.00
* NPE: Not Previously Exposed. Considering only the institutions without any previous intervention

Chapter 3. Promoting ADR reports: Comparison of different approaches
64
Regarding the relevance of ADR reports, we analyzed the seriousness, expectedness and
degree of causality attributed to the ADR report. Regarding serious ADR, the protocol
approach was the most cost-effective, costing 2.29€ per report. The hyperlink approach
obtained the second lowest value (30.28€ per report), having no running costs cost. We found
similar results for the relevance criterion of causality assessment. Concerning ADR
expectedness, the best result belonged to the protocol approach (5.12 € per report), followed
by the first educational approach (38.79€ per report). (Table 7)
Table 7. Number and costs of serious, ADR classified with a high degree of causality and unexpected ADR reports obtained with each intervention
Approach Intervention ADR Costs (€) per report
Before After 2 years 1 year 1 year 2 years Initial costs Running costs
(2 years) Total
Serious
Protocols 0 0 180 94 0.54 1.75 2.29 Hyperlinks 113 96 193 86 30.28 0.00 30.28 Educational 1st workshop 12 15 111 42 1.59 32.68 34.27 Phone Interview 29 19 55 21 14.29 57.14 71.43 Educational 2nd workshop 37 23 44 8 --- --- --- High degree of causality
Protocols 0 0 165 66 0.65 2.08 2.73 Hyperlinks 114 86 232 109 15.03 0.00 15.03 Educational 1st workshop 14 17 169 47 1.08 27.03 28.11 Phone Interview 40 17 65 26 11.76 47.06 58.82 Educational 2nd workshop 37 27 74 22 6.25 156.25 162.5 Unexpected
Protocols 0 0 70 53 1.22 3.90 5.12 Hyperlinks 63 40 69 37 706.67 0.00 706.67 Educational 1st workshop 10 7 111 40 1.49 37.30 38.79 Phone Interview 17 11 22 7 400.00 1600.00 2000.00 Educational 2nd workshop 24 17 28 6 --- --- ---
Chapter 3. Promoting ADR reports: Comparison of different approaches
65
3.5 Discussion
Although there is some overlap of interventions, making it difficult sometimes to differentiate
the gains from each one of them, our results show that, in general, all interventions increased
the number of ADR reports when comparing two years before with two years after.
Protocols in hospital immunoallergology departments seem to be the most efficient
intervention. In fact, this intervention is the one that allows obtaining ADR reports with lower
costs involved, with an increase not only in the total number of ADR reports, but also in the
severity, unexpectedness, and high degree of causality attributed to the ADR.
Nevertheless, these protocols have the disadvantage of increasing the reports of ADR in
patients of a specific population (patients with allergies), which can bias the global
pharmacovigilance data. We started to establish these protocols at the request of one of the
immunoallergology department, but we are trying to establish similar protocols in other
departments (as oncology departments, hospital pharmacies, among others), to solve the bias
issue.
On the other hand, hyperlinks approach has the great advantage of not involving running
costs, and seems to have the second best performance in costs per ADR report. Even when we
consider only the hospitals exposed to an intervention for the first time (to avoid the overlap
effect), this behavior remains.
We also conclude that the first educational intervention was much more efficient than the
second one. In fact, the second intervention seemed to be counterproductive, as shown by the
results of serious and unexpected ADR reports (these numbers decreased after the
intervention). We already had this conviction since this intervention was performed. In fact, in
most health care institutions where the second intervention took place, we found
professionals less receptive than in the first intervention, as they already knew the subject and
did not seem to believe they needed another workshop about it.
Unfortunately, we are not able to compare our results with other authors’ results, as we failed
to find any study addressing the issue of ADR report costs. Many studies proposed strategies
to improve ADR reports [57, 66, 75] and some authors have already studied the costs of an ADR[85,
86]. However, no one had studied the costs involved in obtaining ADR reports before, which is
the novelty of our work.
Although there might be some overlap and eventual contamination among the interventions,
we believe that this did not introduce an important bias in our conclusions. First, we knew
Chapter 3. Promoting ADR reports: Comparison of different approaches
66
exactly which reports were originated at the departments participating in the protocols.
Moreover, we included in our results the ADR reports obtained after the hyperlink inclusion in
the hospitals that had an intervention for the first time. Thus, we could infer that the gain in
ADR reports after hyperlink inclusion was caused by this intervention. Furthermore, there is no
problem of overlapping for the first educational approach (workshops in 2004) because this
was the first intervention made. The only interventions for which we cannot resolve the
overlapping limitation is the second educational intervention and the phone intervention.
However, these two interventions were planned as complementary to the first one.
We believe that our work can help pharmacovigilance centers worldwide choose the best set
of interventions to promote adverse drug reactions report. This choice must be based on the
particular characteristics of each center, such as available staff and budget, geographic
location, proximity to hospitals, among others.
Based on our results, we recommend the implementation of protocols with hospital
immunoallergology departments, as they seem to be the most cost-effective intervention,
followed by hyperlinks to ADR reporting forms, and the promotion of educational
interventions to health care professionals for the first time.

Chapter 4. Promoting spontaneous ADR reporting in Hospitals using hyperlinks
67
Chapter 4 - Promoting spontaneous ADR reporting in
Hospitals using a hyperlink to the on-line reporting form.
Inês Ribeiro-Vaz, Cristina Santos, Altamiro da Costa-Pereira, Ricardo Cruz-Correia
Drug Saf. 2012

Chapter 4 – Promoting spontaneous ADR reporting in Hospitals using hyperlinks
68

Chapter 4 – Promoting spontaneous ADR reporting in Hospitals using hyperlinks
69
4. Promoting spontaneous Adverse Drug Reaction reporting in
Hospitals using a hyperlink to the on-line reporting form: An
ecological study in Portugal

Chapter 4 – Promoting spontaneous ADR reporting in Hospitals using hyperlinks
70
4.1 Abstract
Background: Spontaneous Adverse Drug Reactions (ADR) reporting has been described as an
efficient method to detect drug safety signs. However, underreporting is a major issue
undermining the effectiveness of spontaneous reports. Among hospitalized patients, adverse
drug reactions are a particularly serious problem, because these patients are often treated
with more than one drug, and with new and aggressive drugs.
Objective: In order to promote spontaneous ADR reporting by healthcare professionals
working in northern region Portuguese hospitals, we propose the inclusion of a hyperlink to an
on-line ADR reporting form on the Electronic Patient Records (EPR) of hospitals. The main aim
of this work is to evaluate the impact of these hyperlinks in the number of spontaneous ADR
reports to Northern Pharmacovigilance Centre (UFN – Unidade de Farmacovigilância do
Norte). We also assess the number of UFN web site daily visits before and after the hyperlinks
inclusion.
Methods: An ecologic study was performed in the Northern Portuguese Hospitals from 2006
to 2010. The hyperlinks were included either in EPR or computers desktops. The median of
spontaneous ADR reports (total and on-line) per month and respective range were presented
before and after the intervention in all hospitals. The comparisons were performed using the
Mann-Whitney U test.
Results: There were 16 hospital centres involved in the study. Eleven centres (18 hospitals)
included the hyperlinks. Considering the hospitals with hyperlink, the median ADR reports per
month significantly increased, from 2 (range 0-12) to 5 reports (range 1-17). The median of
ADR reports using the on-line form per month also increased significantly, from 1 (range 0-5)
before the intervention to 4 (range 1-17) after it. Moreover, serious ADR increased 3 fold, and
non-previously described ADR increased 4.5 fold. None of these significant increments were
observed in the other hospitals without the hyperlink. We also found a significant increase of
UFN web site daily visits from 10 before the intervention to 27 after it (p<0.001).
Conclusions: The increase in ADR reporting shows that the inclusion of hyperlinks to on-line
ADR reporting forms is an easy and cost-effective way to change health professional
behaviours on ADR spontaneous report.
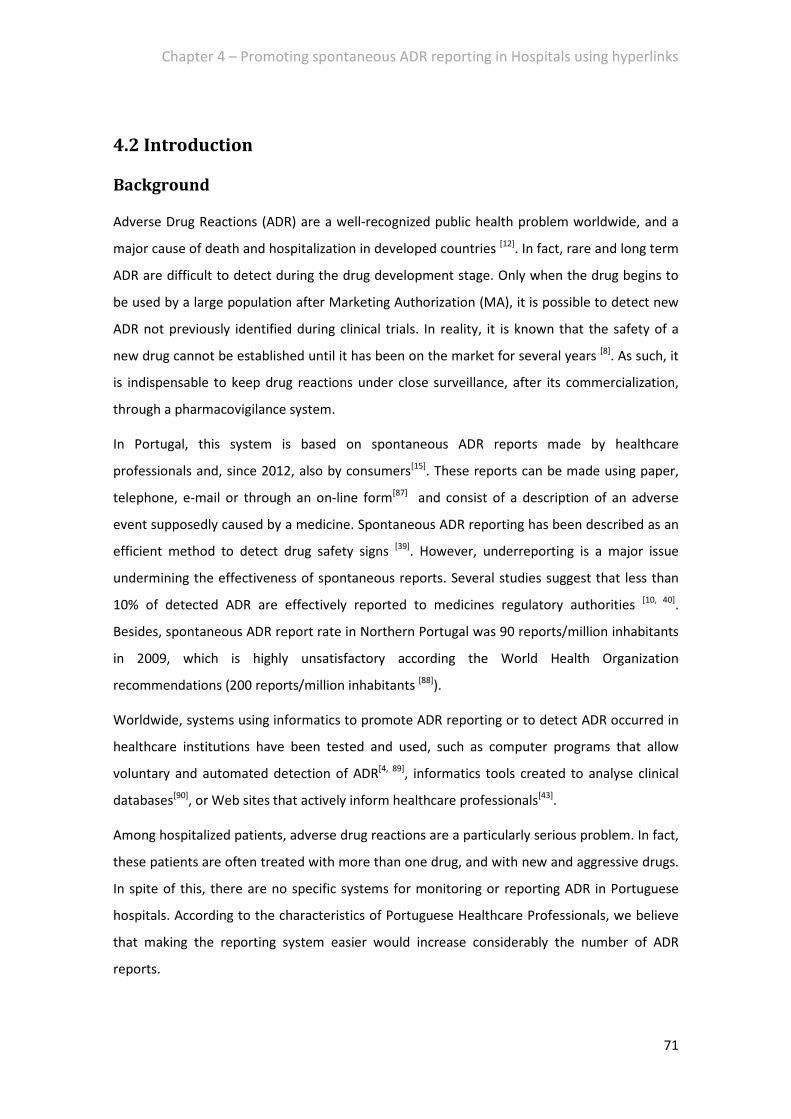
Chapter 4 – Promoting spontaneous ADR reporting in Hospitals using hyperlinks
71
4.2 Introduction
Background
Adverse Drug Reactions (ADR) are a well-recognized public health problem worldwide, and a
major cause of death and hospitalization in developed countries [12]. In fact, rare and long term
ADR are difficult to detect during the drug development stage. Only when the drug begins to
be used by a large population after Marketing Authorization (MA), it is possible to detect new
ADR not previously identified during clinical trials. In reality, it is known that the safety of a
new drug cannot be established until it has been on the market for several years [8]. As such, it
is indispensable to keep drug reactions under close surveillance, after its commercialization,
through a pharmacovigilance system.
In Portugal, this system is based on spontaneous ADR reports made by healthcare
professionals and, since 2012, also by consumers[15]. These reports can be made using paper,
telephone, e-mail or through an on-line form[87] and consist of a description of an adverse
event supposedly caused by a medicine. Spontaneous ADR reporting has been described as an
efficient method to detect drug safety signs [39]. However, underreporting is a major issue
undermining the effectiveness of spontaneous reports. Several studies suggest that less than
10% of detected ADR are effectively reported to medicines regulatory authorities [10, 40].
Besides, spontaneous ADR report rate in Northern Portugal was 90 reports/million inhabitants
in 2009, which is highly unsatisfactory according the World Health Organization
recommendations (200 reports/million inhabitants [88]).
Worldwide, systems using informatics to promote ADR reporting or to detect ADR occurred in
healthcare institutions have been tested and used, such as computer programs that allow
voluntary and automated detection of ADR[4, 89], informatics tools created to analyse clinical
databases[90], or Web sites that actively inform healthcare professionals[43].
Among hospitalized patients, adverse drug reactions are a particularly serious problem. In fact,
these patients are often treated with more than one drug, and with new and aggressive drugs.
In spite of this, there are no specific systems for monitoring or reporting ADR in Portuguese
hospitals. According to the characteristics of Portuguese Healthcare Professionals, we believe
that making the reporting system easier would increase considerably the number of ADR
reports.

Chapter 4 – Promoting spontaneous ADR reporting in Hospitals using hyperlinks
72
Intending to promote spontaneous ADR reporting by healthcare professionals working in
hospitals, we propose the inclusion of a hyperlink to an on-line ADR reporting form [part of the
Northern Pharmacovigilance Centre (UFN) web site] on the Electronic Patient Records (EPR) or
on the desktop of hospital computers. With this system, we expected to reach not only the
physicians, but also the pharmacists and nurses working at the hospitals. In Portuguese
hospitals, pharmacists has an important role in ADR detection and reporting, because
physicians discuss with them the adverse events that occurred during medical treatment,
asking for alternative drugs available at the pharmacy. Besides, some pharmacists are part of
the clinical visit and detect ADR.
Aim
Our main aim is to evaluate the impact of the hyperlinks implemented in Portuguese hospitals
in the number of ADR reported by these hospitals using the hyperlink or not, and in the visits
to the UFN web site.
4.3 Methods
Intervention
Hyperlinks to the ADR on-line reporting UFN form were proposed to the 18 Northern
Portuguese Hospitals Centres. The hyperlinks can be included either in healthcare professional
specific software (typically EPR or Pharmacy specific applications used by doctors, nurses and
pharmacists), or at the computer desktop (see Figure 6 for examples of both situations). It
should be noticed that most of the Portuguese EPR are web-based and so the hyperlink opens
the UFN form in a new browser window.

Chapter 4 – Promoting spontaneous ADR reporting in Hospitals using hyperlinks
73
Figure 6. Two examples of hyperlinks in a computer desktop (back image), and on an Electronic Patient Record (front image)
The on-line reporting UFN form requires the health professional to login with their personal
account. The patient data is collected in an anonymous way (only the initials of the patient
name are required aiming to help the health professional identify each case) and the data is
secured in an Oracle database with proper access restrictions.
In the beginning of October 2007 a letter was sent to the chief physicians of the 18 Northern
Portuguese Hospital Centres suggesting the inclusion of the hyperlink. If there was no answer
in two weeks, clinical administration boards were reminded by telephone. Thirteen centres
forwarded this issue to the respective informatics departments and only one to the
pharmaceutical department. Five of them have not answered until the end of 2010. After the
approval by the hospital board and the forward to the respective departments, UFN made a
third contact in order to explain technical doubts and to send the specific hyperlink of each
Hospital.

Chapter 4 – Promoting spontaneous ADR reporting in Hospitals using hyperlinks
74
Study design and data collection
An ecologic study was carried out in the Northern Portuguese Hospitals from 2006 to 2010.
The number of spontaneous ADR reports and on-line spontaneous ADR reports originated in
hospitals were analysed before and after an intervention without a control group. Five hospital
centres implemented the hyperlink on December 2007 and the other 6 implemented it during
the next 5 months. We considered 23 months before and the 31 months after each hospital
implementation.
The UFN web site uses an Apache web-server having the web logs related to the site visits
recorded since January 2006. These logs were initially processed using Webalizer software
(www.webalizer.org) to calculate site hits, users and visits.
Telephonic interviews with the informatics departments of each hospital were performed to
collect where each institution putted the hyperlink to the UFN website, and screen-shots
illustrating the interventions were taken.
Variables
The main variables collected for analysis were:
• Date – date and time of the ADR report;
• Hospital – institutions were the ADR was detected;
• Health professional – type of the health professional that reported (doctor, nurse,
pharmacist and others);
• Seriousness – seriousness of ADR grouped in “Serious” or “Non-serious” according to
the WHO criteria;
• Previous knowledge – was the ADR previously described on the Summary of Product
Characteristics or not.
Bias
From the initial 18 centres (31 hospitals), we excluded 4 hospitals that established other
cooperation protocols with UFN in order to avoid possible confounder’s bias (see Figure 7). For
the other 16 hospitals, we believe that there were no external interventions that could
potentially explain the observed results.
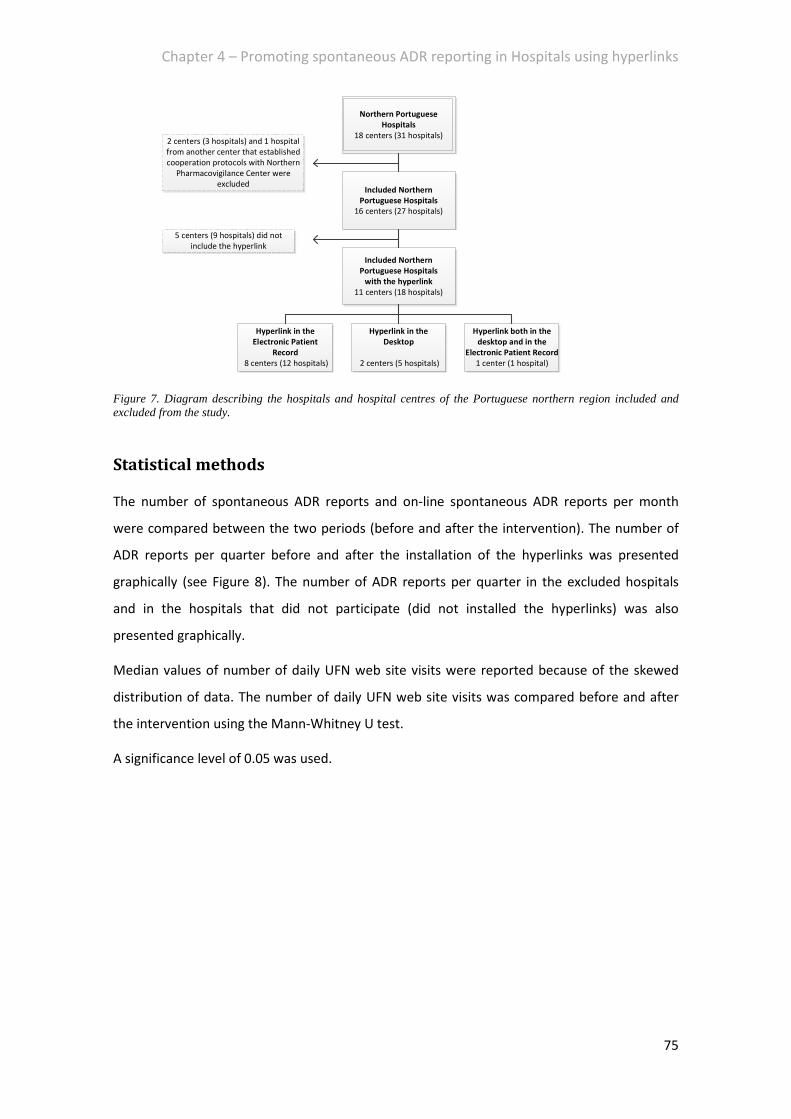
Chapter 4 – Promoting spontaneous ADR reporting in Hospitals using hyperlinks
75
Figure 7. Diagram describing the hospitals and hospital centres of the Portuguese northern region included and excluded from the study.
Statistical methods
The number of spontaneous ADR reports and on-line spontaneous ADR reports per month
were compared between the two periods (before and after the intervention). The number of
ADR reports per quarter before and after the installation of the hyperlinks was presented
graphically (see Figure 8). The number of ADR reports per quarter in the excluded hospitals
and in the hospitals that did not participate (did not installed the hyperlinks) was also
presented graphically.
Median values of number of daily UFN web site visits were reported because of the skewed
distribution of data. The number of daily UFN web site visits was compared before and after
the intervention using the Mann-Whitney U test.
A significance level of 0.05 was used.
Northern Portuguese
Hospitals
18 centers (31 hospitals)
Included Northern
Portuguese Hospitals
16 centers (27 hospitals)
2 centers (3 hospitals) and 1 hospital from another center that established cooperation protocols with Northern
Pharmacovigilance Center were excluded
Included Northern
Portuguese Hospitals
with the hyperlink
11 centers (18 hospitals)
Hyperlink in the
Electronic Patient
Record
8 centers (12 hospitals)
Hyperlink in the
Desktop
2 centers (5 hospitals)
Hyperlink both in the
desktop and in the
Electronic Patient Record
1 center (1 hospital)
5 centers (9 hospitals) did not
include the hyperlink
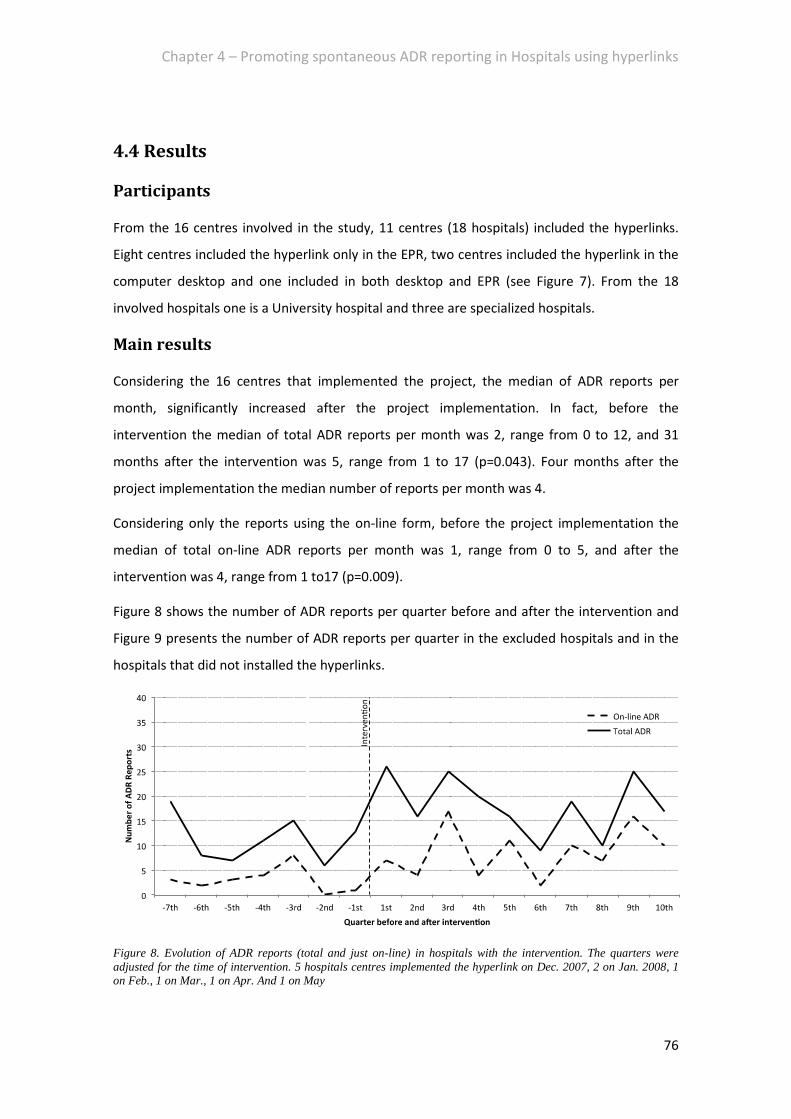
Chapter 4 – Promoting spontaneous ADR reporting in Hospitals using hyperlinks
76
4.4 Results
Participants
From the 16 centres involved in the study, 11 centres (18 hospitals) included the hyperlinks.
Eight centres included the hyperlink only in the EPR, two centres included the hyperlink in the
computer desktop and one included in both desktop and EPR (see Figure 7). From the 18
involved hospitals one is a University hospital and three are specialized hospitals.
Main results
Considering the 16 centres that implemented the project, the median of ADR reports per
month, significantly increased after the project implementation. In fact, before the
intervention the median of total ADR reports per month was 2, range from 0 to 12, and 31
months after the intervention was 5, range from 1 to 17 (p=0.043). Four months after the
project implementation the median number of reports per month was 4.
Considering only the reports using the on-line form, before the project implementation the
median of total on-line ADR reports per month was 1, range from 0 to 5, and after the
intervention was 4, range from 1 to17 (p=0.009).
Figure 8 shows the number of ADR reports per quarter before and after the intervention and
Figure 9 presents the number of ADR reports per quarter in the excluded hospitals and in the
hospitals that did not installed the hyperlinks.
Figure 8. Evolution of ADR reports (total and just on-line) in hospitals with the intervention. The quarters were adjusted for the time of intervention. 5 hospitals centres implemented the hyperlink on Dec. 2007, 2 on Jan. 2008, 1 on Feb., 1 on Mar., 1 on Apr. And 1 on May
Chapter 4 – Promoting spontaneous ADR reporting in Hospitals using hyperlinks
77
Figure 9. Evolution of ADR reports in the excluded hospitals (with cooperation protocols) and in the hospitals that did not install the hyperlinks
The 11 included centres, reported 17 in 23 months serious ADR using the on-line form before
the intervention, and 69 in 31 months (increase of 3 fold) after the intervention. Before the
intervention these centres reported 7 non-previously described ADR using the on-line form
and reported 42 after (increase of 4.5 fold).
The hospital with the larger increase of ADR reports submitted on-line was the one that
included the hyperlink in both EPR and desktop, with a mean of 3 on-line reports per year
before the intervention and 18 after. The three hospitals that included the hyperlink in the
desktop (one of them simultaneously with EPR) were in the top five of hospitals with higher
increasing of ADR reports submitted on-line.
There were no ADR reports sent both by paper and on-line by the same professional.
Other analysis
There was a significantly increase of UFN web site daily visits after the intervention (p<0.001).
Before there was a median of 10 UFN web site daily visits and after increased to 27.
4.5 Discussion
Our results show that the inclusion of hyperlinks to an on-line ADR reporting form on the EPR
does change health professional behaviours on ADR report. In reality, there was an increase in
ADR reporting in the hospitals involved in this project both in the total amount of ADR reports
(more than 2 fold), in the amount of ADR reports submitted on-line (4 fold), in serious ADR
reported on-line (3 fold) and non-previously described (more then 4 fold). Additionally, daily
visits to the UFN website increased about 3 fold after the intervention.

Chapter 4 – Promoting spontaneous ADR reporting in Hospitals using hyperlinks
78
A similar intervention based on changing the EPR of a hospital to facilitate ADR reporting is
presented in Ortega et al.[27]. The measured impact was higher as they moved from zero to 1.6
ADR per month in just one hospital when compared with our ADR reporting growth. We argue
that this difference may be due to the fact that they were able to fine-tune the EPR to increase
ADR reporting as they had more control over the application, whilst in our case we were
limited to placing hyperlinks in existing heterogeneous EPR. Therefore, our approach seems
more easily widespread as hospitals are known to have many different information systems[91]
and a national pharmacovigilance institution is probably not able to impose the changes
described in Ortega el al.[27] to most commercial EPR.
In the study by Figueiras et al.[92], which was performed in the same region as our own, an
educational intervention to improve physician reporting is described, namely by performing
outreach visits to groups of health professionals. Their results present a very expressive
increase (90 fold) in ADR reporting in the intervention group, and 30 fold in serious ADR. When
compared with our results, it is clear that the educational intervention has proven to be much
more effective, but also to need more resources (human and financial). Also, the effectiveness
of these interventions appears to decrease through time. In the study Pedrós et al.[93], an
educational (periodic meetings) and economic incentives intervention was initiated in 2003.
Their results present an increase of 5.6 folds in all ADR, and 2 fold in serious ADR. Their impact
is similar to our study but again using more financial resources.
When compared with other types of interventions, being those just educational[92] or
combined with economic incentives[93], our intervention seems to have less impact although
more long-lasting and less expensive.
As an additional outcome, we can see that the hospital with higher increasing of ADR reports
submitted on-line was the one that included the hyperlink in the EPR and desktop,
simultaneously. According to our results, the computer desktop seems more efficient than the
EPR to place the hyperlink. It is the authors’ opinion that these improvements could also be
effective in other countries, because we think they are more related to generic usage of
graphical user interfaces than to local practices.
It should also be noticed that making the ADR forms easily accessible might also potentiate
other future ADR reporting promotion initiatives that can now take advantage of the visibility
to the users of the hyperlink. Therefore, we argue that our solution is cost-effective,
appropriate for widespread use in many healthcare institutions and for consistent increase
over time.

Chapter 4 – Promoting spontaneous ADR reporting in Hospitals using hyperlinks
79
Limitations
In some hospitals, we found out that although the hyperlink was included, the professionals
did not know about it. In the near future we aim to increase the knowledge of the hyperlink by
informing more actively health professionals using flyers to send to the hospitals, posters to be
placed, and an e-mail showing specifically how to find the hyperlink. Another problem
detected was the impossibility to use the hyperlink in some hospitals because the users did not
have permission to access to Internet.
Future work
To solve the problem of not being able to access the Internet, we are now developing Web-
services [94] to be used by other systems available at hospitals intranets. With this tool, it will
not be necessary to access the UFN web site, and health care professionals can simply use the
existing information systems as proposed in Ortega et al. [27]. With this future work, we expect
to eliminate all the technical obstacles to ADR report, further increasing the reporting rate.
Meanwhile, we also aim to implement this project in Northern Portugal primary care
healthcare centres and providing the hyperlink to general practitioners and nurses.
Conclusions
The inclusion of hyperlinks in computer desktops and EPR to on-line ADR reporting forms is an
easy and cost-effective way to change health professional behaviours on ADR spontaneous
report. Actually, daily visits to the UFN website significantly increased after the hyperlinks
inclusion, but, even more important, the amount and relevance of ADR reports significantly
increased after the hyperlink inclusion in the hospitals involved in this project.
Acknowledgements
The authors would like to thank all the people involved in including the hyperlinks in the EPR
and desktop, namely the hospital IT departments and Pedro Farinha for the log analysis, and
also to the reviewers for their valuable comments.
Author contributions
Inês Ribeiro-Vaz was responsible for most of the intervention and data collection. Cristina
Santos performed the statistical analysis. Altamiro Costa-Pereira and Ricardo Cruz-Correia
supervised the writing of the paper. Ricardo Cruz-Correia also conceptualized the
interventions.

80

Chapter 5 – Using webservices
81
Chapter 5 – Using webservices to link electronic clinical
records to pharmacovigilance databases
Inês Ribeiro-Vaz, Ricardo João Cruz-Correia
Int J Pharmacovigil. 2016

Chapter 5 – Using webservices
82

Chapter 5 – Using webservices
83
5. Using webservices to link electronic clinical records to
pharmacovigilance databases

Chapter 5 – Using webservices
84
5.1 Abstract
Purpose: Adverse drug reaction (ADR) reporting is an efficient method to assess the safety of
drugs. However, underreporting is a major issue undermining the effectiveness of this method.
Among patients with inflammatory bowel disease (IBD), ADR are a serious problem, because
these patients are often treated with new and potent drugs. Electronic registries usually
include information on ADR, recorded by physicians. To promote ADR reporting by
gastroenterologists working in a multicentre IBD study group, we proposed the utilisation of a
webservice in their usual electronic health records (EHR) to collect ADR. The aim of this work
was to describe the impact of this intervention on the number of ADR reported to the
regulatory authority through a regional pharmacovigilance centre.
Methods: A study was performed between 2013 and 2015. A webservice was created and
implemented in an EHR in use. We analysed the trends and type of ADR reported through this
service.
Results: From April 2013 to February 2015, 167 ADR reports were sent to the Northern
Pharmacovigilance Centre through the webservice, comprising 10% of the total ADR reports
received in the same period. Of these, 118 cases were serious (one was life-threatening). In the
northern region of Portugal, GEDII physicians reported 9 ADR during the 23 months previous to
webservice implementation and 121 ADR during the 23 months after webservice
implementation, i.e. an increase of 81%.
Conclusions: This solution allowed for reporting 167 ADR during the first 23 months of
implementation, simply by clicking a button included in the usual EHR used by
gastroenterologists. These results suggest that information systems (IS) should facilitate the
reporting of ADR.
.
Chapter 5 – Using webservices
85
5.2 Introduction
All medicines have adverse effects, some of them unknown until the drug is commercialised.
Thus, it is crucial to implement strategies to monitor drug safety. Pharmacovigilance is the
activity of drug surveillance, after its launch onto the market, with the main goal of public
health protection, ensuring that the drug benefit outweighs its risks. Worldwide,
pharmacovigilance systems are mostly based on spontaneous ADR reports made by healthcare
professionals and consumers. Spontaneous ADR reporting has been described as an essential
method to detect drug safety signals; however, underreporting is a major issue undermining
the effectiveness of spontaneous reports. Several studies suggest that fewer than 10% of
detected ADR are effectively reported to medicine regulatory authorities (e.g. Food and Drug
Administration - FDA, European Medicines Agency - EMA, etc.). [7, 10]
It is known that one of the main reasons why healthcare professionals do not report ADR is
due to an increase in their workload [48, 54]. So, in order to reduce ADR reporting efforts,
information systems (IS) to promote ADR reporting or to detect ADR in healthcare institutions
have been tested and used, such as software for voluntary and automated detection of ADR,
tools that analyse clinical databases or web-sites that actively inform healthcare
professionals[11]. Information and communication technologies can also be used to facilitate
and promote ADR reporting, such as the creation of on-line reporting forms and the
development of tools to collect safety data from electronic health records (EHR), among
others[16, 27].
In Portugal, there is a multi centre research project, in the field of gastric diseases (Study
Group of Inflammatory Bowel Disease – GEDII)[26] whose members use the same electronic
health record to collect patient information. As these patients are often treated with new and
potent drugs (e.g. immunomodulating agents), the EHR has a field related to medication and
ADR. Since the group members already fill in this field, it was considered an advantage to
create a tool to send the data to the pharmacovigilance system.
Aim
The aim of this work was to implement and describe the implementation of a webservice in an
EHR to collect ADR reports and analyse the number of ADR reports sent to the Portuguese
regulatory authority (INFARMED), through a regional pharmacovigilance centre.

Chapter 5 – Using webservices
86
5.3 Methods
Intervention
The multi-centre research project, the Study Group of Inflammatory Bowel Disease – GEDII[26],
has its own electronic health record (EHR) to collect patient information, with a field related to
medications and ADR.
The GEDII members asked for a collaboration with the Northern Pharmacovigilance Centre
(UFN in Portuguese) and the Health Information and Decision Sciences Department (CIDES) of
the Faculty of Medicine to develop a tool to allow for easy reporting of ADR included in the
EHR to the pharmacovigilance system. The two entities had, at the time, released a new
information service (a webservice) to collect suspected adverse reactions directly from
prescription and medical records. This system was easily adapted to the EHR used by the GEDII
group.
The Northern Pharmacovigilance Centre, as part of the Portuguese Pharmacovigilance System,
receives ADR reports from healthcare professionals (and, since 2012, from consumers as well)
through an on-line form, a paper form, e-mail and by telephone. Since 2013, UFN has also
received ADR reports through the webservice.
The webservice anonymises patient data (converting the full name of the patient into initials),
according to the data protection standards of the Portuguese Pharmacovigilance System.
Figure 10 shows the information flow from the electronic health record to the
pharmacovigilance system.
Figure 10 Information flow
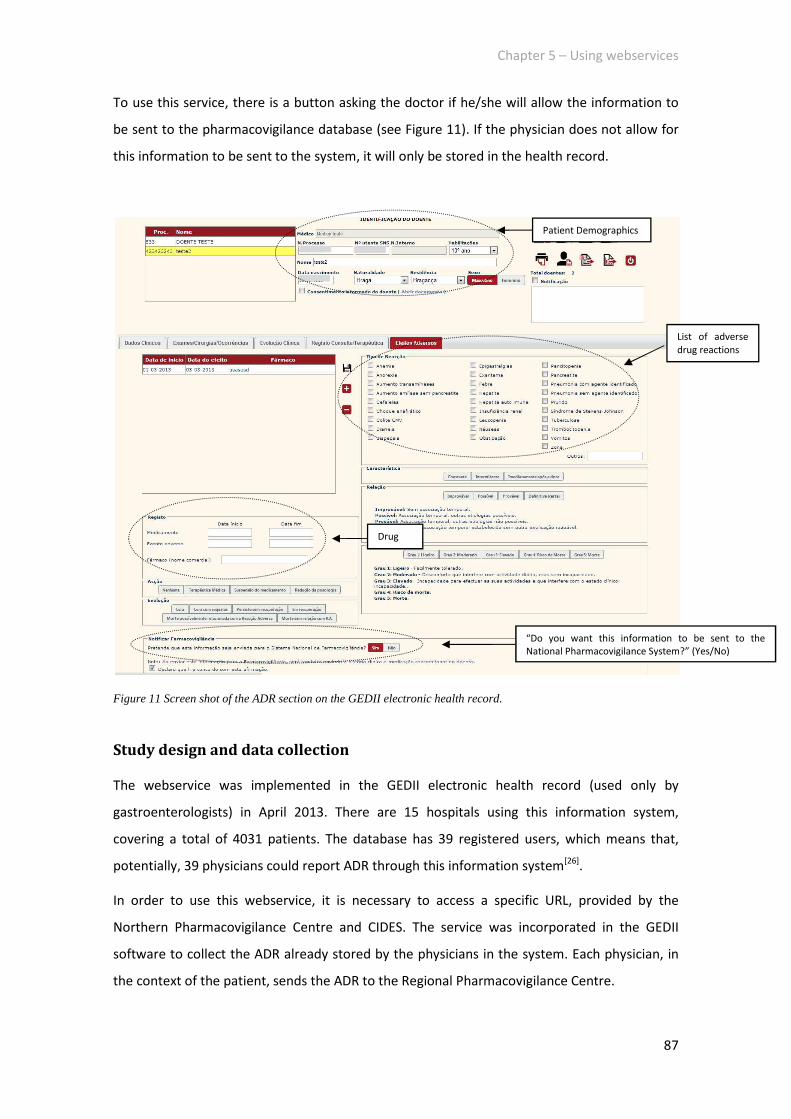
Chapter 5 – Using webservices
87
To use this service, there is a button asking the doctor if he/she will allow the information to
be sent to the pharmacovigilance database (see Figure 11). If the physician does not allow for
this information to be sent to the system, it will only be stored in the health record.
Figure 11 Screen shot of the ADR section on the GEDII electronic health record.
Study design and data collection
The webservice was implemented in the GEDII electronic health record (used only by
gastroenterologists) in April 2013. There are 15 hospitals using this information system,
covering a total of 4031 patients. The database has 39 registered users, which means that,
potentially, 39 physicians could report ADR through this information system[26].
In order to use this webservice, it is necessary to access a specific URL, provided by the
Northern Pharmacovigilance Centre and CIDES. The service was incorporated in the GEDII
software to collect the ADR already stored by the physicians in the system. Each physician, in
the context of the patient, sends the ADR to the Regional Pharmacovigilance Centre.
“Do you want this information to be sent to the National Pharmacovigilance System?” (Yes/No)
List of adverse drug reactions
Drug
Patient Demographics
Chapter 5 – Using webservices
88
After the ADR report is received by the Regional Pharmacovigilance Centre, their technical staff
process the report according to the pharmacovigilance guidelines[14], sending it to the
Portuguese Regulatory Authority (INFARMED).
If the doctor does not want to send the information to the pharmacovigilance system, it will
only be stored in the medical history.
To analyse the trends and type of ADR reported through this service, we performed a
descriptive analysis on the number and seriousness of ADR reported. The seriousness was
assessed using the World Health Organisation seriousness criterion[6]. According to this
criterion, a serious ADR is any untoward medical occurrence that at any dose: results in death,
requires inpatient hospitalisation or prolongation of existing hospitalisation, results in
persistent or significant disability/incapacity or is life-threatening.
5.4 Results
From April 2013 to February 2015, physicians from GEDII reported 167 ADR through the
described webservice.
Of the 167 reported ADR, 118 (71%) were serious ADR, considering the World Health
Organisation seriousness criterion[6]. One of the cases was life-threatening and none were
fatal.
To calculate the increase in ADR reporting in this period, we used data from the northern
region, which is the delimited area of the Northern Pharmacovigilance Centre, as we did not
have access to national ADR reporting data. Thus, considering the physicians from the GEDII
group that work at the northern region of Portugal, 9 ADR were reported during the 23
months prior to webservice implementation and 121 ADR were reported during the 23 months
after webservice implementation, i.e. an increase of 81%.
Drugs involved in the reported ADR
Most of the cases had one only suspected drug, but in six cases there were two suspected
drugs involved.
Of the reported ADR, 106 cases (63%) were presumably due to azathioprine, 23 cases (14%) to
infliximab, 14 cases (8%) to adalimumab and 9 (5%) cases to methotrexate (Figure 12).

Chapter 5 – Using webservices
89
Figure 12 Drugs involved in the reported ADR
All of these drugs are classified as antineoplastic and immunomodulating agents, according to
the WHO Anatomical Therapeutic Chemical (ATC) classification system[95]. Azathioprine,
infliximab and adalimumab are immunosuppressants and methotrexate is an antimetabolite.
0
20
40
60
80
100
120
azathioprine infliximab adalimumab methotrexate
Chapter 5 – Using webservices
90
5.5 Discussion
Worldwide, many systems use electronic health records to facilitate adverse event reporting,
with the same goal as our work, which is to not overload healthcare professionals with
additional administrative work to report ADR [27, 55, 64]. These systems can be included in the
EHR and be easily completed [64] or can actively help in form filling with the automatic input of
certain information already included in the EHR[27]. During the ALIAS (Albumin in Acute Stroke
Trial) experience, authors decided to integrate an electronic safety reporting module into the
existing web-based system to deal with safety reporting obligations of a multicentre clinical
trial[62]. This system pre-populates the reporting form with the existing information, which
needs to be completed and validated by clinical staff. The ASTER pilot study also brought an
important contribution to the development of these systems, as it triggered ADR within the
EHR, collected patient data, populated the ADR reporting form and made the report available
to the physician for review [60]. This work is different from ours, because it asks the clinician to
provide additional information on the adverse event and then submits the report. All these
systems incur extra work on the part of physicians, which is difficult to eliminate. The novelty
of our work is the detail of allowing the physician to report ADR without any additional
administrative work beyond the usual clinical registry. In addition, the EHR remained the same,
without the need to change the physicians’ routine. This system adapts to the routines of the
healthcare professionals and not vice versa, which can explain the increasing of ADR reporting
among the studied group.
It is also important to note that most of the reported ADR were serious. In fact, the studied
group deals with innovative and powerful drugs that often cause serious adverse events. This
finding reinforces the importance of our work, as Pharmacovigilance Systems seek mainly
information about serious (and unexpected) ADR[88].
Our study has some limitations, such that it only included gastroenterologists. However, this
webservice is available to be used in several software. Even so, it is currently in use only in two
software systems: the one described in this study and an electronic prescription software
system. Another issue is that our study does not have a control group, which limits the
conclusions drawn. For this reason, the only comparison that the authors were able to perform
was for the number of ADR reports made by the same group of gastroenterologists before the
webservice implementation.
Chapter 5 – Using webservices
91
Conclusions
The simple solution described in our work allowed for reporting 167 ADR during the first 23
months of implementation, simply by clicking a button included in the usual electronic health
record used by gastroenterologists. Our results suggest that doctors would report more ADR if
they do not have to take on any further workload to do it. We propose that IS used to support
multicentre studies should be used to report detected ADR.
Author contributions
The first author was responsible for data collection and writing the paper. The second author
conceptualised the intervention and supervised writing of the paper.
Conflict of interest
The authors declare that they have no conflicts of interest.

92
Chapter 6 – Decision Support Tool
93
Chapter 6 - Decision support tool
Bayesian network model to support the causality assessment of
adverse drug reactions reports: a regional pharmacovigilance
centre experience
Inês Ribeiro-Vaz, Pedro Pereira Rodrigues, Ana Silva, Jorge Polónia
WHO Winter Meeting. 2015.

Chapter 6 – Decision Support Tool
94

Chapter 6 – Decision Support Tool
95
6.1 Abstract

Chapter 6 – Decision Support Tool
96
6.2 Introduction
In the same line as other our studies, we aimed to improve the feed-back given to the reporter
according to the causality assessment made in each report (causal relationship judgment).
Pharmacovigilance systems are mostly based on suspected ADR reported by health
professionals and users. Thus, regulatory health authorities have adopted methods of causal
attribution, which allow for the assessment of the probability that a drug was the causative
agent of the ADR. Worldwide, many methods are used for causality assessment of ADR, such
as expert judgements (also called global introspection), algorithms and Bayesian
approaches[96]. The Portuguese pharmacovigilance system has adopted the method of global
introspection [88], during which one or several experts express their judgment on the possible
causal relationship between the suspected drug and the ADR. This judgement is based on
expert knowledge and background, considering all available data about the ADR. This method
has some limitations related to its reproducibility[96] and compliance with legal deadlines, as it
depends on the availability of experts.
Aim
Our objective was to design and implement a decision support system based on a Bayesian
network that will expedite the response to the reporter. This work also improved the process
of ADR report causality assessment according to: (1) time spent on the process and (2)
reproducibility.
6.3 Methods
The Bayesian network was developed based on completely-filled ADR reports, evaluated by a
Portuguese Northern Pharmacovigilance Centre expert over 12 years, and compared with
global introspection on an independent validation cohort for sensitivity, positive predictive
value (PPV) and time to causality assessment (TTA). Causality was classified as Definitive
(Certain), Probable, Possible or Conditional, according to the WHO causality assessment.
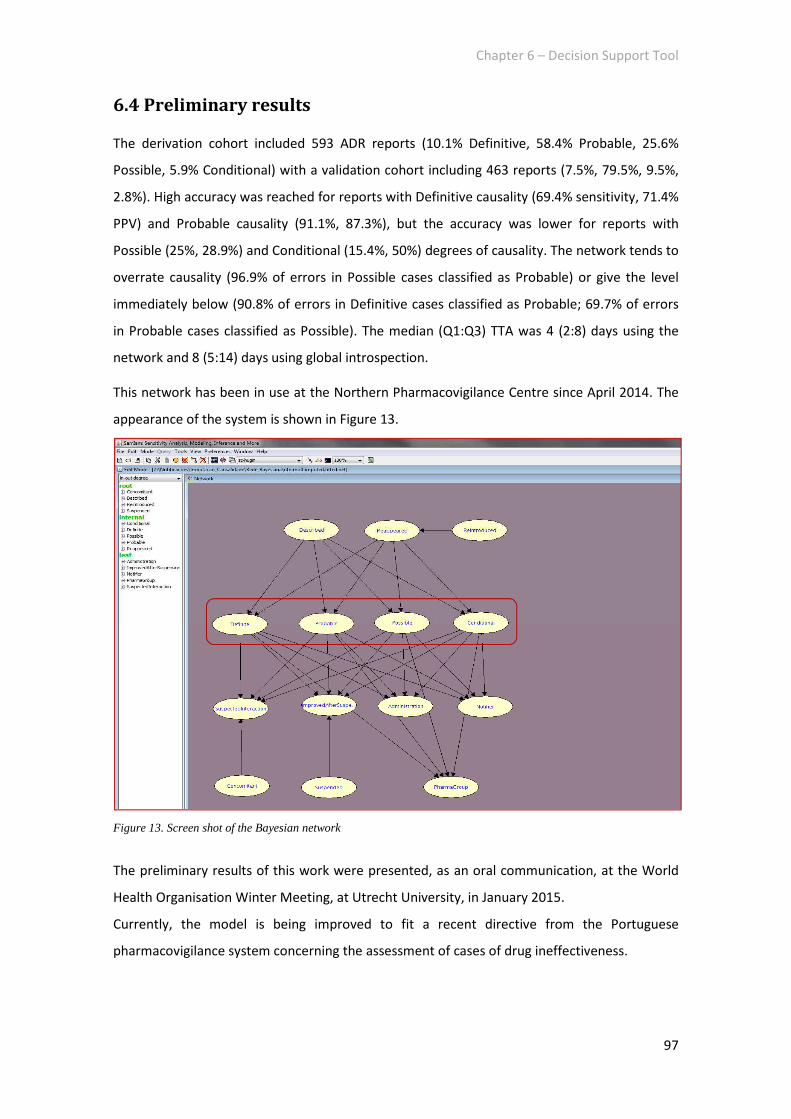
Chapter 6 – Decision Support Tool
97
6.4 Preliminary results
The derivation cohort included 593 ADR reports (10.1% Definitive, 58.4% Probable, 25.6%
Possible, 5.9% Conditional) with a validation cohort including 463 reports (7.5%, 79.5%, 9.5%,
2.8%). High accuracy was reached for reports with Definitive causality (69.4% sensitivity, 71.4%
PPV) and Probable causality (91.1%, 87.3%), but the accuracy was lower for reports with
Possible (25%, 28.9%) and Conditional (15.4%, 50%) degrees of causality. The network tends to
overrate causality (96.9% of errors in Possible cases classified as Probable) or give the level
immediately below (90.8% of errors in Definitive cases classified as Probable; 69.7% of errors
in Probable cases classified as Possible). The median (Q1:Q3) TTA was 4 (2:8) days using the
network and 8 (5:14) days using global introspection.
This network has been in use at the Northern Pharmacovigilance Centre since April 2014. The
appearance of the system is shown in Figure 13.
Figure 13. Screen shot of the Bayesian network
The preliminary results of this work were presented, as an oral communication, at the World
Health Organisation Winter Meeting, at Utrecht University, in January 2015.
Currently, the model is being improved to fit a recent directive from the Portuguese
pharmacovigilance system concerning the assessment of cases of drug ineffectiveness.

98

Chapter 7 – Ongoing and future work
99
Chapter 7 - Ongoing and future work
7.1 Abstract
Some of the studies that were part of the thesis plan were not finished within the thesis
development period, and are still in development. Furthermore, some other studies, not
initially planned, were started by the research team. In fact, our investigation addresses a
broad topic and many ideas were conceptualized during the daily work in pharmacovigilance
and research activities.
One of the unplanned works is being performed within a local health unit, in order to develop
an information system to facilitate information exchange about ADR within the healthcare
unit. This work started in June 2014 and is currently being tested by healthcare professionals
at the institution (subchapter 7.2).
In the course of our quotidian activity, we found that websites and social networks are
excellent media to disseminate information about pharmacovigilance and drug safety issues.
This belief was further supported during the performance of the systematic review. In line with
this, we started to design a personal area on our website (sub-subchapter 7.3.1), and we also
developed an online ADR reporting form for consumers (sub-subchapter 7.3.2) and start to
develop a mobile application for ADR reporting (Chapter 7.4).
The expected results of this works are detailed in the following subchapters.

Chapter 7 – Ongoing and future work
100
7.2 Managing several players at several institutions dealing with
the same adverse event. A pilot-study called SIRAI.
Introduction
In June 2014, this PhD team proposed the development of a pilot study within the local health
unit of Matosinhos, Portugal (ULSM in Portuguese) to test some strategies regarding the use of
IS on the information exchange about ADR.
The first goal of this study was to design an information system (a single database) that will
gather all the information about ADR that is disseminated around the institution, allowing for
better use by healthcare professionals. Subsequently, the included ADR will be automatically
submitted to the regulatory authority (National Authority of Medicines and Health Products;
INFARMED, IP) through a regional pharmacovigilance centre (the Northern Pharmacovigilance
Centre), with the permission of each healthcare professional.
When the database is in full use, an intervention study will be performed, with the following
main outcomes: (1) the number of databases integrated into the single database, (2) the
number of ADR included in the single database and (3) the number of ADR reports submitted
to the regulatory authority by health professionals from the hospital.
To measure the submitted ADR reports, the Northern Pharmacovigilance Centre database will
be used, which is registered in the Portuguese commission for data protection, and follows the
confidentiality and data protection guidelines imposed by the Portuguese pharmacovigilance
system.
This study was approved by the local ethics committee and the hospital’s board of directors.
Chapter 7 – Ongoing and future work
101
Methods
In June 2014, a working group was created to design the information system. This expert group
was composed of:
- two physicians: one an expert in primary care and the other an expert in hospital care who
is also responsible for the risk management department at the institution
- two pharmacists: one an expert in hospital pharmacy and the other an expert in
pharmacovigilance
- two nurses
- two informaticians: one responsible for the hospital informatics department and the other
one from the Faculty of Medicine.
From June 2014 to June 2015, this working group met in person 10 times. During these
meetings, a discussion took place regarding the type of database that is most appropriate for
the institution’s healthcare professionals, and its contents were approved.
The screens were designed and improved between meetings, according to the group’s
opinions. The content was also developed with the contribution of each participant. Namely,
lists of adverse reactions, severity criteria and routes of administration were developed and
approved, to facilitate form completion.
To meet the needs of health professionals at the institution, we also developed a form to
report incidents with medical devices. This form based on the INFARMED paper form.
In February 2015, the first version of the prototype was shown, and a name was assigned to
the information system: SIRAI3. The system is currently being tested.
3 The acronym means Sistema de Informação de Reações Adversas e Incidentes (Information System for
Adverse Reactions and Incidents).

Chapter 7 – Ongoing and future work
102
Workflow
The project aims to promote ADR reports identified in the ULSM to the regulatory authority,
through the following tasks:
Task #1: Design and implementation of an information system for the management of
information on drug safety.
Task #2: Integration in a single database of all the ADR detected at the institution (ULSM).
Task #2.1: Identification of databases that could include information about ADR
detected at ULSM.
Task #3: Submission of the ADR collected in the database referred in #2 to the regulatory
authority through the Northern Pharmacovigilance Centre.
Task #4: Feedback on ADR reports will be send to the reporters.
Expected results
As the main outcome, we have developed a functional information system on drug safety that
is being used at the institution.
The intervention impact will be measured on the number of ADR submitted to the regulatory
authority. In the last four years, healthcare professionals from ULSM reported about 22-43
ADR each ear, without a regular trend. As we strongly believe that, during daily activities, many
more ADR are detected by these healthcare professionals, so we expect that the number of
ADR submitted will increase by about 50% each year.
In addition to the number of ADR reports, an increase in relevance is also expected.
Established relevance criteria include ADR seriousness, ADR expectedness and the causality
degree attributed to the ADR.

Chapter 7 – Ongoing and future work
103
7.3 Social networks and portals for patients and healthcare
professionals
Internet users are increasing and many of them use the web for issues related to health.
According to Cybercitizen Health® Europe[97], in 2012, 72% of European online adult consumers
(ages over 18) were social health users (which means individuals that “have conducted any of
the following activities online for health within the past 12 months: used a community, group
or social networking website, or conducted any social-related activity online such as reading or
posting on health blogs, message boards or health ratings websites”). Additionally, 44% of
European online consumers use social networking for issues related to health, 33% read or
posted patient testimonials and 34% used health ratings or reviews.
To take advantage of this reality, it is important to adopt strategies to use the internet in the
promotion of pharmacovigilance and ADR reporting, using for this purpose social networks and
portals for patients and healthcare professionals.
Social networks are excellent media and can be used to disseminate information about
pharmacovigilance and drug safety issues. In 2011, Knezevic et al. studied the use of social
networks, such as Facebook®, to increase spontaneous ADR reporting. This study tested if the
creation of a group in Facebook® increased ADR detection and reporting by its members[65].
For this purpose, an open group (available to the general public) was created where regular
information about ADR was posted. During the experience period (seven months), 21 ADR
were reported, by 2% of the total group members (n=1034). Among the 1034 members, 370
provided their educational profile (88% had a university degree and 12% a high school degree).
For those with a university degree, 67% had a degree in medicine, dentistry or pharmacy.
None of the 21 ADR reported were serious or unexpected. Based on their results, the authors
stated that Facebook® can be useful for improving spontaneous ADR reporting.
In line with this, UFN created its own Facebook® page in October 2013, and currently stands at
876 “likes” (in april 2016). On this public page, we publish information about drug safety and
also about our events (open classes and post-graduate courses, among others). We also
publish images and messages promoting spontaneous ADR reporting and emphasising the
importance of this subject. In the future, we expect that this will be a source of debate about
ADR reports, with the creation of an online forum and maybe part of a study similar to the one
performed by Knezevic et al.[65]
.

Chapter 7 – Ongoing and future work
104
7.3.1 Creation of the personal area on the UFN website
Websites of pharmacovigilance centres and regulatory authorities are important for providing
information about drug safety and to promote ADR reporting, both by patients and healthcare
professionals. Some of these websites also provide online ADR reporting forms. In these cases,
it is essential that the provided form is simple, intuitive, quick to fill in and with few mandatory
fields. Otherwise, the experience of reporting may seem too complicated for the users and
discourage them [43].
Thus, we aimed to create a model of communication between our pharmacovigilance centre
and its reporters (health professionals) through our website. With this model, we wanted to
turn ADR reporting into an informative and motivating activity.
To develop this project, the first step was to redesign the former Northern Pharmacovigilance
Centre website, in order to make it more appealing and user-friendly (Figure 14 and Figure 15):
Figure 14. UFN website 2005-2016
Figure 15. UFN website 2016
The new website was launched on 18 January 2016. On the new website, we created a
reporter area dedicated to healthcare professionals. This area compiles all the ADR reports
submitted online by each healthcare professionals, and are only available after authentication,
to ensure the confidentiality.
Our aim was to provide our users also with feedback after submitting their ADR report. Each
healthcare professional will have access to a report that compiles the research results
generated by the ADR report. The search will be conducted using selected information
sources, each time a healthcare professional reports an ADR through the ADR online form. The
results of the searches will be presented in the form of ADR frequency, ADR absolute value,
ADR expectedness and percentage of ADR by age and gender.
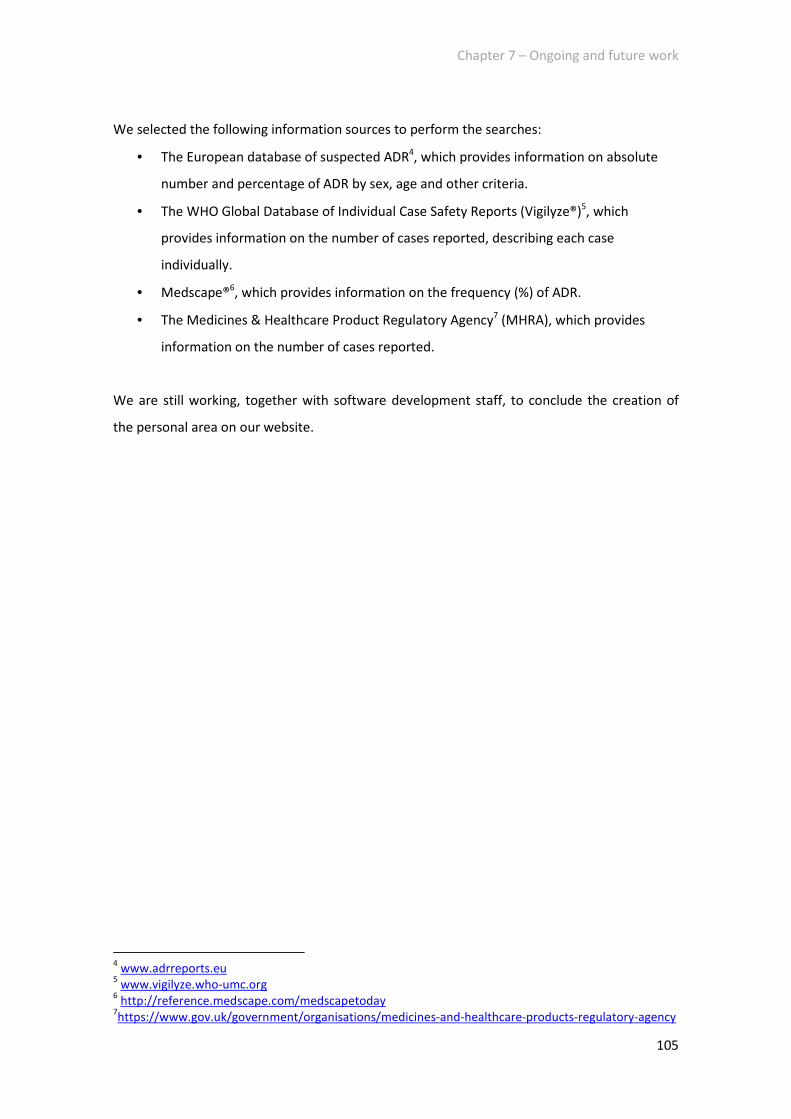
Chapter 7 – Ongoing and future work
105
We selected the following information sources to perform the searches:
• The European database of suspected ADR4, which provides information on absolute
number and percentage of ADR by sex, age and other criteria.
• The WHO Global Database of Individual Case Safety Reports (Vigilyze®)5, which
provides information on the number of cases reported, describing each case
individually.
• Medscape®6, which provides information on the frequency (%) of ADR.
• The Medicines & Healthcare Product Regulatory Agency7 (MHRA), which provides
information on the number of cases reported.
We are still working, together with software development staff, to conclude the creation of
the personal area on our website.
4 www.adrreports.eu
5 www.vigilyze.who-umc.org
6 http://reference.medscape.com/medscapetoday
7https://www.gov.uk/government/organisations/medicines-and-healthcare-products-regulatory-agency

Chapter 7 – Ongoing and future work
106
7.3.2 ADR online reporting form for consumers
In Portugal, consumers have been allowed to directly report their own suspected ADR since
July 2012 [76]. To facilitate the ADR reporting process among consumers, we have started to
develop an ADR report online form for consumers in Portugal, taking advantage of our website
redesign.
To develop the consumer’s online form, we used the printable form as a standard. The form
was carefully developed and adjusted for patient reporting. A heuristic evaluation of the form
was performed to obtain the final version, which is already finished (see Figure 16, designed by
Natacha Oliveira) and available on the Northern Pharmacovigilance Centre website[5].
Figure 16. Screen shot of the online patients reporting form (ADR screen).
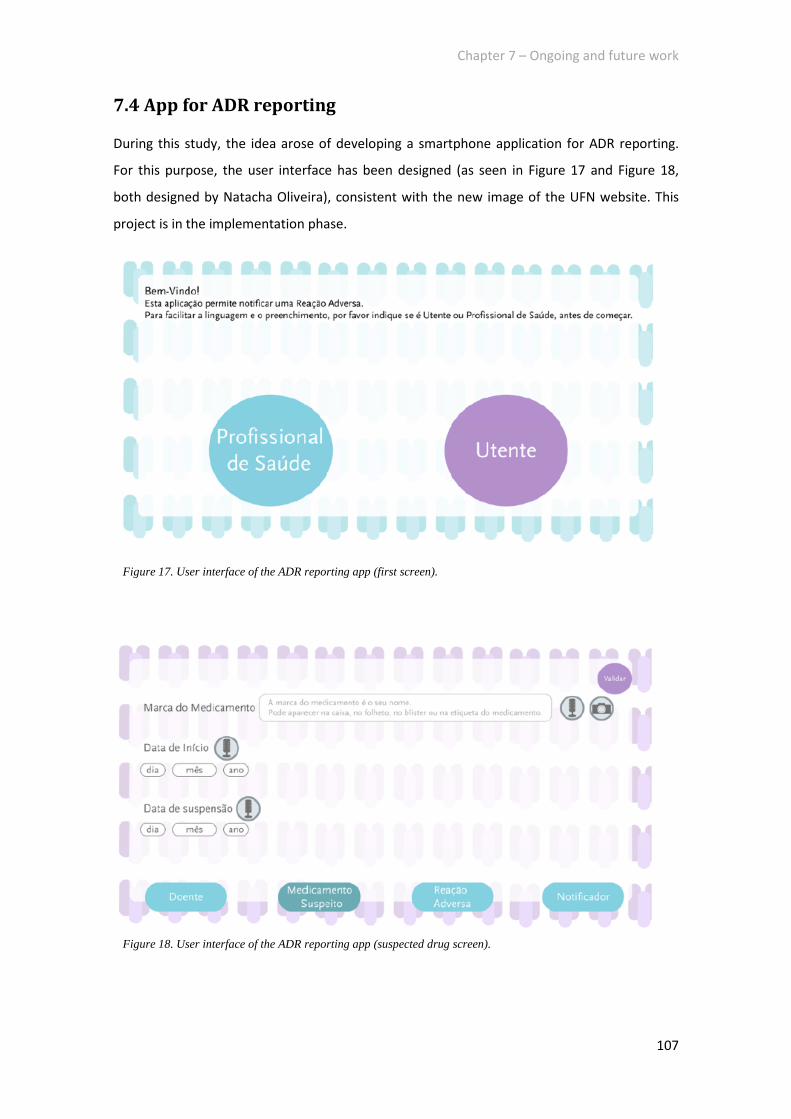
Chapter 7 – Ongoing and future work
107
7.4 App for ADR reporting
During this study, the idea arose of developing a smartphone application for ADR reporting.
For this purpose, the user interface has been designed (as seen in Figure 17 and Figure 18,
both designed by Natacha Oliveira), consistent with the new image of the UFN website. This
project is in the implementation phase.
Figure 17. User interface of the ADR reporting app (first screen).
Figure 18. User interface of the ADR reporting app (suspected drug screen).

108

Chapter 8 – Discussion
109
Chapter 8 – General discussion
These studies have allowed us to realise that much work can be done using informatics to
improve pharmacovigilance.
Worldwide underreporting of ADR is a major concern, and many institutions are aware that it
is feasible to use IS to improve ADR reporting. Currently, the most commonly used
technological platform is web-based and shows an increasing trend, but interventions within
electronic health records also have the potential to improve pharmacovigilance activities,
particularly ADR reporting. ADR directly reported by consumers (direct ADR reporting) is being
increasingly taken into account when the aim is to improve information on drug safety[98].
Most international studies that aimed to promote ADR reporting were developed in hospitals
and tailored to healthcare professionals. In fact, most serious ADR are detected in hospitals
and reported by healthcare professionals[72]. Additionally, in Europe, direct reporting (ADR
reported by patients) has only been allowed in all countries since 2012[76]. This may also
explain why most of the projects that target direct ADR reporting have only been recently
developed[65, 67, 71, 72].
As with most of international groups, we developed systems for the passive promotion of ADR
reporting because most busy healthcare professionals only submit their suspected ADR if it
does not increase their workload[55, 77]. Active promotion of ADR reporting is difficult and not
always ethically acceptable because no material reward can be given to the reporters. Thus,
projects have aimed to actively promote ADR reporting involving teaching sessions[50] or e-
mails containing ADR information[46, 57, 59, 72].
Based on our research, we believe that it would be useful to adopt systems to assist healthcare
professionals with completing ADR reporting within electronic health records because this
approach seems to be an efficient method to increase the ADR reporting rate[75]. When this
approach is not possible, it is essential to have tools that are easily accessible to healthcare
professionals (e.g. on the web) to report ADR. These tools can be promoted by sending emails
or through the inclusion of direct hyperlinks on healthcare professionals’ desktops, which is a
simple and cost-effective way to change the behaviour of healthcare professionals regarding
spontaneous ADR reporting, as seen in Chapters 3 and 4, and can be easily implemented and
disseminated in healthcare institutions[16].

Chapter 8 – Discussion
110
We also see as a promising solution the integration of pharmacovigilance databases within the
habitually used electronic health records, avoiding extra workload to submit an ADR, as
described in Chapter 5. ADR collected this way would then be sent to the relevant authority
through regional pharmacovigilance centres, which would provide feedback related to the
reported ADR. This strategy increased the ADR report rate in the studied group and could be
easily replicated among other healthcare groups.
Furthermore, we propose that pharmacovigilance websites can be explored to create personal
areas for each person that submits an ADR report, aiming to turn ADR reporting into a
motivating and informative activity. It should provide technical information about the reported
adverse reaction and the suspected drug, thereby improving feedback.
Besides the promotion of ADR reporting, Information Systems can also improve
pharmacovigilance routine activities by upgrading the communication between
pharmacovigilance centres and reporters. We have concluded that it is possible to accelerate
the process of causality assessment and subsequent feedback using Bayesian models (Chapter
6). We believe these models could be linked to the electronic reporting form, turning causality
assessments into a semi-automatic process, and it is our aim to perform such an intervention,
as future work, on our website.
Pharmacovigilance should adapt to technological developments, benefiting reporters (both
healthcare professionals and consumers) by facilitating the ADR reporting act and turning it
into a valuable and appealing activity. Additionally, Information Systems can benefit
pharmacovigilance staff, simplifying some of the required procedures, making them faster and,
where possible, semi-automatic.
Overall conclusion
Despite the fact that the personal area on our website is still being built jointly with the
software development staff (as described in sub-chapter 7.3.1), we can consider that the main
objectives of the thesis have been achieved. Having analysed several strategies to increase
ADR reporting (chapters 2 and 3), we have not only created a decision support system to
improve pharmacovigilance activities (chapter 6) but also developed new tools to facilitate
ADR reporting (three tools have been designed and two of which fully implemented, as seen in
chapters 4, 5 and sub-chapter 7.2).

References
111
References
1. OpenEHR. 2014 [09-2014]. Available from: www.openehr.org. 2. Health Level Seven International. 2014 [10-2014]. Available from: www.hl7.org. 3. Otero MJ, Domínguez-Gil A. Acontecimientos Adversos por Medicamentos: Una Patología Emergente. Farmacia hospitalaria : órgano oficial de expresión científica de la Sociedad Española de Farmacia Hospitalaria. 2000;24(4):258-66. 4. Classen DC, Pestotnik SL, Evans RS, Burke JP. Description of a computerized adverse drug event monitor using a hospital information system. Hospital pharmacy. 1992;27(9):776-83. 5. Northern Pharmacovigilance Centre. UFN 2015 [16-03-2015]. Available from: www.ufn.med.up.pt. 6. World Health Organization. The Uppsala Monitoring Centre Uppsala WHO Collaborating Centre for International Drug Monitoring [17 July 2015]. Available from: http://www.who-umc.org/DynPage.aspx?id=22682. 7. Hazell L, Shakir SA. Under-reporting of adverse drug reactions : a systematic review. Drug safety : an international journal of medical toxicology and drug experience. 2006;29(5):385-96. 8. Lasser K, Allen P, Woolhandler S, Himmlstein F, Wolfe S, Bor D. Timing of New Black Box Warnings and Withdrawals for Prescription Medications. Jama-Journal of the American Medical Association. 2002;287(17):2215-20. 9. Lexchin J. Is there still a role for spontaneous reporting of adverse drug reactions? CMAJ : Canadian Medical Association journal = journal de l'Association medicale canadienne. 2006;174(2):191-2. 10. McGettigan P, Golden J, Conroy RM, Arthur N, Feely J. Reporting of adverse drug reactions by hospital doctors and the response to intervention. British journal of clinical pharmacology. 1997;44(1):98-100. 11. Molokhia M, Tanna S, Bell D. Improving reporting of adverse drug reactions: Systematic review. Clinical epidemiology. 2009;1:75-92. 12. Lazarou J, Pomeranz BH, Corey PN. Incidence of adverse drug reactions in hospitalized patients: a meta-analysis of prospective studies. Jama-Journal of the American Medical Association. 1998;279(15):1200-5. 13. Pirmohamed M, James S, Meakin S, Green C, Scott AK, Walley TJ, et al. Adverse drug reactions as cause of admission to hospital: prospective analysis of 18 820 patients. BMJ (Clinical research ed). 2004;329(7456):15-9. 14. European Medicines Agency. European Medicines Agency 2014 [cited 2014 05-09-2014]. Available from: www.ema.europa.eu. 15. Decree-Law nº 176/2006 - Estatuto do Medicamento, DL nº 176/2006. 16. Ribeiro-Vaz I, Santos C, Da Costa-Pereira A, Cruz-Correia R. Promoting spontaneous adverse drug reaction reporting in hospitals using a hyperlink to the online reporting form: An ecological study in Portugal. Drug Safety. 2012;35(5):387-94. 17. Herdeiro MT, Ribeiro-Vaz I, Ferreira M, Polonia J, Falcao A, Figueiras A. Workshop- and telephone-based interventions to improve adverse drug reaction reporting: a cluster-randomized trial in Portugal. Drug safety : an international journal of medical toxicology and drug experience. 2012;35(8):655-65. 18. Ribeiro-Vaz I, Herdeiro MT, Polonia J, Figueiras A. Strategies to increase the sensitivity of pharmacovigilance in Portugal. Revista de saude publica. 2011;45(1):129-35. 19. Figueiras A, Herdeiro T, Polonia J, J GO. An educational intervention to improve physician reporting of adverse drug reactions: a cluster-randomized controlled trial. Jama-Journal of the American Medical Association. 2006;296(9):1086-93.

References
112
20. Herdeiro MT, Polonia J, Gestal-Otero JJ, Figueiras A. Improving the reporting of adverse drug reactions : a cluster-randomized trial among pharmacists in portugal. Drug safety : an international journal of medical toxicology and drug experience. 2008;31(4):335-44. 21. Nazario M, Feliu JF, Rivera GC. Adverse drug reactions: the San Juan Department of Veterans Affairs Medical Center experience. Hospital pharmacy. 1994;29(3):244-6, 9-50. 22. Harpaz R, Vilar S, DuMouchel W, Salmasian H, Haerian K, Shah NH, et al. Combing signals from spontaneous reports and electronic health records for detection of adverse drug reactions. Journal of the American Medical Informatics Association. 2013;20(3):413-9. 23. LePendu P, Iyer SV, Bauer-Mehren A, Harpaz R, Mortensen JM, Podchiyska T, et al. Pharmacovigilance using clinical notes. Clinical Pharmacology and Therapeutics. 2013;93(6):547-55. 24. Goldstein LH, Berlin M, Saliba W, Elias M, Berkovitch M. Founding an adverse drug reaction (ADR) network: A method for improving doctors spontaneous ADR reporting in a general hospital. Journal of clinical pharmacology. 2013;53(11):1220-5. 25. Pares Y, Declerck G, Hussain S, Ng R, Jaulent MC. Building a time-saving and adaptable tool to report adverse drug events. Studies in health technology and informatics. 2013;192:903-7. 26. Study Group of Inflammatory Bowel Disease. Grupo de Estudos da Doença Inflamatória Intestinal (GEDII) 2014 [cited 2014]. Available from: www.gedii.pt. 27. Ortega A, Aguinagalde A, Lacasa C, Aquerreta I, Fernandez-Benitez M, Fernandez LM. Efficacy of an adverse drug reaction electronic reporting system integrated into a hospital information system. Annals of Pharmacotherapy. 2008;42(10):1491-6. 28. Ricardo João Cruz-Correia, Pedro Pereira Rodrigues, Alberto Freitas, Filipa Canario Almeida, Rong Chen, Altamiro Costa-Pereira. Data Quality and Integration Issues in Electronic Health Records. In: Hristidis V, editor. Information Discovery on Electronic Health Records2009. p. 55-96. 29. Kilbridge PM, Classen DC. The informatics opportunities at the intersection of patient safety and clinical informatics. Journal of the American Medical Informatics Association. 2008;15(4):397-407. 30. Kilbridge PM, Noirot LA, Reichley RM, Berchelmann KM, Schneider C, Heard KM, et al. Computerized Surveillance for Adverse Drug Events in a Pediatric Hospital. Journal of the American Medical Informatics Association. 2009;16(5):607-12. 31. Levy M, Azaz-Livshits T, Sadan B, Shalit M, Geisslinger G, Brune K. Computerized surveillance of adverse drug reactions in hospital: Implementation. European Journal of Clinical Pharmacology. 1999;54(11):887-92. 32. Phansalkar S, Desai A, Choksi A, Yoshida E, Doole J, Czochanski M, et al. Criteria for assessing high-priority drug-drug interactions for clinical decision support in electronic health records. BMC Medical Informatics and Decision Making. 2013;13(1):65. 33. Abookire SA, Teich JM, Sandige H, Paterno MD, Martin MT, Kuperman GJ, et al. Improving allergy alerting in a computerized physician order entry system. Journal of the American Medical Informatics Association. 2000:2-6. 34. Osheroff JA, Teich JM, Middleton B, Steen EB, Wright A, Detmer DE. A roadmap for national action on clinical decision support. Journal of the American Medical Informatics Association. 2007;14(2):141-5. 35. Saxena K, Lung BR, Becker JR. Improving patient safety by modifying provider ordering behavior using alerts (CDSS) in CPOE system. AMIA - Annual Symposium proceedings / AMIA Symposium AMIA Symposium. 2011;2011:1207-16. 36. Rommers MK, Teepe-Twiss IM, Guchelaar HJ. A computerized adverse drug event alerting system using clinical rules: a retrospective and prospective comparison with conventional medication surveillance in the Netherlands. Drug safety : an international journal of medical toxicology and drug experience. 2011;34(3):233-42.

References
113
37. Rommers MK, Teepe-Twiss IM, Guchelaar HJ. Preventing adverse drug events in hospital practice: an overview. Pharmacoepidemiology and drug safety. 2007;16(10):1129-35. 38. Rommers MK, Zwaveling J, Guchelaar HJ, Teepe-Twiss IM. Evaluation of rule effectiveness and positive predictive value of clinical rules in a Dutch clinical decision support system in daily hospital pharmacy practice. Artificial intelligence in medicine. 2013;59(1):15-21. 39. Walker R, Edwards C. Clinical Pharmacy and Therapeutics. 3rd ed: Churchill Livingstone; 2003 40. Smith CC, Bennett PM, Pearce HM, Harrison PI, Reynolds DJ, Aronson JK, et al. Adverse drug reactions in a hospital general medical unit meriting notification to the Committee on Safety of Medicines. British journal of clinical pharmacology. 1996;42(4):423-9. 41. Classen DC, Pestotnik SL, Evans RS, Burke JP. Computerized surveillance of adverse drug events in hospital patients. 1991. Quality & safety in health care. 2005;14(3):221-5; discussion 5-6. 42. Bates DW, Evans RS, Murff H, Stetson PD, Pizziferri L, Hripcsak G. Detecting adverse events using information technology. J Am Med Inform Assoc. 2003;10(2):115-28. 43. Polimeni G, Russo A, Catania MA, Aiello A, Oteri A, Trifiro G, et al. Drug safety information through the internet: the experience of an Italian website. Drug safety : an international journal of medical toxicology and drug experience. 2009;32(3):245-53. 44. World Health Organization. The Uppsala Monitoring Centre Uppsala WHO Collaborating Centre for International Drug Monitoring [09 Aug 2013]. Available from: http://www.who-umc.org/DynPage.aspx?id=22682. 45. Neyeloff JL, Fuchs SC, Moreira LB. Meta-analyses and Forest plots using a microsoft excel spreadsheet: step-by-step guide focusing on descriptive data analysis. BMC Res Notes. 2012;5:52. 46. Jean-Pastor MJ, Affaton MF, Prost N, Rodor F. Pharmacovigilance information via electronic mail. Fundamental & Clinical Pharmacology. 2001;15:12. 47. Kataoka S, Ohe K, Mochizuki M, Ueda S. Developing and integrating an adverse drug reaction reporting system with the Hospital Information System. Yakugaku Zasshi-Journal of the Pharmaceutical Society of Japan. 2002;122(1):113-6. 48. Lee SB, Schepers GP, Goldberg KL. Electronic adverse-drug-reaction-reporting program. American Journal of Health-System Pharmacy. 2004;61(12):1230-3. 49. Basch E, Artz D, Dulko D, Scher K, Sabbatini P, Hensley M, et al. Patient online self-reporting of toxicity symptoms during chemotherapy. Journal of Clinical Oncology. 2005;23(15):3552-61. 50. Basch E, Artz D, Iasonos A, Speakman J, Shannon K, Lin K, et al. Evaluation of an online platform for cancer patient self-reporting of chemotherapy toxicities. Journal of the American Medical Informatics Association. 2007;14(3):264-8. 51. Basch E, Iasonos A, Barz A, Culkin A, Kris MG, Artz D, et al. Long-term toxicity monitoring via electronic patient-reported outcomes in patients receiving chemotherapy. Journal of Clinical Oncology. 2007;25(34):5374-80. 52. Olmsted SS, Grabenstein JD, Jain AK, Comerford W, Giambo P, Johnson P, et al. Use of an electronic monitoring system for self-reporting smallpox vaccine reactions. Biosecurity and Bioterrorism-Biodefense Strategy Practice and Science. 2005;3(3):198-206. 53. Olmsted SS, Grabenstein JD, Jain AK, Lurie N. Patient experience with, and use of, an electronic monitoring system to assess vaccination responses. Health Expectations. 2006;9(2):110-7. 54. Hinrichsen VL, Kruskal B, O'Brien MA, Lieu TA, Platt R, Vaccine Safety Datalink T. Using electronic medical records to enhance detection and reporting of vaccine adverse events. Journal of the American Medical Informatics Association. 2007;14(6):731-5.
References
114
55. Hickner J, Zafar A, Kuo GM, Fagnan LJ, Forjuoh SN, Knox LM, et al. Field test results of a new ambulatory care Medication Error and Adverse Drug Event Reporting System-MEADERS. Annals of Family Medicine. 2010;8(6):517-25. 56. Zafar A, Center APR, editors. MEADERS: Medication Errors and Adverse Drug Event Reporting system. AMIA - Annual Symposium proceedings/AMIA Symposium AMIA Symposium; 2007 Oct. 57. Johansson M-L, Brunloef G, Edward C, Wallerstedt SM. Effects of e-mails containing ADR information and a current case report on ADR reporting rate and quality of reports. European Journal of Clinical Pharmacology. 2009;65(5):511-4. 58. Daniels JP, King AD, Cochrane DD, Carr R, Shaw NT, Lim J, et al. A human factors and survey methodology-based design of a web-based adverse event reporting system for families. International Journal of Medical Informatics. 2010;79(5):339-48. 59. Lapphra K, Dobson S, Bettinger JA. Acceptability of Internet adverse event self-reporting for pandemic and seasonal influenza immunization among health care workers. Vaccine. 2010;28(38):6199-202. 60. Linder JA, Haas JS, Iyer A, Labuzetta MA, Ibara M, Celeste M, et al. Secondary use of electronic health record data: spontaneous triggered adverse drug event reporting. Pharmacoepidemiology and Drug Safety. 2010;19(12):1211-5. 61. Lynn RM, Riding K, McIntosh N. The use of electronic reporting to aid surveillance of ADRs in children: a proof of concept study. Archives of Disease in Childhood. 2010;95(4):262-5. 62. Zhao W, Waldman BD, Dillon C, Pauls K, Kim J, Patterson L, et al. A web-based medical safety reporting system for a large multicenter clinical trial: The ALIAS experience. Contemporary Clinical Trials. 2010;31(6):536-43. 63. Huang CY, Hsieh YW, Lin WL, Wu HC. The evaluation of ADR online reporting of radiopaque agents in a university hospital in Taiwan. Value in Health. 2010;13(7):A510. 64. Haw C, Cahill C. A computerized system for reporting medication events in psychiatry: the first two years of operation. Journal of Psychiatric and Mental Health Nursing. 2011;18(4):308-15. 65. Knezevic MZ, Bivolarevic IC, Peric TS, Jankovic SM. Using Facebook to increase spontaneous reporting of adverse drug reactions. Drug Safety. 2011;34(4):351-2. 66. Abadie D, Chebane L, Bert M, Durrieu G, Montastruc JL. Online reporting of adverse drug reactions: a study from a French regional pharmacovigilance center. Therapie. 2014;69(5):395-400. 67. Haber P, Iskander J, Walton K, Campbell SR, Kohl KS. Internet-based reporting to the vaccine adverse event reporting system: a more timely and complete way for providers to support vaccine safety. Pediatrics. 2011;127 Suppl 1:S39-44. 68. Barrow PL, Jadeja M, Foy M. Establishing Electronic Adverse Drug Reaction Reporting in UK Primary Care Clinical IT Systems. Drug Safety. 2012;35(10):909-10. 69. Lee J-H, Park KH, Moon HJ, Lee YW, Park J-W, Hong C-S. Spontaneous Reporting of Adverse Drug Reactions through Electronic Submission from Regional Society Healthcare Professionals in Korea. Yonsei Medical Journal. 2012;53(5):1022-7. 70. Yanqing J, Fangyang S, Tran J, editors. A High Performance Agent-Based System for Reporting Suspected Adverse Drug Reactions. Information Technology: New Generations (ITNG), 2012 Ninth International Conference; 16-18 April 2012. 71. Baron S, Goutard F, Nguon K, Tarantola A. Use of a text message-based pharmacovigilance tool in cambodia: Pilot study. Journal of Medical Internet Research. 2013;15(4). 72. Adams SA. Using patient-reported experiences for pharmacovigilance? Studies in health technology and informatics. 2013;194:63-8. 73. Pares Y, Declerck G, Hussain S, Ng R, Jaulent M-C. Building a time-saving and adaptable tool to report adverse drug events. Studies in health technology and informatics. 2013;192:903-7.
References
115
74. Canadell Vilarrasa L, Mota Almeida M, Almeida Perez RS, Torrent Pou J, Castillo Palomares L, Martin Marques M, et al. Electronic health record improves adverse drug reactions reports. International Journal of Clinical Pharmacy. 2013;35(6):1337. 75. Lander AR, Blicher TM, Jimenez-Solem E, Jespersen M, Kampmann JP, Christensen HR. Introducing an adverse drug event manager. European Journal of Hospital Pharmacy-Science and Practice. 2013;20(2):78-81. 76. Herdeiro MT, Ferreira M, Ribeiro-Vaz I, Junqueira Polonia J, Costa-Pereira A. [The portuguese pharmacovigilance system]. Acta Med Port. 2012;25(4):241-9. 77. Waller PC. Making the most of spontaneous adverse drug reaction reporting. Basic & Clinical Pharmacology & Toxicology. 2006;98(3):320-3. 78. World Health Organization. Importance of Pharmacovigilance. Geneve: World Health Organization; 2002. 79. Jacquot J GM, Baudrin D, Chastel X, Montastruc JL, Bagheri H. Could we improve notification of adverse drugs reactions in hospital? Assessment of 5 years of network PharmacoMIP's activities. Thérapie 2012;67(3):231-6. 80. Biagi C, Montanaro N, Buccellato E, Roberto G, Vaccheri A, Motola D. Underreporting in pharmacovigilance: an intervention for Italian GPs (Emilia-Romagna region). European journal of clinical pharmacology. 2013;69(2):237-44. 81. Khalili H, Mohebbi N, Hendoiee N, Keshtkar AA, Dashti-Khavidaki S. Improvement of knowledge, attitude and perception of healthcare workers about ADR, a pre- and post-clinical pharmacists' interventional study. BMJ open. 2012;2:e000367. 82. Pagotto C, Varallo F, Mastroianni P. Impact of educational interventions on adverse drug events reporting. International journal of technology assessment in health care. 2013;29(4):410-7. 83. Herdeiro MT, Figueiras A, Polonia J, Gestal-Otero JJ. Physicians' attitudes and adverse drug reaction reporting: a case-control study in Portugal. Drug safety : an international journal of medical toxicology and drug experience. 2005;28(9):825-33. 84. Herdeiro MT, Figueiras A, Polonia J, Gestal-Otero JJ. Influence of pharmacists' attitudes on adverse drug reaction reporting: a case-control study in Portugal. Drug safety : an international journal of medical toxicology and drug experience. 2006;29(4):331-40. 85. Bordet R, Gautier S, Le Louet H, Dupuis B, Caron J. Analysis of the direct cost of adverse drug reactions in hospitalised patients. European journal of clinical pharmacology. 2001;56(12):935-41. 86. Gautier S, Bachelet H, Bordet R, Caron J. The cost of adverse drug reactions. Expert Opinion on Pharmacotherapy. 2003;4(3):319-26. 87. Unidade de Farmacovigilância do Norte. Notificação de Reações Adversas 2004 [09-2010]. Available from: http://ufn.med.up.pt/notificacao/notificacao.php. 88. Farmacovigilância em Portugal. Lisboa: INFARMED - Autoridade Nacional do Medicamento e Produtos de Saúde, I.P.; 2004. 526 p. 89. Classen DC, Pestotnik SL, Evans RS, Burke JP. Computerized surveillance of adverse drug events in hospital patients (Reprinted from JAMA, vol 266, pg 2847-51, 1991). Quality & Safety in Health Care. 2005;14(3):221-5. 90. Bates DW, Evans RS, Murff H, Stetson PD, Pizziferri L, Hripcsak G. Detecting adverse events using information technology. Journal of the American Medical Informatics Association. 2003;10(2):115-28. 91. Ribeiro L, Cunha JP, Cruz-Correia RJ. Information systems heterogeneity and interoperability inside hospitals - A Survey. HealthInf 2010; Valencia, Spain2010. p. 337-43. 92. Figueiras A, Herdeiro MT, Polónia J, Gestal-Otero JJ. An educational intervention to improve physician reporting of adverse drug reactions: a cluster-randomized controlled trial. Jama-Journal of the American Medical Association. 2006;296(9):1086-93. 93. Pedros C, Vallano A, Cereza G, Mendoza-Aran G, Agusti A, Aguilera C, et al. An intervention to improve spontaneous adverse drug reaction reporting by hospital physicians: a
References
116
time series analysis in Spain. Drug safety : an international journal of medical toxicology and drug experience. 2009;32(1):77-83. 94. Christensen E, Curbera F, Meredith G, Weerawarana S. Web services description languade (WSDL) 1.1 2001. Available from: http://www.w3.org/TR/wsdl. 95. World Health Organization. WHO Collaborating Centre for Drug Statistics Methodology 2014 [cited 2015 03-2015]. Available from: http://www.whocc.no/. 96. Agbabiaka TB, Savovic J, Ernst E. Methods for causality assessment of adverse drug reactions - A systematic review. Drug Safety. 2008;31(1):21-37. 97. manhattanRESEARCH. manhattanRESEARCH 2011 [cited 2014]. Available from: http://manhattanresearch.com/. 98. Ribeiro-Vaz I, Silva AM, Costa Santos C, Cruz-Correia R. How to promote adverse drug reaction reports using information systems - a systematic review and meta-analysis. BMC medical informatics and decision making. 2016;16(1):27.

117
Annex
118
6
Annex
This annex contains reprints of all the published papers included in this thesis, as follows:
1. Inês Ribeiro-Vaz, Fabrício Alves Barbosa Silva, Ana-Marta Matos Silva, Domingos Alves,
Cruz-Correia R. Pharmacovigilance informatics. In: Maria Manuela Cruz-Cunha, Isabel
Maria Miranda, Ricardo Martinho, Rijo R, editors. Encyclopedia of E-health and
telemedicine: IGI Global; 2016. p. 299-315.
2. Ribeiro-Vaz I, Silva AM, Costa Santos C, Cruz-Correia R. How to promote adverse drug
reaction reports using information systems - a systematic review and meta-analysis.
BMC Medical Informatics and Decision Making. 2016;16(1):27.
3. Ribeiro-Vaz I, Santos CC, Cruz-Correia R. Promoting adverse drug reaction reporting:
comparison of different approaches. Rev Saude Publica. 2016;50:14.
4. Ribeiro-Vaz I, Santos C, Da Costa-Pereira A, Cruz-Correia R. Promoting spontaneous
adverse drug reaction reporting in hospitals using a hyperlink to the online reporting
form: An ecological study in Portugal. Drug Safety. 2012;35(5):387-94.
5. Ribeiro-Vaz I, Correia RJC (2016) Using Web Services to Link Electronic Clinical Records
to Pharmacovigilance Databases. Int J Pharmacovigil 1(1): 4.
This annex also contains the approval document of the local Ethics Committee of the Faculty of
Medicine of the University of Porto (Process PCEDCSS-FMUP 08/2014, approved in May 7,
2014).

Encyclopedia of E-Health and Telemedicine
Maria Manuela Cruz-CunhaPolytechnic Institute of Cávado and Ave, Portugal & Algoritmi Research
Centre, Portugal
Isabel Maria MirandaCâmara Municipal de Guimarães, Portugal
Ricardo MartinhoPolytechnic Institute of Leiria, Portugal & CINTESIS - Center for Research in
Health Technologies and Information Systems, Portugal
Rui RijoPolytechnic Institute of Leiria, Portugal & INESCC - Institute for Systems
and Computers Engineering at Coimbra, Portugal & CINTESIS - Center for Research in Health Technologies and Information Systems, Portugal

Published in the United States of America by Medical Information Science Reference (an imprint of IGI Global)701 E. Chocolate AvenueHershey PA, USA 17033Tel: 717-533-8845Fax: 717-533-8661 E-mail: [email protected] site: http://www.igi-global.com
Copyright © 2016 by IGI Global. All rights reserved. No part of this publication may be reproduced, stored or distributed in any form or by any means, electronic or mechanical, including photocopying, without written permission from the publisher.Product or company names used in this set are for identification purposes only. Inclusion of the names of the products or companies does not indicate a claim of ownership by IGI Global of the trademark or registered trademark. Library of Congress Cataloging-in-Publication Data
British Cataloguing in Publication DataA Cataloguing in Publication record for this book is available from the British Library.
All work contributed to this book is new, previously-unpublished material. The views expressed in this book are those of the authors, but not necessarily of the publisher.
For electronic access to this publication, please contact: [email protected].
Names: Cruz-Cunha, Maria Manuela, 1964- editor. | Miranda, Isabel Maria, 1954- editor. | Martinho, Ricardo, 1974- editor. | Rijo, Rui, editor. Title: Encyclopedia of E-health and telemedicine / Maria Manuela Cruz-Cunha, Isabel Maria Miranda, Ricardo Martinho, and Rui Rijo, editors. Description: Hershey, PA : Medical Information Science Reference, 2016. | Includes bibliographical references and index. Identifiers: LCCN 2015051069| ISBN 9781466699786 (hardcover) | ISBN 9781466699793 (ebook) Subjects: LCSH: Medical care--Technological innovations--Encyclopedias. | Medical informatics--Encyclopedias. Classification: LCC R858 .E518 2016 | DDC 610.28503--dc23 LC record available at http://lccn.loc.gov/2015051069

D
299
Copyright © 2016, IGI Global. Copying or distributing in print or electronic forms without written permission of IGI Global is prohibited.
Category: Developments and Solutions
DOI: 10.4018/978-1-4666-9978-6.ch025
INTRODUCTION TO PHARMACOVIGILANCE INFORMATICS
All medicines have adverse effects, most of them unknown until the drug commercialization. As so, it is crucial to keep strategies to monitor the drug safety. Pharmacovigilance is the activity of drug surveil-lance, after its launch in the market, with the main goal of public health protection, ensuring that the drug benefit outweighs its risks. Worldwide, pharmacovigilance systems are mostly based on spontaneous Adverse Drug Reactions (ADR) reports made by healthcare professionals and consumers. Spontane-ous ADR reporting has been described as an essential method to detect drug safety signals; however, underreporting is a major issue undermining the effectiveness of spontaneous reports. Several studies suggest that less than 10% of detected ADR are effectively reported to medicines regulatory authorities [e.g. Food and Drug Administration (FDA), European Medicines Agency (EMA), etc] (Hazell & Shakir, 2006; McGettigan, Golden, Conroy, Arthur, & Feely, 1997).
Tools used in pharmacovigilance are continually evolving and, worldwide, Information Systems (IS) to promote ADR reporting or to detect ADR occurred in healthcare institutions have been tested and used, such as software that allow voluntary and automated detection of ADR, tools that analyse clinical databases or Web sites that actively inform healthcare professionals (Molokhia, Tanna, & Bell, 2009).
In addition to the signal detection, ICT can also be used to encourage and facilitate reporting of suspected ADR, such as the creation of on-line reporting forms, development of tools to collect safety data from electronic health records (EHR), among others.
In this chapter, it will be described some tools to automatically detect ADR, or encourage ADR spontaneous report.
BACKGROUND ON PHARMACOVIGILANCE
Adverse Drug Reactions (ADR) defined as a response to a medicinal product which is noxious and unintended (WHO) are a well-recognized public health problem worldwide, and a major cause of death
Pharmacovigilance Informatics
Inês Ribeiro-VazNorthern Pharmacovigilance Centre, Portugal
Fabrício Alves Barbosa SilvaOswaldo Cruz Foundation, Brazil
Ana-Marta Matos SilvaNorthern Pharmacovigilance Centre, Portugal
Domingos AlvesFaculty of Medicine of Ribeirão Preto (USP), Brazil
Ricardo Cruz-CorreiaCentre for Health Technology and Services Research, Portugal

Pharmacovigilance Informatics
300
and hospitalization in developed countries(Lazarou, Pomeranz, & Corey, 1998). It is estimated that about 6,5% of the hospitalizations are related to ADR(Pirmohamed et al., 2004). Besides, in the USA, about 100.000 people die each year due to ADR(Lazarou et al., 1998), and in Europe this annual mortality rate increases to 197.000(European Medicines Agency, 2014). ADR can be expressed in many ways and with different degrees of seriousness. An anaphylactic shock caused by penicillin is an example of a serious ADR (a serious ADR is any untoward medical occurrence that at any dose: results in death, requires inpatient hospitalisation or prolongation of existing hospitalisation, results in persistent or significant disability/incapacity or is life-threatening(WHO). Another type of ADR, not always recognized as such, is the drug ineffectiveness, for example, a vaccination failure. This can be (or not) related with a product quality issue and should be reported when detected in order to allow the regulatory authorities to take appropriate decisions.
Rare and long term ADR are difficult to detect during the drug development stage. Only when the drug begins to be used by a large population after marketing authorization it is possible to detect new ADR not previously identified during clinical trials. In reality, it is known that the safety of a new drug cannot be established until it has been on the market for several years(Lasser et al., 2002). Exceptionally, in a pandemic scenario, drug launch is urgent and, in this particular case, can be justifiable that drug safety profile is not well established. In this scenarios, it is even more important that all the detected ADR are reported (serious or not, expected or not). It is, therefore, essential to keep drugs under close surveillance, after its commercialization, through a pharmacovigilance system, to continuously evaluate their safety profile. In most of the European countries, pharmacovigilance system is based on spontane-ous ADR reports, which is passive method, made by healthcare professionals and, since July 2012, also by consumers (Ministério da Saúde, 2006). These reports can be made using paper, telephone, e-mail or through an on-line form and consist of a description of an Adverse Event (AE) apparently caused by a medicine.
To reverse the problem of underreporting of ADR, which is felt in most developed countries, several strategies have been tested(M. T. Herdeiro et al., 2012; McGettigan et al., 1997; Ribeiro-Vaz, Santos, da Costa-Pereira, & Cruz-Correia, 2012). Particularly, some studies were developed focused on educational interventions to raise awareness on the importance of ADR reporting(Figueiras A., Herdeiro T, Polonia J, & JJ, 2006; M. T. Herdeiro, Polonia, Gestal-Otero, & Figueiras, 2008; Ribeiro-Vaz, Herdeiro, Polonia, & Figueiras, 2011) and showed to be very effective increasing the quantity and relevance of spontane-ous ADR reports (among health professionals). However, these studies involved a large financial and personal outlay and the authors concluded that the effect was lost after a few months(McGettigan et al., 1997; Nazario, Feliu, & Rivera, 1994).
In a recent American study, the authors developed a signal-detection strategy that combines the Adverse Event Reporting System (AERS) of the regulatory Authority (FDA) and EHR, by requiring signaling in both sources, with promising results(Harpaz et al., 2013). Another study used the unstructured clinical notes included in EHR to detect ADR through a computerized system. The authors concluded that data mining can be used for hypothesis generation and for rapid analysis of suspected AE risk(LePendu et al., 2013).
With a similar aim, a recent study used a physician’s network, created through a mailing list, to send regular emails to doctors, with humorous component attached with informative component, recalling the importance of reporting their suspected ADR(Goldstein, Berlin, Saliba, Elias, & Berkovitch, 2013). The results showed that this type of intervention has impact on the number of ADR reports made by these professionals (the study did not assess the relevance of reported ADR). In France, it is being done a work that tries to facilitate the act to ADR report, habitually considered a tedious process by health

D
Category: Developments and Solutions
301
professionals. The authors are using the information contained in EHR to make the semi-automatic filling of ADR notification forms. The objectives of this ongoing study is to increase the rate of ADR report, as well as improving the quality of information submitted to regulatory authorities(Pares, Declerck, Hussain, Ng, & Jaulent, 2013).
INFORMATION SYSTEMS IN PHARMACOVIGILANCE
Issues, Controversies, and Problems
Although some authors consider that ADR spontaneous reports suffers from latency and inconsistency, it is still considered as the most valuable method to early detect drugs safety problems. In fact, most of the decisions concerning to drug safety are triggered by daily ADR spontaneous reports. As so, Regula-tory Authorities consider as crucial importance to achieve the greatest number of ADR reports possible and with high data quality.
The promotion of ADR report among healthcare professionals is a huge task, as it is necessary to regularly recall the importance of ADR reporting and, simultaneously, develop tools to facilitate this duty. Pharmacovigilance centres worldwide develop several strategies to continuously promote the importance of ADR reporting, as workshops, post-graduate courses, and also to make it easier, as development of online reporting forms, inclusion of electronic reporting systems into the Hospital Information Systems (HIS), direct hyperlinks to online reporting forms, among others.
Along with the promotion of spontaneous ADR reporting, some systems are being tested to detect signals of adverse reactions in large databases, as hospitals databases, epidemiologic databases, or even among social networks.
Although the adoption of different strategies, it is consensual the need to obtain the highest quantity and quality of information about the safety of marketed drugs, for the protection of public health.
Another important issue in this field is the need to discuss/harmonize what should be recorded dur-ing an ADR report.
When analyzed the databases from the FDA, EMA and the Portuguese Northern Pharmacovigilance Centre (UFN), all of them with the same purpose of recording ADR reports, it was possible to realize that the variables are different between the 3 databases, as seen in the Table 1.
For example, the concept of outcome for the FDA form as a similar meaning to the concept of seri-ousness for the two European databases analyzed. On the other hand, for these two databases, outcome means the evolution of the patient regarding the adverse scenario.
Active debate is maintained about this subject. The authors participate in some discussion groups, both national and internationally [namely the FHIR/OpenEHR(OpenEHR, 2014) and HL7(Health Level Seven, 2014) working groups], aiming to create a standard to the information that should be kept during the ADR registry.
Authors also participate, in June 2014, in the HL7 pharmacy group meeting, where was discussed the International Organization for Standardization (ISO) draft of international standard for ‘Requirements for electronic prescriptions’. This document is still under discussion until February 2015.
The last OpenEHR discussion took place in July 2014 and was focused in the ADR definition, its characteristics and what should be kept for the registration of a suspected ADR. At the moment, it is in discussion the clinical content of the Archetype Adverse Reaction (FHIR/OpenEHR). Variables as substance, status, seriousness, reaction type, certainty are under debate.

Pharmacovigilance Informatics
302
Table 1. Comparison of the variables included in 3 pharmacovigilance databases (Food and Drug Ad-ministration: FDA; European Medicines Agency: EMA and Portuguese Northern Pharmacovigilance Centre: UFN), grouped in main entities/sections (patients, problems, products and reporters)
Section Variable FDA EMA UFN
Patient Patient identifier ✓ ✓ ✓
Age at the time of event ✓ ✓ ✓
Date of birth ✓ ✓ ✓
Sex ✓ ✓ ✓
Weight ✓ ✓ ✓
Problem What kind of AE, product problem or error did you encounter?
• Adverse event • Product use error • Product problem • Problem with Different Manufacturer of the Same Medicine
--- ---
Outcomes Attributed to AE • Death • Life-threatening • Congenital anomaly/birth defect • Disability or permanent damage • Hospitalization • Required intervention to prevent permanent impairment/damage • Other serious
• Fatal • Not recovered • Recovered with sequelae • Recovering • Recovered • Unknown
• Fatal • Not recovered • Recovered with sequelae • Recovering • Recovered • Unknown
ADR Seriousness --- • Yes • No
• Death • Life-threatening • Congenital anomaly • Results in persistent or significant incapacity • Hospitalization • Other serious
Date of event ✓ ✓ ✓
Describe events, problem, or product use error
✓ ✓ ✓
Relevant test/laboratory data, including dates
✓ --- ---
Product Product name ✓ ✓ ✓
Label strength ✓ ✓ ✓
Manufacturer ✓ ✓ ✓
Date of use ✓ ✓ ✓
Reason for use ✓ ✓ ✓
Problem went away after use stopped or dose reduced?
• Yes • No • Does not apply
--- ✓
Problem returned after person started taking or using the product again?
• Yes • No • Does not apply
--- ✓
Do you still have the product in case we need to evaluate it?
• Yes • No • Returned to Manufacturer on
--- ---
Reporter Reporter name ✓ --- ✓
Address ✓ ✓ ✓
✓or list of options: Variable exists; ---: Variable does not exist

D
Category: Developments and Solutions
303
PROPOSED SOLUTIONS AND RECOMMENDATIONS
Promotion of Adverse Drug Reaction Reporting
Integration with IS (Patient Records, Multi-Center Research Projects)
Integration of pharmacovigilance system databases with other healthcare IS seems to be an obvious way to improve the knowledge about drugs safety. In fact, healthcare providers insert a lot of information in their EHR about ADR, which is not shared with pharmacovigilance systems. Every approach that promotes drug safety surveillance without increasing the workload of healthcare professionals, one of the main reasons for not reporting ADR, should be considered.
The creation and implementation of webservices to collect this information is one of the possible solutions for this problem. This solution is being tested in a Portuguese multi-center research project, in the field of gastric diseases(Study Group of Inflammatory Bowel Disease, 2014), with promising preliminary results (5% of all of the ADR reports received in the 1st semester of 2014 were collected by webservice). In this case, the physicians insert the usual clinic information during the appointment with the patient, and then, they only have to authorize the transmission of anonymized information about drug-related problems to the pharmacovigilance system. This tool allows ADR reporting without the need to fill the ADR reporting form and with no additional administrative work for the physician other than the normal registry of clinic patient data.
This solution is also available to be included in commercial prescription software. For the implemen-tation of these webservices, it was necessary to map the form entries used by the doctors with the online ADR reporting form developed by the pharmacovigilance system, so that the information is correctly collected. This mapping would be easier if a standard as the one described in the previous section was already in use.
An ADR electronic reporting system included into a HIS was developed in a Spanish hospital(Ortega et al., 2008), allowing healthcare professionals (pharmacists, physician and nurses) to report suspected ADR through their usual IS. The biggest advantage of this system is that some data (already included in the IS) appears as default values into the form, which expedites the system and reduces transcription errors(Cruz-Correia et al., 2009). All the reports made by this system are reviewed by a pharmacist, which is responsible to confirm the included data and to report the case to pharmacovigilance system. This might be a disadvantage, as some cases may be lost and not actually sent to regulatory authorities.
Another strategy that can be easily adopted is the inclusion of hyperlinks in the EHR to the online ADR reporting form. This solution was tested between 2006 and 2010, in an ecological study performed in 16 Portuguese hospitals centres(Ribeiro-Vaz et al., 2012). The hyperlinks were included in either EHR or on computer desktops. Considering the hospitals with hyperlink included in the EHR, the median ADR reports per month significantly increased, from two (range 0–12) to five reports (range 1–17). The median of ADR reports per month using the online form also increased significantly, from one (range 0–5) before the intervention to four (range 1–17) after it. Moreover, serious ADR increased 3-fold, and non-previously described ADR increased 4.5-fold. None of these significant increases were observed in the hospitals where the hyperlink was not installed. It was also found a significant increase in daily pharmacovigilance centre website visits, from ten before the intervention to 27 after it (p<0.001). The increase in ADR reporting shows that the inclusion of hyperlinks to online ADR reporting forms is an easy way to change health professional behavior with regard to spontaneous ADR reports. Furthermore, this solution seems to be cost effective, when compared with other strategies to increase ADR report,

Pharmacovigilance Informatics
304
as it has no running costs (after the hyperlink implementation, there are no additional costs to the phar-macovigilance system).
Clinical Decision Support and Alerting Systems
Informatics can be used in pharmacovigilance activities to support and alert healthcare professionals during their daily work. With the IS extensively used in health care institutions, all the improvements that can enhance patient safety should be taken into account. Clinical Decision Support Systems (CDSS), providing intelligently filtered knowledge in real-time, should be used in this area to improve public health and health care(Kilbridge & Classen, 2008). Besides, systems that triggered alerts of possible ADR can also be integrated in the IS with the same goal.
Many systems are used and tested worldwide to alert health providers about suspected ADR, which can help in the detection of drug safety problems. The exploitation of computer programs used in hos-pitals as a support in the detection of possible ADR(Classen, Pestotnik, Evans, & Burke, 1992; Otero & Domínguez-Gil, 2000) is one of these systems. With this purpose, work has been developed in order to create lists of drugs used as ADR signals to support the detection of ADR in hospitals. The included drugs were chosen as they are mostly used as antidotes or therapeutic interventions for possible ADR. Furthermore, there are also lists of diagnosis that triggers an alert for possible ADR in the computer systems. These diagnoses indicate diseases that are mainly caused by drugs and, therefore, are signals of possible ADR. Besides the drugs and diagnosis, also laboratory values can help in ADR detection. In fact, some ADR are characterized by laboratory abnormalities, so the monitoring of these values can be an improvement in the promotion of drug safety among hospitalized patients.
The main goal is to incorporate the described lists in the software used in the hospital pharmacies in order to be triggered an ADR alert each time an alerting drug is prescribed, or each time an alerting diagnosis is made or even each time a laboratory result reaches a suspected toxicity value(Kilbridge et al., 2009; Levy et al., 1999).
It has been advocated that EHR should be provided with CDSS in order to maximize its benefits to patient safety(Kilbridge & Classen, 2008). These CDSS are being used to inform physicians during the prescription about identified drug-drug interactions(Phansalkar et al., 2013), patient allergies(Abookire et al., 2000) or to support the prescribing decision(Osheroff et al., 2007; Saxena, Lung, & Becker, 2011). CDSS integrated in the computerized physician order entry (CPOE) can effectively prevent potential harmful medication errors and ADR (Rommers, Teepe-Twiss, & Guchelaar, 2007, 2011).
In particular, a Dutch CDSS is being in use at the hospital pharmacy to support hospital pharmacist to select patients at risk of ADR, and its effectiveness was evaluated(Rommers, Zwaveling, Guchelaar, & Teepe-Twiss, 2013). For this purpose, the system retrieves data from IS, and uses clinical rules. Dur-ing the study period, the CDSS generated 2650 safety alerts, 270 (10%) of them were considered as relevant. In these cases, the pharmacist contacted the physician or nurse and in 204 (76%) cases this led to an advice to prevent a possible ADR. Most alerts were generated with clinical rules linking pharmacy and laboratory data (1685 alerts).
Detection of Adverse Drug Reactions
Data mining is a general term for computerised extraction of potentially interesting patterns from large data sets, often based on statistical algorithms (WHO). Is an active method that complements the phar-macovigilance system (Harpaz et al., 2012).
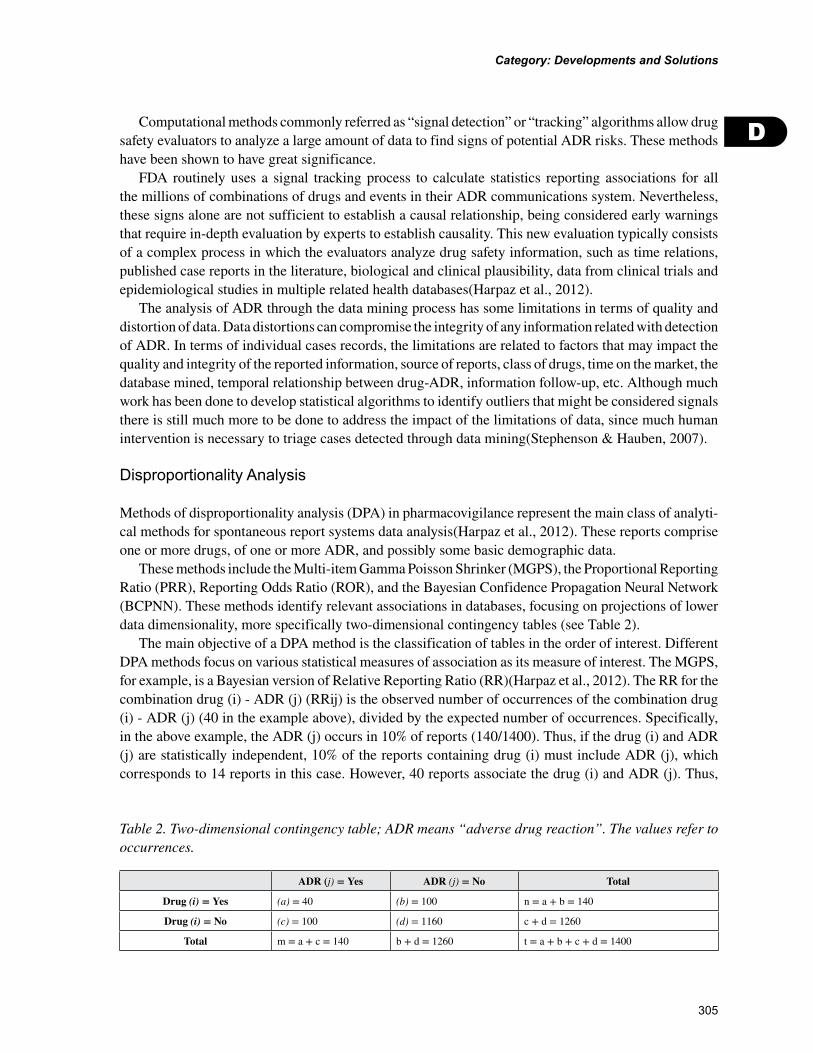
D
Category: Developments and Solutions
305
Computational methods commonly referred as “signal detection” or “tracking” algorithms allow drug safety evaluators to analyze a large amount of data to find signs of potential ADR risks. These methods have been shown to have great significance.
FDA routinely uses a signal tracking process to calculate statistics reporting associations for all the millions of combinations of drugs and events in their ADR communications system. Nevertheless, these signs alone are not sufficient to establish a causal relationship, being considered early warnings that require in-depth evaluation by experts to establish causality. This new evaluation typically consists of a complex process in which the evaluators analyze drug safety information, such as time relations, published case reports in the literature, biological and clinical plausibility, data from clinical trials and epidemiological studies in multiple related health databases(Harpaz et al., 2012).
The analysis of ADR through the data mining process has some limitations in terms of quality and distortion of data. Data distortions can compromise the integrity of any information related with detection of ADR. In terms of individual cases records, the limitations are related to factors that may impact the quality and integrity of the reported information, source of reports, class of drugs, time on the market, the database mined, temporal relationship between drug-ADR, information follow-up, etc. Although much work has been done to develop statistical algorithms to identify outliers that might be considered signals there is still much more to be done to address the impact of the limitations of data, since much human intervention is necessary to triage cases detected through data mining(Stephenson & Hauben, 2007).
Disproportionality Analysis
Methods of disproportionality analysis (DPA) in pharmacovigilance represent the main class of analyti-cal methods for spontaneous report systems data analysis(Harpaz et al., 2012). These reports comprise one or more drugs, of one or more ADR, and possibly some basic demographic data.
These methods include the Multi-item Gamma Poisson Shrinker (MGPS), the Proportional Reporting Ratio (PRR), Reporting Odds Ratio (ROR), and the Bayesian Confidence Propagation Neural Network (BCPNN). These methods identify relevant associations in databases, focusing on projections of lower data dimensionality, more specifically two-dimensional contingency tables (see Table 2).
The main objective of a DPA method is the classification of tables in the order of interest. Different DPA methods focus on various statistical measures of association as its measure of interest. The MGPS, for example, is a Bayesian version of Relative Reporting Ratio (RR)(Harpaz et al., 2012). The RR for the combination drug (i) - ADR (j) (RRij) is the observed number of occurrences of the combination drug (i) - ADR (j) (40 in the example above), divided by the expected number of occurrences. Specifically, in the above example, the ADR (j) occurs in 10% of reports (140/1400). Thus, if the drug (i) and ADR (j) are statistically independent, 10% of the reports containing drug (i) must include ADR (j), which corresponds to 14 reports in this case. However, 40 reports associate the drug (i) and ADR (j). Thus,
Table 2. Two-dimensional contingency table; ADR means “adverse drug reaction”. The values refer to occurrences.
ADR (j) = Yes ADR (j) = No Total
Drug (i) = Yes (a) = 40 (b) = 100 n = a + b = 140
Drug (i) = No (c) = 100 (d) = 1160 c + d = 1260
Total m = a + c = 140 b + d = 1260 t = a + b + c + d = 1400
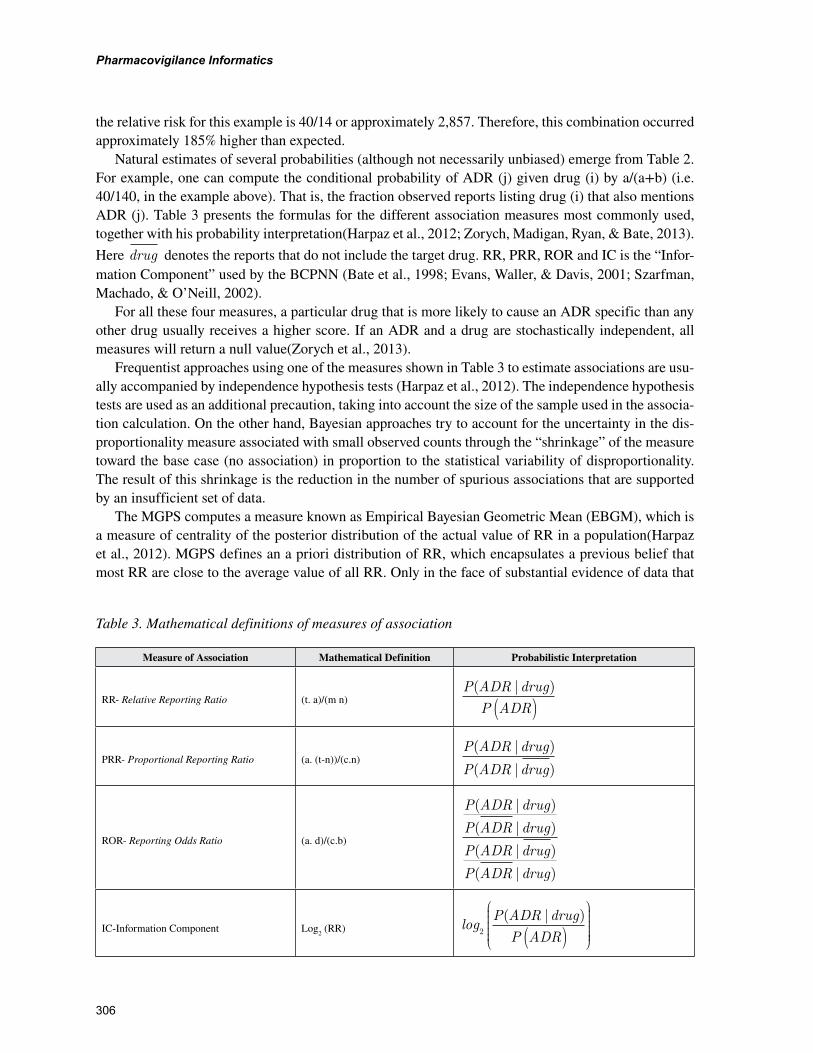
Pharmacovigilance Informatics
306
the relative risk for this example is 40/14 or approximately 2,857. Therefore, this combination occurred approximately 185% higher than expected.
Natural estimates of several probabilities (although not necessarily unbiased) emerge from Table 2. For example, one can compute the conditional probability of ADR (j) given drug (i) by a/(a+b) (i.e. 40/140, in the example above). That is, the fraction observed reports listing drug (i) that also mentions ADR (j). Table 3 presents the formulas for the different association measures most commonly used, together with his probability interpretation(Harpaz et al., 2012; Zorych, Madigan, Ryan, & Bate, 2013). Here drug denotes the reports that do not include the target drug. RR, PRR, ROR and IC is the “Infor-mation Component” used by the BCPNN (Bate et al., 1998; Evans, Waller, & Davis, 2001; Szarfman, Machado, & O’Neill, 2002).
For all these four measures, a particular drug that is more likely to cause an ADR specific than any other drug usually receives a higher score. If an ADR and a drug are stochastically independent, all measures will return a null value(Zorych et al., 2013).
Frequentist approaches using one of the measures shown in Table 3 to estimate associations are usu-ally accompanied by independence hypothesis tests (Harpaz et al., 2012). The independence hypothesis tests are used as an additional precaution, taking into account the size of the sample used in the associa-tion calculation. On the other hand, Bayesian approaches try to account for the uncertainty in the dis-proportionality measure associated with small observed counts through the “shrinkage” of the measure toward the base case (no association) in proportion to the statistical variability of disproportionality. The result of this shrinkage is the reduction in the number of spurious associations that are supported by an insufficient set of data.
The MGPS computes a measure known as Empirical Bayesian Geometric Mean (EBGM), which is a measure of centrality of the posterior distribution of the actual value of RR in a population(Harpaz et al., 2012). MGPS defines an a priori distribution of RR, which encapsulates a previous belief that most RR are close to the average value of all RR. Only in the face of substantial evidence of data that
Table 3. Mathematical definitions of measures of association
Measure of Association Mathematical Definition Probabilistic Interpretation
RR- Relative Reporting Ratio (t. a)/(m n)P ADR drug
P ADR
( | )
( )
PRR- Proportional Reporting Ratio (a. (t-n))/(c.n)P ADR drug
P ADR drug
( | )
( | )
ROR- Reporting Odds Ratio (a. d)/(c.b)
P ADR drug
P ADR drug
P ADR drug
P ADR drug
( | )
( | )
( | )
( | )
IC-Information Component Log2 (RR) logP ADR drug
P ADR2
( | )
( )

D
Category: Developments and Solutions
307
the MGPS outputs an RR that is substantially greater than one. For example, a RR=1000 that derives from an observed count of a=1 (see Table 3) can result in an estimate of RR-MGPS (corresponding to EBGM) of 1.5 (i.e. the value of the RR is shrunk to a value near 1), while a RR=1000 that derives from an observed count of a=100 may result in EBGM estimate of approximately 1000. For the specific Bayesian configuration used by MGPS, numbers of reports of value greater than 10 results in estimates of RR which normally receive virtually no reduction, although in practice this depends on the threshold values used(Hauben, 2004; Hauben & Reich, 2004; Hauben & Zhou, 2003). Typically, ad-hoc thresh-olds are applied to the association measures in order to highlight strong associations. The thresholds selected usually do not have theoretical or empirical justification(Harpaz et al., 2012). Rather, they are a preliminary means of filtering or sorting.
EBGM is the average measurement of the posterior distribution of the true RR. Other measures are possible. For example, Dumouchel has introduced the measure “EB05”(DuMouchel, 1999). This measure corresponds to 5th percentile of the posterior distribution-which means that there is a 95% probability that the “true” RR exceeds EB05. As the EB05 is always less than EBGM, the EB05 represents a more conservative choice than the EBGM.
The Bayesian approach is more adopted by health authorities. The FDA uses the MGPS, more spe-cifically EB05(Harpaz et al., 2012). The WHO, uses the BCPNN, which estimates a Bayesian version of the Information Component(Harpaz et al., 2012).
It is worth mentioning that there is no consensus on which DPA approach is best, and no gold-standard has been established to evaluate the performances of the various approaches (Harpaz et al., 2012; Huang, Guo, Zalkikar, & Tiwari, 2014). Frequentist approaches are more computationally efficient that Bayesian measures, but may generate more false positives. The Bayesian approaches also incorporate information about disproportionality and sample size in a single dimension. Nevertheless, none of the approaches can effectively address reporting biases or confounding factors(Harpaz et al., 2012).
Big Data
Big data is a term used to describe datasets whose processing by conventional database management systems is problematic, due to any combination of their size (volume), update frequency (speed), or diversity (heterogeneity)(Hay, George, Moyes, & Brownstein, 2013).
The concept of Big Data is strongly related to the Data Deluge phenomenon(Hey & Trefethen, 2003). The data deluge refers to the situation where the exponential growth in the generation of new data makes the management and analysis of these data increasingly complex.
Exponential data growth not only requires new technologies for accessing and integrating these data, but also the development of new analytical methods that are computationally efficient and effective data processing can be very noisy(Reshef et al., 2011).
Indeed, the processing of a large volume of data can be used to identify unknown associations between drugs and AE. For example, White and colleagues investigated the use of search logs in pharmacovigilance(White, Tatonetti, Shah, Altman, & Horvitz, 2013). During this research, it was observed an association between hyperglycemia and the simultaneous utilization of paroxetine and pravastatine. This Association has been subsequently confirmed by other data. This analysis processed 82 million search logs, obtained from 6 million users during the 2010 year.
The combination of data from multiple sources can make more effective the detection of AE as-sociated with drugs. One possible combination is the joint analysis of AERS and EHR. Harpaz and colleagues(Harpaz et al., 2013) used this combination of heterogeneous data to identify a new associa-

Pharmacovigilance Informatics
308
tion between rasburicase and acute pancreatitis, by processing of 4 million of AERS and 1.2 million of EHR. The combined system indicated an association between rasburiscase and a high level of pancreatic enzymes. This association was not established before the data collection related to this study, and it was confirmed afterwards.
It is worth noting that the use of Big Data in conjunction with a large processing power is also being used as a complementary system to traditional epidemiological surveillance networks. For example, you can use Google’s search logs for tracking of influenza in a population(Ginsberg et al., 2008). Ginsberg and colleagues showed that the relative frequency of certain queries in Google is highly correlated with the percentage of doctor visits in which a patient presents with symptoms of influenza. Of the 50 mil-lion most frequent queries made through Google, 45 consultations with high level of correlation with data from medical visits related to influenza, provided by the CDC, were selected to compose the linear prediction model. Thus, it was possible to accurately estimate the level of weekly influenza activity in each region of the United States, with a lag of information one day. This approach makes possible the use of search logs to detect influenza epidemics in areas with a large population of web users. A similar system was developed for the monitoring of dengue(Chan, Sahai, Conrad, & Brownstein, 2011).
Searching on Social Networks
Other equivalent systems, this time using Twitter messages as a source of data to monitor flu symptoms, are described in the literature(Lampos & Cristianini, 2012; Signorini, Segre, & Polgreen, 2011). It is noteworthy, however, that these systems are subject to errors, as overestimations(Butler, 2013).
One research objective is to prove that Twitter can be used as a source to find new and already known ADR. This proposal has a prominent social relevance, as it will support already established pharmaco-vigilance systems. Some preliminary results in that direction were presented at Duval et al. 2014 and summarized below. The corresponding processing pipeline is presented in Figure 1.
Twitter(F, ER, OG, & FAB, 2014) is a social network and microblogging service made up of 140-character messages called tweets. In the pre-processing stage, data is processed in order to facili-
Figure 1. Twitter processing pipeline
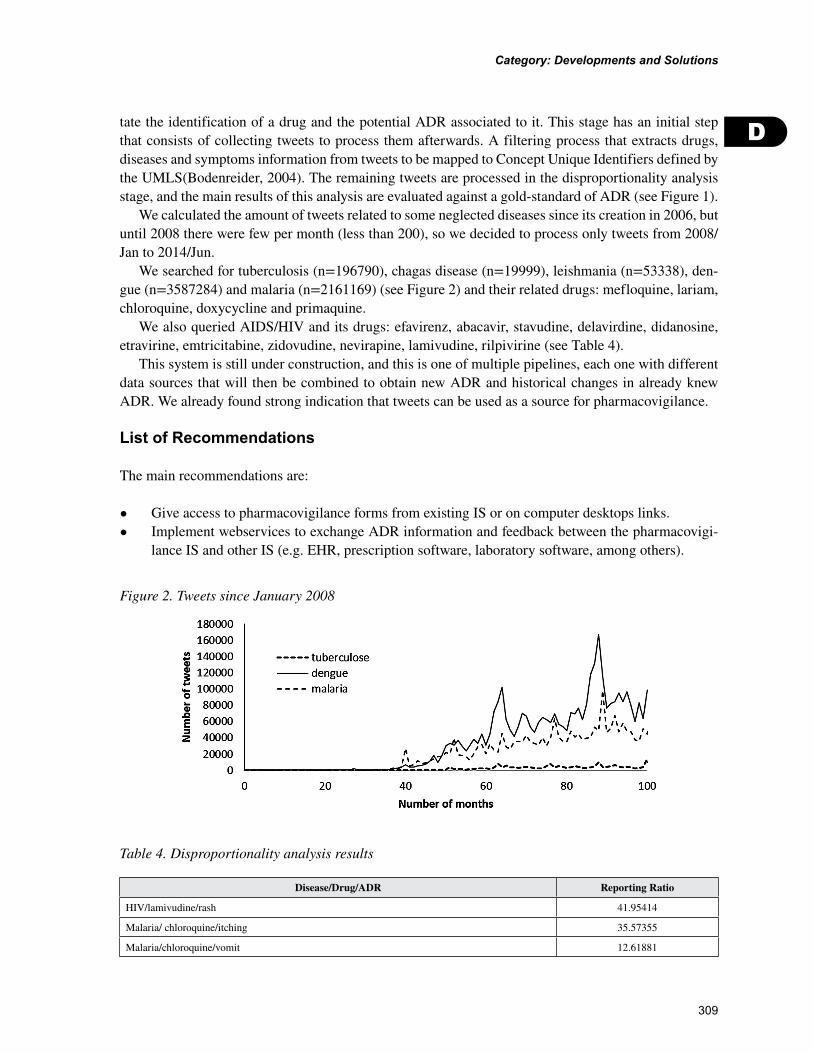
D
Category: Developments and Solutions
309
tate the identification of a drug and the potential ADR associated to it. This stage has an initial step that consists of collecting tweets to process them afterwards. A filtering process that extracts drugs, diseases and symptoms information from tweets to be mapped to Concept Unique Identifiers defined by the UMLS(Bodenreider, 2004). The remaining tweets are processed in the disproportionality analysis stage, and the main results of this analysis are evaluated against a gold-standard of ADR (see Figure 1).
We calculated the amount of tweets related to some neglected diseases since its creation in 2006, but until 2008 there were few per month (less than 200), so we decided to process only tweets from 2008/Jan to 2014/Jun.
We searched for tuberculosis (n=196790), chagas disease (n=19999), leishmania (n=53338), den-gue (n=3587284) and malaria (n=2161169) (see Figure 2) and their related drugs: mefloquine, lariam, chloroquine, doxycycline and primaquine.
We also queried AIDS/HIV and its drugs: efavirenz, abacavir, stavudine, delavirdine, didanosine, etravirine, emtricitabine, zidovudine, nevirapine, lamivudine, rilpivirine (see Table 4).
This system is still under construction, and this is one of multiple pipelines, each one with different data sources that will then be combined to obtain new ADR and historical changes in already knew ADR. We already found strong indication that tweets can be used as a source for pharmacovigilance.
List of Recommendations
The main recommendations are:
• Give access to pharmacovigilance forms from existing IS or on computer desktops links.• Implement webservices to exchange ADR information and feedback between the pharmacovigi-
lance IS and other IS (e.g. EHR, prescription software, laboratory software, among others).
Figure 2. Tweets since January 2008
Table 4. Disproportionality analysis results
Disease/Drug/ADR Reporting Ratio
HIV/lamivudine/rash 41.95414
Malaria/ chloroquine/itching 35.57355
Malaria/chloroquine/vomit 12.61881

Pharmacovigilance Informatics
310
• Use websites and social networks to disseminate information on drug safety and promote ADR reporting.
• Create data mining processes to search ADR on websites, social networks and EHR.
FUTURE RESEARCH DIRECTIONS
The authors believe that much work can be done to use informatics in improving pharmacovigilance.As future work, pharmacovigilance websites can be explored to create a personal area for each person
that submits an ADR, aiming to turn the ADR reporting act in a motivating and informative activity. It should provide technical information about the reported adverse reaction and the suspected drug, during the ADR report act, and give feedback. Another research plan is to use a pharmacovigilance facebook page to encourage ADR report by its members, conducting research work similar to those performed by Knezevic et al.
It should also be carefully developed ADR reporting forms adjusted to patients report. These forms should be simple and easy to fulfill, with accessible language (not too technical).
Authors see as a promising solution the integration in a single database all the suspected ADR de-tected within a healthcare institution. These ADR will then be sent to the Authority through regional pharmacovigilance centres. These centres will provide feedback related to the reported ADR.
An emerging research topic in pharmacovigilance is that the combination of information from multiple data sources may lead to more effective and accurate discovery of ADR. Depending on the data sources used, and how they are combined, it is believed that the resulting system could raise the statistical significance of results or facilitate new discoveries that are not possible using a single data source. It should be establish a database as a reference (gold) standard for adverse reactions, from the systematic exploration of heterogeneous data sources and more comprehensive than is recommended by Harpaz and colleagues.
CONCLUSION
Pharmacovigilance should use informatics to promote and complement spontaneous ADR report. In-tegration of pharmacovigilance databases with other healthcare IS seems to be an easy way to promote ADR reports among healthcare professionals. In addition, the trend of use of social networks has been exploited by pharmacovigilance with mechanism to detect adverse reactions among these networks.
ACKNOWLEDGMENT
This work was partially funded by project “NORTE-01-0145-FEDER-000016” that is financed by the North Portugal Regional Operational Programme (NORTE 2020), under the PORTUGAL 2020 Partner-ship Agreement, and through the European Regional Development Fund (ERDF).
D
Category: Developments and Solutions
311
REFERENCES
Abookire, S. A., Teich, J. M., Sandige, H., Paterno, M. D., Martin, M. T., Kuperman, G. J., & Bates, D. W. (2000). Improving allergy alerting in a computerized physician order entry system. Proc AMIA Symp, 2–6. PMID:11080034
Bate, A., Lindquist, M., Edwards, I. R., Olsson, S., Orre, R., Lansner, A., & De Freitas, R. M. (1998). A Bayesian neural network method for adverse drug reaction signal generation. European Journal of Clinical Pharmacology, 54(4), 315–321. doi:10.1007/s002280050466 PMID:9696956
Bodenreider, O. (2004). The unified medical language system (UMLS): Integrating biomedical terminol-ogy. Nucleic Acids Research, 32(90001suppl 1), D267–D270. doi:10.1093/nar/gkh061 PMID:14681409
Butler, D. (2013). When Google got flu wrong. Nature, 494(7436), 155–156. doi:10.1038/494155a PMID:23407515
Chan, E. H., Sahai, V., Conrad, C., & Brownstein, J. S. (2011). Using web search query data to monitor dengue epidemics: A new model for neglected tropical disease surveillance. PLoS Neglected Tropical Diseases, 5(5), e1206. doi:10.1371/journal.pntd.0001206 PMID:21647308
Classen, D. C., Pestotnik, S. L., Evans, R. S., & Burke, J. P. (1992). Description of a computerized ad-verse drug event monitor using a hospital information system. Hospital Pharmacy, 27(9), 774, 776–779, 783. PMID:10121426
Cruz-Correia, R., Rodrigues, P. P., Freitas, A., Almeida, F. C., Chen, R., & Costa-Pereira, A. (2009). Data Quality and Integration Issues in Electronic Health Records. In V. Hristidis (Ed.), Information Discovery on Electronic Health Records (pp. 55–96). doi:10.1201/9781420090413-c4
DuMouchel, W. (1999). Bayesian data mining in large frequency tables, with an application to the FDA spontaneous reporting system. The American Statistician, 53(3), 177–190.
Duval, F., Caffarena, E. R., Cruz, O. G., & Silva, F. A. B. (2014). Mining for adverse drug events on twitter. Paper presented at the 6th International Conference on Knowledge Discovery, and Information Retrieval (KDIR), Roma, Italy. doi:10.5220/0005135203540359
Estatuto do Medicamento, DL nº 176/2006 C.F.R. (2006).
European Medicines Agency. (2014). European Medicines Agency. Retrieved 05-09-2014, 2014, from www.ema.europa.eu
Evans, S. J., Waller, P. C., & Davis, S. (2001). Use of proportional reporting ratios (PRRs) for signal generation from spontaneous adverse drug reaction reports. Pharmacoepidemiology and Drug Safety, 10(6), 483–486. doi:10.1002/pds.677 PMID:11828828
Figueiras, A., Herdeiro, T., Polonia, J., & Gestal-Otero, J. J. (2006). An educational intervention to im-prove physician reporting of adverse drug reactions: A cluster-randomized controlled trial. Journal of the American Medical Association, 296(9), 1086–1093. doi:10.1001/jama.296.9.1086 PMID:16954488
Ginsberg, J., Mohebbi, M. H., Patel, R. S., Brammer, L., Smolinski, M. S., & Brilliant, L. (2008). Detect-ing influenza epidemics using search engine query data. Nature, 457(7232), 1012–1014. doi:10.1038/nature07634 PMID:19020500

Pharmacovigilance Informatics
312
Goldstein, L. H., Berlin, M., Saliba, W., Elias, M., & Berkovitch, M. (2013). Founding an adverse drug reaction (ADR) network: A method for improving doctors spontaneous ADR reporting in a general hospital. Journal of Clinical Pharmacology, n/a. doi:10.1002/jcph.149 PMID:23852627
Harpaz, R., DuMouchel, W., Shah, N. H., Madigan, D., Ryan, P., & Friedman, C. (2012). Novel data-mining methodologies for adverse drug event discovery and analysis. Clinical Pharmacology and Therapeutics, 91(6), 1010–1021. doi:10.1038/clpt.2012.50 PMID:22549283
Harpaz, R., Vilar, S., Dumouchel, W., Salmasian, H., Haerian, K., Shah, N. H.,... Friedman, C. (2013). Combing signals from spontaneous reports and electronic health records for detection of adverse drug reactions. J Am Med Inform Assoc, 20(3), 413-419. doi: 10.1136/amiajnl-2012-000930
Hauben, M. (2004). Trimethoprim-induced hyperkalaemia -- lessons in data mining. British Journal of Clinical Pharmacology, 58(3), 338–339. doi:10.1111/j.1365-2125.2004.02153.x PMID:15327598
Hauben, M., & Reich, L. (2004). Safety related drug-labelling changes: Findings from two data mining algorithms. Drug Safety, 27(10), 735–744. doi:10.2165/00002018-200427100-00004 PMID:15350157
Hauben, M., & Zhou, X. (2003). Quantitative methods in pharmacovigilance: Focus on signal detection. Drug Safety, 26(3), 159–186. doi:10.2165/00002018-200326030-00003 PMID:12580646
Hay, S. I., George, D. B., Moyes, C. L., & Brownstein, J. S. (2013). Big data opportunities for global infectious disease surveillance. PLoS Medicine, 10(4), e1001413. doi:10.1371/journal.pmed.1001413 PMID:23565065
Hazell, L., & Shakir, S. A. (2006). Under-reporting of adverse drug reactions: A systematic review. Drug Safety, 29(5), 385–396. doi:10.2165/00002018-200629050-00003 PMID:16689555
Health Level Seven. (2014). Retrieved from www.hl7.org
Herdeiro, M. T., Polonia, J., Gestal-Otero, J. J., & Figueiras, A. (2008). Improving the reporting of adverse drug reactions: A cluster-randomized trial among pharmacists in portugal. Drug Safety, 31(4), 335–344. doi:10.2165/00002018-200831040-00007 PMID:18366244
Herdeiro, M. T., Ribeiro-Vaz, I., Ferreira, M., Polonia, J., Falcao, A., & Figueiras, A. (2012). Workshop- and telephone-based interventions to improve adverse drug reaction reporting: a cluster-randomized trial in Portugal. Drug Saf, 35(8), 655-665. doi: 10.2165/11599750-000000000-00000
Hey & Trefethen. (2003). The data deluge: An e-science perspective. Grid Computing: Making the Global Infrastructure a Reality, 809-824.
Huang, L., Guo, T., Zalkikar, J. N., & Tiwari, R. C. (2014). A Review of Statistical Methods for Safety Sur-veillance. Therapeutic Innovation & Regulatory Science, 48(1), 98–108. doi:10.1177/2168479013514236
Kilbridge, P. M., & Classen, D. C. (2008). The informatics opportunities at the intersection of patient safety and clinical informatics. Journal of the American Medical Informatics Association, 15(4), 397–407. doi:10.1197/jamia.M2735 PMID:18436896
Kilbridge, P. M., Noirot, L. A., Reichley, R. M., Berchelmann, K. M., Schneider, C., Heard, K. M., & Bailey, T. C. et al. (2009). Computerized surveillance for adverse drug events in a pediatric hospital. Journal of the American Medical Informatics Association, 16(5), 607–612. doi:10.1197/jamia.M3167 PMID:19567791

D
Category: Developments and Solutions
313
Lampos, V., & Cristianini, N. (2012). Nowcasting events from the social web with statistical learning. ACM Transactions on Intelligent Systems and Technology, 3(4), 72. doi:10.1145/2337542.2337557
Lasser, K., Allen, P., Woolhandler, S., Himmlstein, F., Wolfe, S., & Bor, D. (2002). Timing of New Black Box Warnings and Withdrawals for Prescription Medications. Journal of the American Medical Association, 287(17), 2215–2220. doi:10.1001/jama.287.17.2215 PMID:11980521
Lazarou, J., Pomeranz, B. H., & Corey, P. N. (1998). Incidence of adverse drug reactions in hospitalized patients: a meta-analysis of prospective studies. JAMA, 279(15), 1200-1205.
LePendu, P., Iyer, S. V., Bauer-Mehren, A., Harpaz, R., Mortensen, J. M., Podchiyska, T.,... Shah, N. H. (2013). Pharmacovigilance using clinical notes. Clin Pharmacol Ther, 93(6), 547-555. doi: 10.1038/clpt.2013.47
Levy, M., Azaz-Livshits, T., Sadan, B., Shalit, M., Geisslinger, G., & Brune, K. (1999). Computerized surveillance of adverse drug reactions in hospital: Implementation. European Journal of Clinical Phar-macology, 54(11), 887–892. doi:10.1007/s002280050571 PMID:10027665
McGettigan, P., Golden, J., Conroy, R. M., Arthur, N., & Feely, J. (1997). Reporting of adverse drug reactions by hospital doctors and the response to intervention. British Journal of Clinical Pharmacology, 44(1), 98–100. doi:10.1046/j.1365-2125.1997.00616.x PMID:9241104
Molokhia, M., Tanna, S., & Bell, D. (2009). Improving reporting of adverse drug reactions: Systematic review. Clin Epidemiol, 1, 75–92. doi:10.2147/CLEP.S4775 PMID:20865089
Nazario, M., Feliu, J. F., & Rivera, G. C. (1994). Adverse drug reactions: The San Juan Department of Vet-erans Affairs Medical Center experience. Hospital Pharmacy, 29(3), 244–246, 249–250. PMID:10171808
OpenEHR. (2014). Retrieved 09-2014, from www.openehr.org
Ortega, A., Aguinagalde, A., Lacasa, C., Aquerreta, I., Fernandez-Benitez, M., & Fernandez, L. M. (2008). Efficacy of an adverse drug reaction electronic reporting system integrated into a hospital information system. The Annals of Pharmacotherapy, 42(10), 1491–1496. doi:10.1345/aph.1L130 PMID:18780808
Osheroff, J. A., Teich, J. M., Middleton, B., Steen, E. B., Wright, A., & Detmer, D. E. (2007). A roadmap for national action on clinical decision support. Journal of the American Medical Informatics Associa-tion, 14(2), 141–145. doi:10.1197/jamia.M2334 PMID:17213487
Otero, M.J., & Domínguez-Gil, A. (2000). Acontecimientos Adversos por Medicamentos: Una Patología Emergente. Farmacia hospitalaria: órgano oficial de expresión científica de la Sociedad Española de Farmacia Hospitalaria, 24(4), 258-266.
Pares, Y., Declerck, G., Hussain, S., Ng, R., & Jaulent, M. C. (2013). Building a time-saving and adapt-able tool to report adverse drug events. Studies in Health Technology and Informatics, 192, 903–907. PMID:23920689
Phansalkar, S., Desai, A., Choksi, A., Yoshida, E., Doole, J., Czochanski, M., & Bates, D. W. et al. (2013). Criteria for assessing high-priority drug-drug interactions for clinical decision support in electronic health records. BMC Medical Informatics and Decision Making, 13(1), 65. doi:10.1186/1472-6947-13-65 PMID:23763856

Pharmacovigilance Informatics
314
Pirmohamed, M., James, S., Meakin, S., Green, C., Scott, A. K., Walley, T. J.,... Breckenridge, A. M. (2004). Adverse drug reactions as cause of admission to hospital: prospective analysis of 18 820 patients. BMJ, 329(7456), 15-19. doi: 10.1136/bmj.329.7456.15
Reshef, Reshef, Finucane, Grossman, McVean, Turnbaugh,... Sabeti. (2011). Detecting novel associa-tions in large data sets. Science, 334(6062), 1518-1524.
Ribeiro-Vaz, I., Herdeiro, M. T., Polonia, J., & Figueiras, A. (2011). Strategies to increase the sensitivity of pharmacovigilance in Portugal. Rev Saude Publica, 45(1), 129-135.
Ribeiro-Vaz, I., Santos, C., da Costa-Pereira, A., & Cruz-Correia, R. (2012). Promoting spontaneous adverse drug reaction reporting in hospitals using a hyperlink to the online reporting form: An ecological study in Portugal. Drug Safety, 35(5), 387–394. doi:10.2165/11597190-000000000-00000 PMID:22468615
Rommers, M. K., Teepe-Twiss, I. M., & Guchelaar, H. J. (2007). Preventing adverse drug events in hos-pital practice: An overview. Pharmacoepidemiology and Drug Safety, 16(10), 1129–1135. doi:10.1002/pds.1440 PMID:17610221
Rommers, M. K., Teepe-Twiss, I. M., & Guchelaar, H. J. (2011). A computerized adverse drug event alerting system using clinical rules: A retrospective and prospective comparison with conventional medication surveillance in the Netherlands. Drug Safety, 34(3), 233–242. doi:10.2165/11536500-000000000-00000 PMID:21332247
Rommers, M. K., Zwaveling, J., Guchelaar, H. J., & Teepe-Twiss, I. M. (2013). Evaluation of rule ef-fectiveness and positive predictive value of clinical rules in a Dutch clinical decision support system in daily hospital pharmacy practice. Artificial Intelligence in Medicine, 59(1), 15–21. doi:10.1016/j.artmed.2013.04.001 PMID:23664455
Saxena, K., Lung, B. R., & Becker, J. R. (2011). Improving patient safety by modifying provider order-ing behavior using alerts (CDSS) in CPOE system. AMIA... Annual Symposium Proceedings / AMIA Symposium. AMIA Symposium, 2011, 1207–1216. PMID:22195181
Signorini, A., Segre, A. M., & Polgreen, P. M. (2011). The use of Twitter to track levels of disease ac-tivity and public concern in the US during the influenza A H1N1 pandemic. PLoS ONE, 6(5), e19467. doi:10.1371/journal.pone.0019467 PMID:21573238
Stephenson, W. P., & Hauben, M. (2007). Data mining for signals in spontaneous reporting databases: Proceed with caution. Pharmacoepidemiology and Drug Safety, 16(4), 359–365. doi:10.1002/pds.1323 PMID:17019675
Study Group of Inflammatory Bowel Disease. (2014). Grupo de Estudos da Doença Inflamatória In-testinal (GEDII). Retrieved from www.gedii.pt
Szarfman, A., Machado, S. G., & O’Neill, R. T. (2002). Use of screening algorithms and computer systems to efficiently signal higher-than-expected combinations of drugs and events in the US FDA’s spontaneous reports database. Drug Safety, 25(6), 381–392. doi:10.2165/00002018-200225060-00001 PMID:12071774
White, R. W., Tatonetti, N. P., Shah, N. H., Altman, R. B., & Horvitz, E. (2013). Web-scale pharmaco-vigilance: Listening to signals from the crowd. Journal of the American Medical Informatics Association, 20(3), 404–408. doi:10.1136/amiajnl-2012-001482 PMID:23467469

D
Category: Developments and Solutions
315
WHO. (n.d.). The Uppsala Monitoring Centre. Retrieved 09 Aug 2013, from http://www.who-umc.org/DynPage.aspx?id=22682
Zorych, I., Madigan, D., Ryan, P., & Bate, A. (2013). Disproportionality methods for pharmacovigi-lance in longitudinal observational databases. Statistical Methods in Medical Research, 22(1), 39–56. doi:10.1177/0962280211403602 PMID:21878461

RESEARCH ARTICLE Open Access
How to promote adverse drug reactionreports using information systems – asystematic review and meta-analysisInês Ribeiro-Vaz1,2* , Ana-Marta Silva1,2, Cristina Costa Santos2,3 and Ricardo Cruz-Correia2,3
Abstract
Background: Adverse drug reactions (ADRs) are a well-recognized public health problem and a major cause ofdeath and hospitalization in developed countries. The safety of a new drug cannot be established until it has beenon the market for several years. Keeping drug reactions under surveillance through pharmacovigilance systems isindispensable. However, underreporting is a major issue that undermines the effectiveness of spontaneous reports.Our work presents a systematic review on the use of information systems for the promotion of ADR reporting. Theaim of this work is to describe the state of the art information systems used to promote adverse drug reactionreporting.
Methods: A systematic review was performed with quantitative analysis of studies describing or evaluating the useof information systems to promote adverse drug reaction reporting. Studies with data related to the number ofADRs reported before and after each intervention and the follow-up period were included in the quantitativeanalysis.
Results: From a total of 3865 articles, 33 articles were included in the analysis; these articles described 29 differentprojects. Most of the projects were on a regional scale (62 %) and were performed in a hospital context (52 %). Atotal of 76 % performed passive promotion of ADR reporting and used web-based software (55 %). A total of 72 %targeted healthcare professionals and 24 % were oriented to patient ADR reporting. We performed a meta-analysisof 7 of the 29 projects to calculate the aggregated measure of the ADR reporting increase, which had an overallmeasure of 2.1 (indicating that the interventions doubled the number of ADRs reported).
Conclusions: We found that most of the projects performed passive promotion of ADR reporting (i.e., facilitatingthe process). They were developed in hospitals and were tailored to healthcare professionals. These interventionsdoubled the number of ADR reports. We believe that it would be useful to develop systems to assist healthcareprofessionals with completing ADR reporting within electronic health records because this approach seems to bean efficient method to increase the ADR reporting rate. When this approach is not possible, it is essential to have atool that is easily accessible on the web to report ADRs. This tool can be promoted by sending emails or throughthe inclusion of direct hyperlinks on healthcare professionals’ desktops.
Keywords: Adverse drug reactions report, Information systems, Pharmacovigilance
* Correspondence: [email protected] Pharmacovigilance Centre, Faculty of Medicine, University of Porto,Rua Doutor Plácido da Costa, 4200-450 Porto, Portugal2Center for Health Technology and Service Research (CINTESIS), Faculty ofMedicine of the University of Porto, Porto, PortugalFull list of author information is available at the end of the article
© 2016 Ribeiro-Vaz et al. Open Access This article is distributed under the terms of the Creative Commons Attribution 4.0International License (http://creativecommons.org/licenses/by/4.0/), which permits unrestricted use, distribution, andreproduction in any medium, provided you give appropriate credit to the original author(s) and the source, provide a link tothe Creative Commons license, and indicate if changes were made. The Creative Commons Public Domain Dedication waiver(http://creativecommons.org/publicdomain/zero/1.0/) applies to the data made available in this article, unless otherwise stated.
Ribeiro-Vaz et al. BMC Medical Informatics and Decision Making (2016) 16:27 DOI 10.1186/s12911-016-0265-8

BackgroundAdverse drug reactions (ADRs) are a well-recognizedpublic health problem worldwide and a major causeof death and hospitalization in developed countries[1]. Rare and long-term ADRs are difficult to detectduring the drug development stage. Detecting newADRs not previously identified during clinical trials isonly possible when the drug begins to be used by alarge population after marketing authorization (MA).The safety of a new drug cannot be established untilit has been on the market for several years [2]. Assuch, it is indispensable to keep drug reactions underclose surveillance after commercialization through apharmacovigilance system to continuously evaluatethe drug’s safety profile. In most countries, the phar-macovigilance system is based on spontaneous ADRreports made by healthcare professionals and con-sumers [3]. These reports can be made using paper,telephone, e-mail or through an on-line form andconsist of a description of an adverse event appar-ently caused by a medicine. Spontaneous ADR report-ing has been described as an efficient method todetect drug safety signs [4]; however, underreportingis a major issue that undermines the effectiveness ofspontaneous reports. Several studies have suggestedthat less than 10 % of detected ADRs are effectivelyreported to medicine regulatory authorities [5, 6].Worldwide, systems using informatics to promote
ADR reporting or to detect the occurrence of ADRs inhealthcare institutions have been tested and used, suchas computer programs that allow voluntary and auto-mated detection of ADR [7, 8] informatics tools createdto analyse clinical databases [9] or websites that activelyinform healthcare professionals [10].In addition to signal detection, information and com-
munication technologies can also be used to encourageand facilitate reporting of suspected ADR.In the present work, a systematic review is presented
on the use of information systems in pharmacovigilance.Our main goal is to describe the state of the art informa-tion systems for the passive or active promotion of ad-verse drug reaction reporting.
MethodsEligible studiesStudies describing or evaluating the use of informationsystems to promote adverse drug reaction reports wereselected.
Review teamThe review team is composed of two pharmacists whoare experts in pharmacovigilance (Inês Ribeiro Vaz (IV)and Ana Marta Silva (AS)) and the computer scientist
Ricardo Cruz Correia (RC), who is an expert in medicalinformatics.
Search methodsStudies were searched in April 2014 in the bibliographicdatabases. We developed a search query that includedthe concepts adverse drug reaction, adverse drug reac-tion reporting system, pharmacovigilance and informa-tion system. Only articles written in English, Portugueseor French were included. We did not establish anycriteria for the publication date.Four distinct bibliographic databases were searched:
Medline (via PubMed); ISI (ISI Web of Knowledge); IEEE(IEEE Xplore) and Scopus. The query search string used inMedline® was ((ADR OR “adverse drug reaction” OR“adverse drug reactions” OR “adverse drug event” OR “ad-verse drug events” OR “adverse dug effect” OR “adverse drugeffects”) OR “pharmacovigilance”). A similar query was usedin the other databases and was adapted to the searchengine.
Selection of studies for the reviewThe first selection was based on the study title and ab-stract (when available). Two reviewers on the reviewteam (IV and AS) were involved in study selection andread all titles/abstracts. The study was considered eli-gible when at least one of the reviewers decided that thetitle/abstract mentioned the key concept of using infor-mation systems for ADR reporting. In cases of disagree-ment, a consensus meeting was held with the thirdreviewer (RC) to decide whether the article should beselected.The second phase of study selection was based on
the full text. The team leader (IV) reviewed each full-text article. In this stage, articles were excluded basedon the following criteria: (1) the articles were onlyfocused on medication errors; (2) the articles focusedon ADR detection; (3) the articles were studies with-out any information system implemented; (4) the arti-cles were studies concerning data quality; (5) thearticles were studies focused on website usability; (6)the articles were only the authors’ reflections on thetheme; (7) the articles were studies only related toincidents that occurred in health institutions; (8) thearticles were studies concerning signal detection and(9) the articles were studies concerning electronictransmission between the authority and other institu-tions (pharmaceutical companies or regional pharma-covigilance centres).The articles remaining after this review were included
in the final statistical analysis.These articles were grouped into research projects to
avoid the distortion created by multiple papers describing
Ribeiro-Vaz et al. BMC Medical Informatics and Decision Making (2016) 16:27 Page 2 of 10
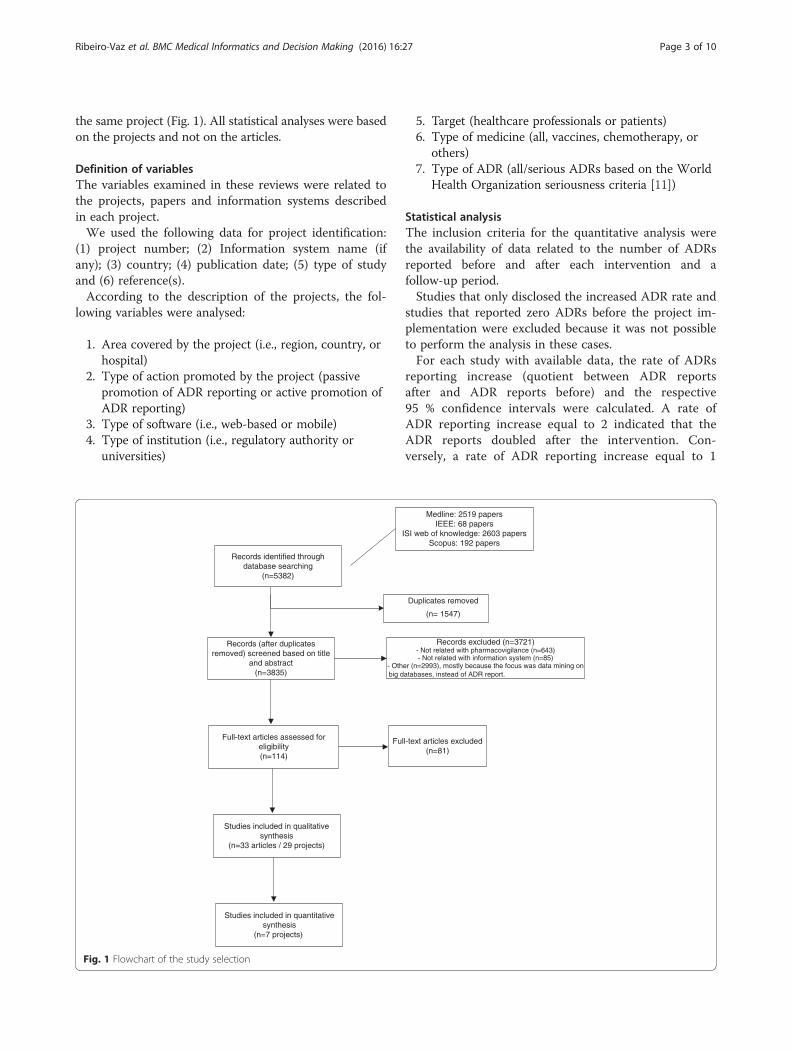
the same project (Fig. 1). All statistical analyses were basedon the projects and not on the articles.
Definition of variablesThe variables examined in these reviews were related tothe projects, papers and information systems describedin each project.We used the following data for project identification:
(1) project number; (2) Information system name (ifany); (3) country; (4) publication date; (5) type of studyand (6) reference(s).According to the description of the projects, the fol-
lowing variables were analysed:
1. Area covered by the project (i.e., region, country, orhospital)
2. Type of action promoted by the project (passivepromotion of ADR reporting or active promotion ofADR reporting)
3. Type of software (i.e., web-based or mobile)4. Type of institution (i.e., regulatory authority or
universities)
5. Target (healthcare professionals or patients)6. Type of medicine (all, vaccines, chemotherapy, or
others)7. Type of ADR (all/serious ADRs based on the World
Health Organization seriousness criteria [11])
Statistical analysisThe inclusion criteria for the quantitative analysis werethe availability of data related to the number of ADRsreported before and after each intervention and afollow-up period.Studies that only disclosed the increased ADR rate and
studies that reported zero ADRs before the project im-plementation were excluded because it was not possibleto perform the analysis in these cases.For each study with available data, the rate of ADRs
reporting increase (quotient between ADR reportsafter and ADR reports before) and the respective95 % confidence intervals were calculated. A rate ofADR reporting increase equal to 2 indicated that theADR reports doubled after the intervention. Con-versely, a rate of ADR reporting increase equal to 1
Records identified throughdatabase searching
(n=5382)
Records (after duplicatesremoved) screened based on title
and abstract(n=3835)
Full-text articles assessed foreligibility(n=114)
Medline: 2519 papersIEEE: 68 papers
ISI web of knowledge: 2603 papersScopus: 192 papers
Studies included in qualitativesynthesis
(n=33 articles / 29 projects)
Records excluded (n=3721)- Not related with pharmacovigilance (n=643)- Not related with information system (n=85)
- Other (n=2993), mostly because the focus was data mining onbig databases, instead of ADR report.
Duplicates removed
(n= 1547)
Full-text articles excluded(n=81)
Studies included in quantitativesynthesis
(n=7 projects)
Fig. 1 Flowchart of the study selection
Ribeiro-Vaz et al. BMC Medical Informatics and Decision Making (2016) 16:27 Page 3 of 10

indicated that the number of ADR reports after theintervention was equal to the number of ADR reportsbefore the intervention. The aggregated rate of theADR reporting increase was calculated with the in-verse variance method using a random effects modeland a forest plot was presented. The confidence inter-vals, aggregated rate of ADRs and forest plot wereperformed using a Microsoft Excel spreadsheet. Thedescription of the Microsoft Excel spreadsheet andthe respective statistical methods used were describedby Neyeloff [12].
ResultsOur search method found 2519 articles in PubMed,68 in IEEE, 2603 in ISI and 192 in Scopus. Aftereliminating duplicate articles, 3835 articles wereselected.Two reviewers (IV and AS) read all 3835 titles/ab-
stracts. In cases of disagreement, which occurred with151 articles, a consensus meeting was held with thethird reviewer (RC) to decide whether the articleshould be selected.A total of 643 studies were excluded because they
were not related to pharmacovigilance, 85 were excludedbecause they were not related to information systemsand 2993 were excluded for other reasons (mostly be-cause their focus was on data mining in large databasesinstead of ADR reporting).A total of 114 of the 3835 articles were selected in this
first selection based on the title and abstract.The team leader (IV) reviewed each of the 114 full-
text articles. After this review, 33 articles remainedfor the final statistical analysis. At this stage, most ofthe articles were excluded because: (1) they were onlyrelated to medication errors; (2) they were focused onADR detection; (3) they were studies without any in-formation system implemented; (4) they were studiesconcerning data quality; (5) they were studies focusedon website usability; (6) they were only authors’ re-flections on the theme; (7) they were studies only re-lated to incidents that occurred at health institutions;(8) they were studies concerning signal detection or(9) they were studies concerning electronic transmis-sion between the authority and other institutions(pharmaceutical companies or regional pharmacovigi-lance centres).These 33 articles were grouped into 29 distinct re-
search projects to avoid the distortion created bymultiple papers describing the same project (Fig. 1.).All statistical analyses was based on projects and noton articles.Table 1 lists all 29 projects, their country, the number
of publications, the publication year and the journal.
The country with the most published projects was theUSA (11), followed by the United Kingdom (3).
TrendsThere was an increasing trend in publication, especiallyafter 2009 (Fig. 2).
Qualitative analysisThe qualitative variables analysed in each project are listedin Table 2 and described below. Globally, we found thatthere was an increase in the publication of projects overthe study period, with 4 projects published before 2001, 4projects between 2005 and 2007, 8 projects between 2008and 2010 and 13 projects between 2011 and 2013.
Geographic area covered by the projectsMost of the projects were regional (62 %), followed bynational projects (34 %). We found only 1 internationalproject based on Facebook®. This international projectwas developed in the last time period (2011–2013).
Areas covered by the projectsMost of the projects (52 %) were developed in hospitals,followed by community projects (21 %). A total of 14 %covered primary care institutions and 10 % (3 projects)were developed for use in any type of healthcare institu-tion. One project was dedicated to a multicentre clinicaltrial. We also found that all of the projects oriented tothe community were developed in the last 3 years(2011–2013).
Types of actions promoted by the projectsThe majority of the projects passively promoted ADRreporting (76 %); the remainder actively promotedreporting (24 %).
Types of softwareMore than half of the projects (55 %) used web-basedtechnology and 41 % used electronic health records.Only one project used mobile phone technology. Therewas an increasing trend in software using web-basedtechnology over all of the time intervals considered. Themobile technology appeared during the last time period.
Types of institutions promoting the studiesMost of the projects were promoted by hospitals anduniversities (31 % ex aequo). There were 4 projects de-veloped by national institutions (not regulatory) and 5projects implemented by regulatory authorities.
TargetsA total of 72 % of the projects were geared to healthcareprofessionals, 24 % to patients and one project wasgeared to both targets. Most of the projects targeting
Ribeiro-Vaz et al. BMC Medical Informatics and Decision Making (2016) 16:27 Page 4 of 10
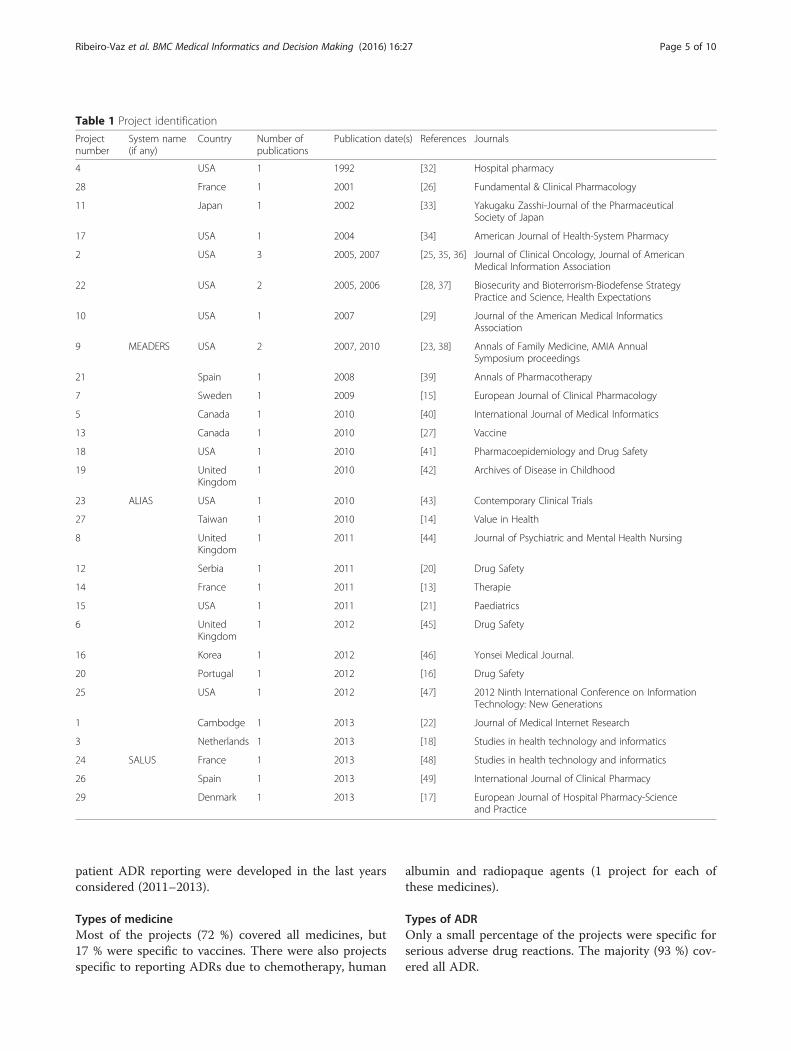
patient ADR reporting were developed in the last yearsconsidered (2011–2013).
Types of medicineMost of the projects (72 %) covered all medicines, but17 % were specific to vaccines. There were also projectsspecific to reporting ADRs due to chemotherapy, human
albumin and radiopaque agents (1 project for each ofthese medicines).
Types of ADROnly a small percentage of the projects were specific forserious adverse drug reactions. The majority (93 %) cov-ered all ADR.
Table 1 Project identification
Projectnumber
System name(if any)
Country Number ofpublications
Publication date(s) References Journals
4 USA 1 1992 [32] Hospital pharmacy
28 France 1 2001 [26] Fundamental & Clinical Pharmacology
11 Japan 1 2002 [33] Yakugaku Zasshi-Journal of the PharmaceuticalSociety of Japan
17 USA 1 2004 [34] American Journal of Health-System Pharmacy
2 USA 3 2005, 2007 [25, 35, 36] Journal of Clinical Oncology, Journal of AmericanMedical Information Association
22 USA 2 2005, 2006 [28, 37] Biosecurity and Bioterrorism-Biodefense StrategyPractice and Science, Health Expectations
10 USA 1 2007 [29] Journal of the American Medical InformaticsAssociation
9 MEADERS USA 2 2007, 2010 [23, 38] Annals of Family Medicine, AMIA AnnualSymposium proceedings
21 Spain 1 2008 [39] Annals of Pharmacotherapy
7 Sweden 1 2009 [15] European Journal of Clinical Pharmacology
5 Canada 1 2010 [40] International Journal of Medical Informatics
13 Canada 1 2010 [27] Vaccine
18 USA 1 2010 [41] Pharmacoepidemiology and Drug Safety
19 UnitedKingdom
1 2010 [42] Archives of Disease in Childhood
23 ALIAS USA 1 2010 [43] Contemporary Clinical Trials
27 Taiwan 1 2010 [14] Value in Health
8 UnitedKingdom
1 2011 [44] Journal of Psychiatric and Mental Health Nursing
12 Serbia 1 2011 [20] Drug Safety
14 France 1 2011 [13] Therapie
15 USA 1 2011 [21] Paediatrics
6 UnitedKingdom
1 2012 [45] Drug Safety
16 Korea 1 2012 [46] Yonsei Medical Journal.
20 Portugal 1 2012 [16] Drug Safety
25 USA 1 2012 [47] 2012 Ninth International Conference on InformationTechnology: New Generations
1 Cambodge 1 2013 [22] Journal of Medical Internet Research
3 Netherlands 1 2013 [18] Studies in health technology and informatics
24 SALUS France 1 2013 [48] Studies in health technology and informatics
26 Spain 1 2013 [49] International Journal of Clinical Pharmacy
29 Denmark 1 2013 [17] European Journal of Hospital Pharmacy-Scienceand Practice
Ribeiro-Vaz et al. BMC Medical Informatics and Decision Making (2016) 16:27 Page 5 of 10
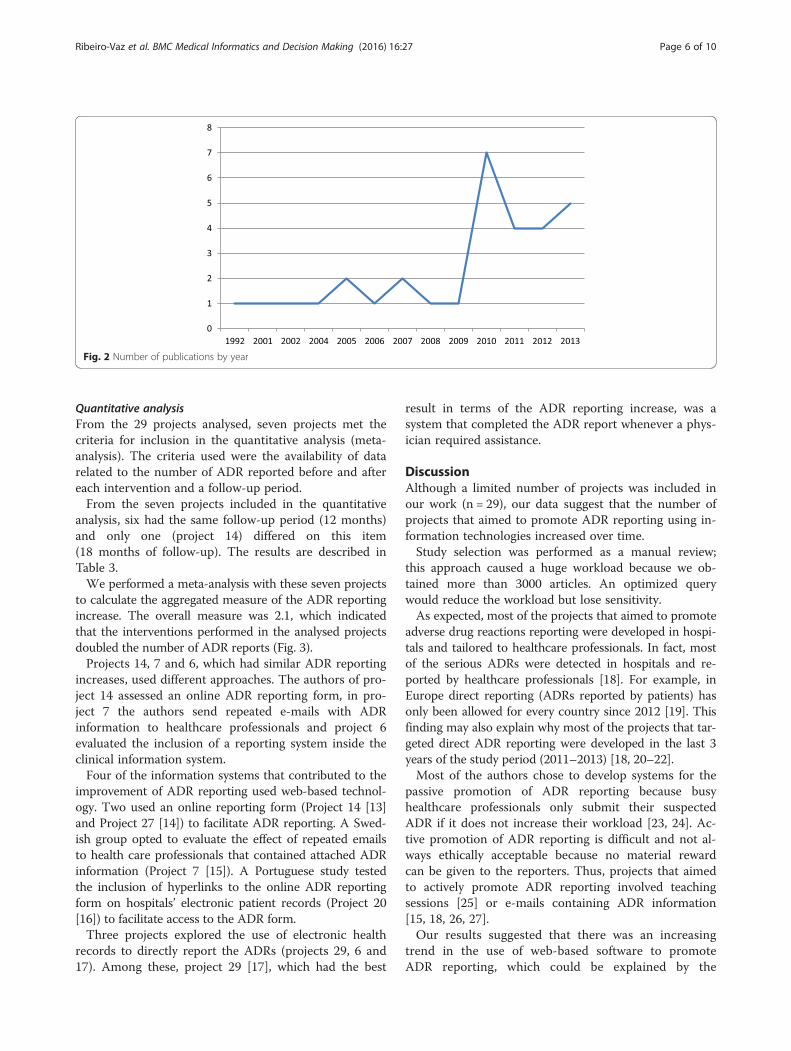
Quantitative analysisFrom the 29 projects analysed, seven projects met thecriteria for inclusion in the quantitative analysis (meta-analysis). The criteria used were the availability of datarelated to the number of ADR reported before and aftereach intervention and a follow-up period.From the seven projects included in the quantitative
analysis, six had the same follow-up period (12 months)and only one (project 14) differed on this item(18 months of follow-up). The results are described inTable 3.We performed a meta-analysis with these seven projects
to calculate the aggregated measure of the ADR reportingincrease. The overall measure was 2.1, which indicatedthat the interventions performed in the analysed projectsdoubled the number of ADR reports (Fig. 3).Projects 14, 7 and 6, which had similar ADR reporting
increases, used different approaches. The authors of pro-ject 14 assessed an online ADR reporting form, in pro-ject 7 the authors send repeated e-mails with ADRinformation to healthcare professionals and project 6evaluated the inclusion of a reporting system inside theclinical information system.Four of the information systems that contributed to the
improvement of ADR reporting used web-based technol-ogy. Two used an online reporting form (Project 14 [13]and Project 27 [14]) to facilitate ADR reporting. A Swed-ish group opted to evaluate the effect of repeated emailsto health care professionals that contained attached ADRinformation (Project 7 [15]). A Portuguese study testedthe inclusion of hyperlinks to the online ADR reportingform on hospitals’ electronic patient records (Project 20[16]) to facilitate access to the ADR form.Three projects explored the use of electronic health
records to directly report the ADRs (projects 29, 6 and17). Among these, project 29 [17], which had the best
result in terms of the ADR reporting increase, was asystem that completed the ADR report whenever a phys-ician required assistance.
DiscussionAlthough a limited number of projects was included inour work (n = 29), our data suggest that the number ofprojects that aimed to promote ADR reporting using in-formation technologies increased over time.Study selection was performed as a manual review;
this approach caused a huge workload because we ob-tained more than 3000 articles. An optimized querywould reduce the workload but lose sensitivity.As expected, most of the projects that aimed to promote
adverse drug reactions reporting were developed in hospi-tals and tailored to healthcare professionals. In fact, mostof the serious ADRs were detected in hospitals and re-ported by healthcare professionals [18]. For example, inEurope direct reporting (ADRs reported by patients) hasonly been allowed for every country since 2012 [19]. Thisfinding may also explain why most of the projects that tar-geted direct ADR reporting were developed in the last 3years of the study period (2011–2013) [18, 20–22].Most of the authors chose to develop systems for the
passive promotion of ADR reporting because busyhealthcare professionals only submit their suspectedADR if it does not increase their workload [23, 24]. Ac-tive promotion of ADR reporting is difficult and not al-ways ethically acceptable because no material rewardcan be given to the reporters. Thus, projects that aimedto actively promote ADR reporting involved teachingsessions [25] or e-mails containing ADR information[15, 18, 26, 27].Our results suggested that there was an increasing
trend in the use of web-based software to promoteADR reporting, which could be explained by the
Fig. 2 Number of publications by year
Ribeiro-Vaz et al. BMC Medical Informatics and Decision Making (2016) 16:27 Page 6 of 10
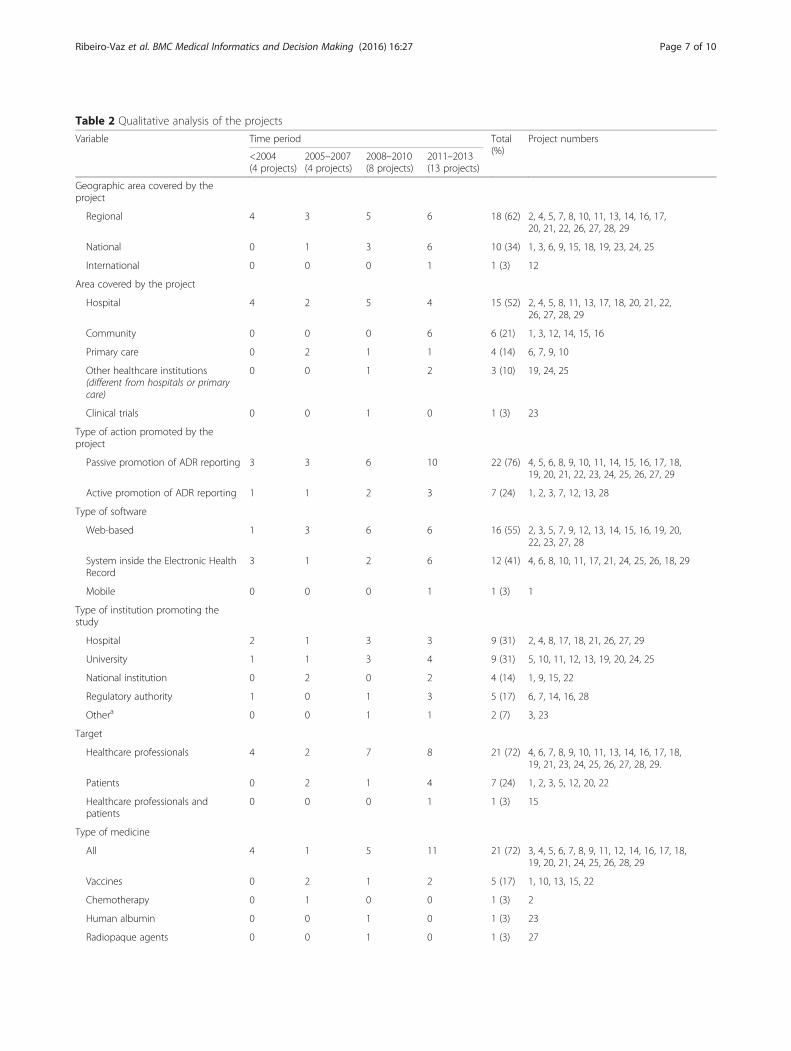
Table 2 Qualitative analysis of the projects
Variable Time period Total(%)
Project numbers
<2004(4 projects)
2005–2007(4 projects)
2008–2010(8 projects)
2011–2013(13 projects)
Geographic area covered by theproject
Regional 4 3 5 6 18 (62) 2, 4, 5, 7, 8, 10, 11, 13, 14, 16, 17,20, 21, 22, 26, 27, 28, 29
National 0 1 3 6 10 (34) 1, 3, 6, 9, 15, 18, 19, 23, 24, 25
International 0 0 0 1 1 (3) 12
Area covered by the project
Hospital 4 2 5 4 15 (52) 2, 4, 5, 8, 11, 13, 17, 18, 20, 21, 22,26, 27, 28, 29
Community 0 0 0 6 6 (21) 1, 3, 12, 14, 15, 16
Primary care 0 2 1 1 4 (14) 6, 7, 9, 10
Other healthcare institutions(different from hospitals or primarycare)
0 0 1 2 3 (10) 19, 24, 25
Clinical trials 0 0 1 0 1 (3) 23
Type of action promoted by theproject
Passive promotion of ADR reporting 3 3 6 10 22 (76) 4, 5, 6, 8, 9, 10, 11, 14, 15, 16, 17, 18,19, 20, 21, 22, 23, 24, 25, 26, 27, 29
Active promotion of ADR reporting 1 1 2 3 7 (24) 1, 2, 3, 7, 12, 13, 28
Type of software
Web-based 1 3 6 6 16 (55) 2, 3, 5, 7, 9, 12, 13, 14, 15, 16, 19, 20,22, 23, 27, 28
System inside the Electronic HealthRecord
3 1 2 6 12 (41) 4, 6, 8, 10, 11, 17, 21, 24, 25, 26, 18, 29
Mobile 0 0 0 1 1 (3) 1
Type of institution promoting thestudy
Hospital 2 1 3 3 9 (31) 2, 4, 8, 17, 18, 21, 26, 27, 29
University 1 1 3 4 9 (31) 5, 10, 11, 12, 13, 19, 20, 24, 25
National institution 0 2 0 2 4 (14) 1, 9, 15, 22
Regulatory authority 1 0 1 3 5 (17) 6, 7, 14, 16, 28
Othera 0 0 1 1 2 (7) 3, 23
Target
Healthcare professionals 4 2 7 8 21 (72) 4, 6, 7, 8, 9, 10, 11, 13, 14, 16, 17, 18,19, 21, 23, 24, 25, 26, 27, 28, 29.
Patients 0 2 1 4 7 (24) 1, 2, 3, 5, 12, 20, 22
Healthcare professionals andpatients
0 0 0 1 1 (3) 15
Type of medicine
All 4 1 5 11 21 (72) 3, 4, 5, 6, 7, 8, 9, 11, 12, 14, 16, 17, 18,19, 20, 21, 24, 25, 26, 28, 29
Vaccines 0 2 1 2 5 (17) 1, 10, 13, 15, 22
Chemotherapy 0 1 0 0 1 (3) 2
Human albumin 0 0 1 0 1 (3) 23
Radiopaque agents 0 0 1 0 1 (3) 27
Ribeiro-Vaz et al. BMC Medical Informatics and Decision Making (2016) 16:27 Page 7 of 10

dissemination of internet use. Nevertheless, mobiletechnology was also appearing.Most of the retrieved projects covered all medicines and
ADR, whereas only a few were specific. However, wefound 5 projects dedicated to vaccine adverse reactions[21, 22, 27–29] and in the last 3 years two projects weredeveloped to specifically report serious ADR [18, 22].The institutions that primarily promoted this work
were universities and hospitals because universities havethe know-how to perform these actions and hospitalshave specific needs to be solved. However, regulatory au-thorities have been increasing their involvement in thedevelopment of this type of project.A limitation of this study is that a grey literature
search was not performed. However, we think thatthis lack does not cause a large bias because regula-tory authorities are less likely to produce this type ofproject. When regulatory authorities are involved inprojects of this scope, they usually associate with uni-versities and hospitals that have a greater incentive topublish.Based on our quantitative analysis, we can conclude
that all of the projects analysed increased the ADRreporting numbers (most by approximately two-fold).We found two projects that increased ADR reporting bymore than two-fold [14, 17], perhaps because their basalvalues were much lower compared with the other fiveprojects. A similar effect was noted previously in twoother studies when the same population of health careprofessionals was exposed to the same educational inter-ventions two different times [30, 31]. After the firstintervention, the authors achieved a much higher effect
and ADR reporting increased compared to the secondintervention due to the differences in the initial values.In our quantitative analysis, we found a limitation con-
cerning the aggregation of the information because wefound only 7 studies that provided data concerning its im-pact on the increase in ADR reporting. These data werenot available for the other studies even after we contactedthe authors. However, we did not identify any variable thatcould distinguish these 7 projects from the other 22 pro-jects. We must reiterate the importance of providingquantitative data when publishing studies focused on in-terventions that aim to promote ADR reporting.Worldwide underreporting of ADR is a major concern,
and many institutions are aware that it is feasible to useinformation systems to improve ADR reporting. Themost commonly used platform is web-based and exhibitsan increasing trend, but interventions inside electronichealth records also have the potential to improve phar-macovigilance activities and particularly ADR reporting.Direct ADR reporting is being increasingly taken intoaccount when the aim is to improve information ondrug safety.Based on our results, we believe that it would be use-
ful to adopt a system to assist healthcare professionalswith completing ADR reporting within electronic healthrecords because this approach seems to be an efficientmethod to increase the ADR reporting rate. When thisapproach is not possible, it is essential to have a tool thatis easily accessible on the web to report ADR. This toolcan be promoted by sending emails or through the in-clusion of direct hyperlinks on healthcare professionals’desktops.
Table 2 Qualitative analysis of the projects (Continued)
Type of ADR
All 4 4 8 11 27 (93) 2, 4, 5, 6, 7, 8, 9, 10, 11, 12, 13, 14, 15, 16, 17,18, 19, 20, 21, 22, 23, 24, 25, 26, 27, 28, 29
Serious 0 0 0 2 2 (7) 1, 3a Other institutions are: Clinical trial team (project 23) and website producer (project 3)
Table 3 Intervention effect on ADR reporting increase
Study ADR reports before ADR reports after Rate CI lower CI upper
Project 14 287 415 1,44 −0,18 3,07
Project 7 89 111 1,25 −0,51 3,00
Project 29 30 162 5,4 4,56 6,24
Project 6 3279 4716 1,44 −0,20 3,072
Project 17 118 294 2,49 1,25 3,73
Project 27 20 62 3,1 1,99 4,21
Project 20 82 212 2,58 1,37 3,80
Ribeiro-Vaz et al. BMC Medical Informatics and Decision Making (2016) 16:27 Page 8 of 10
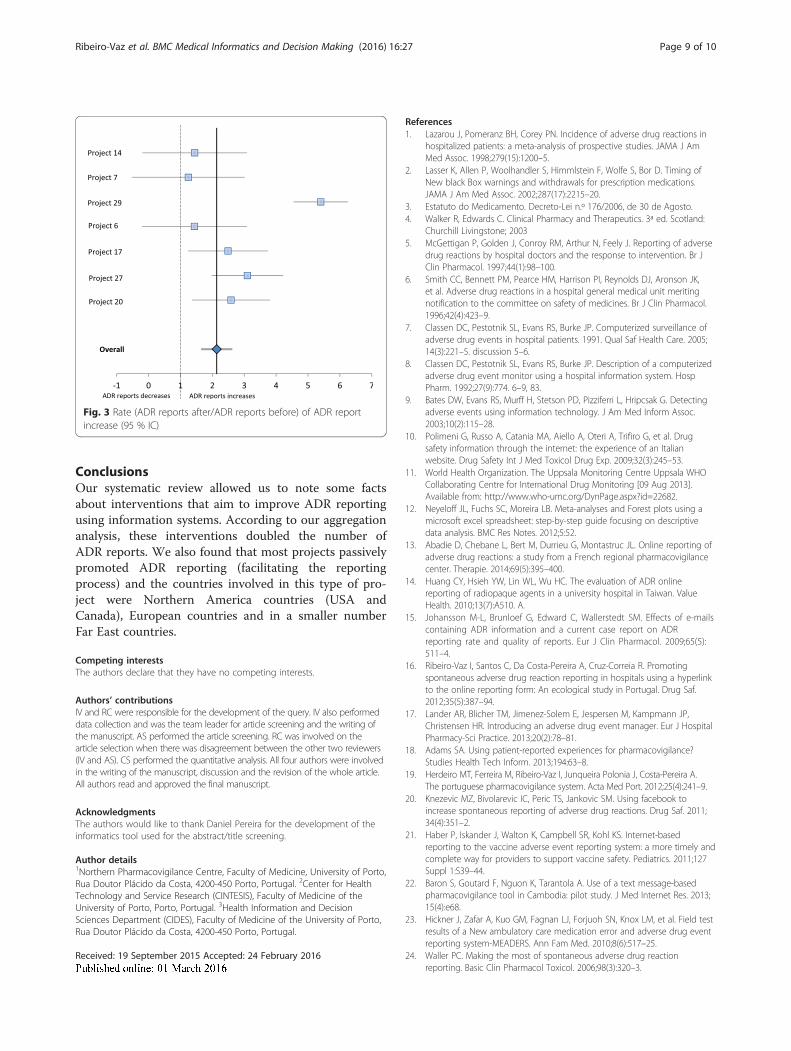
ConclusionsOur systematic review allowed us to note some factsabout interventions that aim to improve ADR reportingusing information systems. According to our aggregationanalysis, these interventions doubled the number ofADR reports. We also found that most projects passivelypromoted ADR reporting (facilitating the reportingprocess) and the countries involved in this type of pro-ject were Northern America countries (USA andCanada), European countries and in a smaller numberFar East countries.
Competing interestsThe authors declare that they have no competing interests.
Authors’ contributionsIV and RC were responsible for the development of the query. IV also performeddata collection and was the team leader for article screening and the writing ofthe manuscript. AS performed the article screening. RC was involved on thearticle selection when there was disagreement between the other two reviewers(IV and AS). CS performed the quantitative analysis. All four authors were involvedin the writing of the manuscript, discussion and the revision of the whole article.All authors read and approved the final manuscript.
AcknowledgmentsThe authors would like to thank Daniel Pereira for the development of theinformatics tool used for the abstract/title screening.
Author details1Northern Pharmacovigilance Centre, Faculty of Medicine, University of Porto,Rua Doutor Plácido da Costa, 4200-450 Porto, Portugal. 2Center for HealthTechnology and Service Research (CINTESIS), Faculty of Medicine of theUniversity of Porto, Porto, Portugal. 3Health Information and DecisionSciences Department (CIDES), Faculty of Medicine of the University of Porto,Rua Doutor Plácido da Costa, 4200-450 Porto, Portugal.
Received: 19 September 2015 Accepted: 24 February 2016
References1. Lazarou J, Pomeranz BH, Corey PN. Incidence of adverse drug reactions in
hospitalized patients: a meta-analysis of prospective studies. JAMA J AmMed Assoc. 1998;279(15):1200–5.
2. Lasser K, Allen P, Woolhandler S, Himmlstein F, Wolfe S, Bor D. Timing ofNew black Box warnings and withdrawals for prescription medications.JAMA J Am Med Assoc. 2002;287(17):2215–20.
3. Estatuto do Medicamento. Decreto-Lei n.º 176/2006, de 30 de Agosto.4. Walker R, Edwards C. Clinical Pharmacy and Therapeutics. 3ª ed. Scotland:
Churchill Livingstone; 20035. McGettigan P, Golden J, Conroy RM, Arthur N, Feely J. Reporting of adverse
drug reactions by hospital doctors and the response to intervention. Br JClin Pharmacol. 1997;44(1):98–100.
6. Smith CC, Bennett PM, Pearce HM, Harrison PI, Reynolds DJ, Aronson JK,et al. Adverse drug reactions in a hospital general medical unit meritingnotification to the committee on safety of medicines. Br J Clin Pharmacol.1996;42(4):423–9.
7. Classen DC, Pestotnik SL, Evans RS, Burke JP. Computerized surveillance ofadverse drug events in hospital patients. 1991. Qual Saf Health Care. 2005;14(3):221–5. discussion 5–6.
8. Classen DC, Pestotnik SL, Evans RS, Burke JP. Description of a computerizedadverse drug event monitor using a hospital information system. HospPharm. 1992;27(9):774. 6–9, 83.
9. Bates DW, Evans RS, Murff H, Stetson PD, Pizziferri L, Hripcsak G. Detectingadverse events using information technology. J Am Med Inform Assoc.2003;10(2):115–28.
10. Polimeni G, Russo A, Catania MA, Aiello A, Oteri A, Trifiro G, et al. Drugsafety information through the internet: the experience of an Italianwebsite. Drug Safety Int J Med Toxicol Drug Exp. 2009;32(3):245–53.
11. World Health Organization. The Uppsala Monitoring Centre Uppsala WHOCollaborating Centre for International Drug Monitoring [09 Aug 2013].Available from: http://www.who-umc.org/DynPage.aspx?id=22682.
12. Neyeloff JL, Fuchs SC, Moreira LB. Meta-analyses and Forest plots using amicrosoft excel spreadsheet: step-by-step guide focusing on descriptivedata analysis. BMC Res Notes. 2012;5:52.
13. Abadie D, Chebane L, Bert M, Durrieu G, Montastruc JL. Online reporting ofadverse drug reactions: a study from a French regional pharmacovigilancecenter. Therapie. 2014;69(5):395–400.
14. Huang CY, Hsieh YW, Lin WL, Wu HC. The evaluation of ADR onlinereporting of radiopaque agents in a university hospital in Taiwan. ValueHealth. 2010;13(7):A510. A.
15. Johansson M-L, Brunloef G, Edward C, Wallerstedt SM. Effects of e-mailscontaining ADR information and a current case report on ADRreporting rate and quality of reports. Eur J Clin Pharmacol. 2009;65(5):511–4.
16. Ribeiro-Vaz I, Santos C, Da Costa-Pereira A, Cruz-Correia R. Promotingspontaneous adverse drug reaction reporting in hospitals using a hyperlinkto the online reporting form: An ecological study in Portugal. Drug Saf.2012;35(5):387–94.
17. Lander AR, Blicher TM, Jimenez-Solem E, Jespersen M, Kampmann JP,Christensen HR. Introducing an adverse drug event manager. Eur J HospitalPharmacy-Sci Practice. 2013;20(2):78–81.
18. Adams SA. Using patient-reported experiences for pharmacovigilance?Studies Health Tech Inform. 2013;194:63–8.
19. Herdeiro MT, Ferreira M, Ribeiro-Vaz I, Junqueira Polonia J, Costa-Pereira A.The portuguese pharmacovigilance system. Acta Med Port. 2012;25(4):241–9.
20. Knezevic MZ, Bivolarevic IC, Peric TS, Jankovic SM. Using facebook toincrease spontaneous reporting of adverse drug reactions. Drug Saf. 2011;34(4):351–2.
21. Haber P, Iskander J, Walton K, Campbell SR, Kohl KS. Internet-basedreporting to the vaccine adverse event reporting system: a more timely andcomplete way for providers to support vaccine safety. Pediatrics. 2011;127Suppl 1:S39–44.
22. Baron S, Goutard F, Nguon K, Tarantola A. Use of a text message-basedpharmacovigilance tool in Cambodia: pilot study. J Med Internet Res. 2013;15(4):e68.
23. Hickner J, Zafar A, Kuo GM, Fagnan LJ, Forjuoh SN, Knox LM, et al. Field testresults of a New ambulatory care medication error and adverse drug eventreporting system-MEADERS. Ann Fam Med. 2010;8(6):517–25.
24. Waller PC. Making the most of spontaneous adverse drug reactionreporting. Basic Clin Pharmacol Toxicol. 2006;98(3):320–3.
Fig. 3 Rate (ADR reports after/ADR reports before) of ADR reportincrease (95 % IC)
Ribeiro-Vaz et al. BMC Medical Informatics and Decision Making (2016) 16:27 Page 9 of 10
25. Basch E, Artz D, Iasonos A, Speakman J, Shannon K, Lin K, et al. Evaluationof an online platform for cancer patient self-reporting of chemotherapytoxicities. J Am Med Inform Assoc. 2007;14(3):264–8.
26. Jean Pastor MJ, Affaton MF, Prost N, Rodor F. Pharmacovigilanceinformation via electronic mail. Fundamental Clin Pharmacol. 2001;15:12.
27. Lapphra K, Dobson S, Bettinger JA. Acceptability of Internet adverse eventself-reporting for pandemic and seasonal influenza immunization amonghealth care workers. Vaccine. 2010;28(38):6199–202.
28. Olmsted SS, Grabenstein JD, Jain AK, Comerford W, Giambo P, Johnson P, etal. Use of an electronic monitoring system for self-reporting smallpoxvaccine reactions. Biosecurity Bioterrorism-Biodefense Strategy Practice Sci.2005;3(3):198–206.
29. Hinrichsen VL, Kruskal B, O'Brien MA, Lieu TA, Platt R. Vaccine Safety DatalinkT. Using electronic medical records to enhance detection and reporting ofvaccine adverse events. J Am Med Inform Assoc. 2007;14(6):731–5.
30. Ribeiro-Vaz I, Herdeiro MT, Polonia J, Figueiras A. Strategies to increase thesensitivity of pharmacovigilance in Portugal. Rev Saude Publica. 2011;45(1):129–35.
31. Herdeiro MT, Polonia J, Gestal-Otero JJ, Figueiras A. Improving the reportingof adverse drug reactions : a cluster-randomized trial among pharmacists inportugal. Drug safety Int J Med Toxicol Drug Exp. 2008;31(4):335–44.
32. Classen DC, Pestotnik SL, Evans RS, Burke JP. Description of a computerizedadverse drug event monitor using a hospital information system.Hosp Pharm. 1992;27(9):776–83.
33. Kataoka S, Ohe K, Mochizuki M, Ueda S. Developing and integrating anadverse drug reaction reporting system with the Hospital InformationSystem. Yakugaku Zasshi-J Pharmaceutical Soc Japan. 2002;122(1):113–6.
34. Lee SB, Schepers GP, Goldberg KL. Electronic adverse-drug-reaction-reporting program. Am J Health Syst Pharm. 2004;61(12):1230−+.
35. Basch E, Artz D, Dulko D, Scher K, Sabbatini P, Hensley M, et al. Patientonline self-reporting of toxicity symptoms during chemotherapy. J ClinOncol. 2005;23(15):3552–61.
36. Basch E, Iasonos A, Barz A, Culkin A, Kris MG, Artz D, et al. Long-term toxicitymonitoring via electronic patient-reported outcomes in patients receivingchemotherapy. J Clin Oncol. 2007;25(34):5374–80.
37. Olmsted SS, Grabenstein JD, Jain AK, Lurie N. Patient experience with, anduse of, an electronic monitoring system to assess vaccination responses.Health Expect. 2006;9(2):110–7.
38. Zafar A, Center APR. MEADERS: Medication Errors and Adverse Drug EventReporting system. AMIA Annual Symposium proceedings/AMIA SymposiumAMIA Symposium. 2007. p. 1167.
39. Ortega A, Aguinagalde A, Lacasa C, Aquerreta I, Fernandez-Benitez M,Fernandez LM. Efficacy of an adverse drug reaction electronic reportingsystem integrated into a hospital information system. Ann Pharmacother.2008;42(10):1491–6.
40. Daniels JP, King AD, Cochrane DD, Carr R, Shaw NT, Lim J, et al. A humanfactors and survey methodology-based design of a web-based adverseevent reporting system for families. Int J Med Inform. 2010;79(5):339–48.
41. Linder JA, Haas JS, Iyer A, Labuzetta MA, Ibara M, Celeste M, et al. Secondaryuse of electronic health record data: spontaneous triggered adverse drugevent reporting. Pharmacoepidemiol Drug Saf. 2010;19(12):1211–5.
42. Lynn RM, Riding K, McIntosh N. The use of electronic reporting to aidsurveillance of ADRs in children: a proof of concept study. Arch Dis Child.2010;95(4):262–5.
43. Zhao W, Waldman BD, Dillon C, Pauls K, Kim J, Patterson L, et al. A web-based medical safety reporting system for a large multicenter clinical trial:The ALIAS experience. Contemp Clin Trials. 2010;31(6):536–43.
44. Haw C, Cahill C. A computerized system for reporting medication events inpsychiatry: the first two years of operation. J Psychiatr Ment Health Nurs.2011;18(4):308–15.
45. Barrow PL, Jadeja M, Foy M. Establishing electronic adverse drug reactionreporting in UK primary care clinical IT systems. Drug Saf. 2012;35(10):909–10.
46. Lee J-H, Park KH, Moon HJ, Lee YW, Park J-W, Hong C-S. Spontaneous reportingof adverse drug reactions through electronic submission from regional societyhealthcare professionals in Korea. Yonsei Med J. 2012;53(5):1022–7.
47. Yanqing J, Fangyang S, Tran J. A high performance agent-based system forreporting suspected adverse drug reactions. Las Vegas: InformationTechnology: New Generations (ITNG); 2012. Ninth International Conferenceon; 2012 16–18 April 2012.
48. Pares Y, Declerck G, Hussain S, Ng R, Jaulent M-C. Building a time-savingand adaptable tool to report adverse drug events. Stud Health Tech Inform.2013;192:903–7.
49. Canadell Vilarrasa L, Mota Almeida M, Almeida Perez RS, Torrent Pou J,Castillo Palomares L, Martin Marques M, et al. Electronic health recordimproves adverse drug reactions reports. Int J Clin Pharm. 2013;35(6):1337.
• We accept pre-submission inquiries
• Our selector tool helps you to find the most relevant journal
• We provide round the clock customer support
• Convenient online submission
• Thorough peer review
• Inclusion in PubMed and all major indexing services
• Maximum visibility for your research
Submit your manuscript atwww.biomedcentral.com/submit
Submit your next manuscript to BioMed Central and we will help you at every step:
Ribeiro-Vaz et al. BMC Medical Informatics and Decision Making (2016) 16:27 Page 10 of 10

1DOI:10.1590/S1518-8787.2016050006122
Artigo OriginalRev Saúde Pública 2016;50:14
Promoting adverse drug reaction reporting: comparison of different approachesInês Ribeiro-VazI,II, Cristina Costa SantosII,III, Ricardo Cruz-CorreiaII,III
I Unidade de Farmacovigilância do Norte. Faculdade de Medicina. Universidade do Porto. Porto, PortugalII Centro de Investigação em Tecnologias e Serviços de Saúde. Faculdade de Medicina. Universidade do Porto.
Porto, PortugalIII Departamento de Ciências da Informação e da Decisão em Saúde. Faculdade de Medicina. Universidade do Porto.
Porto, Portugal
ABSTRACT
OBJECTIVE: To describe different approaches to promote adverse drug reaction reporting among health care professionals, determining their cost-effectiveness.
METHODS: We analyzed and compared several approaches taken by the Northern Pharmacovigilance Centre (Portugal) to promote adverse drug reaction reporting. Approaches were compared regarding the number and relevance of adverse drug reaction reports obtained and costs involved. Costs by report were estimated by adding the initial costs and the running costs of each intervention. These costs were divided by the number of reports obtained with each intervention, to assess its cost-effectiveness.
RESULTS: All the approaches seem to have increased the number of adverse drug reaction reports. We noted the biggest increase with protocols (321 reports, costing 1.96 € each), followed by first educational approach (265 reports, 20.31 €/report) and by the hyperlink approach (136 reports, 15.59 €/report). Regarding the severity of adverse drug reactions, protocols were the most efficient approach, costing 2.29 €/report, followed by hyperlinks (30.28 €/report, having no running costs). Concerning unexpected adverse drug reactions, the best result was obtained with protocols (5.12 €/report), followed by first educational approach (38.79 €/report).
CONCLUSIONS: We recommend implementing protocols in other pharmacovigilance centers. They seem to be the most efficient intervention, allowing receiving adverse drug reactions reports at lower costs. The increase applied not only to the total number of reports, but also to the severity, unexpectedness and high degree of causality attributed to the adverse drug reactions. Still, hyperlinks have the advantage of not involving running costs, showing the second best performance in cost per adverse drug reactions report.
DESCRIPTORS: Drug-Related Side Effects and Adverse Reactions. Forms and Records Control. Drug Monitoring. Adverse Drug Reaction Reporting Systems. Pharmacovigilance.
Correspondence: Inês Ribeiro-Vaz Unidade de Farmacovigilância do Norte Faculdade de Medicina da Universidade do Porto Rua Doutor Plácido da Costa 4200-450 Porto, Portugal E-mail: [email protected]
Received: 16 Jan 2015
Approved: 9 Jun 2015
How to cite: Ribeiro-Vaz I, Santos CC, Cruz-Correia R. Promoting adverse drug reaction reporting: comparison of different approaches. Rev Saude Publica. 2016;50:14.
Copyright: This is an open-access article distributed under the terms of the Creative Commons Attribution License, which permits unrestricted use, distribution, and reproduction in any medium, provided that the original author and source are credited.
http://www.rsp.fsp.usp.br/
2
Promoting adverse drug reaction reporting Ribeiro-Vaz I et al.
DOI:10.1590/S1518-8787.2016050006122
INTRODUCTION
Adverse drug reactions (ADR) are inherent to medicine use20, and most of them can only be detected after the commercialization of the drug14. In fact, during clinical trials, rare reactions are hardly detected, as well as the ones associated with chronic utilization of the drug. It is also difficult to predict the drug effect among special populations (pregnant women, children, older adults), as they usually do not participate in the clinical research.
Because of these limitations, post-marketing surveillance is essential, which is why most countries have pharmacovigilance centers to monitor detected ADR. The fundamental tool used by these centers is the spontaneous reporting of ADR by healthcare professionals and consumers. This method consists in describing an adverse episode suspected to be caused by one or more drugs and provides valuable information to the regulatory health authorities, which is important for the decisions about marketed medicines. The biggest problem of this method is the underreporting, i.e., ADR are detected but not reported to national regulatory health authorities. Most developed countries face this situation15,19. Worldwide, many approaches have been completed to fight the major problem of ADR underreporting, such as regular visits to health professionals10, questionnaire studies2, educational interventions (including workshops, meetings and presentations)4,12,16, among others.
This study aimed to describe several approaches that intended to improve ADR reporting and determine the cost-effectiveness of each one of them.
METHODS
From its creation (in 2000) to 2003, Northern Pharmacovigilance Centre, a Portuguese regional pharmacovigilance center, had an extremely low rate of ADR reports, about 43 per year/million inhabitants. We realize this value is very low when compared with the World Health Organization (WHO) recommendation for an Optimal National Centre, which is at least 200 reports per year/million inhabitantsa.
To reach its objectives, in 2004 the Centre established a collaboration protocol (protocol approach) with the immunoallergology department of a central hospital (located on the same street as the Centre) to collect every suspected case of ADR emerged in appointments related to drug allergies. This collaboration includes regular visits of the pharmacovigilance staff to the immunoallergology department to collect the detected cases in ADR report forms, under the physician supervision. Then, the form is signed by the physician and follows the normal course of all the ADR spontaneous reports. This approach was replicated two more times, in 2007 and 2009, in two other immunoallergology departments, one from a specialized hospital (pediatric hospital, located 6 km from the Centre) and another from a central hospital (located 11 km from the Centre). These three protocols remain active.
A study conducted in 2004 provided educational interventions (educational approach) for physicians and pharmacists4,8. Those interventions were based on a previous case-control study that identified the reasons for underreporting6,7. The educational approach includes workshops about pharmacovigilance at health care professionals’ working places.
Since the effect of educational interventions decreased over time, the authors of the previously described work promote reinforcement interventions (educational and telephone approach). We started a new study in 2007, also among physicians and pharmacists. This study consisted not only in outreach interventions (workshops), but also in telephone interviews9,17. The phone interviews followed a script about ADR and the importance of reporting. Details are described in a previous publication17.
a Governo de Portugal, INFARMED – Autoridade Nacional do Medicamento e Produtos de Saúde. Farmacovigilância em Portugal. Lisboa: INFARMED; 2004.

3
Promoting adverse drug reaction reporting Ribeiro-Vaz I et al.
DOI:10.1590/S1518-8787.2016050006122
We propose a new approach: the inclusion of a hyperlink (hyperlink approach) to an online ADR reporting form on hospitals’ electronic patient records (EPR). The main aim of this study, performed from 2006 to 2010, was to evaluate the impact of these hyperlinks on the number of spontaneous ADR reports18. The inclusion of hyperlinks began in December 2007 and continued over the following five months. The temporal distribution of all these approaches is shown in Figure 1.
In the present work, we analyzed the number of ADR reports obtained with each one of the described approaches. We know exactly which ADR reports were originated at the three departments participating in the protocol intervention and analyzed them separately. Four physicians were involved.
The first educational intervention (in 2004) involved three hospitals, 26 healthcare centers, and 73 pharmacies. About 900 health care professionals attended these interventions4. About 340 health care professionals (physicians and pharmacists) attended the second intervention (second workshop + telephone, both in 2007). Five health care centers, two hospitals, and 40 pharmacies received the telephone intervention, and 16 health care centers, two hospitals, and 23 pharmacies received the second educational intervention.
For the hyperlinks, we estimated 15,000 health care professionals potentially affected by the intervention, as this is the total number of professionals working at the 12 participating hospital centers (corresponding to 22 hospitals). It was the first exposure to any intervention for eight of these hospital centers.
The variables analyzed were: type of approach, ADR relevance, initial costs of the interventions, running costs of the interventions, and costs per ADR report. Each of these variables is described as follows.
• Type of approach: hyperlink, protocol, educational, and telephone approach.
• Number of ADR reports obtained with each intervention: the difference between ADR reports received two years after the intervention and ADR reports received two years before the intervention.
• ADR relevance: we adopted the following criteria: (1) ADR severity; (2) ADR expectedness; and (3) causality attributed to the ADR report. A serious ADR is any untoward medical occurrence that results in death, requires inpatient hospitalization or prolongation of existing hospitalization, results in persistent or significant disability or incapacity, or is life-threatening2. An unexpected ADR is the one in which the nature or severity is not consistent with domestic labeling or market authorization, or expected from characteristics of the drug2. We considered an ADR more relevant if one of the two highest degrees of causality was attributed to it: (1) definitive or certain, or (2) probable (the medicine was the likely causative agent of an observed adverse reaction)b.
• Initial costs of the interventions: we consider as initial costs the expenses needed for implementing the approach, as educational material and staff working hours. These costs are described in Table 1.
b World Health Organization; Uppsala Monitoring Centre Uppsala. Uppsala: Uppsala Monitoring Centre Uppsala [updated 2015 Aug 18; cited 2013 Aug 9]. Available from: http://www.who-umc.org/DynPage.aspx?id=22682
Figure 1. Timeline of the studied approaches.
January 2001 December 2012
Jan 02 Jan 03 Jan 04 Jan 05 Jan 06 Jan 07 Jan 08 Jan 09 Jan 10 Jan 11 Jan 12
Aug 093rd immunoalergology protocol
Dec 07hyperlink approach
Jul 072nd immunoalergology protocol
Jul 07telephone approach
Apr 072nd educational approach
Mar 041st educational approach
Apr 041st immunoalergology protocol

4
Promoting adverse drug reaction reporting Ribeiro-Vaz I et al.
DOI:10.1590/S1518-8787.2016050006122
• Running costs of the interventions: annual running costs are the expenses needed for continuing the projects, as fuel, material and staff working hours. These costs are described in Table 1. We did not consider the normal (daily) costs of ADR report processing, as we only meant to compare the costs involved in obtaining ADR reports.
• Costs per ADR report: costs by ADR report were estimated by adding initial costs and running costs. Initial costs per ADR report were obtained by dividing initial costs by the difference between ADR reports received two years after the intervention and ADR reports received two years before the intervention (which we consider to be the number of notifications obtained with each intervention). Running costs were obtained by dividing the running costs of the two-year intervention by the number of notifications obtained with each intervention. To assess the cost-effectiveness of each intervention, we considered the sum of these costs (initial + running costs) as the total cost of each ADR obtained in the two years following each intervention.
The pharmacovigilance center website uses a web server and has audit trails that read each site visit since 2006. These audit trails are processed using the Webalizer program (www.webalizer.org) to estimate site hits, user logins and visits. ADR reports obtained by these approaches are included in a database. We collect them by selecting the report date and origin.
We presented the total number of reports received in each quarter during the period studied. For each health institution, ADR reports made before and after the intervention, if any, were measured.
To examine whether each intervention increased the ADR report trend, an interrupted time series analysis using autoregressive integrated moving average (ARIMA) was performed using quarter data of ADR reports, as well as each intervention ( first and second educational approach, telephone approach, and hyperlink approach) as dichotomous variables (before and after intervention).
We performed an additional analysis with the hyperlinks approach, to consider the institutions exposed to any type of intervention for the first time. With this sub-analysis we intended to isolate the ADR reports obtained with each intervention.
This study was approved by the local Ethics Committee of the Faculdade de Medicina of the Universidade do Porto (Process PCEDCSS-FMUP 08/2014, approved in May 7, 2014).
ApproachInitial costs Annual running costs
Value Description Value Description
Protocol approach
150 €Pharmacovigilance and clini-cal service staff working hours
240 €Fuel, material, and pharma-covigilance and clinical staff
working hours
Hyperlink approach
2,120 €Pharmacovigilance and
software development staff working hours
- -
Educational approach
200 €Educational material and pharmacovigilance staff
working hours2,500 €
Fuel, material, and pharmaco-vigilance staff working hours
Telephone approach
400 €Telephone calls during the
pilot study and pharmacovigi-lance staff working hours
800 €Telephone calls, material,
and pharmacovigilance staff working hours
Table 1. Estimated costs of each approach.
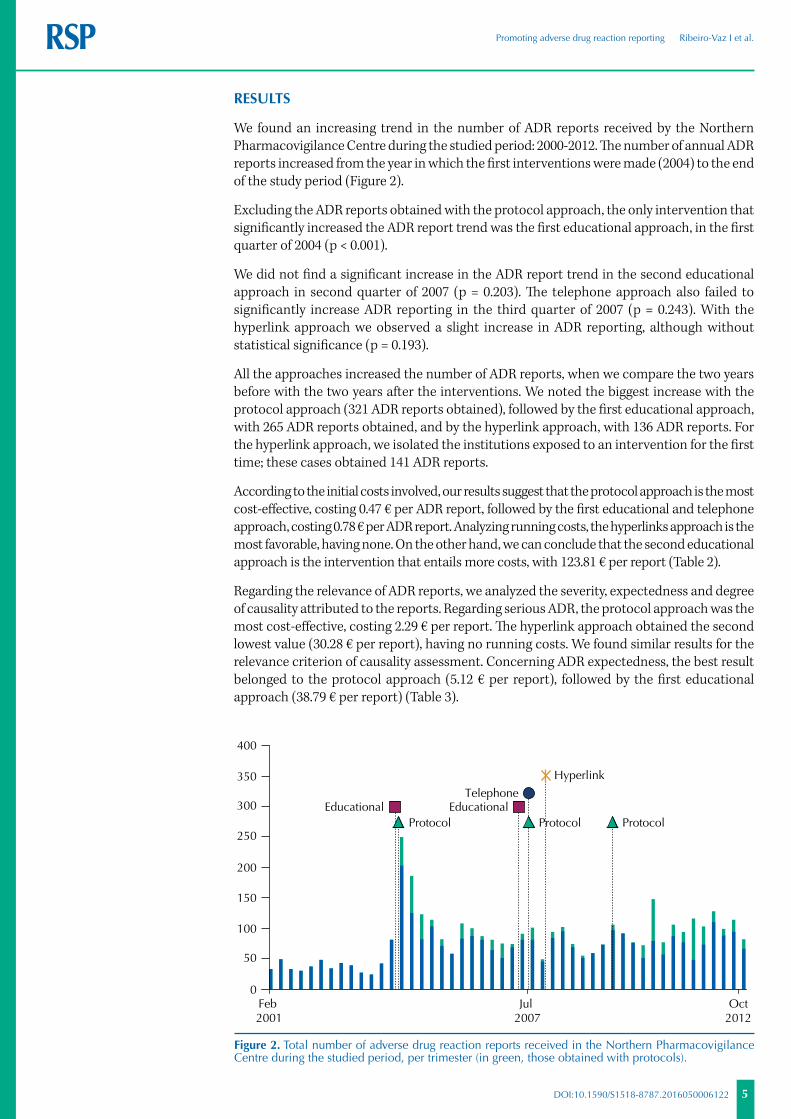
5
Promoting adverse drug reaction reporting Ribeiro-Vaz I et al.
DOI:10.1590/S1518-8787.2016050006122
RESULTS
We found an increasing trend in the number of ADR reports received by the Northern Pharmacovigilance Centre during the studied period: 2000-2012. The number of annual ADR reports increased from the year in which the first interventions were made (2004) to the end of the study period (Figure 2).
Excluding the ADR reports obtained with the protocol approach, the only intervention that significantly increased the ADR report trend was the first educational approach, in the first quarter of 2004 (p < 0.001).
We did not find a significant increase in the ADR report trend in the second educational approach in second quarter of 2007 (p = 0.203). The telephone approach also failed to significantly increase ADR reporting in the third quarter of 2007 (p = 0.243). With the hyperlink approach we observed a slight increase in ADR reporting, although without statistical significance (p = 0.193).
All the approaches increased the number of ADR reports, when we compare the two years before with the two years after the interventions. We noted the biggest increase with the protocol approach (321 ADR reports obtained), followed by the first educational approach, with 265 ADR reports obtained, and by the hyperlink approach, with 136 ADR reports. For the hyperlink approach, we isolated the institutions exposed to an intervention for the first time; these cases obtained 141 ADR reports.
According to the initial costs involved, our results suggest that the protocol approach is the most cost-effective, costing 0.47 € per ADR report, followed by the first educational and telephone approach, costing 0.78 € per ADR report. Analyzing running costs, the hyperlinks approach is the most favorable, having none. On the other hand, we can conclude that the second educational approach is the intervention that entails more costs, with 123.81 € per report (Table 2).
Regarding the relevance of ADR reports, we analyzed the severity, expectedness and degree of causality attributed to the reports. Regarding serious ADR, the protocol approach was the most cost-effective, costing 2.29 € per report. The hyperlink approach obtained the second lowest value (30.28 € per report), having no running costs. We found similar results for the relevance criterion of causality assessment. Concerning ADR expectedness, the best result belonged to the protocol approach (5.12 € per report), followed by the first educational approach (38.79 € per report) (Table 3).
0
50
100
150
200
250
300
350
400
Jul 2007
Feb 2001
EducationalProtocol
EducationalProtocol Protocol
Telephone
Hyperlink
Oct2012
Figure 2. Total number of adverse drug reaction reports received in the Northern Pharmacovigilance Centre during the studied period, per trimester (in green, those obtained with protocols).

6
Promoting adverse drug reaction reporting Ribeiro-Vaz I et al.
DOI:10.1590/S1518-8787.2016050006122
Approach Intervention
Adverse drug reaction reportsCosts (€) per report
Before After
2 years 1 year 1 year 2 years Initial costs Running costs (2 years) Total
Protocols 0 0 204 117 0.47 1.49 1.96
Hyperlinks 153 120 277 132 15.59 0.00 15.59
Hyperlinks NPE* 68 47 146 110 15.03 0.00 15.03
Educational
1st workshop 36 24 257 68 0.78 19.53 20.31
Pharmacies 2 8 110 25 1.60 40.00 41.60
Health care centers 25 7 102 17 2.29 57.47 59.77
Hospitals 9 9 45 26 3.77 94.34 98.11
Phone Interview 47 26 87 34 8.33 33.33 41.67
Pharmacies 23 10 37 14 22.22 88.88 111.11
Health care centers 3 1 8 2 66.67 266.67 333.33
Hospitals 21 15 42 18 16.67 66.67 83.33
Educational
2nd workshop 54 40 106 30 4.76 119.05 123.81
Pharmacies 39 25 69 18 8.70 217.39 226.09
Health care centers 10 13 26 6 22.22 555.55 577.78
Hospitals 5 2 11 6 20.00 500.00 520.00
* NPE: Not previously exposed. Considering only the institutions without any previous intervention.
Table 2. Number and costs of adverse drug reaction reports obtained with each intervention.
Approach Intervention
Adverse drug reaction reportsCosts (€) per report
Before After
2 years 1 year 1 year 2 years Initial costsRunning costs
(2 years)Total
Serious
Protocols 0 0 180 94 0.54 1.75 2.29
Hyperlinks 113 96 193 86 30.28 0.00 30.28
Educational 1st workshop 12 15 111 42 1.59 32.68 34.27
Phone interview 29 19 55 21 14.29 57.14 71.43
Educational 2nd workshop 37 23 44 8 - - -
High degree of causality
Protocols 0 0 165 66 0.65 2.08 2.73
Hyperlinks 114 86 232 109 15.03 0.00 15.03
Educational 1st workshop 14 17 169 47 1.08 27.03 28.11
Phone interview 40 17 65 26 11.76 47.06 58.82
Educational 2nd workshop 37 27 74 22 6.25 156.25 162.50
Unexpected
Protocols 0 0 70 53 1.22 3.90 5.12
Hyperlinks 63 40 69 37 706.67 0.00 706.67
Educational 1st workshop 10 7 111 40 1.49 37.30 38.79
Phone interview 17 11 22 7 400.00 1,600.00 2,000.00
Educational 2nd workshop 24 17 28 6 - - -
Table 3. Number and costs of serious, unexpected, and classified with a high degree of causality adverse drug reaction reports obtained with each intervention.
7
Promoting adverse drug reaction reporting Ribeiro-Vaz I et al.
DOI:10.1590/S1518-8787.2016050006122
DISCUSSION
Although there is some overlap of interventions, making it difficult sometimes to differentiate the gains from each one of them, our results show that, in general, all interventions increased the number of ADR reports when comparing two years before with two years after.
Protocols in hospital immunoallergology departments seem to be the most efficient intervention. In fact, this intervention is the one that allows obtaining ADR reports with lower costs involved, with an increase not only in the total number of ADR reports, but also in the severity, unexpectedness, and high degree of causality attributed to the ADR.
Nevertheless, these protocols have the disadvantage of increasing the reports of ADR in patients of a specific population (patients with allergies), which can bias the global pharmacovigilance data. We started to establish these protocols at the request of one of the immunoallergology departments, but we are trying to establish similar protocols in other departments (as oncology departments, hospital pharmacies, among others), to solve the bias issue.
On the other hand, the hyperlink approach has the great advantage of not involving running costs, and seems to have the second best performance in costs per ADR report. Even when we consider only the hospitals exposed to an intervention for the first time (to avoid the overlap effect), this behavior remains.
We also concluded that the first educational intervention was much more efficient than the second one. In fact, the second intervention seemed to be counterproductive, as shown by the results of serious and unexpected ADR reports (these numbers decreased after the intervention). We already had this conviction since this intervention was performed. In fact, in most health care institutions where the second intervention took place, we found professionals less receptive than in the first intervention, as they already knew the subject and did not seem to believe they needed another workshop about it.
Unfortunately, we are not able to compare our results with other authors’ results, as we failed to find any study addressing the issue of ADR report costs. Many studies proposed strategies to improve ADR reports1,11,13 and some authors have already studied the costs of an ADR3,5. However, no one had studied the costs involved in obtaining ADR reports before, which is the novelty of our work.
Although there might be some overlap and eventual contamination among the interventions, we believe that this did not introduce an important bias in our conclusions. First, we knew exactly which reports were originated at the departments participating in the protocols. Moreover, we included in our results the ADR reports obtained after the hyperlink inclusion in the hospitals that had an intervention for the first time. Thus, we could infer that the gain in ADR reports after hyperlink inclusion was caused by this intervention. Furthermore, there is no problem of overlapping for the first educational approach (workshops in 2004) because this was the first intervention made. The only interventions for which we cannot resolve the overlapping limitation is the second educational intervention and the phone intervention. However, these two interventions were planned as complementary to the first one.
We believe that our work can help pharmacovigilance centers worldwide choose the best set of interventions to promote adverse drug reactions report. This choice must be based on the particular characteristics of each center, such as available staff and budget, geographic location, proximity to hospitals, among others.
Based on our results, we recommend the implementation of protocols with hospital immunoallergology departments, as they seem to be the most cost-effective intervention, followed by hyperlinks to ADR reporting forms, and the promotion of educational interventions to health care professionals for the first time.

8
Promoting adverse drug reaction reporting Ribeiro-Vaz I et al.
DOI:10.1590/S1518-8787.2016050006122
REFERENCES
1. Abadie D, Chebane L, Bert M, Durrieu G, Montastruc JL. Online reporting of adverse drug reactions: a study from a French regional pharmacovigilance center. Therapie. 2014;69(5):395-400. DOI:10.2515/therapie/2014035
2. Biagi C, Montanaro N, Buccellato E, Roberto G, Vaccheri A, Motola D. Underreporting in pharmacovigilance: an intervention for Italian GPs (Emilia-Romagna region). Eur J Clin Pharmacol, 2013;69(2):237-44. DOI:10.1007/s00228-012-1321-7
3. Bordet R, Gautier S, Le Louet H, Dupuis B, Caron J. Analysis of the direct cost of adverse drug reactions in hospitalised patients. Eur J Clin Pharmacol. 2001;56(12):935-41. DOI:10.1007/s002280000260
4. Figueiras A, Herdeiro T, Polonia J, Gestal-Otero JJ. An educational intervention to improve physician reporting of adverse drug reactions: a cluster-randomized controlled trial. JAMA. 2006;296(9):1086-93. DOI:10.1001/jama.296.9.1086
5. Gautier S, Bachelet H, Bordet R, Caron J. The cost of adverse drug reactions. Expert Opin Pharmacother. 2003;4(3):319-26. DOI:10.1517/14656566.4.3.319
6. Herdeiro MT, Figueiras A, Polónia J, Gestal-Otero JJ. Physicians’ attitudes and adverse drug reaction reporting: a case-control study in Portugal. Drug Saf. 2005;28(9):825-33. DOI:10.2165/00002018-200528090-00007
7. Herdeiro MT, Figueiras A, Polónia J, Gestal-Otero JJ. Influence of pharmacists’ attitudes on adverse drug reaction reporting: a case-control study in Portugal. Drug Saf. 2006;29(4):331-40. DOI:10.2165/00002018-200629040-00004
8. Herdeiro MT, Polónia J, Gestal-Otero JJ, Figueiras A. Improving the reporting of adverse drug reactions: a cluster-randomized trial among pharmacists in portugal. Drug Saf. 2008;31(4):335-44. DOI:10.2165/00002018-200831040-00007
9. Herdeiro MT, Ribeiro-Vaz I, Ferreira M, Polónia J, Falcao A, Figueiras A. Workshop- and telephone-based interventions to improve adverse drug reaction reporting: a cluster-randomized trial in Portugal. Drug Saf. 2012;35(8):655-65. DOI:10.2165/11599750-000000000-00000
10. Jacquot JGM, Baudrin D, Chastel X, Montastruc JL, Bagheri H. [Could we improve notification of adverse drugs reactions in hospital? Assessment of 5 years of network PharmacoMIP’s activities]. Thérapie. 2002;67(3):231-6. French. DOI:10.1007/BF03261962
11. Johansson ML, Brunlöf G, Edward C, Wallerstedt SM. Effects of e-mails containing ADR information and a current case report on ADR reporting rate and quality of reports. Eur J Clin Pharmacol. 2009;65(5):511-4. DOI:10.1007/s00228-008-0603-6
12. Khalili H, Mohebbi N, Hendoiee N, Keshtkar AA, Dashti-Khavidaki S. Improvement of knowledge, attitude and perception of healthcare workers about ADR, a pre- and post-clinical pharmacists’ interventional study. BMJ Open. 2012;2:e000367. DOI:10.1136/bmjopen-2011-000367
13. Lander AR, Blicher TM, Jimenez-Solem E, Jespersen M, Kampmann JP, Christensen HR. Introducing an adverse drug event manager. Eur J Hosp Pharm Sci Pract. 2013;20(2):78-81. DOI:10.1136/ejhpharm-2012-000171
14. Lasser K, Allen P, Woolhandler S, Himmlstein F, Wolfe S, Bor D. Timing of new black box warnings and withdrawals for prescription medications. JAMA. 2002;287(17):2215-20. DOI:10.1001/jama.287.17.2215
15. McGettigan P, Golden J, Conroy RM, Arthur N, Feely J. Reporting of adverse drug reactions by hospital doctors and the response to intervention. Br J Clin Pharmacol. 1997;44(1):98-100. DOI:10.1046/j.1365-2125.1997.00616.x
16. Pagotto C, Varallo F, Mastroianni P. Impact of educational interventions on adverse drug events reporting. Int J Technol Assess Health Care. 2013;29(4):410-7. DOI:10.1017/S0266462313000457
17. Ribeiro-Vaz I, Herdeiro MT, Polonia J, Figueiras A. Estratégias para aumentar a sensibilidade da farmacovigilância em Portugal. Rev Saude Publica. 2011;45(1):129-35. DOI:10.1590/S0034-89102010005000050
18. Ribeiro-Vaz I, Santos C, Costa-Pereira A, Cruz-Correia R. Promoting spontaneous adverse drug reaction reporting in hospitals using a hyperlink to the online reporting form: an ecological study in Portugal. Drug Saf. 2012;35(5):387-94. DOI:10.2165/11597190-000000000-00000

9
Promoting adverse drug reaction reporting Ribeiro-Vaz I et al.
DOI:10.1590/S1518-8787.2016050006122
19. Smith CC, Bennett PM, Pearce HM, Harrison PI, Reynolds DJ, Aronson JK et al. Adverse drug reactions in a hospital general medical unit meriting notification to the Committee on Safety of Medicines. Br J Clin Pharmacol. 1996;42(4):423-9. DOI:10.1111/j.1365-2125.1996.tb00004.x
20. World Health Organization. Importance of pharmacovigilance: safety monitoring of medicinal products. Geneve: World Health Organization; 2002.
Authors’ Contribution: Paper drafting and data collection: IRV. Statistical analysis: CS. Supervision of the paper drafting and conceptualizing of the study: RCC. All the authors were involved in the writing of the manuscript, discussion, and the revision of the whole article.
Conflict of Interest: The authors declare no conflict of interest.
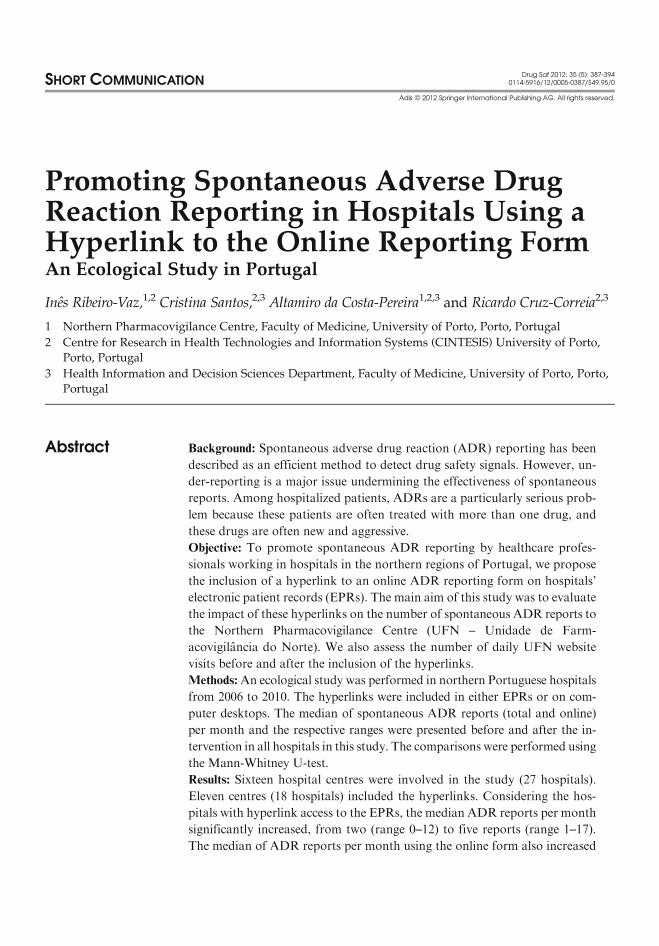
Promoting Spontaneous Adverse DrugReaction Reporting in Hospitals Using aHyperlink to the Online Reporting FormAn Ecological Study in Portugal
Ines Ribeiro-Vaz,1,2 Cristina Santos,2,3 Altamiro da Costa-Pereira1,2,3 and Ricardo Cruz-Correia2,3
1 Northern Pharmacovigilance Centre, Faculty of Medicine, University of Porto, Porto, Portugal
2 Centre for Research in Health Technologies and Information Systems (CINTESIS) University of Porto,
Porto, Portugal
3 Health Information and Decision Sciences Department, Faculty of Medicine, University of Porto, Porto,
Portugal
Abstract Background: Spontaneous adverse drug reaction (ADR) reporting has been
described as an efficient method to detect drug safety signals. However, un-
der-reporting is a major issue undermining the effectiveness of spontaneous
reports. Among hospitalized patients, ADRs are a particularly serious prob-
lem because these patients are often treated with more than one drug, and
these drugs are often new and aggressive.
Objective: To promote spontaneous ADR reporting by healthcare profes-
sionals working in hospitals in the northern regions of Portugal, we propose
the inclusion of a hyperlink to an online ADR reporting form on hospitals’
electronic patient records (EPRs). The main aim of this study was to evaluate
the impact of these hyperlinks on the number of spontaneous ADR reports to
the Northern Pharmacovigilance Centre (UFN – Unidade de Farm-
acovigilancia do Norte). We also assess the number of daily UFN website
visits before and after the inclusion of the hyperlinks.
Methods:An ecological study was performed in northern Portuguese hospitals
from 2006 to 2010. The hyperlinks were included in either EPRs or on com-
puter desktops. The median of spontaneous ADR reports (total and online)
per month and the respective ranges were presented before and after the in-
tervention in all hospitals in this study. The comparisons were performed using
the Mann-Whitney U-test.
Results: Sixteen hospital centres were involved in the study (27 hospitals).
Eleven centres (18 hospitals) included the hyperlinks. Considering the hos-
pitals with hyperlink access to the EPRs, the median ADR reports per month
significantly increased, from two (range 0–12) to five reports (range 1–17).
The median of ADR reports per month using the online form also increased
SHORT COMMUNICATIONDrug Saf 2012; 35 (5): 387-394
0114-5916/12/0005-0387/$49.95/0
Adis ª 2012 Springer International Publishing AG. All rights reserved.

significantly, from one (range 0–5) before the intervention to four (range
1–17) after it. Moreover, serious ADRs increased 3-fold, and non-previously
described ADRs increased 4.5-fold. None of these significant increases were
observed in the hospitals where the hyperlink was not installed. We also
found a significant increase in daily UFN website visits, from ten before the
intervention to 27 after it (p < 0.001).Conclusion: The increase in ADR reporting shows that the inclusion of hy-
perlinks to online ADR reporting forms is an easy and cost-effective way to
change health professional behaviours with regard to spontaneous ADR reports.
Introduction
Adverse drug reactions (ADRs) are a well rec-ognized public health problem worldwide anda major cause of death and hospitalization indeveloped countries.[1] In fact, rare and long-termADRs are difficult to detect during the drugdevelopment stage. Only when the drugs begin tobe used by a large population after marketingauthorization is it possible to detect new ADRsnot previously identified during clinical trials.In reality, the safety of a new drug cannot beestablished until it has been on the market forseveral years.[2] As such, it is essential to keep re-actions to drugs under close surveillance, especiallyafter marketing, through a pharmacovigilancesystem.
In Portugal, this system is based on sponta-neous ADR reports made by healthcare profes-sionals.[3] These reports can be made using paper,telephone, e-mail or through an online form,[4]
and they consist of a description of an adverseevent supposedly caused by a medicine. Spon-taneous ADR reporting has been described asan efficient method for detecting drug safetysignals.[5] However, under-reporting is a majorissue undermining the effectiveness of spontane-ous reporting. Several studies suggest that lessthan 10% of detected ADRs are effectively re-ported to medicine regulatory authorities.[6,7] Inaddition, the spontaneous ADR report rate innorthern Portugal was 90 reports/million in-habitants in 2009, which is highly unsatisfactoryaccording to the WHO recommendations (200reports/million inhabitants[8]).
Worldwide, systems using informatics to pro-mote ADR reporting or to detect ADRs thathave occurred in healthcare institutions havebeen tested and are currently being used. Com-puter programs that allow voluntary and auto-mated detection of ADRs,[9,10] informatics toolscreated to analyse clinical databases,[11] or web-sites that actively inform healthcare profes-sionals[12] are examples of such systems.
Among hospitalized patients, ADRs are a par-ticularly serious problem. In fact, these patients areoften treated with more than one drug, and thesedrugs are often new and aggressive. Despite thesetreatments, there is currently no specific systemfor monitoring or reporting ADRs in Portuguesehospitals. We believe that making the reportingsystem easier would considerably increase thenumber of reported ADRs.
With the intention of promoting spontaneousADR reporting by healthcare professionals work-ing in hospitals, we proposed the inclusion of ahyperlink to an online ADR reporting form (partof the Northern Pharmacovigilance Centre [UFN]website) on the electronic patient records (EPRs)or on the desktops of hospital computers. Withthis system, we expected to reach not only thephysicians but also the pharmacists and nursesworking at these hospitals. In Portuguese hospi-tals, pharmacists have an important role in ADRdetection and reporting because physicians dis-cuss with them the adverse events that occurredduring medical treatment, asking for alternativedrugs available at the pharmacy. In addition,some pharmacists are part of the clinical visit andfrequently detect ADRs themselves.
388 Ribeiro-Vaz et al.
Adis ª 2012 Springer International Publishing AG. All rights reserved. Drug Saf 2012; 35 (5)

Aim
Our main aim was to evaluate the impact of thehyperlinks installed in Portuguese hospitals on thenumber of ADRs reported by these hospitals usingthe hyperlink versus those that did not, and we alsoevaluated the number of visits to the UFN website.
Methods
Intervention
Hyperlinks to the ADR online reporting UFNform were proposed to the 18 northern Portu-guese hospitals. The hyperlinks can be includedeither in healthcare professional-specific software(typically EPRs or pharmacy-specific applicationsused by doctors, nurses and pharmacists) or onhospital computer desktops (see figure 1 for ex-amples of both situations). Notably, most of thePortuguese EPRs are web-based, so the hyperlinkautomatically opens the UFN form in a newbrowser window.
The online reporting UFN form requires thehealth professional to log in with their personalaccount. Patient data are collected in an anon-ymous way (only the initials of the patient nameare required, aiming to help the health professionalidentify each case) and are secured in an Oracledatabase with appropriate access restrictions.
In the beginning of October 2007, a letter wassent to the chief physicians of these 18 northernPortuguese hospitals suggesting the inclusion ofthe hyperlink. If there was no response within2 weeks, clinical administration boards were re-minded by telephone. Thirteen centres forwardedthis announcement to the respective computerdepartments, and only one hospital forwarded itto the pharmaceutical department. Five of thecentres failed to respond by the end of 2010. Afterapproval by the hospital board and after beingforwarded to the respective departments, UFNmade a third contact to explain technical specifi-cations and to send the specific hyperlink for eachhospital.
Hyperlinks toADR Form
Fig. 1. Examples of hyperlinks on a computer desktop (back image) and in an electronic patient record (front image).
Promoting Spontaneous ADR Reporting in Hospitals Using Hyperlinks 389
Adis ª 2012 Springer International Publishing AG. All rights reserved. Drug Saf 2012; 35 (5)
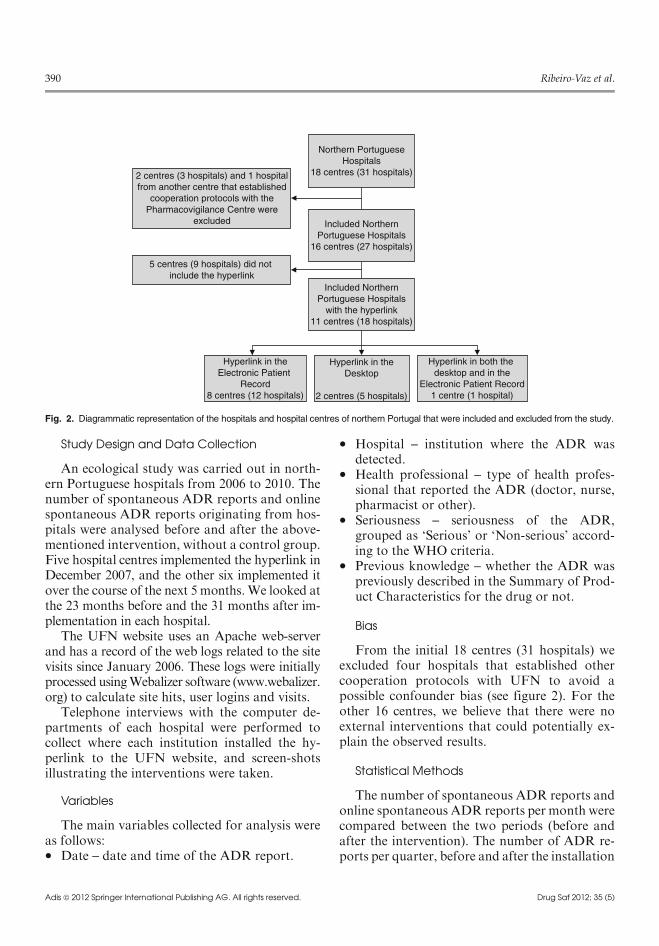
Study Design and Data Collection
An ecological study was carried out in north-ern Portuguese hospitals from 2006 to 2010. Thenumber of spontaneous ADR reports and onlinespontaneous ADR reports originating from hos-pitals were analysed before and after the above-mentioned intervention, without a control group.Five hospital centres implemented the hyperlink inDecember 2007, and the other six implemented itover the course of the next 5 months.We looked atthe 23 months before and the 31 months after im-plementation in each hospital.
The UFN website uses an Apache web-serverand has a record of the web logs related to the sitevisits since January 2006. These logs were initiallyprocessed usingWebalizer software (www.webalizer.org) to calculate site hits, user logins and visits.
Telephone interviews with the computer de-partments of each hospital were performed tocollect where each institution installed the hy-perlink to the UFN website, and screen-shotsillustrating the interventions were taken.
Variables
The main variables collected for analysis wereas follows:� Date – date and time of the ADR report.
� Hospital – institution where the ADR wasdetected.
� Health professional – type of health profes-sional that reported the ADR (doctor, nurse,pharmacist or other).
� Seriousness – seriousness of the ADR,grouped as ‘Serious’ or ‘Non-serious’ accord-ing to the WHO criteria.
� Previous knowledge – whether the ADR waspreviously described in the Summary of Prod-uct Characteristics for the drug or not.
Bias
From the initial 18 centres (31 hospitals) weexcluded four hospitals that established othercooperation protocols with UFN to avoid apossible confounder bias (see figure 2). For theother 16 centres, we believe that there were noexternal interventions that could potentially ex-plain the observed results.
Statistical Methods
The number of spontaneous ADR reports andonline spontaneous ADR reports per month werecompared between the two periods (before andafter the intervention). The number of ADR re-ports per quarter, before and after the installation
2 centres (3 hospitals) and 1 hospitalfrom another centre that established
cooperation protocols with thePharmacovigilance Centre were
excluded
Northern PortugueseHospitals
18 centres (31 hospitals)
Included NorthernPortuguese Hospitals
16 centres (27 hospitals)
Included NorthernPortuguese Hospitals
with the hyperlink11 centres (18 hospitals)
5 centres (9 hospitals) did not include the hyperlink
Hyperlink in theElectronic Patient
Record8 centres (12 hospitals)
Hyperlink in theDesktop
2 centres (5 hospitals)
Hyperlink in both the desktop and in the
Electronic Patient Record1 centre (1 hospital)
Fig. 2. Diagrammatic representation of the hospitals and hospital centres of northern Portugal that were included and excluded from the study.
390 Ribeiro-Vaz et al.
Adis ª 2012 Springer International Publishing AG. All rights reserved. Drug Saf 2012; 35 (5)

of the hyperlinks, is presented graphically (seefigure 3). The number of ADR reports per quar-ter in the excluded hospitals and in the hospitalsthat did not participate (those that did not installthe hyperlinks) is presented in figure 4.
Median values of the number of daily UFNwebsite visits were reported because of theskewed distribution of the data. The number ofdaily UFN website visits was compared beforeand after the intervention using the Mann-Whitney U-test. The significance level was set atp< 0.05.
Results
Participants
Of the 16 centres involved in the study, 11centres (18 hospitals) included the hyperlinks.Eight centres included the hyperlink only in theEPRs, two centres included the hyperlink on thecomputer desktops, and one included it both onthe desktops and in the EPRs (see figure 2). Ofthe 18 hospitals involved, one is a universityhospital, and three are specialized hospitals
Main Results
Considering the 16 centres that implementedthe project, the median number of ADR reportsper month significantly increased after project
implementation. In fact, before the interventionthe median of total ADR reports per month was2, ranging from 0 to 12, and 31 months after theintervention the median was 5, ranging from 1 to17 (p = 0.043). Four months after the project wasimplemented the median number of reports permonth was 4.
Considering only the reports using the onlineform, before the project was implemented themedian total online ADR reports permonth was 1,ranging from 0 to 5, and after the intervention, thisnumber was 4, ranging from 1 to 17 (p= 0.009).
Figure 3 shows the number of ADR reportsper quarter before and after the intervention.Figure 4 presents the number of ADR reports perquarter in the excluded hospitals and in the hos-pitals that did not install the hyperlinks.
The 11 centres included reported 17 seriousADRs in 23 months using the online form beforethe intervention, and 69 in 31 months (a 3-foldincrease) after the intervention. These centres re-ported seven non-previously described ADRsusing the online form before the intervention and42 after (increase of 4.5-fold).
The hospital with the largest increase in ADRreports submitted online was the one that in-cluded the hyperlink both in the EPRs and on thecomputer desktops, with a mean of three onlinereports per year before the intervention and 18 after.The three hospitals that included the hyperlink on
0−7th −6th −5th −4th −3rd −2nd −1st 1st
Inte
rven
tion
Quarter before and after intervention
2nd 3rd 4th 5th 6th 7th 8th 9th 10th
5
10
15
20
25
No.
of A
DR
rep
orts 30
35
40
Online ADRTotal ADR
Fig. 3. Evolution of adverse drug reaction (ADR) reports (total and only online) in hospitals with the intervention. The quarters were adjustedfor the time of intervention. Five hospital centres implemented the hyperlink in December 2007, two in January 2008, one in February, one inMarch, one in April and one in May.
Promoting Spontaneous ADR Reporting in Hospitals Using Hyperlinks 391
Adis ª 2012 Springer International Publishing AG. All rights reserved. Drug Saf 2012; 35 (5)

the desktops (including the one that simulta-neously included it in the EPRs) were in the topfive of the hospitals with higher increases in ADRreports submitted online.
There were no ADR reports sent in both paperand online formats by the same professional.
Other Analysis
There was a significant increase in daily UFNwebsite visits after the intervention (p < 0.001).Before the intervention there was a median often daily UFN website visits, and after the inter-vention, the median increased to 27 visits.
Discussion
Our results show that the inclusion of hyper-links to an online ADR reporting form in theEPRs does change health professional behavioursin ADR reporting. In reality, there was an increasein ADR reporting in the hospitals involved in thisproject, in the total number of ADR reports (morethan 2-fold), in the number of ADR reports sub-mitted online (4-fold), in serious ADRs reportedonline (3-fold) and in non-previously describedADRs (more than 4-fold). Additionally, dailyvisits to the UFN website increased approxi-mately 3-fold after the intervention.
A similar intervention based on changing theEPRs of a hospital to facilitate ADR reporting ispresented in Ortega et al.[13] Compared with ourADR reporting growth, the measured impact washigher in their study as they moved from zero to1.6 ADRs per month in just one hospital. Weargue that this difference may be due to the factthat theywere able to fine-tune theEPRs to increaseADR reporting because they hadmore control overits application, while in our case we were limited toplacing hyperlinks in existing heterogeneous EPRs.Therefore, our approach seems more easily im-plementable because hospitals are known to havemany different information systems[14] and a na-tional pharmacovigilance institution is probablynot able to impose the changes described in Ortegaet al.[13] to most commercial EPRs.
In the study by Figueiras et al.,[15] whichwas performed in the same region as our study,an educational intervention to improve physicianreporting is described, namely by performingoutreach visits to groups of health professionals.Their results present a very impressive increase(10-fold) in ADR reporting in the interventiongroup, and a 6-fold increase in the reporting ofserious ADRs. When compared with our results,it is clear that the educational intervention hasproven to be much more effective, but also re-quires more resources (human and financial).
100
Hospital without the hyperlinkHospitals with cooperation protocols
90
80
No.
of A
DR
rep
orts
Quarter and Year
70
60
50
40
30
20
10
0
1st 2
006
2nd
2006
3rd
2006
4th
2006
1st 2
007
2nd
2007
3rd
2007
4th
2007
1st 2
008
2nd
2008
3rd
2008
4th
2008
1st 2
009
2nd
2009
3rd
2009
4th
2009
1st 2
010
2nd
2010
3rd
2010
4th
2010
Fig. 4. Evolution of adverse drug reaction (ADR) reports in the excluded hospitals (with cooperation protocols) and in the hospitals that did notinstall the hyperlinks.
392 Ribeiro-Vaz et al.
Adis ª 2012 Springer International Publishing AG. All rights reserved. Drug Saf 2012; 35 (5)
Also, the effectiveness of these interventions appearsto decrease through time. In the study by Pedroset al.,[16] an educational (periodic meetings) andeconomic incentives-based intervention strategywas initiated in 2003. Their results present an in-crease of 5.6-fold in all ADRs and a 2-fold increasein serious ADR reports. Their impact is similar toour study, but again used more financial resources.
When compared with other types of interven-tions, such as solely educational[15] or educationalcombined with economic incentives,[16] our in-tervention seems to have less impact although it ismore long lasting and less expensive.
As an additional outcome, we can see that thehospital with the highest increase in ADR reportssubmitted online was the one that simultaneouslyincluded the hyperlink in the EPRs and on thecomputer desktop. According to our results forhyperlink placement, the computer desktop islikely more efficient than the EPR homepage. It isour opinion that these improvements could alsobe effective in other countries because they aremore related to generic usage of graphic user in-terfaces than to local practices.
Notably, making the ADR forms easily acces-sible might also promote future ADR reportinginitiatives that can take advantage of the visibilityof the hyperlink to the users. Therefore, we arguethat our solution is cost effective, appropriate forwidespread use inmany healthcare institutions, andcan consistently increase ADR reporting over time.
Limitations
In some hospitals, we found that although thehyperlink was included, the professionals did notknow about it. In the near future, we aim to in-crease the knowledge of the hyperlink by moreactively informing health professionals using fly-ers sent to the hospitals, posters and an e-mailshowing specifically how to find the hyperlink.Another problem detected was the inability to usethe hyperlink in some hospitals because the usersdid not have permission to access to the internet.
Future Work
To solve the problem of not being able to ac-cess the Internet, we are now developing Web-
services[17] to be used by other systems availableon hospital intranets. With this tool, it will not benecessary to access the UFN website and health-care professionals can simply use the existing in-formation systems as proposed in Ortega et al.[13]
With this future work, we expect to eliminate allthe technical obstacles to ADR reporting, furtherincreasing the reporting rate. Meanwhile, we alsoaim to implement this project in northern Portugalprimary-care healthcare centres and to provide thehyperlink to general practitioners and nurses.
Conclusions
The inclusion of hyperlinks on computer desk-tops and in EPRs to online ADR reporting forms isan easy and cost-effective way to change healthprofessionals’ behaviours with regard to spontane-ous ADR reports. In fact, daily visits to the UFNwebsite significantly increased after the inclusion ofthe hyperlinks, but even more importantly, theamount and relevance of ADR reports significantlyincreased after the inclusion of the hyperlink in thehospitals involved in this project.
Acknowledgements
The authors would like to thank all the people involved inincluding the hyperlinks in the EPRs and on the computerdesktop, namely the hospital IT departments, and PedroFarinha for the log analysis, and also to the reviewers for theirvaluable comments.
Ines Ribeiro-Vaz was responsible for most of the inter-vention and data collection. Cristina Santos performed thestatistical analysis. Altamiro Costa-Pereira andRicardoCruz-Correia supervised the writing of the paper. Ricardo Cruz-Correia also conceptualized the intervention.
References1. Lazarou J, Pomeranz BH, Corey PN. Incidence of adverse
drug reactions in hospitalized patients: a meta-analysis ofprospective studies. JAMA 1998; 279 (15): 1200-5
2. Lasser KE, Allen PD, Woolhandler, et al. Timing of newblack box warnings and withdrawals for prescriptionmedications. JAMA 2002; 287 (17): 2215-20
3. Ministerio da Saude, Estatuto do Medicamento, in DL n�176/2006. 2006: Diario da Republica, 1.a serie – N.o 167 –30 de Agosto de 2006 [online]. Available fromURL: http://www.infarmed.pt/portal/page/portal/INFARMED/LEGISLACAO/LEGISLACAO_FARMACEUTICA_COMPILADA/TITULO_III/TITULO_III_CAPITULO_I/035-E_DL_176_2006_VF.pdf [Accessed 2012 Mar 28]
Promoting Spontaneous ADR Reporting in Hospitals Using Hyperlinks 393
Adis ª 2012 Springer International Publishing AG. All rights reserved. Drug Saf 2012; 35 (5)

4. Unidade de Farmacovigilancia do Norte. Notificacao deReaccoes Adversas. 2004 [online]. Available from URL:http://ufn.med.up.pt/notificacao/notificacao.php [Accessed2010 Sep 1]
5. Walker R, Edwards C. Clinical pharmacy and therapeutics.3rd ed. Edinburgh: Churchill Livingstone, 2003
6. McGettigan P, Golden J, Conroy RM, et al. Reporting ofadverse drug reactions by hospital doctors and the re-sponse to intervention. Br J Clin Pharmacol 1997; 44 (1):98-100
7. Smith CC, Bennett PM, Pearce HM, et al. Adverse drugreactions in a hospital general medical unit meriting noti-fication to the Committee on Safety ofMedicines. Br J ClinPharmacol 1996; 42 (4): 423-9
8. Farmacovigilancia em Portugal. 2004, Lisboa: INFARMED-Instituto Nacional da Farmacia e do Medicamento, Minis-terio da Saude. 526
9. Classen DC, Pestotnik SL, Evans RS, et al. Description of acomputerized adverse drug event monitor using a hospitalinformation system. Hosp Pharm 1992; 27 (9): 774, 776-9,783
10. Classen DC, Pestotnik SL, Evans RS, et al. Computerizedsurveillance of adverse drug events in hospital patients. 1991.Qual Saf Health Care, 2005; 14 (3): 221-5; discussion 225-6
11. Bates DW, Evans RS, Murff H, et al. Detecting adverseevents using information technology. J Am Med InformAssoc 2003; 10 (2): 115-28
12. Polimeni G, Russo A, Catania MA, et al. Drug safety in-formation through the internet: the experience of an Italianwebsite. Drug Saf 2009; 32 (3): 245-53
13. Ortega A, Aquinagalde A, Lacasa C, et al. Efficacy of an ad-verse drug reaction electronic reporting system integratedinto a hospital information system. Ann Pharmacother 2008;42 (10): 1491-6
14. Ribeiro L, Cunha JP, Cruz-Correia RJ. Information systemsheterogeneity and interoperability inside hospitals: a sur-vey. In HealthInf 2010; Valencia: 337-43
15. Figueiras A, Herdeiro MT, Polonia J, et al. An educationalintervention to improve physician reporting of adverse drugreactions: a cluster-randomized controlled trial. JAMA2011;296 (9): 1086-93
16. Pedros C, Vallano A, Cereza G, et al. An intervention toimprove spontaneous adverse drug reaction reporting byhospital physicians: a time series analysis in Spain. DrugSaf 2009; 32 (1): 77-83
17. Christensen, E., et al. Web services description language(WSDL) 1.1. 2001 [online]. Available from URL: http://www.w3.org/TR/wsdl [Accessed 2012 Feb 27]
Correspondence: Dr Ines Ribeiro-Vaz, Unidade de Farm-acovigilancia do Norte, Alameda Professor Hernani Mon-teiro, 4200-319 Porto, Portugal.E-mail: [email protected]
394 Ribeiro-Vaz et al.
Adis ª 2012 Springer International Publishing AG. All rights reserved. Drug Saf 2012; 35 (5)

*Corresponding author email: [email protected] GroupSymbiosis Group
Symbiosis www.symbiosisonline.org www.symbiosisonlinepublishing.com
Using Web Services to Link Electronic Clinical Records to Pharmacovigilance Databases
Ines Ribeiro-Vaz1,2* and Ricardo J C Correia2,3
*1Northern Pharmacovigilance Centre, Faculty of Medicine, University of Porto, Portugal (entity funded by Infarmed - National Authority of Medicines and Health Products, IP)
2Centre for Research in Health Technologies and Information Systems (CINTESIS) University of Porto, Portugal3Health Information and Decision Sciences Department (CIDES), Faculty of Medicine, University of Porto, Portugal
International Journal of Pharmacovigilance Open AccessResearch Article
drug benefit outweighs its risks. Worldwide, pharmacovigilance systems are mostly based on spontaneous ADR reports made by healthcare professionals and consumers. Spontaneous ADR reporting has been described as an essential method to detect drug safety signals; however, underreporting is a major issue undermining the effectiveness of spontaneous reports. Several studies suggest that fewer than 10% of detected ADR are effectively reported to medicine regulatory authorities (e.g. Food and Drug Administration - FDA, European Medicines Agency - EMA, etc.) [1,2].
It is known that, one of the main reasons why healthcare professionals do not report ADR is due to an increase in their workload [3,4]. So, in order to reduce ADR reporting efforts, Information Systems (IS) to promote ADR reporting or to detect ADR in healthcare institutions have been tested and used, such as software for voluntary and automated detection of ADR, tools that analyse clinical databases or web-sites that actively inform healthcare professionals [5]. Information and communication technologies can also be used to facilitate and promote ADR reporting, such as the creation of on-line reporting forms and the development of tools to collect safety data from Electronic Health Records (EHR), among others [6,7].
In Portugal, there is a multi centre research project, in the field of gastric diseases (Study Group of Inflammatory Bowel Disease – GEDII) [8] whose members use the same electronic health record to collect patient information. As these patients are often treated with new and potent drugs (e.g. immunomodulating agents), the EHR has a field related to medication and ADR. Since the group members already fill in this field, it was considered an advantage to create a tool to send the data to the pharmacovigilance system.Aim
The aim of this work was to implement and describe the implementation of a web service in an EHR to collect ADR reports and analyse the number of ADR reports sent to the Portuguese regulatory authority (INFARMED), through a regional pharmacovigilance centre.
AbstractPurpose: Adverse Drug Reaction (ADR) reporting is an efficient
method to assess the safety of drugs. However, underreporting is a major issue undermining the effectiveness this method. Among patients with Inflammatory Bowel Disease (IBD), ADR are a serious problem, because these patients are often treated with new and potent drugs. Electronic registries usually include information on ADR, recorded by physicians. To promote ADR reporting by gastroenterologists working in a multicentre IBD study group, we proposed the utilisation of a web service in their usual Electronic Health Records (EHR) to collect ADR. The aim of this work was to describe the impact of this intervention on the number of ADR reported to the regulatory authority through a regional pharmacovigilance centre.
Methods: A study was performed between 2013 and 2015. A web service was created and implemented in an EHR in use. We analysed the trends and type of ADR reported through this service.
Results: From April 2013 to February 2015, 167 ADR reports were sent to the Northern Pharmacovigilance Centre through the web service, comprising 10% of the total ADR reports received in the same period. Of these, 118 cases were serious (one was life-threatening). In the northern region of Portugal, GEDII physicians reported 9 ADR during the 23 months previous to web service implementation and 121 ADR during the 23 months after web service implementation, i.e. an increase of 81%.
Conclusions: This solution allowed for reporting 167 ADR during the first 23 months of implementation, simply by clicking a button included in the usual EHR used by gastroenterologists. These results suggest that information systems (IS) should facilitate the reporting of ADR.
Keywords: Adverse Drug Reactions; Inflammatory Bowel Disease; Pharmacovigilance; Electronic Health Records
Received: August 08, 2016; Accepted: September 30, 2016; Published: October 05, 2016
*Corresponding author: Ines Ribeiro-Vaz, Northern Pharmacovigilance Centre, Faculty of Medicine, University of Porto, Portugal, E-mail: [email protected]
IntroductionAll medicines have adverse effects, some of them unknown
until the drug is commercialised. Thus, it is crucial to implement strategies to monitor drug safety. Pharmacovigilance is the activity of drug surveillance, after its launch onto the market, with the main goal of public health protection, ensuring that the
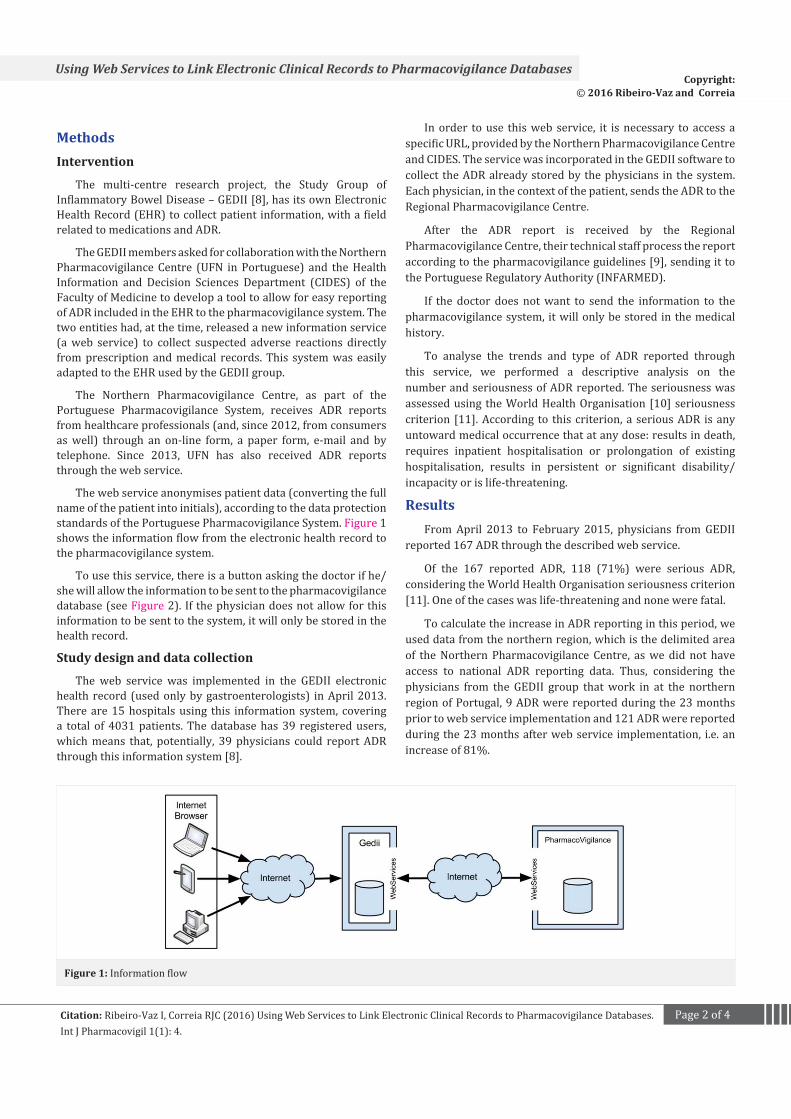
Page 2 of 4Citation: Ribeiro-Vaz I, Correia RJC (2016) Using Web Services to Link Electronic Clinical Records to Pharmacovigilance Databases. Int J Pharmacovigil 1(1): 4.
Using Web Services to Link Electronic Clinical Records to Pharmacovigilance DatabasesCopyright:
© 2016 Ribeiro-Vaz and Correia
MethodsIntervention
The multi-centre research project, the Study Group of Inflammatory Bowel Disease – GEDII [8], has its own Electronic Health Record (EHR) to collect patient information, with a field related to medications and ADR.
The GEDII members asked for collaboration with the Northern Pharmacovigilance Centre (UFN in Portuguese) and the Health Information and Decision Sciences Department (CIDES) of the Faculty of Medicine to develop a tool to allow for easy reporting of ADR included in the EHR to the pharmacovigilance system. The two entities had, at the time, released a new information service (a web service) to collect suspected adverse reactions directly from prescription and medical records. This system was easily adapted to the EHR used by the GEDII group.
The Northern Pharmacovigilance Centre, as part of the Portuguese Pharmacovigilance System, receives ADR reports from healthcare professionals (and, since 2012, from consumers as well) through an on-line form, a paper form, e-mail and by telephone. Since 2013, UFN has also received ADR reports through the web service.
The web service anonymises patient data (converting the full name of the patient into initials), according to the data protection standards of the Portuguese Pharmacovigilance System. Figure 1 shows the information flow from the electronic health record to the pharmacovigilance system.
To use this service, there is a button asking the doctor if he/she will allow the information to be sent to the pharmacovigilance database (see Figure 2). If the physician does not allow for this information to be sent to the system, it will only be stored in the health record.
Study design and data collection
The web service was implemented in the GEDII electronic health record (used only by gastroenterologists) in April 2013. There are 15 hospitals using this information system, covering a total of 4031 patients. The database has 39 registered users, which means that, potentially, 39 physicians could report ADR through this information system [8].
In order to use this web service, it is necessary to access a specific URL, provided by the Northern Pharmacovigilance Centre and CIDES. The service was incorporated in the GEDII software to collect the ADR already stored by the physicians in the system. Each physician, in the context of the patient, sends the ADR to the Regional Pharmacovigilance Centre.
After the ADR report is received by the Regional Pharmacovigilance Centre, their technical staff process the report according to the pharmacovigilance guidelines [9], sending it to the Portuguese Regulatory Authority (INFARMED).
If the doctor does not want to send the information to the pharmacovigilance system, it will only be stored in the medical history.
To analyse the trends and type of ADR reported through this service, we performed a descriptive analysis on the number and seriousness of ADR reported. The seriousness was assessed using the World Health Organisation [10] seriousness criterion [11]. According to this criterion, a serious ADR is any untoward medical occurrence that at any dose: results in death, requires inpatient hospitalisation or prolongation of existing hospitalisation, results in persistent or significant disability/incapacity or is life-threatening.
ResultsFrom April 2013 to February 2015, physicians from GEDII
reported 167 ADR through the described web service.
Of the 167 reported ADR, 118 (71%) were serious ADR, considering the World Health Organisation seriousness criterion [11]. One of the cases was life-threatening and none were fatal.
To calculate the increase in ADR reporting in this period, we used data from the northern region, which is the delimited area of the Northern Pharmacovigilance Centre, as we did not have access to national ADR reporting data. Thus, considering the physicians from the GEDII group that work in at the northern region of Portugal, 9 ADR were reported during the 23 months prior to web service implementation and 121 ADR were reported during the 23 months after web service implementation, i.e. an increase of 81%.
Figure 1: Information flow

Page 3 of 4Citation: Ribeiro-Vaz I, Correia RJC (2016) Using Web Services to Link Electronic Clinical Records to Pharmacovigilance Databases. Int J Pharmacovigil 1(1): 4.
Using Web Services to Link Electronic Clinical Records to Pharmacovigilance DatabasesCopyright:
© 2016 Ribeiro-Vaz and Correia
Drugs involved in the Reported ADR
Most of the cases had one only suspected drug, but in six cases there were two suspected drugs involved.
Of the reported ADR, 106 cases (63%) were presumably due to azathioprine, 23 cases (14%) to infliximab, 14 cases (8%) to adalimumab and 9 (5%) cases to methotrexate (Figure 3).
All of these drugs are classified as antineoplastic and immunomodulating agents, according to the WHO Anatomical Therapeutic Chemical (ATC) classification system [12]. Azathioprine, infliximab and adalimumab are immunosuppressants and methotrexate is an antimetabolite.
DiscussionWorldwide, many systems use electronic health records to
facilitate adverse event reporting, with the same goal as our work, which is to not overload healthcare professionals with additional administrative work to report ADR [7, 13, 14]. These systems can be included in the EHR and be easily completed [13] or can actively help in form filling with the automatic input of certain information already included in the EHR [7]. During the ALIAS (Albumin in Acute Stroke Trial) experience, authors decided to integrate an electronic safety reporting module into the existing web-based system to deal with safety reporting obligations of a multicentre clinical trial [15]. This system pre-populates the reporting form with the existing information, which needs to be completed and validated by clinical staff. The ASTER pilot study also brought an important contribution to the development of these systems, as it triggered ADR within the EHR, collected patient data, populated the ADR reporting form and made the report available
to the physician for review [16]. This work is different from ours, because it asks the clinician to provide additional information on the adverse event and then submits the report. All these systems incur extra work on the part of physicians, which is difficult to eliminate. The novelty of our work is the detail of allowing the physician to report ADR without any additional administrative work beyond the usual clinical registry. In addition, the EHR remained the same, without the need to change the physicians’ routine. This system adapts to the routines of the healthcare professionals and not vice versa, which can explain the increasing of ADR reporting among the studied group.
It is also important to note that most of the reported ADR were serious. In fact, the studied group deals with innovative and powerful drugs those often cause serious adverse events. This finding reinforces the importance of our work, as Pharmacovigilance Systems seek mainly information about serious (and unexpected) ADR [17].
Our study has some limitations, such that it only included gastroenterologists. However, this web service is available to be used in several software. Even so, it is currently in use only in two software systems: the one described in this study and an electronic prescription software system. Another issue is that our study does not have a control group, which limits the conclusions drawn. For this reason, the only comparison that the authors were able to perform was for the number of ADR reports made by the same group of gastroenterologists before the web service implementation.
ConclusionsThe simple solution described in our work allowed for
“Do you want this information to be sent to the National Pharmacovigilance System?”
List of adverse drug
Drug
Patient
Figure 2: Screen shot of the ADR section on the GEDII electronic health record
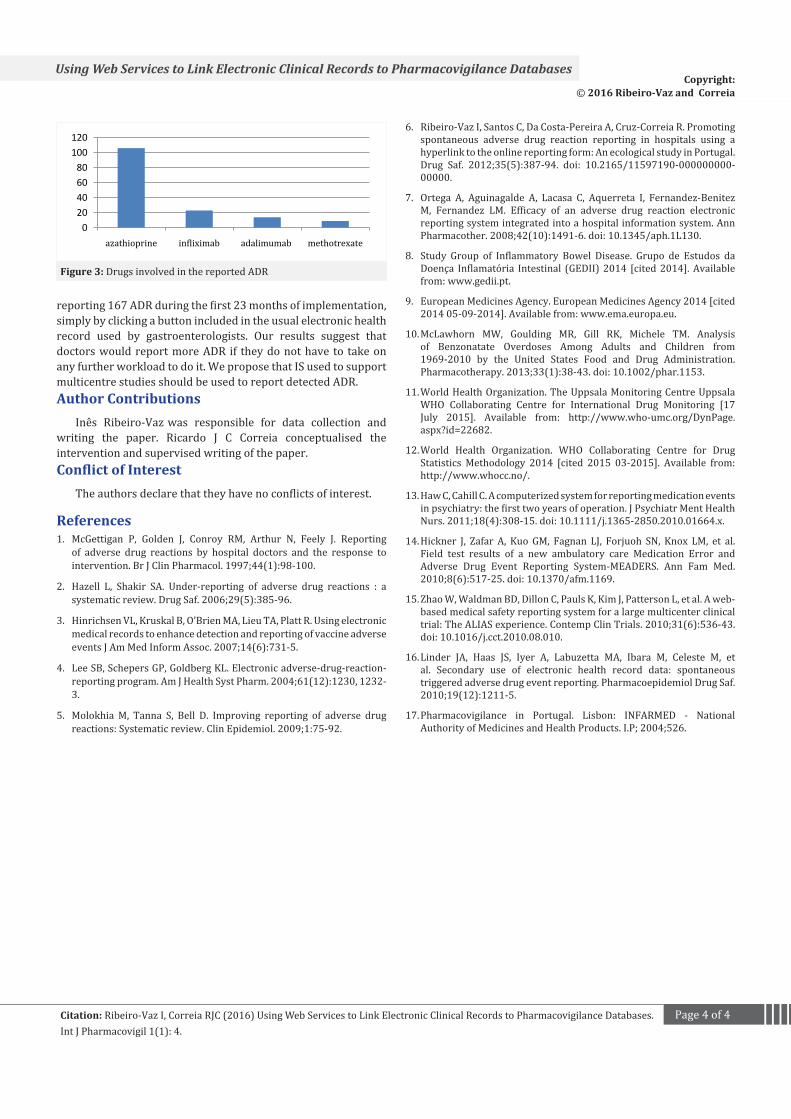
Page 4 of 4Citation: Ribeiro-Vaz I, Correia RJC (2016) Using Web Services to Link Electronic Clinical Records to Pharmacovigilance Databases. Int J Pharmacovigil 1(1): 4.
Using Web Services to Link Electronic Clinical Records to Pharmacovigilance DatabasesCopyright:
© 2016 Ribeiro-Vaz and Correia
020406080
100120
azathioprine in�liximab adalimumab methotrexate
Figure 3: Drugs involved in the reported ADR
reporting 167 ADR during the first 23 months of implementation, simply by clicking a button included in the usual electronic health record used by gastroenterologists. Our results suggest that doctors would report more ADR if they do not have to take on any further workload to do it. We propose that IS used to support multicentre studies should be used to report detected ADR.Author Contributions
Inês Ribeiro-Vaz was responsible for data collection and writing the paper. Ricardo J C Correia conceptualised the intervention and supervised writing of the paper.Conflict of Interest
The authors declare that they have no conflicts of interest.
References1. McGettigan P, Golden J, Conroy RM, Arthur N, Feely J. Reporting
of adverse drug reactions by hospital doctors and the response to intervention. Br J Clin Pharmacol. 1997;44(1):98-100.
2. Hazell L, Shakir SA. Under-reporting of adverse drug reactions : a systematic review. Drug Saf. 2006;29(5):385-96.
3. Hinrichsen VL, Kruskal B, O’Brien MA, Lieu TA, Platt R. Using electronic medical records to enhance detection and reporting of vaccine adverse events J Am Med Inform Assoc. 2007;14(6):731-5.
4. Lee SB, Schepers GP, Goldberg KL. Electronic adverse-drug-reaction-reporting program. Am J Health Syst Pharm. 2004;61(12):1230, 1232-3.
5. Molokhia M, Tanna S, Bell D. Improving reporting of adverse drug reactions: Systematic review. Clin Epidemiol. 2009;1:75-92.
6. Ribeiro-Vaz I, Santos C, Da Costa-Pereira A, Cruz-Correia R. Promoting spontaneous adverse drug reaction reporting in hospitals using a hyperlink to the online reporting form: An ecological study in Portugal. Drug Saf. 2012;35(5):387-94. doi: 10.2165/11597190-000000000-00000.
7. Ortega A, Aguinagalde A, Lacasa C, Aquerreta I, Fernandez-Benitez M, Fernandez LM. Efficacy of an adverse drug reaction electronic reporting system integrated into a hospital information system. Ann Pharmacother. 2008;42(10):1491-6. doi: 10.1345/aph.1L130.
8. Study Group of Inflammatory Bowel Disease. Grupo de Estudos da Doença Inflamatória Intestinal (GEDII) 2014 [cited 2014]. Available from: www.gedii.pt.
9. European Medicines Agency. European Medicines Agency 2014 [cited 2014 05-09-2014]. Available from: www.ema.europa.eu.
10. McLawhorn MW, Goulding MR, Gill RK, Michele TM. Analysis of Benzonatate Overdoses Among Adults and Children from 1969-2010 by the United States Food and Drug Administration. Pharmacotherapy. 2013;33(1):38-43. doi: 10.1002/phar.1153.
11. World Health Organization. The Uppsala Monitoring Centre Uppsala WHO Collaborating Centre for International Drug Monitoring [17 July 2015]. Available from: http://www.who-umc.org/DynPage.aspx?id=22682.
12. World Health Organization. WHO Collaborating Centre for Drug Statistics Methodology 2014 [cited 2015 03-2015]. Available from: http://www.whocc.no/.
13. Haw C, Cahill C. A computerized system for reporting medication events in psychiatry: the first two years of operation. J Psychiatr Ment Health Nurs. 2011;18(4):308-15. doi: 10.1111/j.1365-2850.2010.01664.x.
14. Hickner J, Zafar A, Kuo GM, Fagnan LJ, Forjuoh SN, Knox LM, et al. Field test results of a new ambulatory care Medication Error and Adverse Drug Event Reporting System-MEADERS. Ann Fam Med. 2010;8(6):517-25. doi: 10.1370/afm.1169.
15. Zhao W, Waldman BD, Dillon C, Pauls K, Kim J, Patterson L, et al. A web-based medical safety reporting system for a large multicenter clinical trial: The ALIAS experience. Contemp Clin Trials. 2010;31(6):536-43. doi: 10.1016/j.cct.2010.08.010.
16. Linder JA, Haas JS, Iyer A, Labuzetta MA, Ibara M, Celeste M, et al. Secondary use of electronic health record data: spontaneous triggered adverse drug event reporting. Pharmacoepidemiol Drug Saf. 2010;19(12):1211-5.
17. Pharmacovigilance in Portugal. Lisbon: INFARMED - National Authority of Medicines and Health Products. I.P; 2004;526.


