RUSTENBURG “A city with a high rate of influx of
unskilled, homeless economic migrants instead of business investors”
Report prepared by
John Ntema
July 2017

Rustenburg | Page ii
TABLE OF CONTENTS
List of Figures ....................................................................................................................... iii
List of Tables ........................................................................................................................ iv
List of Acronyms ................................................................................................................... v
1. Introduction .................................................................................................................... 1
2. History of the City of Rustenburg .................................................................................... 3
3. Demographic and Population Change ............................................................................ 5
4. Employment and Economic Overview ............................................................................ 7
5. Municipal Finances ........................................................................................................ 9
6. Post-Apartheid Rustenburg and Spatial Transformation ............................................... 10
7. Overview of the Rustenburg Spatial Development Framework and Integrated
Development Plan ........................................................................................................ 13
8. Housing and Basic Services ......................................................................................... 16
8.1 Changes in the housing landscape ..................................................................... 16
8.2 Level of access to basic services ........................................................................ 18
9. Assessment of the Spatial Development Framework and Integrated Development Plan
in Rustenburg ............................................................................................................... 20
10. Conclusion ................................................................................................................... 24
References ......................................................................................................................... 25
Rustenburg | Page iii
LIST OF FIGURES
Figure 1: Rustenburg Local Municipality...................................................................... 2
Figure 2: Changing population trends in Rustenburg: 1996, 2001, 2011 and 2016 ..... 6
Figure 3: Relative contribution of the various economic sectors in Rustenburg: 1996,
2001, 2011 and2015 .................................................................................... 7
Figure 4: The changing housing landscape of informal dwelling units in Rustenburg:
1996, 2001, 2011 and 2016 ....................................................................... 16

Rustenburg | Page iv
LIST OF TABLES
Table 1: Access to basic services in Rustenburg: 1996, 2001, 2011 and 2016 ........ 19

Rustenburg | Page v
LIST OF ACRONYMS
CSIR Council for Scientific and Industrial Research
GDP Gross Domestic Product
GVA Gross Value Added
IDP Integrated Development Plan
IUDF Integrated Urban Development Framework
RDP Reconstruction and Development Programme
RPA Rustenburg−Pilanesberg Area
RLM Rustenburg Local Municipality
SACN South African Cities Network
SDF Spatial Development Framework
SPLUMA Spatial Planning and Land Use Management Act
Stats SA Statistics South Africa

Rustenburg | Page 1
1. INTRODUCTION
Rustenburg city is geographically situated in the eastern part of the North West
Province. The city serves as economic hub for the entire province of North West and
is the administrative capital of the Rustenburg local municipality (RLM). As a local
municipality, Rustenburg area currently consists of 38 wards covering a total area of
about 3 430 km2 (RLM, 2016a). The area has a population density of 174 people per
square kilometre. Furthermore, RLM is the largest of the five local municipalities within
the Bojanala District Municipality (RLM, 2016a). Research studies refer to Rustenburg
as the most populous local municipality in the North West Province and the sixth most
populous local municipality in South Africa (Council for Scientific and Industrial
Research [CSIR], 2015). Boosting its status as economic hub and administrative
capital could be Rustenburg’s strategic location along the N4 freeway – or Platinum
Corridor – and the R24, which respectively makes the City of Tshwane (the national
administrative capital) and the City of Johannesburg (the national economic hub) easily
accessible (Rustenburg Local Government, 2010).
Further complementing the strategic location of Rustenburg is a booming platinum
mining industry over the past two decades – making the city one of the fastest growing
cities in South Africa. It is estimated that about 97% of the total platinum in South Africa
is produced in Rustenburg. Other than platinum mining companies, what also makes
Rustenburg unique is the prevalence of development initiatives owned and driven
separately on the tribal land by the Royal Bafokeng Traditional Authority (RLM, 2016a).
Like many cities in South Africa, the current socio-economic and spatial development
in Rustenburg must be understood within a threefold historical development. First, the
colonial discourse, followed by an apartheid era (both periods combined to broadly
represent a pre-1994 era) and then the post-1994 democratic era.
Figure 1 shows a geographical location of Rustenburg and Box 1 explains the research
methodology.
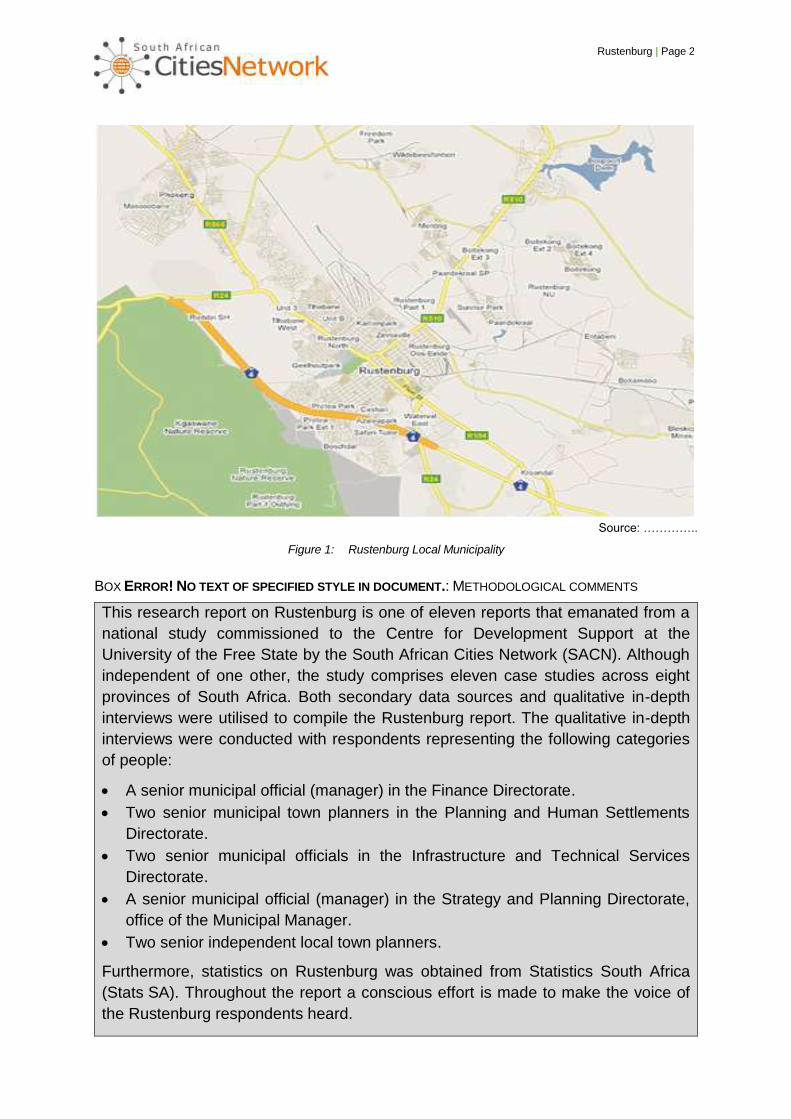
Rustenburg | Page 2
Source: …………..
Figure 1: Rustenburg Local Municipality
BOX ERROR! NO TEXT OF SPECIFIED STYLE IN DOCUMENT.: METHODOLOGICAL COMMENTS
This research report on Rustenburg is one of eleven reports that emanated from a
national study commissioned to the Centre for Development Support at the
University of the Free State by the South African Cities Network (SACN). Although
independent of one other, the study comprises eleven case studies across eight
provinces of South Africa. Both secondary data sources and qualitative in-depth
interviews were utilised to compile the Rustenburg report. The qualitative in-depth
interviews were conducted with respondents representing the following categories
of people:
• A senior municipal official (manager) in the Finance Directorate.
• Two senior municipal town planners in the Planning and Human Settlements
Directorate.
• Two senior municipal officials in the Infrastructure and Technical Services
Directorate.
• A senior municipal official (manager) in the Strategy and Planning Directorate,
office of the Municipal Manager.
• Two senior independent local town planners.
Furthermore, statistics on Rustenburg was obtained from Statistics South Africa
(Stats SA). Throughout the report a conscious effort is made to make the voice of
the Rustenburg respondents heard.

Rustenburg | Page 3
2. HISTORY OF THE CITY OF RUSTENBURG
While the primary focus of the report shall be on the post-1994 period, it is worth
reflecting briefly on the main socio-economic and political events or activities that
dominated the history of the city prior to 1994.The city of Rustenburg is the third oldest
town of the former Transvaal Province and was established on 22 January 1850
(Geldenhuys, 2015). Historically, Rustenburg formed part of a broader geographical
cluster called the Rustenburg−Pilanesberg Area (RPA) in the nineteenth century and
most probably much earlier than that (Morton, 2008). The town was granted municipal
status in 1918. As part of a broader RPA, it is worth noting that the desire by Andries
Pretorius (who was one of the prominent Voortrekkers leaders) to find not only a place
to settle but also to rest in the mid-1800s, has led him to name the area Rustenburg
(A place of Rest) (Bezuidenhout and Buhlungu, 2015). Other than resting, which
subsequently became a desire to acquire a permanent settlement next to African
settlements, the Voortrekker settlers later used the RPA as their principal base for
expansion into other parts of the former Transvaal region. Thus, a small refreshment
and resting station, Rustenburg, was used by travel-weary prospectors on their way to
the rich diamond and gold diggings in the Witwatersrand region (Molefe, 2005).
Some of the historic symbols in Rustenburg include the Anglican Church and the Dutch
Reformed Church that were established in 1871 and 1898, respectively (Molefe, 2005).
About five kilometres outside the town of Rustenburg is a historic place called
Kroondal, which was founded in 1885 as a Lutheran Mission station on the farm
previously called Kroondal (Bezuidenhout and Buhlungu, 2015). Furthermore, it would
seem that one of the long-standing and inherent characters of Rustenburg is its ability
to play a key administrative and economic role. For many years, Rustenburg was
popular for being a small regional administrative and church centre, serving the needs
of a conservative Dutch farming community (Geldenhuys, 2015).
Consequently, shortly after the permanent settlement of the Voortrekkers, but prior to
the Mfecane1, the area assumed the status of being the administrative hub for
production of various agricultural products, particularly the production of tobacco,
groundnuts, maize and wheat as well as cattle herding (Morton, 2008). Thus, other
than the Dutch farming community, the town of Rustenburg became a trading centre
both for the agricultural community and prominent Indian traders (Bezuidenhout and
Buhlungu, 2015). Apart from attracting white farmers or boer settlers, the
predominantly fertile agricultural soil, coupled with the thick winter dew that covers the
foot of the Magaliesberg mountains and valleys (Mbenga and Manson, 2010), also
attracted one of the largest African tribes called Bafokeng (which means ‘People of the
Dew’). Although, the area comprises several groups of African tribes, only three groups
seem to have dominated the written history of Rustenburg – these being the BaFokeng,
BaKgatla and BaTlokwa.
1 A period of widespread chaos and warfare amongst indigenous ethnic communities in Southern Africa during the period
between 1815 and about 1840.

Rustenburg | Page 4
The dawn of apartheid and promulgation of its discriminative policies further played a
role in influencing not only social relations, but the spatial planning and development
among the different racial groups in Rustenburg. In its quest to promote separate
development, while keeping Rustenburg an exclusive white area, the apartheid
government made provision for the establishment of Tlhabane as the first black
township to accommodate blacks who had to be resettled following forced removals in
the 1920s (Bezuidenhout and Buhlungu, 2015). Two more black townships, namely
Boitekong and Phokeng, were established in 1960s. Like many blacks, residents of
Tlhabane formed a reservoir for a migrant labour force that was used to sustain
Rustenburg economically. Through further reinforcement of the separate development
policy of the apartheid government, Tlhabane township was permanently incorporated
into the former homeland of Bophuthatswana in 1977. As part of the homeland system,
only Tlhabane and Phokeng (which in the main comprised traditional rural villages)
were incorporated into Bophuthatswana, while Boitekong remained under the
administration of the South African apartheid government. As also associated with the
apartheid system and its policy on the Group Areas Act, Act 41 of 1950, Rustenburg
saw the promulgation of Ziniaville and Karlien Park in the 1960s for Indians and
Coloureds, respectively (Bezuidenhout and Buhlungu, 2015).
With Rustenburg being at the centre of the development hub that was associated with
the RPA in the nineteenth century, it would seem appropriate to argue that the current
prominent economic and administrative role that Rustenburg continues to play is part
of a long-standing history. From an administrative perspective, Rustenburg continues
to enjoy a post-1994 status of being the administrative capital of the current RLM that
was established in 1999 through the local government demarcation process (Rajak,
2012). Through demarcation of local governments, the new RLM incorporated two
former Bophuthatswana nations – the Royal Bafokeng nation and the BaKwena nation.
However, contrary to the historic role played by agriculturally-related activities such as
crop farming, hunting and cattle rearing in making Rustenburg a hub of development
in the nineteenth century, the post-1994 era saw agriculture being gradually replaced
by the mining economy. The post-1994 era, particularly the past three decades, have
seen Rustenburg’s economic, social and physical landscape being dominated by
mining-related activities (Bezuidenhout and Buhlungu, 2015).
The boom of platinum mining in Rustenburg owe its origin to the historical
establishment of the Amandelbult and Waterval platinum mines in the early 1970s – a
period that did not only brought a dramatic shift in Rustenburg’s fortunes but also made
the town a flourishing mining centre (Geldenhuys, 2015). Owing to the recent historic
booming of platinum in Rustenburg, three points are worth noting: First, the recent
booming of platinum mining in Rustenburg has made the city the second fastest
growing city in Africa, after Cairo in Egypt (Bezuidenhout and Buhlungu, 2015).
Second, Rustenburg is not only the place where half of the world’s platinum is currently
being produced, but it is the platinum hub of South Africa as well. Third, the platinum
booming in Rustenburg has made the Royal Bafokeng nation the richest tribe in Africa.

Rustenburg | Page 5
However, this historic performance by the post-1994 mining industry in the Rustenburg
platinum belt is not without controversy – with the Marikana massacre of 34
mineworkers by the South African Police Services in 2012 being one incident that
shocked the global community.
Overall, the research report makes the following key points in respect of Rustenburg
as an intermediate city:
• Despite being an agricultural hub in the nineteenth century, the post-1994 era saw
a significant decline of agriculture as economic driver in Rustenburg.
• Driving the current fast growing economy and population growth in Rustenburg is
the booming platinum mining industry – although lack of clear plans on
diversification of the economy and shrinking land for agricultural activities due to
urban sprawling, or what some municipal officials refers to as ’frog jump’
development, remains a potential future threat to the local economy.
• Despite Rustenburg’s strategic location along the N4 freeway, or Platinum Corridor
in particular, the municipality’s plans on inclusive economy and integrated spatial
development as envisaged in the Spatial Development Framework (SDF) and
Integrated Development Plan (IDP), seems to have failed to tap into this potential
growth point for inclusive economic growth and spatial transformation.
• At the centre of the slow pace of spatial integration and development in the RLM,
is the contest between municipal interest and those of traditional authority and
mining companies.
3. DEMOGRAPHIC AND POPULATION CHANGE
The focus of the report now shifts to the analysis of the population distribution and
migration in and around the RLM between 1996 and 2016. Figure 2 below, provides a
more detailed overview of the population numbers in this respect.
Source: Stats SA (2016)
-500000
0
500000
1000000
1996 2001 2011 2016
Total number of people
Total number of households
Total number of people in urban areas
Total number of people in rural areas
Total number of people in traditional land
Total number of people in rural commercial farms

Rustenburg | Page 6
Figure 2: Changing population trends in Rustenburg: 1996, 2001, 2011 and 2016
From Figure 2 it is possible to make the following comments:
Given the platinum booming and the subsequent rapid urbanisation in Rustenburg over
the past two decades, it does not come as a surprise to have a significant growth in
the total population from 311 787 in 1996 to 626 522 in 2016. The city experienced an
annual population growth rate of 3.6% between 2001 and 2011. Worth noting is a
significant number (65.7%) of the total population residing in the urban Rustenburg in
2016. Linked with an increase in the total population, is an increase in the number of
households from 75 793 to 262 576 over the same period. This increase could, to a
large extent, be ascribed to the influx of economic migrants seeking job opportunities
rather than permanent residence in the Rustenburg platinum belt. Confirming this could
be due to a number of factors: First, it could probably be the rapid mushrooming of
informal settlements close to mineshafts in comparison to any established formal
settlement in Rustenburg. Second, it could probably be the disjuncture between the
growth in the number of households and the sudden decline in household size.
According to the available statistics (Stats SA, 2016), the household size in Rustenburg
declined from 3.3 in 2004 to 2.8 in 2014. Furthermore, the increase in the number of
households, and the subsequent decline in household size, could probably be due to
the many extended households who have possibly lived in single dwellings and have
since established themselves as separate households over this period. Lastly, it could
be as a result of single males being employed by the mining industry who have
possibly been joined by their families.
A significant decline in the number of people residing on rural commercial farms (from
11 168 in 2011 to 4 063 in 2016) is indicative of an agricultural sector that is gradually
phasing out, unless appropriate intervention measures are urgently sought. The
significant increase in the number of people residing in rural areas, particularly on
traditional land, could to a large extent be ascribed to some major housing and
infrastructural developments that are undertaken by the Royal Bafokeng Traditional
Authority. Making this possible, could probably be both the existing partnership
between the mining companies operating in the traditional land and the traditional
authority and the quasi-government status that the Royal Bafokeng Traditional
Authority continues to enjoy. Their partial independence is also acknowledged in the
SDF where it is stated that, apart from being capable of owning land, contracting,
incurring debts and obligations, the Royal Bafokeng Traditional Authority are also
capable of fulfilling certain local government functions. The SDF also made special
reference to all residents residing on the Bafokeng tribal land as ‘Bafokeng citizens’. It
is argued that payment of royalties by platinum mines to the Royal Bafokeng Traditional
Authority has resulted into significant investment and improvement in infrastructure,
basic services and social amenities such as schools and clinics, which in turn led to
the influx of not only the Bafokeng tribe, but other ethnic groups to the Bafokeng area
as well (Ojakorotu, Kamidza and Oduaran, 2015).

Rustenburg | Page 7
Apart from influencing the rate of urbanisation and migration in Rustenburg, the
platinum booming has to some extent created a gender imbalance in the city. For
instance, indicative of perpetuation of the legacy of apartheid, the migrant labour
system in the 2014 statistics showed a population comprising 327 000 (54.87%) males
compared to 269 000 (45.13%) females residing in the RLM (RLM, 2016a). However,
these 2014 statistics should be seen as improvement from 57% males and 43%
females in 2007 (RLM, 2016a). This slight improvement could probably be ascribed to
decisions by many of the single male population employed by the mining industry to
be joined by their families.
4. EMPLOYMENT AND ECONOMIC OVERVIEW
The focus of the report now shifts to the analysis and discussion on the state of the
economy and the extent to which the local economy is able to generate employment
opportunities. The discussion and Figure 3 below provides a detailed account of the
situation in Rustenburg.
Source: Author’s own (2017)
Figure 3: Relative contribution of the various economic sectors in Rustenburg: 1996, 2001, 2011 and2015
The following key notes could be made in respect of Figure 3:
Evidence from research studies indicates that Rustenburg’s economy is the seventh
largest city economy in South Africa. Despite not being one of the metropolitan areas,
the city’s economy is found to be larger than that of two metropolitan areas, namely
0,7
68,2
4,6
1,5
1,3
6,4
2,3
6,8
4,9
3,2
0,6
59,5
4,8
1,4
2,5
8,1
3,7
8,8
6,1
4,6
0 10 20 30 40 50 60 70 80
Agriculture
Mining
Manufacturing
Electricity
Construction
Trade
Transport
Finance
Government
Community
2015 2011 2001 1996

Rustenburg | Page 8
Buffalo City and the Mangaung Metropolitan Municipality (SACN, 2012). Between 2001
and 2015 the city experienced an annual economic growth rate of 1.7%. The economy
of Rustenburg is mainly driven by the mining industry. This being despite a decline in
the contribution of the mining industry from 68.2% in 1996 to 59.5% in 2015. Following
the mining sector is both finance and trade with their current contribution of 8.8% and
8.1% in 2015, respectively. A slight growth from 6.8% in 1996 to 8.8% in 2015 for
finance and 6.4% to 8.1% for trade over the same period could be ascribed to the
recent increase in business-related developments such as the Waterfall Mall, banks
and insurance companies. Contrary to the historical performance of agriculture in the
pre-1994 era, it would seem that the sector continued to decline – with statistics
showing a decline in contribution from 0.7% in 1996 to 0.6% in 2015. To some extent,
the continued decline in agriculture could be ascribed to contestation of land for
business- and residential-related development and agricultural production. For the
poor performance of the electricity sector, one major possible contributing factor could
be the widespread culture of non-payment of municipal services by residents, including
the tendency for illegal connections, particularly among residents in the growing
informal settlements. Furthermore, the dominance of the mining sector is evident in its
2014 contribution of 75% to GVA, while finance and agriculture contributed 6% and
1% of GVA, respectively.
Related to the economic contributions by various sectors in Figure 3, is the ability of
the local economy in Rustenburg to create employment opportunities for unemployed
residents. There is evidence that with its significant economic contribution, the mining
industry accounts for about 50% of the total employment in the formal sector (RLM,
2016a). With regard to total employment in the Bojanala District Municipality, RLM
contributes about 51.6%, while for the province and national employment, the
municipality contributed 28.31% and 1.53%, respectively in 2014 (RLM, 2016a).
Furthermore, the significance of the mining industry in RLM is evident, enabling the
municipality to make a 46.93% contribution to the gross domestic product (GDP) in the
Bojanala District Municipality and a further 25.56% and 1.53% for provincial and
national GDP in 2014, respectively. Consequently, through its annual average growth
rate of 3.08% in employment, the RLM has managed to decrease the unemployment
rate from 20.70% in 2004 to 18.47% in 2014. With the largest number of employment
being in the mining sector with its 36.9% of total employment in the local municipality,
it is followed by the trade sector with 16.3% of employment rate, community services
with 14%, finance with 8% and construction with 7% in 2014. Yet, contrary to mining,
municipal reports indicates that the manufacturing sector seemed to have shed jobs –
with the sector experiencing a decline from 12 000 jobs in 1995 to 7 000 jobs in 2009
(RLM, 2016a).
However, while mining remains the key economic and employment contributor in the
Rustenburg area, the gains made by the local mining economy in reducing the
unemployment rate may in near future be reversed. Thus, like many other mining
towns, the likelihood of Rustenburg going down in history as another ghost town is not

Rustenburg | Page 9
unconceivable, there are some troublesome signs already. According to the current
IDP document (RLM, 2016a), several mining companies in the Rustenburg platinum
belt are already threatening future retrenchments, with the Lonmin mining company
estimating about 6 000 future retrenchments, while Anglo American Platinum intends
to reduce its workforce from 24 000 to 16 500 workers. Even if this happens,
retrenchments in the platinum mines around Rustenburg is not a new phenomenon –
between 2007 and 2012, Anglo American Platinum reduced its workforce from 88 300
to 5 100, while in 2009 and 2011, Lonmin retrenched about 7 000 and 9 000,
respectively (Ojakorotu et al., 2015). Furthermore, unless the RLM formulates and
implements concrete plans to set in motion their 2025 diversification vision, the current
overreliance of the local economy on the mining economy will continue to pose threats
to the notion of sustainable local economic development. It is also important to note
that the current 2025 diversification vision is not the first one as there was a Vision
2014 that aimed at creating a single, integrated economy to benefit all communities
which was already adopted by the Council as early as 2005 (Molefe, 2005).
Furthermore, making the possibility unconceivable could be the socio-economic
aftermath of the prolonged (almost five months) wildcat industrial action mostly in 2014
by rock drillers across the three mining companies – Lonmin, Impala Platinum and
Anglo American Platinum –with estimates showing a daily loss of R100 000 (Tau,
2014). Another reason for an urgent need to diversify could be the possibility of a
platinum industry boom spreading eastwards in the foreseeable future to replicate itself
in the Steelpoort and Burgersfort areas, where a high level of exploration and platinum
mine development is taking place (Jackson, 2007).
5. MUNICIPAL FINANCES
The focus now shifts to municipal revenue and the discussion will provide a twofold
analysis – first, a brief reflection on various sources of revenue (both internal and
external) and then expenditure by the municipality. However, it is important to
understand the current municipal finances within the broader local economic
landscape which, among others, is characterised by a growing culture of non-payment
of municipal services. According Interviewee 7, the current figure for total debt incurred
by the municipality due to non-payment is about R3 billion.
The RLM appears to have two main sources of revenue – this being internal revenue
sources and government grants. In terms of internal revenue sources, the contribution
by user charges and property rates is worth noting. For instance, similarly to the
2009/2010 financial year, the financial contribution of property rates in 2016 remains
at 7.2% of the total budget (Calfucoy et al., 2009; RLM, 2016b). Furthermore, Culfucoy
et al. (2009) indicated that in 2009, about 51% and 34% of municipal income came
from user charges and national grants, respectively, with a minimal contribution of 2%
that came from interest on investments made by the municipality. In terms of
expenditure, the 2015/2016 annual report indicates a 3.2% of the total budget as an
expenditure on maintenance and repairs. With regard to municipal expenditure on

Rustenburg | Page 10
employee salaries, there was an increase from 10.6% in the 2011/2012 financial year
to 21.3% in the 2015/2016 financial year (RLM, 2016b).
6. POST-APARTHEID RUSTENBURG AND SPATIAL
TRANSFORMATION
With the widespread limited impact of a post-apartheid South African model on town
planning in facilitating the much anticipated socio-economic and spatial inclusion,
literature makes a caution for overreliance on spatial planning to redress past wrongs
and current inefficiencies (Rajak, 2012). Thus, it is widely acknowledged in the
literature that uncontained urban sprawl that most South African cities continues to
experience, is a consequence of the limited effect of SDFs in restricting developments
to within the urban edge. To some extent, Rustenburg is no exception. To understand
the dynamics behind spatial planning and transformation in the Rustenburg city, the
role of three key stakeholders is crucial, namely the RLM, the Royal Bafokeng
Traditional Administration, and platinum mining companies such as Lonmin, Impala
Platinum and Anglo American Platinum. Notwithstanding strides made by RLM in
improving the lives of ordinary citizens residing within its jurisdiction, the city of
Rustenburg (like most post-apartheid cities) still faces a range of inherent socio-
economic and spatial disparities. For example, one of the issues raised by the
community during the Mayoral Imbizo in 2011 and 2015, was related to spatial planning
in terms of land use management and town planning (RLM, 2016a). Thus, a threefold
manifestation of the apartheid legacy on spatial inequality remains evident in and
around Rustenburg city: First, through uncontrolled development within and outside
the urban edge – a phenomenon encouraged mainly by economic activities of the
private and mining sectors. Second, through spatially fragmented development – a
phenomenon referred to as ‘frog jump development’ during in-depth interviews (see
discussion in Section 9). Third, through lack of densification and mixed land use
development (see discussion in Section 9).
Following spatially fragmented development, a concern was expressed in the IDP
document regrading a lack of spatial transformation and inclusive development (RLM,
2016a). To a large extent, this was confined to former townships where residents were
still faced with issues of lack or absence of basic services and infrastructure, while
residents in more affluent former white suburbs were concerned about maintenance
rather than absence of the services and infrastructure. Lack of racial integration,
coupled with a lack of urban planning, seemed to have further perpetuated both past
racial and class-driven spatial inequalities and uncontrolled development within as well
as outside the urban edge – with one end of the city characterised by gated
communities for the rich, while the other end saw mushrooming of informal settlements
by economic migrants seeking job opportunities at mining companies (Bezuidenhout
and Buhlungu, 2015). About 31.5% of the total population in Rustenburg resided in
uncontrolled development that manifested itself through informal settlements outside
the urban edge. Furthermore, due to a lack of racial integration in most of the previously

Rustenburg | Page 11
white suburbs, about 72% and 76% of the residents in Oos-Einde and Safari Tuine,
respectively, were white, while the gated community in the Cashan suburb represented
the most extreme form of elite enclaving in Rustenburg (Bezuidenhout and Buhlungu,
2015). Lack of racial integration in Rustenburg was not limited only to the former white
suburbs, but to some of the former black areas as well. For example, according to the
2011 census, about 69% of the residents in the former Indian suburb of Ziniaville
remained Indian (Stats SA, 2012). Only in the former coloured suburb called Karlien
there was evidence of racial integration with about 39% and 58% of residents being
coloureds and Africans (mostly Tswana speakers), respectively.
Bezuidenhout and Buhlungu (2015) stated that suburbs in Rustenburg are today more
broadly segmented on the basis of race and class than in the past. More than anything,
the post-1994 urban landscape of Rustenburg which is characterised by enclaving,
confirms the extent to which South Africa remains one of the most unequal societies
in the world. The perpetuation of inequality can further be seen in the modes of
transport and travelling times between residents of different social and economic
classes in Rustenburg. Such disparities are shown through shocking statistics revealed
in the SDF of residents using private cars and those forced to use more than two taxis
before reaching their daily destinations. For instance, about 26% daily commuters in
Rustenburg were forced to make use of two taxis before reaching their destinations,
probably due to spatial disintegration between poor residential areas (Boitekong and
Phokeng) and areas of job opportunities in the Rustenburg sprawling urban spaces.
On the other hand, in the former upmarket suburbs, about 88% of commuters in the
southern suburbs were using their private cars instead of public transport to work,
thereby contributing to the traffic jams identified in the SDF. The travelling time for
Boitekong and Phokeng commuters was between 46 and 60 minutes, while in the
northern and southern suburbs it was between 16 and 30 minutes to their work places
(RLM, 2010).
Perpetuation of past spatial inequality in and around the RLM as discussed above,
must be understood within a threefold context:
First, the lack of land ownership, particularly in key strategic nodal points by the
local municipality – promoting spatial fragmentation, or what was referred to as
‘frog jump development’ (CSIR, 2015; Interviewee 4). There was disproportional
land ownership between local government and other local entities such as mining
companies and traditional authority in the RLM. Currently, a bulk of land in and around
Rustenburg is owned either by three mining companies or the Royal Bafokeng
Traditional Authority, while the local municipality owns far less than required in order
to leverage opportunities as envisaged in the IDP and SDFP (Hendler and Wolfson,
2013). Consequently, the delays in the implementation and spatial restructuring of
projects as envisaged in the IDP and SDF, could be ascribed to the municipality’s
inability to have full control over land use management and spatial development – in
simple terms, lack of land acquisition makes it difficult if not impossible for the
municipality to release the much-needed land for development (CSIR, 2015; Rajak,

Rustenburg | Page 12
2012). To some extent, land ownership, particularly by mining companies and the
Royal Bafokeng Traditional Authority, seemed to have affected their relations with the
municipality. For instance, the difference in opinion between the mining companies and
local municipality led to non-participation of five local mining companies during the IDP
public hearings in 2005. This being the case, despite claims made by the city mayor in
2014 that “the two parties have always had an extremely sound relationship” (Mudzuli,
2014:5). This incident (difference in opinion between mines and local municipality)
probably prompted the municipality to take initiative through the office of the mayor to
establish and adopt both the Stakeholder Engagement Strategy and the Mayoral
Stakeholder Engagement Committee in the 2011/2012 financial year (Khonou, 2012).
To avoid similar incidents, it did not come as a surprise (two years later) to see local
municipality reaching out to one of the key local stakeholders – The Royal Bafokeng
Traditional Authority – through the signing of a memorandum of understanding in 2014
(Mudzuli, 2014). The overall aim of the memorandum of understanding was to commit
the traditional authority to integrate its efforts to improve the socio-economic conditions
in the Rustenburg region with those of the local municipality. The negative impact of
the mining industry was also acknowledged in the SDF document, which mentioned
the extent to which close proximity of some of mining operations to the Rustenburg city
severely constrained spatial development, while at the same time restricted and limited
the alternatives available for the expansion of the town.
Second, the failure by the local municipality to anticipate the scale of population
growth and accommodation needs that normally comes with a booming in
mining industry (Hendler and Wolfson, 2013).
Third, the lack of enforcement of bylaws by the local municipality (Bezuidenhout
and Buhlungu, 2015). For instance, the lack of implementation of bylaws resulted into
widespread illegal dumping in the city, thereby posing both health and environmental
threats (Khonou, 2012).
The weaknesses discussed above do not mean that no intervention measures were
put in place either by local government or the other two upper spheres of government
(provincial and national) to redress the legacy of past spatial inequalities in
Rustenburg. Worth noting is the continuation of these spatial disparities despite the
promulgation of some of the most progressive legislative frameworks such as the
Integrated Urban Development Framework (IUDF) and in 2015 the Spatial Planning
and Land Use Management Act, Act 16 of 2013 (SPLUMA). Guided mainly by the
principles of the IUDF regarding spatial transformation in a post-1994 South African
city, the RLM also adopted two key strategic documents – the IDP and the SDF over
a number of years. The latest versions being the 2016−2017 IDP (RLM, 2016a) and
the revised 2010 SDF (RLM, 2010). Furthermore, some of the official documents by
the municipality claimed that both the IDP and budget processes were people-driven
and informed by the needs and priorities as identified by residents in their respective
wards.

Rustenburg | Page 13
In a nutshell, it is appropriate for the report to conclude that as a platinum hub with its
platinum booming and one of the fastest growing cities in South Africa, Rustenburg
has (particularly from a spatial point of view) become a victim of its own economic
success. Confirming this view to a large extent could be the rapid growth of informal
settlements, although such mushrooming of informal settlements could to some extent
be ascribed to a local municipality that was unable to anticipate the scale of population
growth and accommodation needs that normally comes with a boom in the mining
industry (Hendler and Wolfson, 2013).
7. OVERVIEW OF THE RUSTENBURG SPATIAL DEVELOPMENT
FRAMEWORK AND INTEGRATED DEVELOPMENT PLAN
Driving the spatial transformation and related projects and programmes in the RLM are
two key strategic planning documents – the SDF and IDP. For the purpose of the
report, the focus was on the SDF document. Since its establishment in 1999, the first
SDF document by the RLM was prepared in 2005. Since then, the municipality has
embarked on a series of reviews, with the first one being undertaken in 2010 followed
by the latest one in 2016/2017. To a large extent, the 2010 review process did not
include the preparation of a completely new SDF, but rather a revision and update
aimed at accommodating new trends, information and policies. Due to the lack of
internal capacity, the compilation of the SDF in 2005 and the subsequent review
process in 2010 were done through outsourcing of the services to a consultant firm
named K2M Technologies (Pty) Ltd. Following increased internal capacity in the
planning directorate over the years, the latest review process is now being done
internally.
At the centre of SDF 2010 review document are several development priorities and
objectives which include the following:
• Integrated spatial development supported by the required bulk infrastructure
development.
• Accelerated and shared economic growth supported by creation of spatial
economic opportunities.
• Sustainable use and management of natural resources.
• Integration of land use and transport development.
• Creation of sustainable settlements through access to appropriate housing and
social amenities.
• Creation of opportunities for sustainable rural development.
• To develop a clear argument or approach for spatial development in the area of
jurisdiction of the municipality.
• To develop a spatial logic which guides private sector investments.
• Ensure the social, economic and environmental sustainability of the area.
Rustenburg | Page 14
• Establish priorities for public sector development and investment.
Closely linked with the development priorities and objectives mentioned above could
be some of the key concepts contained in the SDF 2010 document. The SDF
mentioned the following concepts: addressing spatial imbalances; promoting corridor
development as part of the city’s hierarchy; promoting diversification of the local
economy; land use management principles; densification, combating urban sprawl;
and promoting infill development. Yet, there were threats that could negatively affect
the realisation of these concepts such as shortage of land for new developments,
particularly close to economic and social opportunities; insufficient quality and quantity
of water and electricity (bulk infrastructure); a declining agricultural sector; and a lack
of interest by the private sector to develop an inclusive local economy. For instance,
to mitigate future risks associated with mining as a single dominant economy, both the
SDF and IDP referred to the need for diversification of the local economy into sectors
such as agriculture, manufacturing, tourism, information and communication
technology, arts and culture, and energy.
The evidence shows that the 2010 SDF review does not exist in a vacuum and in
isolation, but is instead anchored in various other local, provincial and national strategic
planning documentation. Thus, the alignment of the SDF with other local, provincial
and national strategic planning documents is clearly stated in the document. Through
its four phases and six discrete tasks, the SDF document mentioned the following
strategic planning documents: The National Spatial Development Perspective, the
North West SDF, the Municipal Environmental Management Framework and the
Municipal IDP.
However, despite a claim by the SDF 2010 review that informing its aims is the IDP’s
development priorities and objectives, there is disjuncture between the two. This was
also acknowledged, to some extent, by several interviewees. While both documents
acknowledge the urgent need to diverse the local economy, the envisaged periods
differ, with the SDF referring to 2020, while the IDP refers to the 2040 vision.
Furthermore, unlike in the SDF, such commitment of making Rustenburg a vibrant,
diversified and resilient post-industrialised economy probably in 2040, is guided and
linked to what the IDP refers to as an ‘Integrated Master Plan’ which advocates for
future land use and physical developments that create sustainable growth. While both
documents acknowledge land shortage as one of the key threats to attainment of
spatial transformation and integrated development, the difference is in terms of how
this should be addressed – with the IDP making reference to two municipal strategic
planning documents, namely: The Rustenburg Local Municipality Vacant Public Land
Audit (2012) and The Rustenburg Local Municipality Land Requirements and
Acquisition Framework (2012).
In both the SDF and IDP, the need to increase internal capacity is acknowledged as
one of the key requirements for the attainment of the goals and objectives the
municipality has set for itself. However, in mitigating backlogs in the provision of bulk
Rustenburg | Page 15
infrastructure and related capacity and skills issues, only the IDP clearly mentioned the
Provincial Shared Services Model Approach that was announced by the Premier of the
North West Province in one of his state of the province addresses (Reference). At the
centre of this provincial strategic planning document was the intension to address
issues of municipal capacity and required skills regarding delivery of quality services,
good governance and clean administration through sound intergovernmental relations.
Other concepts used in the IDP document, but not included in the SDF, is the reference
to commitment by the RLM to make Rustenburg a ‘World Class City’. Subsequent to
the concept of ‘World Class City’, the IDP document further emphasises the quest by
local municipality to become a ‘Smart City’, equipped with all the infrastructure of a
modern city. To attain the above, the IDP emphasises concepts such as
‘redevelopment of city centre to ensure a global identity’. While the IDP refers to
Rustenburg Rapid Transport and concepts such as ‘YaRona’, no such reference or
mention is made in the SDF; this was also confirmed by interviewee (number). There
is no mention or reference by the SDF to concepts such as ‘Smart City’ or ‘World Class
City’ as is the case in the IDP. Other than the IDP, the SDF is also not aligned to the
IUDF and SPLUMA principles. The non-compliance, particularly with SPLUMA, by the
current SDF could be due to the formulation date (2005) and date for last review (2011)
that both predates the promulgation of SPLUMA in 2015.
Apart from the disjuncture discussed above, particularly between the current SDF and
IDP in the RLM, there are, however, common areas of weaknesses shared between
the two. For instance, despite the economic significance of the N4 Platinum Corridor
being acknowledged and emphasised in both the SDF, IDP and the in-depth
interviews, there seems to be no evidence of concrete and tangible plans (both in the
short and long term) on how exactly the local municipality intend to tap into the
economic potential of this corridor. Confirming this further, could be both the
researcher’s personal observations and the remarks by Interviewee 6 that “I must admit
that, currently we do not have a clear plan about the N4 Platinum Corridor … at the
moment, what you see along N4 freeway is only provision of housing (mainly) for
mineworkers by the Royal Bafokeng Traditional Authority”.
Other than internal local strategic areas, further criticism of the SDF and IDP could be
on the basis of their reference to external strategic areas such as the Gauteng cities –
Tshwane and Johannesburg – and the foreign neighbouring countries of Botswana
and Namibia. Similar to internal strategic areas, there seems to be no concrete plans
in either of the two planning documents on how to tap into the economic potential of
Gauteng and neighbouring countries of Botswana and Namibia as presented by the
N4 Platinum Corridor. Further criticism of the SDF regarding the N4 Platinum Corridor,
is that it made reference to its profound physical impact on the shape of urban
development, including the creation of physical north−south barriers within the
Rustenburg area and the flow of traffic, while no mention of how the municipality plans
to utilise its economic or business potential to boost the local economy, is made in the
document. Neither is such reference to the economic significance of the N4 being
Rustenburg | Page 16
mentioned anywhere in the current IDP. This being the case, despite the SDF setting
one of its objectives as “improved connectivity with Gauteng City Region and
surrounding municipalities and focus urban development along major public
transportation routes to establish transport corridors”. Thus, other than being denied
an opportunity to tap into the economic potential of the N4 Platinum Corridor, there are
two further spatial implications of the housing development along this corridor for the
local municipality, namely: First, the perpetuation of strategic direction of spatial
development that is driven exclusively by entities other than the local municipality itself
– in this case the entity being the Royal Bafokeng Traditional Authority as land owners
(CSIR, 2015). Second, the perpetuation of housing development instead of integrated
human settlement development as envisaged in the 2004 Breaking New Ground
Policy.
8. HOUSING AND BASIC SERVICES
This section considers two main issues: First, changes in the housing landscape and
second, the level of access to basic services in the RLM.
8.1 Changes in the housing landscape
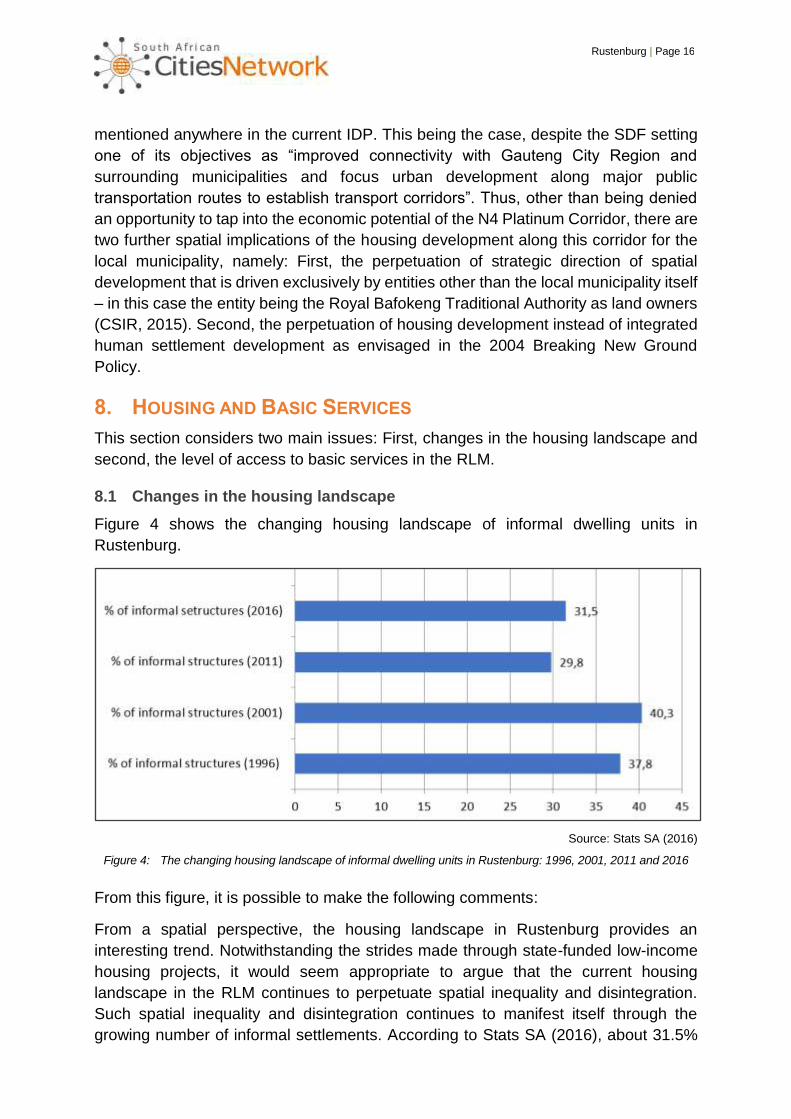
Figure 4 shows the changing housing landscape of informal dwelling units in
Rustenburg.
Source: Stats SA (2016)
Figure 4: The changing housing landscape of informal dwelling units in Rustenburg: 1996, 2001, 2011 and 2016
From this figure, it is possible to make the following comments:
From a spatial perspective, the housing landscape in Rustenburg provides an
interesting trend. Notwithstanding the strides made through state-funded low-income
housing projects, it would seem appropriate to argue that the current housing
landscape in the RLM continues to perpetuate spatial inequality and disintegration.
Such spatial inequality and disintegration continues to manifest itself through the
growing number of informal settlements. According to Stats SA (2016), about 31.5%

Rustenburg | Page 17
of households in Rustenburg are currently (2016) residing in informal structures. This
was an increase from 29.8% in 2011. In real terms, Rustenburg has an estimated
housing need of about 100 000 units and a backlog of about 60 000 houses (Stone,
2014). The majority of households living in informal settlements are currently in 39
informal settlements in and around the Rustenburg platinum mining belt (Interviewee
6).
There are three possible factors contributing to the growing number of households
currently residing in informal structures, particularly informal settlements, namely the
huge housing demand created by the influx of economic migrants seeking job
opportunities in platinum mines; the lack of state-owned land and state resources to
meet the growing needs for housing and services; and the tendency among the three
main platinum mining companies to ignore or disregard the obligatory social labour
plans and mining charter (Ojakorotu et al., 2015; Stone, 2014).
With the bulk of these informal settlements mushrooming in close proximity to platinum
mines, it would seem appropriate to suggest that implementation of the IDPs and SDFs
as municipal strategic planning documents continue to have little impact in addressing
or correcting the long-standing challenge by the RLM to develop real urban planning
around the platinum belt. Furthermore, rapid growth of uncontrolled informal
settlements on the city’s outskirts have, to some extent, gone against one of the key
SDF priorities which is to ensure that new residential developments are located within
the urban edge and are guided by the availability of bulk services, social amenities,
economic opportunities and public transport systems (Laldaparsad, Geyer and Du
Plessis, 2013). It is probably not a coincidence to have a large concentration of informal
settlements in close proximity to various local platinum mines than any area in
Rustenburg. Thus, other than failure by government to curb the growing shortage of
housing among unemployed and low-earning workers, the growing rate of informal
settlements in the Rustenburg platinum mine belt should mainly be understood against
the failure by mining companies to execute their social corporate responsibility of
ensuring homeownership for mineworkers. While for some mining companies there is
no evidence of any coordinated effort to complementing such decision with the
provision of affordable low-income housing, especially for low-paid rock drillers, only
one mining company (Impala Platinum) seem to have made a significant contribution
towards the provision of affordable housing to its employees. Though its housing
investment exceeding R2 billion, it contributed about 9 450 housing units for different
categories of beneficiaries, ranging from dedensification of hostels, single quarters,
homeownership, rental stock and upgrading projects (Khonou, 2012).
Unlike Impala Platinum, both Anglo American Platinum and Lonmin were to a large
extent, criticised for their failure to properly and adequately invest in homeownership
schemes. Subsequently, widespread scepticism of these homeownership schemes led
most mineworkers to instead opt for living-out allowances, which in turn was not
enough to afford either outright homeownership or decent rental, except to afford
cheap rental in squalor conditions. One of the unintended consequences of the living-

Rustenburg | Page 18
out allowances was the increase in the number of low-earning mineworkers taking
refuges in informal settlements surrounding their respective working places (Ojakorotu
et al., 2015).
In a nutshell, platinum mining companies did not only fail to fulfil their promises and
honour their social labour plans (Stone, 2014), but contributed to unplanned sprawl of
informal settlements through paying living-out allowances, while building and
transferring very few houses through their mineworkers’ homeownership schemes
(Stone, 2014; Ojakorotu et al., 2015).
Although not enough, there were some efforts, both by mining companies and the
state, to address the housing shortage in the city. For instance, in an attempt to
address the housing shortage while redressing spatial inequality through housing
provision, the local municipality used a relocation process of the informal settlers into
a pilot project in the Seraleng area which is located about 15 km outside Rustenburg’s
central business district to promote mixed housing development. Through such
programme, the municipality planned to build 5 000 mixed housing units, catering for
3 200 low-income housing, 1 000 social housing and 800 medium to high-cost housing
units in 2006 (Tshikotshi, 2009). It would seem that widespread lack of state-owned
land is a historical phenomenon that continues to perpetuate relocation rather than in-
situ upgrading in and around the Rustenburg area. Evidence of this are relocations of
informal settlers from privately-owned land in Mbeki Sun, Plot 14 and Sunrise Park into
Seraleng in 2006. Further evidence of a growing shortage of housing to accommodate
the rapidly growing population of Rustenburg is violence associated with allocation of
state subsidised low-income housing, especially among residents of informal
settlements. Despite recent incidents of violence allegedly caused by forceful
occupation of completed houses in the Reconstruction and Development Programme
(RDP) by non-qualifying residents in one of the Marikana informal settlements, such
incidents date back to 2007 when a certain section of the Sondela community illegally
occupied about 326 completed houses in Seraleng (Tshikotshi, 2009). Furthermore,
there are few more settlement upgrading projects in the pipeline already. These would
include the Bokamoso housing project with a target of 4 000 housing units, while the
Boitekong 16 integrated housing development targets about 3 000 housing units
(Moerane, 2016). Despite failure by the local municipality to significantly impact on the
growing number of informal settlements, particularly in and around Rustenburg, there
has been a decrease in the number of poverty-stricken people from 49.03% in 2004 to
28.59% in 2014 (RLM, 2017:164).
8.2 Level of access to basic services
Following on the housing assessment in the previous section, the emphasis now shifts
to an assessment of provision of three basic services: sanitation, water and electricity
(see Table 1). It is important to note that, in terms of supply, RLM purchases bulk water
from two main suppliers, namely Rand Water and Magalies Water Board (Calfucoy
et al., 2009). For electricity supply, the municipality is in partnership with Eskom.

Rustenburg | Page 19
TABLE 1: ACCESS TO BASIC SERVICES IN RUSTENBURG: 1996, 2001, 2011 AND 2016
Services 1996 2001 2011 2016
Percentage of households with flush toilet access 43.8 42.1 57.5 58.7
Percentage of households with electricity access 50.5 71.6 83.0 83.8
Percentage of households with indoor water access 35.7 21.2 35.8 28.5
The following remarks could be made from Table 1:
Access to basic services should be understood within the context of the growing
population and its demand for basic services and housing. With a growing population,
as one of the direct results of the booming platinum industry in Rustenburg, it does not
come as a surprise to have backlogs in almost all the three basic services shown in
Table 1 above. Currently very few residents (28.5%) have access to indoor water
provision. Another backlog is in the provision of flush toilets with only 58.7% of the
residents having access, while access to electricity stands at 83.8%. With regard to
access to toilets or sanitation, evidence from the 2014 figures show that about 23.2%
households use pit toilets; 12% are using ventilation improved pit latrines, while about
6% is without any means of sanitation or toilet facility. Contributing to the current
backlogs could be a number of factors. Other than the growing population and related
demand for services, internal capacity – both in terms of finances and human
resources – remains a challenge.
Evidence from literature and municipality’s reports indicates that between 2013 and
2014 in particular, the local municipality had a high rate of vacant positions in the
department responsible for provision of water and wastewater services as well as the
department responsible for solid waste services, with about 155 and 74 posts
remaining vacant over the same period, respectively (Cilliers, 2015). Furthermore, the
problem might have been compounded by the absence of a water services delivery
plan for the RLM between 2010 and 2014. These factors, coupled by a possible
challenge of a growing culture of non-payment of municipal services and poor
infrastructure, may to a large extent be held responsible for the more than 30%
unaccounted for water loss between the 2007/2008 and 2011/2012 financial years
(Calfucoy et al., 2009; Khonou, 2012) and the subsequent increase of 46% water
losses in 2015 (Mutema, 2015). Evidence indicates that due to the growing culture of
non-payment, the municipal debt in uncollected rates and taxes increased from R346
million in 2004 (Thompson, 2004), R1.3 billion in 2011 (Star, 2011), R2.4 billion in 2015
(Mutema, 2015) and almost R3 billion in 2017 (Interviewee 6). To some extent,
contributing to non-payment of services is more of a culture than a real problem of
affordability. Confirming this, could be the amount of R6.3 million that was owed by
municipal employees (including councillors and officials) in 2015 (Mutema, 2015).
Making such culture to thrive could be a lack of internal capacity of the municipal
finance department to institute strict financial control measures. This is confirmed by
the comments of the provincial member of the Executive Council, Phenye Vilakazi:

Rustenburg | Page 20
“Credit committees in municipalities do not meet any more or simply do not exist any
longer” (Thompson, 2004).
Another area where the local municipality still needs to do some hard work is the
provision of flush toilets, with the current figure showing an access rate of only 58.7%.
Although not adequate, there seems to be a slight improvement from the previous
figure of 35 854 households who were forced to use pit latrine toilets in 2010 (IMIESA,
2010). While the growing backlogs could mainly be attributed to rapid urbanisation and
population growth that put pressure on the limited financial and infrastructure
resources, it would seem that the lack of internal capacity on financial management
has contributed as well. For instance, in the 2014/15 financial year, the local
municipality failed to spend about R434 million of conditional grant money allocated for
capital expenditure (Sithole, 2016). In a nutshell, the backlogs in services provision
across sectors in the municipality could in the main be attributed to high vacancy rate,
with the 2015/2016 annual report showing a total figure of 2 120 vacancies which
translates into a 53.5% vacancy rate for the municipality (RLM, 2016b).
9. ASSESSMENT OF THE SPATIAL DEVELOPMENT FRAMEWORK
AND INTEGRATED DEVELOPMENT PLAN IN RUSTENBURG
The focus now shifts to the analysis of views expressed by different senior municipal
officials and independent local town planners during in-depth interviews.
Before an analysis of the various views of interviewees can be done, it is appropriate
to first provide a brief background on the current organisational structure in the
municipality’s planning directorate. For projects and programmes related in one way
or the other to spatial issues, there are two main key strategic planning documents –
the SDF and the IDP. The close relationship between these two strategic planning
documents is confirmed both by the interviews with senior officials responsible for
planning and implementation of the SDF (Interviewees 3 and 4) and the IDP
(Interviewee 6) and a claim in the current SDF 2010 Review informing its aims is the
IDPs development priorities and objectives (RLM, 2010). However, despite being
complementary to each other, there is currently two separate directorates responsible
for the implementation of these two planning tools. For the SDF and its implementation,
the municipality has established a directorate called Planning and Human Settlements,
while the directorate for the IDP and its implementation is Strategy and Planning in the
office of the municipal manager. In terms of internal capacity, there are currently five
personnel responsible for the implementation of the IDP and other related
programmes. For the implementation of the SDF and other related programmes, there
are five professional town planners. Although currently not operational, there is a
geographic information system component attached to the Planning and Human
Settlements Directorate.
With the focus of the report being mainly on the formulation and implementation of the
SDF for the municipality, it is also appropriate to make the following observations

Rustenburg | Page 21
regarding its formulation and status. As widely acknowledged by most of the
interviewees, the lack of internal capacity led to the compilation of the SDF in 2005 and
the subsequent review process in 2010 being done through outsourcing of the services
to a consultant firm named K2M Technologies (Pty) Ltd (Interviewees 3 and 8).
Following the increased internal capacity in the Planning Directorate over the years,
the current review process is now being done internally (Interviewee 4). To a large
extent, the interviews with both municipal officials and independent local town planners
seemed to have affirmed spatial challenges expressed both in the municipal official
documents/reports and the academic writings discussed above. The following are
some of the key spatial transformation issues raised as part of the diagnosis by the
interviewees during interviews:
While acknowledging commitment by the municipality to spatially transform the city,
there was a general consensus among all interviewees that more still needs to be done
to redress past spatial inequalities. Among common issues through which spatial
inequalities continue to manifest in the city, the following were raised by most
interviewees: lack of densification and mixed land use; lack of integrated human
settlements; long distance travelled daily by commuters, due to the lack of an
integrated public transport system; and spatially fragmented development.
Perpetuating these spatial challenges are a number of socio-economic and
administrative factors. Some of the possible factors responsible for the continuation of
spatial disintegration in the Rustenburg city include the following:
First, the widespread lack of state-owned land, especially in key strategic areas
that are close to economic opportunities. Despite reference to the concept of
‘enforcing urban edge’ with the intent to prevent uncontrolled urban sprawl and
protecting valuable agricultural land by the IDP, the interviews with some informants
revealed otherwise. Expressing their views on the extent to which land availability
remains a hindrance towards realisation of a spatially and economically integrated city,
one official said: “A bulk of land in most of strategic locations and growth points in the
city is owned either by mines or traditional authority … and example be the land along
N4 Corridor which is owned by the traditional authority” (Interviewees 1 and 7).
Consequently, lack of state-owned land has made it difficult for the municipality to
maintain full control over some of development initiatives taking place within and
outside the urban edge. For example, due to private ownership of land, particularly by
the business community within the urban edge, there were instances where some
developments were imposed and dictated upon municipality by private developers.
This is confirmed by the following remarks: “There are instances where a business will
establish itself without prior approval by the municipality and then later approach us
with a request for provision of bulk infrastructure … because we need money, we
usually end up giving post-development approval” (Interviewees 1 and 2).
With regard to uncontrolled development happening on private land outside the urban
edge, various interviewees gave mushrooming of informal settlements on land owned
Rustenburg | Page 22
by mining companies as one of such challenges. According to several interviewees,
growth of informal settlements is not only a social ill but a phenomenon that further
perpetuates spatial disintegration where the poor masses continue to live and reside
on the periphery far from economic opportunities. Expressing some of the limitations
faced by the municipality when it comes to such development, one interviewee
mentioned that “[f]or most of the current 19 informal settlements in the city, municipality
is unable to provide any basic services infrastructure since they are on the land owned
by mines … if we were to do anything, we will first have to engage the mines about the
land” (Interviewee 2).
As a contributing factor towards current spatial disintegration, lack of state-owned land
has also been blamed for the continuation of uncoordinated and unintegrated
development, which in turn promotes what some municipal officials referred to as ‘frog
jump development’ in and around the city (Interviewee 3).
Second, a twofold lack of collaborative planning among key stakeholders. On
the one hand, there is widespread acknowledgement by most municipal officials that
there is a tendency among various municipal directorates to work in silos. This was
even evident when both the current IDP and SDF documents were formulated.
Confirming the lack of a collaborative approach towards planning in the municipality,
Interviewee 1 mentioned that instead of collaborative and collective planning, “We
most of the time work in silos as different departments in the municipality … is like we
are in competition with each other, planning pushing their own programme here while
infrastructure pushes their own there” (Interviewee 2). Lack of collaborative planning
is also evident between the municipality and external stakeholders such as mining
companies and the Royal Bafokeng Traditional Authority. This was confirmed by
Interviewee 6: “Here and there we do sometimes experience some misunderstanding
between ourselves (municipality) and our local mines and traditional authorities on
where and how certain development planning and projects must unfold.”
Third, the responsibility for the current state of spatial disintegration could be
the lack of enforcement of by-laws and internal capacity. Both municipal officials
and independent local town planners are of the view that lack of internal capacity could
have been responsible both for the outsourcing of the first version of the SDF in 2005
and the current non-operation of the municipal geographic information system sub-
directorate (Interviewee 4). Lack of internal capacity has also been cited as a possible
reason why the provision of bulk infrastructure, in particular, remained one of the
threats to expansion of development initiatives both by the public and private sectors
in the city. It was the view of several interviewees that the current system of five-year
political administration which encourages administrative instability due to high staff
turnover every five years, affects not only the internal capacity, but also retaining skilled
personnel and continuity of projects.
Other than the lack of internal capacity, compounding provision of bulk infrastructure
for new developments is the current state of municipal cash flow. According to
Rustenburg | Page 23
Interviewee 7: “It is difficult for the municipality to implement strategic planning tools
such as IDP and SDF that are intended to respond to socio-economic and spatial
needs of city residents when there is no sound cash flow … we are now owed about
R3 billion in rates and services.” Furthermore, Interviewee 1 also confirmed that other
than lack of state-owned land, responsible for some of uncontrolled development
especially within the urban edge, could be the lack of enforcement of by-laws by the
municipality.
Fourth, imposition of projects with little or no regard for local SDF and IDP plans,
particularly by some of the national departments, remaine one of the key
challenges and possible contributors to lack of integrated spatial development
in the city. For instance, the reason why residents of a national flagship housing
project by the National Department of Human Settlements in the Marikana area were
still living in housing units without basic infrastructure such as sanitation and water, is
because “[t]here was no proper consultation of the local municipality by the National
Department of Human Settlements during project planning and implementation … the
whole project was just parachuted into our area” (Interviewee 2).
Fifth, lack of a concrete plan of action in implementing strategic objectives, both
of the SDF and IDP. While almost all interviewees acknowledged the urgent need for
diversification of the local economy and densification and mixed land use in the city,
there was little evidence to show in terms of an action plan and current development
initiatives. Some municipal officials conceded that, despite being emphasised both in
the SDF and IDP as one of the key strategic areas for future densification, mixed land
use and diversification of the local economy, almost nothing has been done by the
municipality to tap into the economic potential of the N4 Platinum Corridor. Currently
there are no concrete plans both for the short to medium-term and long-term future
use of the corridor by the local municipality. Consequently, failure by the municipality
to develop feasible action plans for the corridor has led to the private sector (particularly
mining) in partnership with the Royal Bafokeng Traditional Authority initiating housing,
instead of integrated human settlements development along the N4 Platinum Corridor
to mostly accommodate mineworkers. With only housing development taking place
along the N4 Corridor, that has, to some extent, exposed the failure by the municipality
to work in partnership both with the Royal Bafokeng Traditional Authority and the
mining industry to attract business investment for the much-needed diversification of
local economy and mixed land use and densification in strategic locations. Conceding
to such a failure by the municipality, Interviewee 1 mentioned: “I do not think we have
a clear plan on how to incentivise business investment in areas such as N4 Corridor
… consequently, we now have a mining town which attract unskilled and homeless
economic migrants instead of business investors.” (Interview Number One, 2017;
Interview Number Seven, 2017). However, there is a process currently under way to
finalise what officials referred to as the municipality’s Development Incentive Policy.
As for lack of progress in promoting densification as one of the objectives of the SDF,
Interviewee 7 indicated that “despite widespread lack of state-owned land, the city and

Rustenburg | Page 24
municipality are busy going wide instead of high rise buildings … with the tallest
building in the whole city being our municipal building with its eight floors”.
10. CONCLUSION
From the discussion and analysis above, it is possible for the report to make the
following concluding remarks:
Both an analysis of existing literature, official reports and documentation of the
municipality (including the SDF and IDP) and the views expressed by interviewees,
provided a conclusive diagnosis of the persistence of several spatial inequalities in the
city of Rustenburg. Despite disjuncture between the IDP and SDF, and evidence of
misdiagnosis coupled with shallow details on certain spatial transformation issues
identified in the SDF, most of the interviewees seemed to have demonstrated an
adequate understanding of spatial transformation issues currently facing the city. In
their diagnosis, interviewees confirmed how spatial disintegration manifested itself
through a growing number of informal settlements, especially on the platinum mine
belt; lack of racial integration perpetuated particularly by the growing development of
gated communities or enclaves in former white suburbs; lack of densification and
mixed land use, especially in key strategic areas such as the N4 Platinum Corridor;
lack of an integrated public transport system to reduce both travelling cost and distance
between places of work and residence, particularly for residents in former black
township areas.
Some of the key contributing factors to the current spatial disintegration include the
following:
• Lack of sound collaborative project planning by the municipality and other key
external stakeholders such as mining companies and the Royal Bafokeng
Traditional Authority.
• Lack of sound internal collaborative planning among various municipal
directorates/departments.
• Lack of sound intergovernmental relations across the three spheres of government.
• Lack of internal capacity in the municipality.
• Wide spread lack of state-owned land.
• Failure by the municipality to formulate and implement a concrete plan of action to
tap into the socio-economic potential of the N4 Platinum Corridor.
• Failure by the municipality to formulate and implement a plan of action to incentivise
business investment in strategic areas such as the N4 Corridor.

Rustenburg | Page 25
REFERENCES
Bezuidenhout, A. and Buhlungu, S. 2015. Enclave Rustenburg: Platinum mining and
the post-apartheid social order. Review of African Political Economy, 42:526-544.
(Issue 146: White gold: New Class and community struggles on the South African
platinum belt) http://dx.doi.org/10.1080/03056244.2015.1087395
Calfucoy, P., Cibulka, J., Davison, J., Hinds, T. and Park, M. 2009. Improving free basic
water provision in South Africa. Madison: Board of Regents of the University of
Wisconsin System. Available at https://www.lafollette.wisc.edu/images/publications/
workshops/2009-southafrica.pdf
Cilliers, C. 2015. A critical analysis of local municipal capacity towards fulfilling their
basic municipal services mandate. Unpublished mini-dissertation for Master’s degree,
North-West University, Potchefstroom. http://hdl.handle.net/10394/17991
CSIR (Council for Scientific and Industrial Research). 2015. Spatial strategies
alignment: Review project. I couldn’t get this document online.
Geldenhuys, K. 2015. Rustenburg SAPS – Policing a growing mining city. Servamus.
Community-based Safety and Security Magazine, 108(9):50-53.
http://hdl.handle.net/10520/EJC176923
Hendler, P. and Wolfson, T. 2013. The planning and the “unplanning” of urban space
1913 to 2013: Privatised urban development and the role of municipal governments.
Paper presented at the Conference on ‘Land Divided: Land and South African Society
in 2013, in comparative perspective”, University of Cape Town, 24-27 March.
Available at http://www.landdivided2013.org.za/sites/default/files/Land%20divided
%20conference%20paper%2020130327%2001h%2050.pdf
IMIESA – The official magazine of the Institute of Municipal Engineering of Southern
Africa (IMESA). 2010. Rustenburg: VIP toilets. I couldn’t find this link on the internet.
Other reports put this in a table in the report and not in the reference list
Interviewee 1. 2017. An in-depth interview with an independent local town planner.
Interviewee 2. 2017. In-depth interview with municipal official.
Interviewee 3. 2017. In-depth interview with municipal official.
Interviewee 4. 2017. In-depth interview with municipal official.
Interviewee 5. 2017. In-depth interview with municipal official.
Interviewee 6. 2017. In-depth interview with municipal official.
Interviewee 7. 2017. In-depth interview with municipal official.

Rustenburg | Page 26
Interviewee 8. 2017. In-depth interview with independent local town planner.
Jackson, D. 2007. Fast-growing Rustenburg rides the crest of the platinum boom:
Mineral resources a major bonus, but industry diversification is vital. Business Day,
July 5, p.17. Johannesburg.
John, L. 2012. Secondary cities in South Africa: The start of a conversation. The
background report. Johannesburg: South African Cities Network (SACN). Available at
http://sacitiesnetwork.co.za/wp-content/uploads/2014/07/
secondary_cities_in_south_africa_with_more_detail.pdf
Khonou, M. 2012. State of the city address: “Our season of hope: Towards Rustenburg
becoming a 21st century world class city”. Rustenburg Local Municipality. Available at
https://www.rustenburgrapidtransport.co.za/docs/
RRT%20State%20of%20the%20Nation%20address.pdf
Laldaparsad, S., Geyer, H. and Du Plessis, D. 2013. The reshaping of urban structure
in South Africa through municipal capital investment: Evidence from three
municipalities. Town and Regional Planning, 63:37-48.
http://hdl.handle.net/11660/3051
Mbenga, B and Manson, A. 2010. “People of the Dew”: A history of the Bafokeng of
Phokeng-Rustenburg region, South Africa, from early times to 2000. Johannesburg:
Book reviews, Jacana Media, p. 240.
Moerane, B. 2016. Rustenburg plagued by growing informal settlements. SABC News,
13 September. Johannesburg.
Molefe, A. 2005. Rustenburg: Town with a silver lining. Sowetan, March 24, p.13.
Johannesburg.
Morton, F. 2008. Creating maps as historical evidence: Reconsidering settlement
patterns and group relations in the Rustenburg-Pilanesberg area before 1810. New
Contree, 56:1-22. http://hdl.handle.net/10394/5259
Mudzuli, K. 2014. Pledge to uplift platinum region. The Star, 15 August, p. 5.
Johannesburg.
Mutema, T. 2015. Rate payers owe Rustenburg R2.4 billion. New Age, p. 3.
Johannesburg.
Ojakorotu, V., Kamidza, R. and Oduaran, C. 2015. Mining corporations’ psychosocial,
economic and political impact on local communities: The case of North West province
mining complex. Politeia, 34(1):22-44. http://dx.doi.org/10.25159/0256-8845%2F672
Rajak, D. 2012. Platinum city and the new South African dream. Africa, 82(2):251-271.
https://doi.org/10.1017/S0001972012000046
RLM (Rustenburg Local Government). 2010. Spatial Development Framework (2010
Review).

Rustenburg | Page 27
RLM (Rustenburg Local Government). 2016a. Draft Integrated Development Plan
Review: 2016−2017. Available at https://rustenburg.gov.za/wp-
content/uploads/2016/12/Draft-review-2016-2017-Final-March-20161.pdf
RLM (Rustenburg Local Government). 2016b. Annual Report 2015/2016. Available at
https://www.rustenburg.gov.za/wp-content/uploads/2017/06/RLM-ANNUAL-
REPORT-2015-2016-Final-Version.pdf
RSA SPLUMA (Republic of South Africa). 2013. Spatial Planning and Land Use
Management Act, Act 16 of 2013. Pretoria: Government Printer.
SACN (South African Cities Network) and JDA (Johannesburg Development Agency).
2014. Spatial transformation of cities: Conference report, 4-6 March 2014. Available at
http://www.jda.org.za/docs/spatial_transformation_conf_report.pdf
Sithole, D. 2016. Rustenburg eyes clean audit report. New Age, 2 February, p. 4,
Johannesburg.
Star, 2011. Council gets back R151m of R1.3bn owed by residents, The Star, 6 July,
p. 2, Johannesburg. [Online] Available at http://www.iol.co.za/the-star/council-gets-
back-r151m-of-r13bn-owed-by-residents-1093988
Stats SA (Statistics South Africa). 2012. Census 2011.
Stats SA (Statistics South Africa). 2016.
Stone, S. 2014. A better life for mine workers. Business Day, 7 August, p. 3. [Online].
Available at https://www.businesslive.co.za/bd/companies/mining/2014-08-07-a-
better-life-for-mine-workers/
Tau, S. 2014. Amcu strike hitting Rustenburg hard. Citizen, 25 March, p. 1. [Online]
Available at http://citizen.co.za/uncategorized/149107/amcu-strike-hitting-rustenburg-
hard/
Thompson, C. 2004. Municipalities on the brink: FF+. Citizen, 27 October, p. 12,
Johannesburg.
Tshikotshi, V. 2009. The challenges of eradicating informal settlements in South Africa
by 2014. The case of Seraleng sustainable human settlement, Rustenburg Local
Government, North West Province. Unpublished Master’s dissertation, University of
the Witwatersrand, Johannesburg. Available at http://hdl.handle.net/10539/8319
Van der Merwe, I.J., Van der Merwe, J.H. and De Necker, P.H. 1991. A spatial and
socio-economic profile of urbanization in Southern Africa. Africa Insight, 21(2):97-106.
http://hdl.handle.net/10520/AJA02562804_1213


