
Report on a Survey of Environmental Reporting Costs and
Benefits
Prepared for DEFRA (formerly DETR)
November 2001 64-C4650

Contract No: 64-C4650
Issue: 3
Authors: Josephine Merrick/ Connie Crookshanks
Project Manager/Director (signature): Niall Smiddy
Date: 8 November 2001
This report has been prepared by ENVIRON with all reasonableskill, care and diligence, and taking account of the manpower andresources devoted to it by agreement with the client. This report isconfidential to the client, and ENVIRON accepts no responsibilitywhatsoever to third parties to whom this report, or any part thereof,is made known, unless formally agreed by ENVIRON beforehand. Any such party relies upon the report at their own risk.
ENVIRON disclaims any responsibility to the client and others inrespect of any matters outside the agreed scope of the work.
VERSION CONTROL RECORD
ISSUE DESCRIPTION OF STATUS DATEREVIEWERINITIALS
AUTHORSINITIALS
A First Draft 02/05/01 NPS JM1 Final Report 03/05/01 NPS JM1A Clients comments included 30/07/01 AJS NPS2 Second Issue to Client of Final Report 31/07/01 CC NPS3 Removal of References to Respondees 08/11/01 NPS CC

DEFRA Survey of Environmental Reporting Costs and Benefits
Issue 3 ENVIRON8 November 2001 64-C4650
CONTENTSPage
EXECUTIVE SUMMARY I
1.0 INTRODUCTION 1
2.0 SURVEY METHODOLOGY AND QUESTIONNAIRE
DEVELOPMENT 3
3.0 SELECTION OF COMPANIES 5
4.0 RESULTS 74.1 GENERAL OBSERVATIONS 7
4.2 COSTS OF ENVIRONMENTAL REPORTING 8
4.3 BENEFITS OF ENVIRONMENTAL REPORTING 13
5.0 CONCLUSIONS 17
ANNEX A: LITERATURE SEARCH REFERENCES
ANNEX B: COPY OF QUESTIONNAIRE


DEFRA Survey of Environmental Reporting Costs and Benefits
Issue 3 i ENVIRON8 November 2001 64-C4650
EXECUTIVE SUMMARY
The Department for Environment, Food and Rural Affairs (formerly DETR) enlisted the support of
ENVIRON, to conduct a survey of companies which produce annual environmental reports. The
purpose of the survey was to examine the costs and benefits of environmental reporting and to
compare this within different sectors, across company size and the reporting maturity of companies.
It is hoped that the results will assist further development in the area of corporate environmental
disclosure, by providing companies with an insight into what they could expect to spend on a report
and what benefits they might hope to achieve.
The survey questionnaire was developed to allow companies to disclose the costs associated with
developing an environmental report from the initial strategy development to report production
through to final stakeholder surveys on the report content. The survey allowed for both external and
internal costs to be estimated. From a list of categories of benefits, companies were given the
opportunity to indicate their relative importance as a result of making environmental disclosures.
Previous experience had shown that respondents were not easily able to assign financial figures to the
benefits of reporting.
The survey was sent out to a total of 109 companies, of which 38 were FTSE100 companies, a further
17 were FTSE350 companies and the remaining 54 companies were 'other' environmental reporters.
The selection of companies included those companies listed on the Corporate Register, a web based
directory of published Environmental and Social reports. In order to facilitate data analysis and
allow for comparison with future surveys respondents were allocated to 1 of 23 sectors. These sectors
were chosen to match those classifications given on the corporate register for environmental and
social reports. 47 completed replies were received, giving a response rate of 43.1%. The
respondents had been reporting for an average of 4.79 years and the questionnaire responses
indicated a full range of reporting maturities from both first time to seasoned reporters. The most
mature reporter among the responses received had been disclosing environmental information for 12
years.
A review of the responses received indicated that the content quality of the report was generally very
high when compared to the Global Reporting Initiative (GRI) reporting guidelines.

DEFRA Survey of Environmental Reporting Costs and Benefits
Issue 3 ii ENVIRON8 November 2001 64-C4650
The annual environmental reporting costs ranged widely from £6,500 to £535,000, with an average
cost of £92,716. When the costs associated with strategy formulation and establishment of
information systems were excluded the range of reporting costs was £4,500 to £259,500 with an
average cost of £66,903. The four companies not producing hard copy version of the report and only
publishing on the internet showed a significant reduction in reporting costs with an average annual
reporting cost of £11,215.
The survey responses showed no correlation between company size (annual turnover) and the
expenditure on environmental reporting costs. Reporting costs varied widely between the 23 sectors.
The sector reporting the lowest average annual reporting costs (excluding set up costs) is the
banking, finance and investment sector, with an average cost of £9,262. The sector with the highest
costs of £161,250 was the metals and mining sector.
It had been anticipated that the surveyed companies might not have easily identified a direct,
financial benefit of environmental reporting. Indeed financial information on the benefits of
environmental disclosure was only included in 6 of the responses received. These 6 companies had
been reporting for a longer period, on average 7.1 years, as compared to the 4.79 years for the
responding group taken as a whole. This could indicate one of two things. Either that the financial
benefits of environmental reporting are not realised for the first few years of reporting, or and what is
considered more likely, that seasoned reporters have realised the importance of capturing this
information as a means of recording and monitoring progress against set targets. Financial benefits
were recorded for only a few of the benefit categories. In the main these included savings as a result
of setting reduction targets for resource use, waste generation, water usage, and energy expenditure.
The highest ranked benefits included those that related to the communication of a company's position
on environmental issues. These included improved stakeholder dialogue, representational
improvement, increased employment awareness, stronger internal commitment and the provision of
environmental information to stakeholders.
The middle ranking benefits were in the main related to the mechanistic and procedural elements of
environmental management. They included general improvements in environmental management,
reduction in resource use, reduction in waste generated, reduction in water use and reduction in
energy expenditure. These benefits are really the most tangible and robust issues surrounding
environmental management systems. Also ranking amongst these middle ground benefits were the
issues of improved access to markets and competitive advantage.
DEFRA Survey of Environmental Reporting Costs and Benefits
Issue 3 iii ENVIRON8 November 2001 64-C4650
The financial and regulatory benefit of producing environmental reports was assigned the lowest
scores by the responding companies. The issues of lower insurance premiums, reduced cost of capital
and reduced regulatory oversight were deemed to be of only limited benefit to the responding
companies, and as a rule achieved the lowest benefits scores. However, current literature on the
subject identifies a large body of evidence suggesting that companies are being subjected to increased
scrutiny from fund managers, investment advisors and others to produce comprehensive
environmental reports. However, the results of this current survey appear to contrast and conflict
with the published information, and indicate that this pressure is either not being felt or is not
currently being recognised by companies as a driver to produce an environmental report. It remains
to be seen to what extent and to what end fund managers and financial institutions (pensions,
investments and insurance) can enforce those policies laid down in their decision-making processes.


DEFRA Survey of Environmental Reporting Costs and Benefits
Issue 3 ENVIRON8 November 2001 64-C4650
1
1.0 INTRODUCTION
The Department for Environment, Food and Rural affairs (formerly DETR) enlisted the
support of ENVIRON, to conduct a survey of companies which produce annual
environmental reports. The purpose of the survey was to ascertain the costs and benefits of
this form of corporate disclosure, and to compare those findings both between and within
sectors, in relation to company size and in terms of the environmental reporting maturity of
the company. The aim of the survey was to gain a better understanding of the costs and
benefits of voluntary environmental reporting. It is hoped that the results will assist to further
the development of the area of corporate environmental disclosure, by providing companies
with an insight into what they could expect to spend on an annual environmental report, and
what benefits they might hope to achieve.
A brief literature review was conducted prior to the design of the questionnaire used to gather
available evidence on the costs and benefits of environmental reporting. The resources
examined can be found in Annex A. The results of the review were used to guide the
selection of companies to be included in the survey and the content of the questionnaire.
From the literature review, it was apparent that much of the research already conducted in the
area of environmental reporting has centred on three main issues: the evaluation of the
content of existing reports; the drivers encouraging environmental reporting; and the
importance of corporate environmental disclosure to the ethical investment market.
ENVIRON conducted a survey in 1998 on the business case for environmental disclosure1.
This survey looked at the drivers, costs and benefits of the corporate decision to publish
company environmental information. However, the current literature review did not identify
any other published research that has centred specifically on the questions of the costs and
benefits of environmental disclosure.
A large number of journals are now including features outlining the pressure that financial
investors and portfolio managers can bring to bear on the environmental reporting behaviour
of large companies. In line with the continuing growth in ethical investment, a new rating
system for evaluating safety, environmental and social performance has been launched by
1 EAG ENVIRON, 1998, Solving the Cost Puzzle�Environmental Reporting.
DEFRA Survey of Environmental Reporting Costs and Benefits
Issue 3 ENVIRON8 November 2001 64-C4650
2
Bureau Veritas2 and SERM3. Crucially, the National Association of Pension Funds (NAPF)
will be incorporating the BV-SERM ratings into their corporate governance voting issues
prior to company AGMs.
2 www.bureauveritas.com3 Safety and Environmental Risk Management Rating Agency Ltd, www.serm.co.uk.
DEFRA Survey of Environmental Reporting Costs and Benefits
Issue 3 ENVIRON8 November 2001 64-C4650
3
2.0 SURVEY METHODOLOGY AND QUESTIONNAIRE DEVELOPMENT
The survey took the form of a written questionnaire. This strategy was considered preferable
over a telephone interview as it allowed the respondents time to assimilate the appropriate
data and hence provide full and accurate answers.
During the initial project meeting between DEFRA and ENVIRON it was agreed that
questionnaire responses would only be included in the final analysis from those companies
who produce a separate, stand-alone environmental report. Any responding companies whose
environmental disclosure was limited to environmental statements contained with the annual
report were excluded from the analysis. The primary reason for this distinction was that
based on previous experience there are large differences in the levels of environmental
disclosure contained within company annual accounts. It would be extremely difficult to then
make meaningful comparisons between company annual reports and stand alone
environmental reports. It is suggested that future surveys should examine this issue in more
detail. To facilitate this distinction, companies were therefore asked to answer questions on
their reporting practices, and asked to submit information on report content. This provided the
opportunity of ensuring that reports of a similar quality were being compared, and that a
direct comparison between costs and benefits was therefore appropriate. The report content
parameters included within the questions were based upon those items recommended for
inclusion by the Global Reporting Guidelines 2000. These guidelines have been produced by
the Global Reporting Initiative (GRI)4 with the aim of making corporate environmental
reports both logical and complete, and in order to facilitating benchmarking and
comparability.
There is a wide variation in the split between the internal and external resources used to
produce reports. As such, companies were given the opportunity of recording the costs of
environmental reporting directly (typically for external resources), or alternatively, of
recording the costs of reporting as a summation of the employee hours required to complete
the various stages of the reporting process. Total costs were then calculated using employee
salary bandings, assuming an average working year of 220 days.
4 The Global Reporting Initiative (GRI) was established in 1997 by the non-profit Coalition for Environmentally Responsible Economies
(CERES).

DEFRA Survey of Environmental Reporting Costs and Benefits
Issue 3 ENVIRON8 November 2001 64-C4650
4
Previous experience had shown that respondents were not easily able to assign financial
figures to some of the perceived benefits of reporting. Companies were therefore given the
opportunity to give an indication of the relative importance of the different categories of
benefit. (No benefit = 0, of limited benefit only = 1, recognised as an important company
benefit = 2, and representing a major benefit to the company = 3)
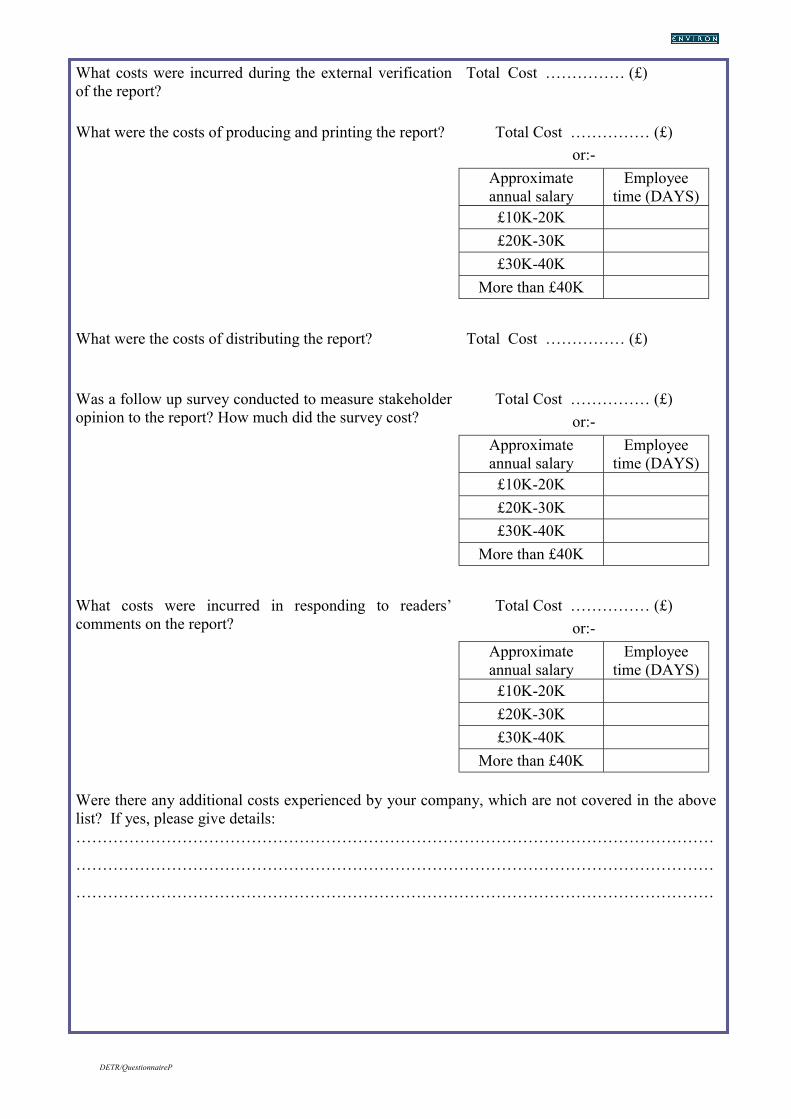
A copy of the survey questionnaire is included in Annex B.
DEFRA Survey of Environmental Reporting Costs and Benefits
Issue 3 ENVIRON8 November 2001 64-C4650
5
3.0 SELECTION OF COMPANIES
ENVIRON�s brief was to conduct the survey centred upon UK companies already committed
to regular environmental disclosure. The selection of companies included those companies
listed on the Corporate Register, a web-based directory of published corporate environmental
and social reports (www.corporate-register.com) and other known environmental reporters. A
total of 109 companies were contacted, of which 38 were FTSE 100 companies, a further 17
were FTSE 350 and the remaining 54 companies were other environmental reporters not
included within these groups.
In order to facilitate data analysis, and allow comparisons with future surveys, responding
companies were allocated to one of the following 23 sectors:
! Automotive
! Banks, Finance & Investment
! Beverages/Tobacco
! Chemicals
! Civil Engineering/Homebuilding
! Consumer Goods
! Diverse Services (includes waste management companies)
! Entertainment/Leisure/Hotel/Restaurant
! Food Production
! Food Retail
! General Retail
! Government/Authorities/Agencies
! Industrial/Electrical/Engineering/Manufacturing
! Information & Communication Technology
! Insurance
! Media/Advertising
! Metals/Mining
! Petrochemicals
! Pharmaceuticals
! Property/Real Estate
! Pulp & Paper
! Transport
DEFRA Survey of Environmental Reporting Costs and Benefits
Issue 3 ENVIRON8 November 2001 64-C4650
6
! Utilities
The sector divisions were chosen to match those classifications given on the Corporate
Register.

DEFRA Survey of Environmental Reporting Costs and Benefits
Issue 3 ENVIRON8 November 2001 64-C4650
7
4.0 RESULTS
4.1 GENERAL OBSERVATIONS
A total of 47 completed replies were received, giving a response rate of 43.1%. Three of these
responses were subsequently excluded from the analysis; two because they had been
insufficiently completed; and the other because the company concerned only included
environmental information within an annual report, and did not produce a stand-alone
environmental report.
Of the analysed replies (44), 15 companies were from the FTSE 100, 8 from the FTSE 350
and 21 from outside of these groups.
The respondents had been reporting for an average of 4.79 years. A full range of reporting
maturity was observed, with completed questionnaires being received from both first time and
seasoned reporters. The most mature reporter amongst the responses had been disclosing
environmental information for 12 years.
All the companies recorded that their environmental reports were made publicly available.
However, four of the responses were from companies that published and distributed their
environmental report solely by electronic means via the Internet, with no hardcopy report
being produced.
The responses indicated that the quality of the report�s contents was generally of a high
standard when compared to the GRI Reporting Guidelines. Fourteen issues were highlighted
within the questionnaire as reference indicators of report content. However, the survey did
not attempt to ascertain the quality of the content of the responses. When the completed
questionnaires were scored against these reference indicators, an average report content score
of 12.21 was calculated. It is also of note that only one response achieved a score of less than
10. With such a good comparability of report content (based on GRI reporting guidelines)
between companies, a direct comparison of reporting costs and benefits was therefore
possible, as it was concluded that differences in costs and benefits would likely be due to
reasons other than the quality of the report content.

DEFRA Survey of Environmental Reporting Costs and Benefits
Issue 3 ENVIRON8 November 2001 64-C4650
8
4.2 COSTS OF ENVIRONMENTAL REPORTING
In response to the question, �How much does an environmental report cost to produce?�,
many companies were found to report costs which were initially significantly lower than the
actual, time costs of reporting identified in subsequent questions. It appears that, in
estimating a 'ballpark' figure, companies are failing to appreciate and include many aspects of
the reporting process such as the costs of diverting internal resources, data acquisition and
assimilation, target setting and monitoring, reporting design and layout, engagement of
external consultants and report verification. The questionnaire was therefore specifically
designed to ensure that this information was captured. As a result, the total costs recorded
from the survey responses are perhaps higher than might initially be anticipated.
Table 1 records the range of costs and the average cost of the responses to each of the
questions.
TABLE 1: MINIMUM, MAXIMUM AND AVERAGE COSTS ASSIGNED BYRESPONDING COMPANIES TO INDIVIDUAL QUESTIONS ON THE SURVEY
Survey Questions on EnvironmentalReporting Costs
Min.recorded cost
Max.recorded cost
Averagerecorded cost
What costs were incurred during thestrategy formulation stage of identifyingthe business case for reporting?
£300 £300,000 £11,907
What costs were incurred inestablishing information systems toensure the availability of appropriatedata?
£300 £108,000 £10,989
What costs were involved in datacollection? £615 £100,000 £6,983
What costs were incurred incopywriting the text for the report? £670 £50,000 £7,318
What costs were incurred in designingthe hard copy version of theenvironmental report?
£80 £44,000 £12,118
What costs were incurred in designingthe internet version of theenvironmental report (whereapplicable)?
£80 £50,000 £5,249
What were the costs associated withinternal verification of the report? £300 £30,000 £5,120
What costs were incurred during theexternal verification of the report? £1,000 £100,000 £8,206
What were the costs of producing andprinting the report? £2,000 £66,000 £13,811
What were the costs of distributing thereport? £200 £28,000 £2,624

DEFRA Survey of Environmental Reporting Costs and Benefits
Issue 3 ENVIRON8 November 2001 64-C4650
9
Was a follow up survey conducted tomeasure stakeholder opinion to thereport? How much did the survey cost?
£96 £15,000 £1,014
What costs were incurred in respondingto readers� comments on the report? £60 £15,000 £768
Total theoretical minimum,maximum and average costs £5,701 £906,000 £86,107
An initial analysis of the responses showed that the average annual reporting cost for those
companies not producing a hard copy version of the report (based on the sample of 4) was
very much lower than those companies who did opt to publish in this format. It was not
possible, within the scope of the current survey, to examine in detail whether the content of
the Internet reports was directly comparable in terms of quality and quantity of information
with the hard copy counterparts. Consequently, these four responses were excluded from
further cost analysis. However, it should be noted that this result in itself may indicate that
companies who wish to limit the costs of environmental reporting could be encouraged to
consider the production of electronic versions of their report as opposed to the publication of
hard copy. Subsequent updates and modifications may also prove to be more cost-effective.
Table 1 indicates that there is a very broad range in the theoretical minimum, maximum and
average costs to be selected. These are £5,701, £906,000 and £86,107 respectively.
In a previous survey by ENVIRON (1998)5 companies gave a mixed response to the
question of the effects of the use of the Internet on the costs of environmental reporting. At
that time, some responding companies cited Internet use as a reason for escalating reporting
costs, whilst others reported that Internet use in fact decreased the costs of producing an
environmental report.
Some general observations on the responses to the questions concerning the costs of
environmental reporting provided the following headline figures.
! The annual environmental reporting costs initially quoted ranged widely from £6,500
(Civil Engineering/Homebuilding) to £535,000 (Metals/Mining) with an average cost of
£92,716;
! When the costs associated with the strategy formulation and the establishing of
information systems were excluded i.e. the initial set up costs, the range of reporting costs
5 Ibid.
DEFRA Survey of Environmental Reporting Costs and Benefits
Issue 3 ENVIRON8 November 2001 64-C4650
10
was £4,500 (Civil Engineering/Homebuilding) to £259,500 (Insurance) with an average
cost of £66,903; and
! By comparison and for completeness, the average annual reporting costs for those
companies not producing a hard copy version of the report was £11,215 where initial set
up costs were excluded from the calculation. As mentioned above, this is significantly
lower than the costs recorded by companies producing hard copy reports, representing
less than 20% of the average costs of those companies producing hard copy reports.
The questionnaire was designed to investigate whether company size might account for some
of the variation in reporting costs, i.e. whether a relationship exists between company size and
the resources invested in reporting on environmental performance.
Two indices were used as measures of company size � the company annual turnover and the
number of employees. Simple, linear regression analysis was conducted to explore the
relationship between these indices and environmental reporting costs. The analysis was
conducted for both the total reporting costs and for the reporting costs excluding initial set up
costs. The results are shown graphically in Figures 1-4.
The data on each of the graphs does not closely relate to the calculated trend lines, which
leads to the conclusion that there is very little or no correlation between company size and the
costs of producing an environmental report. This is true for both measures of company size,
annual turnover and number of employees.
This observation contrasts with the results of the 1998 ENVIRON survey6, which concluded
that company size accounted for approximately half of the observed variation in reporting
costs.
When one considers that as there is no discernible relationship between company size and
costs incurred in reporting and that in general the respondees all scored highly in terms of
report contents, one can conclude that the costs to be incurred could be expected to fall
towards the lower end of those cited in Table 1. This would suggest that organisations could
expect to spend between £5,701 (the theoretical minimum) and £92,716 the average actual
cost on producing a stand alone environmental report. It is noted that other issues such as
6 Ibid.

DEFRA Survey of Environmental Reporting Costs and Benefits
Issue 3 ENVIRON8 November 2001 64-C4650
11
'willingness to spend', availability of resources and the efficiency of the data collection and
assimilation process may also influence the funds available.
As stated earlier, a range of reporting maturity was observed, with responses being received
from both first time and seasoned reporters. To establish whether the maturity of the reporter
might account for some of the observed variation in costs, the costs were plotted against the
number of years of reporting. Figures 5 & 6.
The graphs show a large cluster of company environmental reporting costs at less than
£100,000. Interestingly however, as can be seen on Figure 5 the costs that deviate widely
from this main group are all from companies that have been reporting for five years or less.
This would indicate that whilst not all new comers to environmental disclosure experience
high costs of reporting, those companies which do experience higher costs are often relatively
new to the process of environmental disclosure. Indeed if Figure 5 is compared to Figure 6
where the initial set up costs have been excluded, it can be seen that the cost discrepancies are
much less marked, with the trend line in Figure 6 being much flatter than that of Figure 5.
This fact reinforces the conclusion that organisations are expected to spend less than
£100,000 on producing a report. New reporters will and do experience higher costs.
However, their target should be costs experienced by the �mature reporter� who have learnt
lessons and possibly identified efficiency improvements from the earlier reporting years.
Finally, the cost responses were analysed to examine whether sectoral differences had a role
to play in reporting cost variations.
Table 2 shows the average annual reporting costs by sector where available, and indicates the
sample size from which the average was calculated. Figure 7 represents this data graphically.
TABLE 2: AVERAGE ANNUAL REPORTING COSTS BY SECTOR
Sector Number ofCompaniesContacted
Number ofCompaniesResponding
Average AnnualReport Costs
(Excluding SetUp)
Automotive 2 1 £ 35,800Banks, Finance, Investment 5 1 £ 9,262Beverages/Tobacco 3 0 N/AChemicals 6 2 N/ACivil Engineering/Homebuilding 8 2 £ 21,755Consumer Goods 2 1 N/ADiverse Services 9 3 £ 28,978

DEFRA Survey of Environmental Reporting Costs and Benefits
Issue 3 ENVIRON8 November 2001 64-C4650
12
Entertainment/Leisure/Hotel/ Restaurant 2 2 £ 17,595Food Production 2 1 £ 72,500Food Retail 2 1 £ 112,200General Retail 9 3 £ 43,050Government/Authorities/Agencies 5 2 £ 74,000Industrial/Electrical/Manufacturing/Engineering 1 1 N/AInformation & Communications 2 2 £ 72,935Insurance 3 3 £ 146,750Media/Advertising 1 0 N/AMetals/Mining 3 2 £ 161,250Petrochemicals 4 1 £ 33,200Pharmaceuticals 4 1 £ 88,040Property/Real Estate 1 0 N/APulp & Paper 4 2 £ 34,890Transport 9 6 £ 64,406Utilities 22 10 £ 81,306TOTAL 109 47Notes: The environmental reporting costs listed above exclude the costs associated with strategy formulation
and the costs incurred in setting up new information systems to capture the relevant data. In addition,data from companies which do not produce a hard copy version of their environmental report hasbeen excluded.
On first inspection, Figure 7 appears to indicate that the costs of producing environmental
reports do vary widely between sectors. The utilities, diverse services and the transport
sectors received the highest number of responses, with 10, 3 and 6 questionnaires being
returned respectively. The average costs calculated from responses from companies within
these sectors will therefore provide the most robust figures. Referring to Table 2, it can be
seen that there is a marked difference between the average environmental reporting costs
experienced within these sectors:
Utilities £ 77,106
Transport £ 64,406
Diverse Services £ 28,978
It is difficult to attribute reasons to these wide sectional differences. The highest cost can be
attributed to the Metal/Mining sector whilst the second highest costs come from the Insurance
sector (a service industry). However, at the other end of the scale the three sectors reporting
the lowest costs are the Banking/Finance/Investment, Entertainment/leisure and Civil
Engineering/Homebuilding sectors.
The proposition that sectors which are heavily regulated or where there is a large awareness
(public and employee) of the sectors impact on the environment does not lead to an
DEFRA Survey of Environmental Reporting Costs and Benefits
Issue 3 ENVIRON8 November 2001 64-C4650
13
explanation. One can only conclude that there is no discernible linkage between sector spend
on environmental reports and type of sector as a result of the information gathered in this
study.
Table 3 below summarises the tests made during the analysis for correlation between
expenditure on environmental reporting and company attribute.
TABLE 3: SPEND CORRELATIONPrimary Issue Comparison Correlation
Company size (annualturnover and number ofemployees)
Reporting spend Little or no correlation
Report content Reporting spend Little or no correlationReporting spend Reporting Maturity Mature reporters showing costs
of £100,000 or lessSector spend Type of sector No correlation
4.3 BENEFITS OF ENVIRONMENTAL REPORTING
It had been anticipated that the surveyed companies might not have easily identified a direct,
financial benefit to environmental reporting. Indeed, financial information on the benefits of
environmental disclosure was only included within six of the responses. However, some
points of interest are raised by these replies:
! The companies reporting financial benefits of environmental disclosure had been
producing reports for an average of 7.1 years, as compared to the 4.79 years of the
responding group when taken as a whole. This could indicate one of two things. Either
that the financial benefits of environmental reporting are not realised for the first few
years of reporting, or and what is considered more likely, that seasoned reporters have
realised the importance of capturing this information as a means of recording and
monitoring progress against set targets.
! Financial benefits were recorded for only a few of the benefit categories. In the main
these included savings as a result of setting reduction targets for resource use, waste,
water usage and energy expenditure. In addition, one respondent recorded a financial
benefit resulting from improved employee awareness. As above, this may represent the
use of environmental reports as a tool to measure continual environmental improvements,
DEFRA Survey of Environmental Reporting Costs and Benefits
Issue 3 ENVIRON8 November 2001 64-C4650
14
especially as data on resource use, waste, water usage and energy expenditure is relatively
easy to capture.
! Three of the six companies providing financial benefit data were from the utilities sector.
This constitutes 50% of the sample, and compares to the 21.3% that the utility sector
companies made of the total responses received. As outlined above, this may be as a
result of the maturity of the utilities sector in terms of producing environmental reports.
The average number of years of reporting for the utility sector was 7.56. However, it
could also indicate that there are additional, sector specific drivers to capturing financial
benefit information.
A more comprehensive understanding of the types of benefits realised by environmental
reporting companies becomes apparent when the scored responses to the questions concerning
benefits are analysed. Companies were given the opportunity of recording the benefit of
environmental reporting on a scale of one to three. For the purpose of analysis, where an
issue was recorded as being of no benefit to the company, a score of zero was assigned. In
addition, individual responses that recorded which issues companies were unsure of, or
unable to quantify, a particular benefit were excluded from the analysis. Figure 8 gives a
graphical representation of the average score achieved by each benefit category. (The
categories are represented in the same order as they appeared within the questionnaire.)
The results show that the benefits that ranked highest could generally be described as being
related to the communication of a company�s position on environmental issues. These
included improved stakeholder dialogue, reputational improvements, increased employee
awareness, stronger internal commitment and provision of environmental information.
The middle ranking benefits were in the main related to the mechanistic and procedural
elements of environmental management. They included general improvements in
environmental management, a reduction in resource use, reduced waste generation, and a
reduction in water use and energy expenditure. These benefits are really the most tangible and
robust issues surrounding environmental management systems. Also ranking amongst this
middle ground of benefits were the issues of improved access to markets and competitive
advantage.
The financial and regulatory benefits of producing an environmental report were assigned the
lowest scores by the responding companies. The issues of lower insurance premiums, reduced
cost of capital and reduced regulatory benefit were deemed to be of only limited benefit to the

DEFRA Survey of Environmental Reporting Costs and Benefits
Issue 3 ENVIRON8 November 2001 64-C4650
15
responding companies, and as a group achieved the lowest benefit scores. As reported earlier,
the literature review identified a large body of evidence that companies are being subjected to
increasing scrutiny from fund managers, investment advisors and others to produce
comprehensive environmental reports. However, the results of this survey appear to contrast
and conflict with the published articles, and indicate that this pressure is currently either not
being felt or is not currently being recognised by companies as a benefit of providing an
environmental report. Therefore, the question becomes to what extent can fund managers and
financial institutions enforce the policies laid down in their ethical investment decision-
making processes?
To examine whether there may be some indication of sectoral differences, the responses to the
benefits questions from companies within the utilities sector, diverse services sector and the
transport sector were once again examined separately. Table 4 lists the average scores
achieved by each benefit category within each of these three sectors. The overall, average
benefit scores, as depicted in Figure 8, are included for reference.
TABLE 4: BENEFITS OF ENVIRONMENTAL REPORTING
Average scoresType of BenefitAll
SectorsUtilitiesSector
TransportSector
DiverseServices
Decreased Resource Use 1.55 1.80 1.33 1.67Decreased Waste 1.57 2.00 1.67 0.75Decreased Water Usage 1.37 1.71 1.33 1.67Reduced Energy Expenditure 1.49 1.50 1.75 1.75Lower Insurance Premiums 0.53 0.43 0.00 1.00Reduced Cost of Capital 0.62 0.44 0.00 1.50Improved Access to SRI Funds 1.20 1.50 1.33 2.00Improved Market Access 1.30 1.67 1.00 2.25Competitive Advantage 1.48 1.71 1.00 2.50Stronger Internal Commitment 2.15 2.25 1.67 1.50Better Environmental Management 1.95 2.25 1.67 1.25Increased Employee Awareness 2.14 2.38 1.67 1.33Reduced Regulatory Burden 1.05 1.29 0.67 1.25Reputational Improvements 2.21 2.57 2.00 2.25Provision of Environmental Information 2.00 2.13 2.33 2.50Improved Stakeholder Dialogue 2.31 2.63 2.50 2.25
This data is represented graphically in Figures 9, 10 & 11, and indicates that there may be
sectoral differences in the benefits achieved by companies that produce environmental

DEFRA Survey of Environmental Reporting Costs and Benefits
Issue 3 ENVIRON8 November 2001 64-C4650
16
reports. An examination of the data in Table 4 and Figures 9-11 highlights a number of these
differences:
! In general, companies in the utilities sector assigned slightly higher scores to each benefit
category than all the sector responses taken as a whole;
! Conversely, companies in the transport sector generally assigned lower benefit scores
than all the sector responses taken as a whole;
! Companies within the diverse services sector did not follow the same trends in assigning
benefit scores as the other sectors. Improved access to SRI funds, and improvements in
market access and competitive advantage scored highly when compared to the other two
sectors;
! All three sectors ranked improved stakeholder dialogue, reputational improvements and
the provision of environmental information as important/major benefits of producing an
environmental report.
In conclusion therefore, it appears that the most significant benefits being perceived by
reporters are the intangibles relating to: improved stakeholder dialogue, better reputation for
managing environmental issues, increased employee awareness, stronger internal
commitment to managing environmental issues and improved provision of environmental
information.
DEFRA Survey of Environmental Reporting Costs and Benefits
Issue 3 ENVIRON8 November 2001 64-C4650
17
5.0 CONCLUSIONS
A survey of this type depends entirely on the quality of the responses received. The
questionnaire was designed and agreed between ENVIRON and DEFRA in order to make the
process of identifying costs and benefits as straight forward as possible.
Of the 47 completed responses received there is clearly a large variation in the costs
associated with producing environmental reports. The costs initially quoted for the
production of an environmental report ranged from £6,500 to £535,000 with an average cost
of £92,716. A comparison of these costs against company size shows there is no direct
correlation between costs of environmental reporting and company size. Some very large
companies (in terms of turnover and employee numbers) appear to spend relatively little on
the production of their environmental reports.
There are very large cost variations in the individual steps in preparing an environmental
report. The strategy costs for identifying the business case for environmental reporting varied
from £300 to £300,000. External verification costs varied from £1,000 to £100,000 and data
collection costs varied from £615 to £100,000. On average, reporting strategy, data collection
and verification costs appear to vary by a factor of a hundred between the least and most
expensive reports.
Reporting costs vary widely across the different sectors. The sector reporting the lowest costs
was Banking, Finance and Investment with an average annual report cost of £9,262. At the
other end of the spectrum the Metals/Mining sector report an average cost of £161,250. The
Utilities sector, which had the largest response rate of 10 companies out of a possible 22,
cited an average annual cost of £81,306.
The majority of reporters scored highly in terms of report contents. Therefore differences in
costs cannot readily be attributed to a report�s contents.
This would suggest that the costs likely to be experienced could be between the average
quoted cost of around £90,000 and the lower theoretical cost of around £6,000. This
conclusion is supported by a cluster of �mature reporters� experiencing costs of the order of
£100,000.

DEFRA Survey of Environmental Reporting Costs and Benefits
Issue 3 ENVIRON8 November 2001 64-C4650
18
Companies reporting financial benefits of environmental disclosure have been producing
reports for an average of 7.1 years, as compared to the 4.79 years of the responding group
taken as a whole. This could indicate 1 of 2 things. Either that the financial benefits of
environmental reporting are not realised for the first few years reporting, or and what is
considered more likely, that seasoned reporters have realised the importance of capturing this
information as a means of recording progress against set targets.
The results show that the benefits that ranked highest could generally be described as being
intangible benefits related to the communication of a companies position on environmental
issues. These included improved stakeholder dialogue, reputational improvements, increased
employee awareness, stronger internal commitment and provision of environmental
information.
The middle ranking benefits were in the main tangible and related to the mechanistic and
procedural elements of environmental reporting and management. They included general
improvements in environmental management, decreased resource use, decreased waste, water
usage and reduced energy expenditure. These benefits are really the most tangible and robust
issues surrounding environmental management reporting and systems.
The financial and regulatory benefits of producing an environmental report were assigned the
lowest scores. The issues of lower insurance premiums, reduced costs of capital and reduced
regulatory oversight were deemed to be of only limited benefit to the responding companies,
and as a group achieve the lowest benefit scores. The literature review identified a large body
of evidence that companies are being subjected to increasing scrutiny from fund managers,
investment advisors and others to produce comprehensive environmental reports. However,
this contrasts with published literature which indicates that this pressures is currently either
not being felt or is not currently being recognised by companies as a benefit of providing an
environmental report. Therefore, the question becomes to what extent can fund managers and
financial institutes enforce the policies laid down in their ethical investment decision-making
processes?
Companies within the Diverse services sector (including waste management companies) did
not follow the same trends in assigning benefit scores as the other sectors. Improved access
to SRI funds, and improvements in market access and competitor advantage scored highly
when compared to the other sectors.

DEFRA Survey of Environmental Reporting Costs and Benefits
Issue 3 ENVIRON8 November 2001 64-C4650
ANNEX A: LITERATURE SEARCH REFERENCES
DEFRA Survey of Environmental Reporting Costs and Benefits
Issue 3 ENVIRON8 November 2001 64-C4650
1. Sustainability Reporting Guidelines, GRI (Global Reporting Initiative), 2000.
2. Socially responsible investment �comes of age�, PIRC Press Release, July 1999.
3. Environmental Reporting and the Medium Sized Company, Rachel Jackson (ACCA), Markus
Milne (University of Otago, New Zealand) & Dave Owen (University of Sheffield), 2000.
4. The Emerging Relationship Between Environmental Performance and Shareholder Wealth,
The Assabet Group, January 2001.
5. EPA Study Highlights Financial Link to Environmental Performance, National Advisory
Council for Environmental Policy and Technology, Environmental Capital Markets Committee
(US EPA), November 2000.
6. Analysis of Responses to FEE Discussion Paper �Providing Assurance on Environmental
Reports�, FEE � European Federation of Accountants.
7. Voluntary Guidelines Published on Environmental Management and Reporting for
Financial Institutions, Consortium of banks (FORGE) supported by DTI and DETR and
Environmental Consultants from PriceWaterhouse Coopers.
8. Investors Prod CEO�s to Adopt New Sustainability Reporting Standards, SocialFunds.com,
November 2000.
DEFRA Survey of Environmental Reporting Costs and Benefits
Issue 3 ENVIRON8 November 2001 64-C4650
ANNEX B: COPY OF QUESTIONNAIRE


DETR/QuestionnaireP
COMPANY DETAILS
Company Name ��������.. Contact Name ��������..
Address ������������ Job Title ������������
������������ Email ������������
������������ Company sector ��������..
Tel No ������������ Company annual turnover �����
Fax No ������������ Total number employees �����
ENVIRONMENTAL REPORTING
How frequently does your company report on itsenvironmental performance?
AnnuallyOther (please specify) ����
Please give the year of your first environmental report. 19�..Does your environmental report form a separate standalone document from your annual report?
YES ❏ NO ❏
Is your environmental report a publicly availabledocument?
YES ❏ NO ❏
Please indicate the form(s) your report takes. Hardcopy ❏
Internet ❏
Is your environmental report externally verified? YES ❏ NO ❏
Please tick the boxes below to indicate which of the following elements are included withinyour environmental report.
CEO/senior management statement detailing environmental commitments ❏
Environmental policy ❏
Statement regarding the status of company certification (e.g. ISO14001) ❏
Statement regarding the coverage of the report (i.e. sites/regions, products/services etc) ❏
If coverage not complete, a statement on projected timeline for complete coverage ❏
Measurement data for environmental key performance indicators ❏
If yes, please indicate which are used:
Energy Consumption ❏ Materials use ❏ Water usage ❏
Greenhouse gas emissions ❏ Waste to land ❏ Emissions to air ❏
Effluents to water ❏ Other (please specify) �����������..
Disclosure of targets & objectives for future performance ❏


DETR/QuestionnaireP
Record of compliance with environmental legislation ❏
Reply card or other opportunity for feedback from the reader ❏
Statement explicitly naming the executive responsible for the report�s production ❏
Please detail any proposed significant changes to your current environmental reporting format andcontent. Please give the estimated timescale over which the changes will take place.����������������������������������������
����������������������������������������
COSTS ASSOCIATED WITH ENVIRONMENTAL REPORTING
The production of environmental reports invariably entails the use of both internal and externalresources. Please give an estimation of the costs involved in each of the following stages of thereport production process.
If the costs were external, simply give the invoiced amount.
For internal costs, give the total amount if possible. If actual costs are not easily assigned, pleasegive an indication of the employee time required to complete the task against their approximateannual salary. If more than one member of staff was involved please give an indication of the totaltime against each salary category.
Please provide a brief details in the space underneath each question if you think this would explainyour answer more fully.
(Note that all information will be treated as confidential)
Total Cost ����� (£)or:-
Approximateannual salary
Employeetime (DAYS)
£10K-20K£20K-30K£30K-40K
What costs were incurred during the strategy formulationstage of identifying the business case for reporting?
More than £40K
Total Cost ����� (£)or:-
Approximateannual salary
Employeetime (DAYS)
£10K-20K£20K-30K£30K-40K
What costs were incurred in establishing informationsystems to ensure the availability of appropriate data?
More than £40K

DETR/QuestionnaireP
Total Cost ����� (£)or:-
Approximateannual salary
Employeetime (DAYS)
£10K-20K£20K-30K£30K-40K
What costs were involved in data collection?
More than £40K
Total Cost ����� (£)or:-
Approximateannual salary
Employeetime (DAYS)
£10K-20K£20K-30K£30K-40K
What costs were incurred in copywriting the text for thereport?
More than £40K
Total Cost ����� (£)or:-
Approximateannual salary
Employeetime (DAYS)
£10K-20K£20K-30K£30K-40K
What costs were incurred in designing the hard copyversion of the environmental report?
More than £40K
Total Cost ����� (£)or:-
Approximateannual salary
Employeetime (DAYS)
£10K-20K£20K-30K£30K-40K
What costs were incurred in designing the internet versionof the environmental report (where applicable)?
More than £40K
Total Cost ����� (£)or:-
Approximateannual salary
Employeetime (DAYS)
£10K-20K£20K-30K£30K-40K
What were the costs associated with internal verificationof the report?
More than £40K
DETR/QuestionnaireP
What costs were incurred during the external verificationof the report?
Total Cost ����� (£)
Total Cost ����� (£)or:-
Approximateannual salary
Employeetime (DAYS)
£10K-20K£20K-30K£30K-40K
What were the costs of producing and printing the report?
More than £40K
What were the costs of distributing the report? Total Cost ����� (£)
Total Cost ����� (£)or:-
Approximateannual salary
Employeetime (DAYS)
£10K-20K£20K-30K£30K-40K
Was a follow up survey conducted to measure stakeholderopinion to the report? How much did the survey cost?
More than £40K
Total Cost ����� (£)or:-
Approximateannual salary
Employeetime (DAYS)
£10K-20K£20K-30K£30K-40K
What costs were incurred in responding to readers�comments on the report?
More than £40K
Were there any additional costs experienced by your company, which are not covered in the abovelist? If yes, please give details:����������������������������������������
����������������������������������������
����������������������������������������
DETR/QuestionnaireP
BENEFITS OF ENVIRONMENTAL REPORTING
Please indicate which of the following issues have been identified as a benefit to your company as aresult of the production of an environmental report by ticking the appropriate box. If yes, pleaserate the benefit according to the following scheme:-
1 = of limited benefit only to the company2 = recognised as an important benefit to the company3 = represents a major benefit to the company
It is recognised that a financial saving is not always readily identifiable with these benefits, butwherever possible, please give an estimate of the financial saving or benefit that the company hasachieved as a result.
Issue Benefit toCompany
Rank Benefit( 1= limited benefit
2= importantbenefit
3= major benefit )
Estimateof Savingor Benefit
(£)
Savings as a result of the measurement of key performance indicators, and the setting ofreduction targets:-
YES ❏ 1 ❏ 2 ❏ 3 ❏ ���NO ❏
i) Decreased resource use
Not sure ❏
YES ❏ 1 ❏ 2 ❏ 3 ❏ ���NO ❏
ii) A reduction in wastes arising
Not sure ❏
YES ❏ 1 ❏ 2 ❏ 3 ❏ ���NO ❏
iii) Decreased water usage
Not sure ❏
YES ❏ 1 ❏ 2 ❏ 3 ❏ ���NO ❏
iv) A reduction in energy expenditure
Not sure ❏Other direct savings:
YES ❏ 1 ❏ 2 ❏ 3 ❏ ���NO ❏
Lower insurance premiums
Not sure ❏Attraction of investment:-
YES ❏ 1 ❏ 2 ❏ 3 ❏ ���NO ❏
A reduction in the cost of capital
Not sure ❏
YES ❏ 1 ❏ 2 ❏ 3 ❏ ���NO ❏
Improved access to SRI funds. (The recentamendment to the Pensions Act requiresfunds to state how environmentalconsiderations are taken into accountduring investment selection.)
Not sure❏
DETR/QuestionnaireP
Market related benefits:YES ❏ 1 ❏ 2 ❏ 3 ❏ ���NO ❏
Improved access for products/services inenvironmentally conscious markets
Not sure ❏
YES ❏ 1 ❏ 2 ❏ 3 ❏ ���NO ❏
Competitive advantage over peers withinsector
Not sure ❏Internal benefits:
YES ❏ 1 ❏ 2 ❏ 3 ❏ ���NO ❏
Stronger internal commitment toenvironmental performance
Not sure ❏
YES ❏ 1 ❏ 2 ❏ 3 ❏ ���NO ❏
Facilitation of better environmentalmanagement
Not sure ❏
YES ❏ 1 ❏ 2 ❏ 3 ❏ ���NO ❏
Increased employee awareness/increasedemployee satisfaction
Not sure ❏External benefits:
YES ❏ 1 ❏ 2 ❏ 3 ❏ ���NO ❏
Reduced regulatory burden/increasedability to provide information to regulators.
Not sure ❏
YES ❏ 1 ❏ 2 ❏ 3 ❏ ���NO ❏
Reputational improvements
Not sure ❏
YES ❏ 1 ❏ 2 ❏ 3 ❏ ���NO ❏
The report provides an easily accessible,single source of information reducing theresources required to respond toenvironmental enquiries. Not sure ❏
YES ❏ 1 ❏ 2 ❏ 3 ❏ ���NO ❏
Improved stakeholder dialogue, and abilityto demonstrate progress to stakeholders
Not sure ❏Potential future benefit:
YES ❏
NO ❏
Do you anticipate that environmental reportingcould lead to a reduction in your company�senvironmental taxation obligations?
Not sure ❏
Has your company identified other benefits not listed above? If so, please provide details below,including where possible any quantifiable savings/benefits.
��������������������.������������������������������������������.�������������������������������������������.�����������������������������������������.������������������
Thank you for your time.


DEFRA
Issue 38 November 2001


