RENEWABLE POWER GENERATION SUBSIDIES IN CHINA:
AN ECONOMIC FEASIBILITY ANALYSIS
AND POLICY RECOMMENDATIONS
Submitted by
Yunwen Nina Li
51-208258
Academic Supervisor:
Professor Arima Jun
Submitted to
Graduate School of Public Policy
The University of Tokyo
In partial fulfillment of the requirements for the degree
Master of Public Policy, International Program
June 2021
Tokyo, Japan
I
Table of Contents
Abstract ........................................................................................................................ IV
Acknowledgments......................................................................................................... V
Abbreviations ............................................................................................................... VI
1 Introduction ................................................................................................................. 1
2 Literature Review........................................................................................................ 5
3 Theoretical Framework ............................................................................................... 9
3.1 Economics of subsidy ....................................................................................... 9
3.2 Taxonomy of subsidies ................................................................................... 10
3.3 Externalities .................................................................................................... 12
4 Renewable Energy Subsidies in China ..................................................................... 15
4.1 China’s current subsidies for renewable power production ........................... 16
4.1.1 Renewable Energy Law ....................................................................... 17
4.1.2 Feed-in-tariff Scheme and Renewable Energy Development Fund ..... 18
4.1.3 Feed-in Tariff Scheme for Solar Project .............................................. 23
4.1.4 Feed-in Tariffs Scheme for Wind Project ............................................ 26
4.1.5 Renewable Energy Electricity Surcharge ............................................. 28
4.1.6 Green Power Certificate ....................................................................... 32
4.1.7 Renewable Portfolio Standards ............................................................ 34
4.1.8 Monitoring and Evaluation System of Wind and Solar Investment..... 38
4.2 Existing issues with China’s current subsidy schemes ................................... 40
4.2.1 Funding deficit of the REDF ................................................................ 40
4.2.2 Waste-to-energy eligibility under the FIT subsidy scheme ................. 43
4.2.3 Delay in the approval process for FIT enlistment ................................ 44
4.2.4 Abandonment of wind and solar resources .......................................... 47
4.2.5 Poor Sales Performance of the Green Power Certificates .................... 49
5 Methods of analysis .................................................................................................. 51
5.1 Analytical framework ..................................................................................... 51
5.2 Baseline model specifications ........................................................................ 53
II
5.2.1 Generation ............................................................................................ 55
5.2.2 Revenue ................................................................................................ 57
5.2.3 Capital costs ......................................................................................... 60
5.2.4 Operational expenditure ....................................................................... 63
5.3 Debt financing ................................................................................................ 64
5.4 Preferential tax policy ..................................................................................... 66
5.5 Subsidy under the FIT scheme ....................................................................... 68
5.5.1 Basic assumptions ................................................................................ 70
5.5.2 Subsidy payout ratio ............................................................................. 71
6 Results and Conclusion ............................................................................................. 75
6.1 Baseline model results .................................................................................... 75
6.2 Debt financing results ..................................................................................... 77
6.3 Preferential tax policy results ......................................................................... 78
6.4 FIT subsidy results.......................................................................................... 80
7 Policy Recommendation ........................................................................................... 83
7.1 Improve the efficiency of the REDF .............................................................. 84
7.2 Reallocate public resources from fossil fuel subsidy ..................................... 92
7.3 Provide alternatives to the FIT subsidy .......................................................... 96
7.4 Reduce the abandonment rate of wind and solar power plants .................... 103
8 Conclusion .............................................................................................................. 105
Bibliography .............................................................................................................. 110
III
List of Figures
Figure 1: Electricity mix of three countries by March 2020 .................................. 2
Figure 2: Impact of unit subsidy on market equilibrium ...................................... 10
Figure 3: Full pricing for fossil fuels vs. inefficient taxation ............................... 13
Figure 4: Administrative flowchart of China’s feed-in-tariff scheme .................. 22
Figure 5: Geographical categorization for solar projects under the FIT scheme . 24
Figure 6: Geographical categorization for wind project under the FIT scheme ... 28
Figure 7: Solar and wind power capacity monitor map 2019 ............................... 39
Figure 8: RE surcharge as a percentage of electricity tariffs in three
municipalities (province) in 2020 ................................................................. 89
Figure 9: Fossil fuel subsidy in China from 2010 to 2019 ................................... 94
List of Tables
Table 1: Summary of FIT rates for solar projects in China .................................. 26
Table 2: Summary of FIT rates for wind projects in China.................................. 27
Table 3: Summary of renewable energy electricity surcharge rates ..................... 31
Table 4: RE surcharge payable to and collected for the REDF ............................ 41
Table 5: Renewable energy FIT subsidy catalogs before 2020 ............................ 45
Table 6: Example of total generation in the initial years ...................................... 56
Table 7: Initial cost structure ................................................................................ 62
Table 8: OPEX for the initial years since project operation ................................. 64
Table 9: Subsidy payout ratio by year .................................................................. 74

IV
Abstract
China is the world’s largest renewable energy producer by installed capacity and
electricity generation from renewables. Renewable power producers in China have
long been supported by the feed-in-tariff (FIT) scheme. However, following
exponential growth in renewable energy and an expanding deficit in FIT funding,
China has been reducing FIT subsidy rates and transitioning towards a multilayered
supportive scheme for renewable energy power production. In particular, China has
introduced the trading of Green Power Certificate in 2017 and implemented the
Renewable Portfolio Standards in 2020. This thesis studies the economic feasibility of
a centralized and grid-connected solar PV power plant under the FIT scheme and
proposes policy recommendations based on the discounted cash flow model results
for the improvement of the current subsidy scheme.
Keywords: Renewable energy power generation; subsidies; Feed-in-Tariff; Green
Power Certificate; Renewable Portfolio Standards; economic feasibility; discounted
cash flow model; China.

V
Acknowledgments
This thesis is dedicated to my grandfather, who fought and won the battle against
cancer. He showed me how to triumph over fear and taught me the true meaning of
audacity.
I would first like to express my sincere appreciation for my advisor, Professor
Arima Jun, to whom I am deeply indebted for his supervision and valuable comments.
His extensive knowledge of renewable energy has greatly benefited my research and
his support has been a great source of energy.
My heartfelt appreciation also goes to my parents for their support and
understanding. They have always given me endless love and encouragement. They are
the reason why I dare to reach the stars and chase my dreams.
I would also like to thank all the faculty members and my colleagues at the
University of Tokyo and Columbia University. They have been a constant source of
inspiration, education, and entertainment. Finally, I would also like to thank my friend
Joaquin Leandro Sanchez, who has always been a happy distraction and kept me
going during the hardest times.
VI
Abbreviations
BNEF Bloomberg New Energy Finance
CAPEX Capital Expenditure
CREST China Renewable Energy Subsidy Tool
DCF Discounted Cash Flow
DSCR Debt Service Coverage Ratio
ETS Emission Trading System
FIT Feed-in-Tariff
GHG Greenhouse Gas
GPC Green Power Certificate
ICT Information and Communications Technology
ITC Investment Tax Credit
IEA International Energy Agency
IMF International Monetary Fund
IRENA International Renewable Energy Agency
IRR Internal Rate of Return
MOF Ministry of Finance
MSW Municipal Solid Waste
NDRC National Development and Reform Commission
NEA National Energy Administration
NOLC Net Operating Loss Carryforward

VII
NPV Net Present Value
O&M Operating and Maintenance
OPEX Operating Expense
PBP Payback Period
PTC Production Tax Credit
REC Renewable Energy Certificate
REDF Renewable Energy Development Fund
REL Renewable Energy Law
RPS Renewable Portfolio Standard
VAT Value-added Tax
1
1 Introduction
China’s renewable energy sector is expanding exponentially. According to
IRENA (Country Rankings, 2020), by 2020, China had a total installed capacity of
renewable energy at 925 GW, nearly triple the size of that in the United States, which
ranked the second in the world, at 311 GW. The same dataset also suggests that, back
in 2005, the total installed capacity of renewable energy in China was only 121 GW;
the number doubled in 5 years to 250 GW in 2010 and doubled again to 502 GW in
2015.
Apart from overall installed capacity, China also ranks the first in electricity
generation from renewable energy. According to the statistics of IRENA (Country
Rankings, 2020), total renewable power generation is over two times larger than that
in the United States, which ranks second place. However, within the country itself,
renewable energy is not the dominant energy source. According to the National
Bureau of Statistics (2021), by the end of 2020, thermal power accounted for 77.6%
of total electricity generation in China, while hydropower, wind, nuclear, and solar
took up 10.5%, 5.6%, 4.8%, and 1.4%, respectively. Based on data from the IEA
(2020c), China remains an economy primarily driven by coal, with 64% of electricity
generated from coal by March 2020. When we compare the electricity mix in China
with that in the EU and United States, we can see a significant difference.

2
Figure 1: Electricity mix of three countries by March 20201
The largest coal producer in the world, China is also the largest emitter of
greenhouse gases (GHGs). According to Climate Watch (2018), 24% of the world’s
GHGs were emitted in China, exceeding the second-largest emitter by a wide margin.
The report also shows that in cumulative terms, the country has surpassed the United
States as the largest cumulative GHGs emitter in 2014, contributing 18% of the
world’s cumulative emissions by 2018. By per-capita GHG emissions, China
registered 8.4 tCO2e per capita in 2018, falling behind the top 10 countries, which all
stood at over 22 tCO2e per capita in the same year (Climate Watch, 2018). However,
the country as a whole is releasing more GHGs into the atmosphere than the
developed world combined (Report: China Emissions Exceed All Developed Nations
Combined, 2021).
Resolute to shoulder more responsibility in combating climate change, China has
pledged to peak CO2 emissions before 2030 and achieve carbon neutrality by 2060
1 The charts here are compiled using data from IEA. The author referred to three charted
created by the IEA: Electricity mix in the United States (January to December 2020);
Electricity mix in China (Q1 2020); Electricity mix in the European Union (January to
September 2020).

3
(The Race to Zero Emissions, and Why the World Depends on It, 2020). To achieve
this ambitious goal, China would need to make every effort in reforming its current
energy mix. Based on a research of Xiliang Zhang, the Director of the Institute of
Energy, Environment and Economy at Tsinghua University, if China will increase
photovoltaic power generation by 16 times, wind power generation by 9 times,
nuclear power generation by 6 times, and double its hydropower generation, its
carbon emissions will increase to 10.3 billion tons in 2025 and will begin to decline in
2035 after plateauing for 5 to 10 years.2 With that in mind, there remains much to be
done if China still wants to achieve the 30-60 goal.
During the 2010s, the rapid growth of renewable power generation could be
attributed largely to the introduction of supportive schemes by the government and an
increasingly accommodative environment for renewable investments. But recently,
China’s government has reduced the feed-in-tariff (FIT) rates for wind and solar
power production due to a growing funding deficit under the FIT scheme. The
government is proactively seeking alternative supportive schemes and encouraging
renewable power producers to achieve grid-parity. In this context, it is worthwhile to
study the impact of shrinking subsidies on the economic feasibility of renewable
power plants and propose alternative policy schemes for promoting the development
of renewables.
This paper aims to study the economic feasibility of centralized solar PV plants as
China’s government lowers feed-in-tariff rates and cut subsidies for renewable
2 Retrieved from Carbon Neutrality: Paths and Options for Energy Transition (Translated),
2021.
4
electricity generation. The author also proposes policy recommendations for the more
efficient administration of the current subsidy schemes, as well as suggests alternative
policy solutions for the government to promote renewable power generation. The
structure of this paper is divided into eight chapters. Chapters one through three
serves as an introduction to the more substantive discussion: the first chapter of this
thesis is a prelude to further discussion; the second chapter summarizes previous
studies and the main references of this thesis; the third chapter constructs the
economic framework of this study. Chapters four through seven develops policy
recommendations based on quantitative and qualitative analysis of China’s subsidy
schemes: Chapter 4 discusses extensively the current policies on renewable power
generation and identifies drawbacks of the current schemes; Chapter 5 constructs a
financial model and compares the changes in key financial measurements under
different policy assumptions; Chapter 6 presents the results and implications of the
financial model; Chapter 7 develops policy recommendations in accordance with the
model outputs. Lastly, Chapter 8 concludes the entire study, identifies the limitations
of this paper and encourages further research.

5
2 Literature Review
The subsidy schemes for renewable power production in China have raised
academic interest due to their complex administration and recent reforms of
improvement. This study is unique in that the author performs economic feasibility
analysis of a proposed centralized and grid-connected solar power plant in the context
of the current subsidy scheme and goes on to develop a set of policy
recommendations based on the results of the model. Having said that, this thesis
would not have been materialized without previous studies and numerous documents
offering explanations and political context of the subsidy schemes in China.
For the background research on China’s subsidy policies, the author mainly
referred to the original texts published on the state government’s website. There are
three governmental bodies involved with the supervision and guidance of the subsidy
schemes for renewable power production: National Energy Administration (NEA),
Ministry of Finance (MOF), and National Development and Reform Commission
(NDRC). From conducting the research, the author possesses the impression that the
NEA is responsible for the overall administration of the subsidy schemes, and the
MOF is in charge of the management of the FIT budget, while the NDRC is
responsible for setting national targets for energy transformation. Apart from that, the
author also referred to the policy interpretation published by the State Power Grid
Company (Policy Graph, 2021) on the administrative and legal aspects of the subsidy
schemes.
6
The discussion on the taxonomy of renewable power production subsidies is
based on a technical paper published by Taylor (2020) on the global energy subsidy
transformation to 2050. It also draws on the analysis of Sovacool (2017), who
provides an overarching review of global energy subsidies, their types and scope,
strengths and limitations, and provides insights on reforming the current energy
subsidy systems. For the estimations of China’s current subsidy amount, the author
referred to multiple reports issued by IRENA, IEA, and IMF, which offered
differentiated calculation methods and definitions of subsidies for fossil fuels as well
as renewable energy.
The analytical method of this thesis and many key assumptions therein are built
upon previous studies on the economics of solar PV projects. In particular, Yuan et al.
(2014) applied the analytical framework of Levelized Cost of Electricity (LCOE) to
assess the economic feasibility of distributed PV in China and concluded that, at the
condition of 100% own consumption, only projects deployed in most
resource-abundant regions could earn economic profits. Cucchiella et al. (2017)
constructed a discounted cash flow model on photovoltaic systems in the residential
sector based on key financial indicators such as net present value (NPV), discounted
payback time (DPBT), and LCOE. They showed in their study that financial
indicators for solar PV projects are lower when subsidies are reduced or deleted, and
presented Italy as an example where solar PV installation is lower after the end of the
subsidy period. (Dusonchet & Telaretti, 2015) studied different support schemes for
solar PV projects in various European countries, and presented the economic impact

7
of government support on the IRR and NPV of proposed projects. Although results
vary among countries due to distinctive support schemes, they concluded that the
model demonstrates the highest profitability in countries where the electricity
compensation scheme is active. F. Zhang et al. (2015) applied the cash flow model on
distributed-generation PV (DGPV) systems in China and identified the difficulty in
securing project financing as the major barrier in the development of DGPV systems.
The author cites multiple sources as the foundation of model assumptions in this
thesis. For the average cost structure of a grid-connected, centralized solar PV project
in China, the author refers to the 2019 National Survey Report of PV Power
Applications by IEA (2020b). In addition, the assumptions on the subsidy payout ratio
are based on the China Renewable Energy Subsidy Tool and the Energy Project
Valuation Model created by BNEF. Other online data sources include the website of
State Power Grid Company, the official trading platform of Green Power Certificate,
and databases of international organizations.
For the proposal of policy recommendation, the author should credit several
previous studies on the RPS system, wind and solar abandonment, and clean energy
subsidy swap. In particular, Dong et al. (2019) studied the characteristics and
efficiency of China’s RPS system and proposed the implementation of an incremental
electricity price to complement the RPS system. Barbose (2019) looked at the
historical impact of the RPS system in the United States and offered insight into
future policy trends. He concluded that roughly 6 GW of installed capacity was newly
added every year to serve RPS compliance needs, totaling half of all renewable

8
energy capacity additions in the past decade. Moreover, S. Li et al. (2017) analyzed
the current trends of wind and solar abandonment in China and stated that efficient
power peak regulation and transmission could be the key to reduce curtailment rates.
In addition, Bridle et al. (2019) reviewed 4 cases of countries shifting public resources
from fossil fuels to clean energy and proposed other countries follow suit by
redirecting government support to large-scale on-grid renewables.
9
3 Theoretical Framework
3.1 Economics of subsidy
A subsidy is a form of financial benefit, usually given by the government, to
remove some type of burden from a business or institution (“Subsidy,” 2021). In the
context of this study. it is given by the Chinese government to promote the production
or the sales of renewable power. In a perfectly competitive market, the supply curve
of the producer and the demand curve of the consumer should intersect at the market
equilibrium point, at which the quantity of goods produced is also at its optimal. Any
form of subsidy will shift the supply curve while altering the quantity of goods
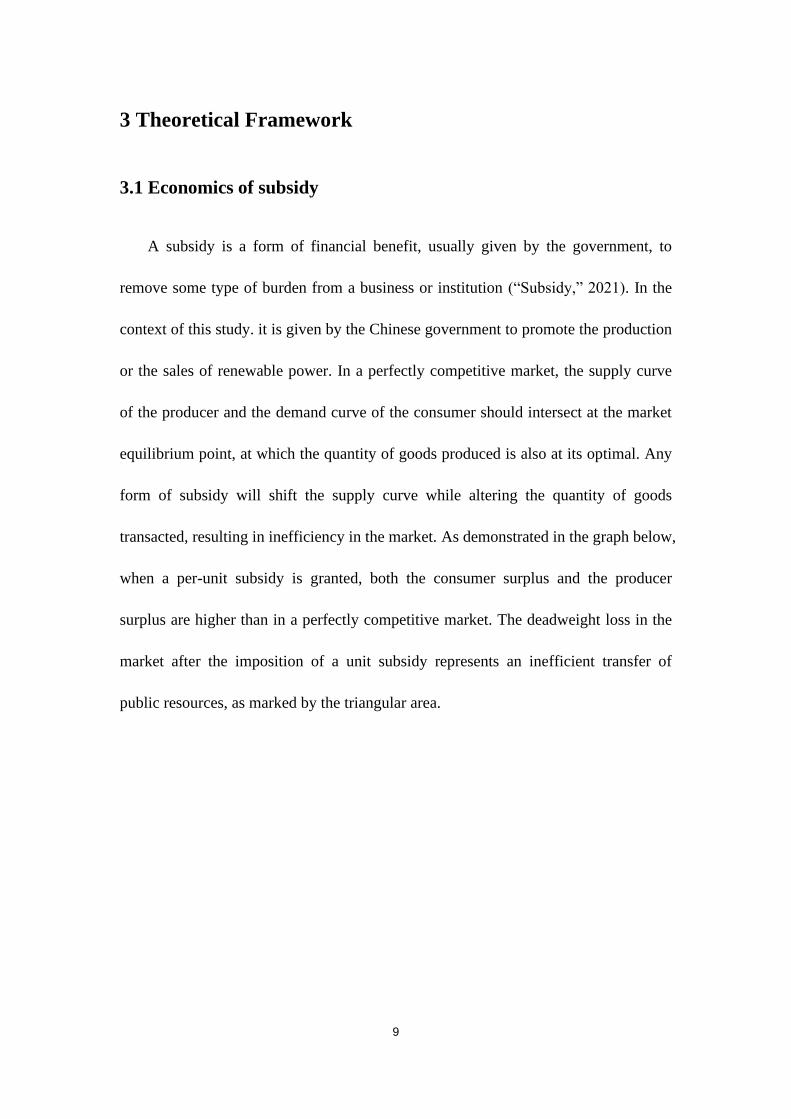
transacted, resulting in inefficiency in the market. As demonstrated in the graph below,
when a per-unit subsidy is granted, both the consumer surplus and the producer
surplus are higher than in a perfectly competitive market. The deadweight loss in the
market after the imposition of a unit subsidy represents an inefficient transfer of
public resources, as marked by the triangular area.
10
Figure 2: Impact of unit subsidy on market equilibrium
As proven by economic theory, a subsidy transfers public resources to producers
and consumers, and thereby increases the quantity of goods transacted. A unit subsidy
for renewable energy power generation functions in a similar manner with an aim to
promote the share of electricity generated from renewables. Subsidies in other shapes
– as will be discussed in the following section – are not necessarily depicted by the
same economic theory and lie beyond the scope of this study.
3.2 Taxonomy of subsidies
Subsidies can take many forms, and it is imperative that we first elucidate the
types of subsidies under discussion in this study. The IMF categorizes subsidies into

11
two general groups: producer subsidy and consumer subsidy. Producer subsidy arises
when the price received by the producer is higher than the equilibrium price in the
free market. Consumer subsidy, conversely, arises when the price paid by the
consumers is lower than the equilibrium price, or a benchmark price (IMF, 2013). It is
not hard to understand, though, if we refer to the figure on a unit subsidy granted by
the government. Both producer surplus and consumer surplus increase by a portion of
the subsidy in total, and the portion enjoyed by either the producer or the consumer, is
their relative share of the subsidy.
To break it down further, Sovacool (2017) provides a taxonomy of energy
subsidies consisting of 5 groups: 1) direct financial transfer, such as government
grants and low-interest loans; 2) preferential tax treatment, such as the Investment
Tax Credits and Production Tax Credits in the United States; 3) trade restrictions,
such as import quotas and tariffs, which are not relevant in the context of renewable
energy, since renewables are more domestic compared to fossil fuels; 4)
energy-related services provided by the government at less than full cost, for example,
government direct investment in energy infrastructure, etc.; and 5) regulation of the
energy sector that includes market accessibility and price controls. In this study, the
author will discuss easy-to-access debt instruments and preferential tax policies as
alternatives to China’s current subsidy scheme. In the meantime, the author will also
explore other policy channels that could potentially unleash a spurt of renewable
installations.
12
The main pricing scheme in China for renewable energy power generation is the
FIT scheme. In other countries where the FIT schemes have started earlier and
matured farther, the higher prices of renewable power are guaranteed by collecting
electricity surcharges from consumers. Therefore, technically speaking, conventional
FIT shall not fall under the umbrella of subsidies, since these are capital resources
reallocated from consumers to producers with the government acting as a
pass-through entity. In China, however, the central government plays a larger role
than merely passing through the capital stream. It assumes an administrative duty,
granting approval for renewable projects to receive the FIT revenue and making
decisions on how to allocate collected electricity surcharges to those approved
projects. As a result, the FIT system in China is more comparable to an indirect
financial transfer, as a subcategory of government subsidies, than to a capital
reallocation program that channels consumer surplus into the producer’s pockets, as
epitomized by the FIT schemes in other countries.
3.3 Externalities
As positioned by Taylor (2020), environmentally friendly subsidies can help to
improve the efficiency of capital allocation across the energy sector. It is for this
reason when evaluating subsidies for fossil fuels, we not only include direct or
indirect transfers from the government but should also take into account inefficient
taxation on negative externalities. The consumption of fossil fuels could induce
13
tremendous costs to society, and inefficient taxation on such costs – most frequently
in the forms of climate change and air pollution – will result in a higher quantity of
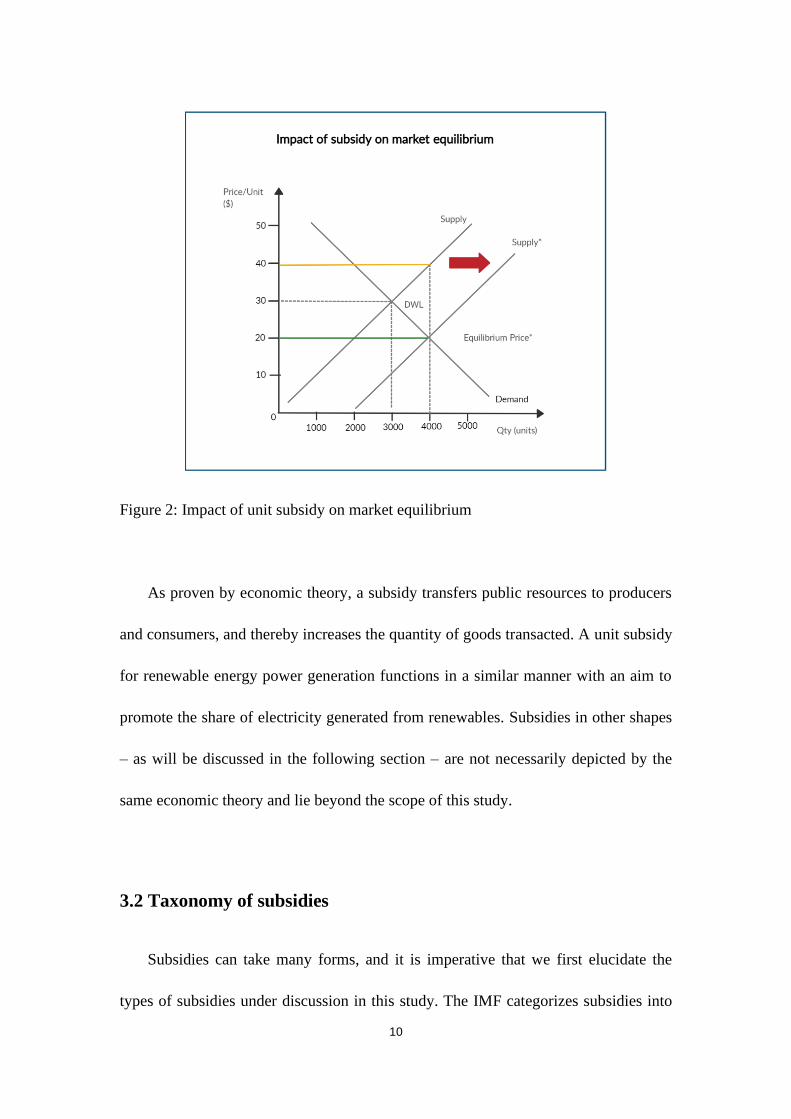
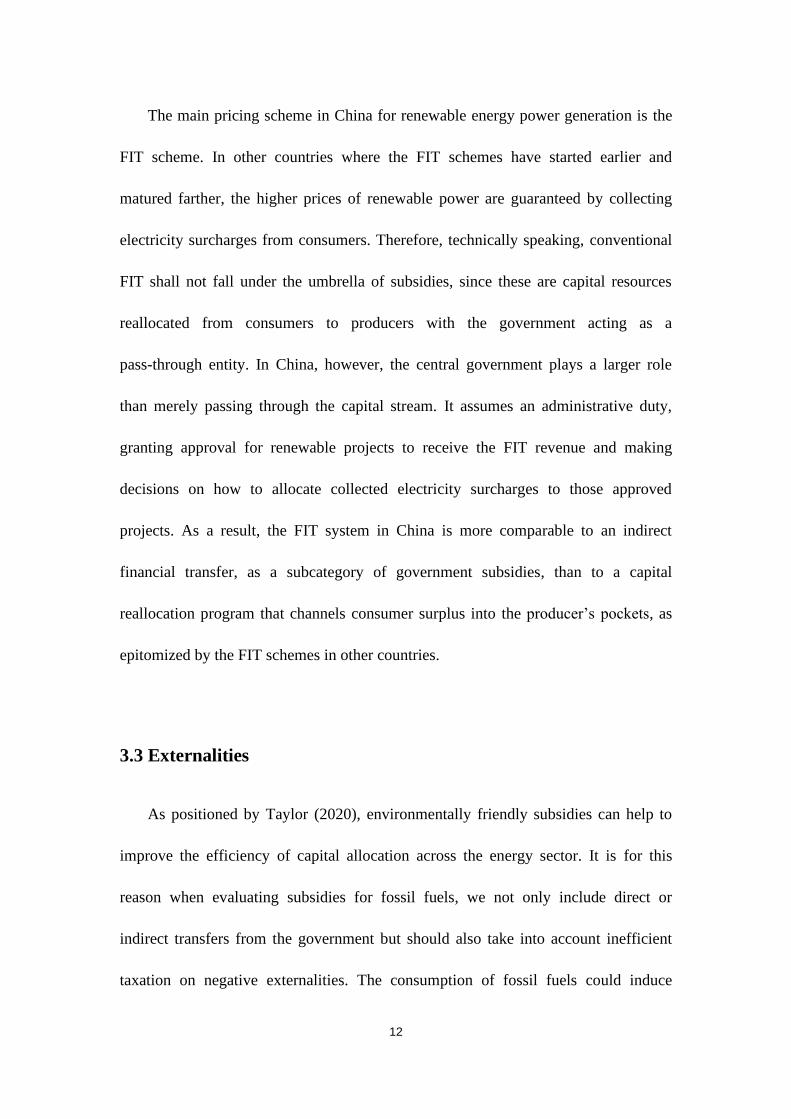
goods transacted and an equilibrium price that is too low. As shown in the graph
below, the supply curve will shift to the left if the government imposes a full pricing
mechanism for fossil fuels that efficiently captures the associated social costs. In such
circumstances, the producer faces higher generation costs and will therefore reduce
production for the benefit of the overall society.
Figure 3: Full pricing for fossil fuels vs. inefficient taxation
On the other hand, renewable energy could potentially bring three types of
positive externalities to society: social benefits, health benefits, and economic benefits.

14
Firstly, renewables could bring social benefits by the promotion of renewable jobs
and adherence to a sustainable economy. Since resources such as wind and solar are
carbon-free and regenerable, they are more environmentally friendly compared to
conventional energy sources. Secondly, renewable energies do not produce as serious
health repercussions as burning fossil fuels. Switching to renewables will result in less
pollution from coal-fired power plants and improved air quality. And thirdly, certain
uses of renewables can bring economic benefits to individuals and nations as a whole.
For example, landowners could earn an income from hosting renewable energy power
plants. And electricity prosumers, or end-users who provide electricity for their own
needs through distributed electricity generation systems, could enjoy economic gains
by producing electricity and connecting excess electricity to the grid. Apart from
individual gains, countries as a whole can also gain economic benefits from
renewable energy. Nations like Japan that depend heavily on oil imports might be
severely impacted when oil prices fluctuate. In such a sense, renewable energy can be
deployed independently and shows a much more stable price trend.
15
4 Renewable Energy Subsidies in China
In this chapter, the author intends to provide a holistic and overarching
description of China’s current subsidy schemes for renewable power production. This
chapter will serve as the bedrock of the subsequent sections, where the author delves
deeper into the economic impact of those subsidy schemes. To briefly summarize,
there are overall two supportive schemes for renewable power generation in China: a
long-running feed-in-tariff (FIT) scheme and an immature Renewable Portfolio
Standard (RPS) policy that is loosely connected to the Green Power Certificate (GPC)
system. As familiar as those might sound, these subsidy structures are distinctive from
those implemented in other countries. The FIT scheme in China, although with similar
functions and economic implications as those in countries such as Japan and Germany,
differs from its foreign counterparts due to a more complex administrative structure
and heavy government oversight. The RPS policy, on the other hand, has only been
recently implemented as a trial run and has thus far remained with no significant legal
or regulatory power. China’s GPC system, which originates from the Renewable
Electricity Certificate (REC) system in the United States, predates the RPS policy and
was originally implemented separately from the RPS policy as an alternative to the
FIT scheme. Hence, to understand the subsidy systems in China, we should first take
a closer look at their respective characteristics.

16
4.1 China’s current subsidies for renewable power production
Although China’s subsidy schemes for renewable power production were
implemented in reference to those enforced in developed countries such as European
countries, Japan, and the United States, it still lags behind in administration and the
level of support. According to the research by Taylor (2020), China circulated 15.6
billion USD of renewable subsidies in 2017, accounting for 9% of the world. The
same report states that the EU, the United States, and Japan recorded 90 billion USD,
23.7 billion USD, and 19 billion USD, respectively, accounting for 54%, 14%, and 11%
of total renewable subsidies in 2017. Taylor (2020) also estimates that, of the 15.6
billion USD of subsidies provided, 97% goes to renewable power generation, and that
makes China the third-largest supporter for renewable power generation in 2017,
taking up 12% of total subsidies for renewable power generation in the world.
The FIT scheme is the main subsidy scheme for renewable energy power
production in China. Over the years since its initiation, it has stimulated the
deployment of renewable power and encouraged technology advancement and cost
reduction. However, the support under the FIT scheme has been declining in recent
years due to a growing funding deficit. According to the Ministry of Finance,
subsidies provided under the FIT scheme were 8.1 billion CNY (1.3 billion USD) in
2019.3 The amount subsequently declined to 5.67 billion CNY (0.89 billion USD) in
20204, and rebounded slightly to 5.95 billion CNY (0.93 billion USD) in 20215.
3 The budget for FIT subsidy in 2018 is determined by the Ministry of Finance in a published
document titled Notice of the Ministry of Finance on Issuing the Budget of Additional Subsidy
17
4.1.1 Renewable Energy Law
The government’s official support for renewable energy development began with
the enactment of the Renewable Energy Law (REL). In 2005, China’s then-president
Hu Jintao signed the first version of REL, which entered into force in January 2006.
As stated in the first article of the 2006 REL, the law proclaims the government’s
support of the development and utilization of renewable energy in the forms of wind,
solar, hydro, biomass, geothermal, ocean, etc. The 2006 REL was a meaningful step
towards a sustainable future. Not only did the passage of the law prompted subsequent
policies, but it also signals a recognition within the ruling party of the need to
transform the current energy mix.
The 2006 REL was brought into effect against the backdrop of an economy
driven entirely by coal. Before the passage of the law, electricity generation from
renewable energy was markedly minimal compared to that from conventional energy
sources. According to the IEA, in 2005, China’s electricity generation from solar PV
only registered 84 GWh, accounting for 0.003% of total electricity generation. With
Funds for Renewable Energy Electricity Prices (Translated). The author retrieved this
information from a news article published at:
http://www.xinhuanet.com/power/2019-06/21/c_1210165971.htm
4 The budget for FIT subsidy in 2019 is determined by the Ministry of Finance in a published
document titled Notice of the Ministry of Finance on Issuing the Budget of Additional Subsidy
Funds for Renewable Energy Electricity Prices in Advance for 2020 (Translated). The author
retrieved this information from a news article published at:
http://www.tanjiaoyi.com/article-29515-1.html
5 The budget information is retrieved from the news article published by the National
Demand Side Management Platform.
18
government stimulus and expanding business investment, electricity generation from
solar PV skyrocketed to 224,000 GWh in 2019, representing roughly 3% of total
electricity generation (IEA, n.d.). Likewise, electricity generation from wind recorded
2028 GWh in 2005, accounting for 0.081% of total electricity generation, and climbed
to 406,000 GWh (5.4%) in 2019 (IEA, n.d.). Although the share of solar PV in China
was still below the level in developed countries by the end of 2019, the growth was
still visibly exponential. Statistically, the proportion of electricity that is produced
from solar PV rose over 800 times during the period from 2005 to 2019. Similar
growth was also witnessed in wind development, although to a lesser extent, with the
share of wind energy increased 66 times during the same period. This eye-catching
growth can be attributed largely to the favorable business environment at the time,
which was partly the outcome of the government’s supportive policies to promote
renewable energy, especially marked by the REL that came into force in 2006.
4.1.2 Feed-in-tariff Scheme and Renewable Energy Development Fund
One of the most significant contributions of the 2006 REL is that the law
describes vaguely a cost-sharing mechanism for renewable energy power generation
that resembles a feed-in-tariff scheme. According to Chapter V of the 2006 REL,
on-grid electricity prices for renewable energy are determined by the relevant State
Council department based on different local conditions, in particular, the technology
levels of different geographic areas. In the case where the price of renewable power
19
exceeds the price of electricity generated from conventional energy sources due to
higher generation costs associated with renewables, the State Council demands that
the premium over the conventional electricity prices to be borne by electricity
end-users. Other costs associated with renewable energy power generation, such as
grid-connection cost and power transmission cost, can also be reasonably calculated
in the sales price of electricity and levied on consumers. This cost-sharing mechanism
is the prototype of the government-controlled FIT scheme that was later established in
2012.
Although the cost-sharing system might sound identical to a foreign FIT scheme,
the main distinction is the role of the Chinese government. According to the 2006
REL, a special-purpose fiscal budget is set aside for the promotion of renewable
energy development. The fiscal budget can be used in support of the research and
development, power system construction, and information technology system building
of renewable energy. By the 2009 amendment of the REL, a Renewable Energy
Development Fund (REDF) was established to incorporate the special-purpose fiscal
budget. The REDF, administered by the Ministry of Finance, later became the central
piece of China’s FIT scheme and retained significant oversight power over the
approval and allocation of the FIT subsidy.
The REDF is essentially a fund administered by the Ministry of Finance, that
collects renewable energy electricity surcharge from electricity consumers, and
allocates subsidies to renewable power plants eligible for FIT subsidy. When the
collection of RE surcharge is insufficient, the Ministry of Finance will withdraw
20
money from the afore-mentioned special-purpose fiscal budget to meet the high
demand for FIT subsidy. And when the RE surcharge is abundant, the MOF will
refund the fiscal budget using the RE surcharge. In reality, only in later years when
the REDF became significantly underfunded, the fiscal special-purpose budget was
drawn on to cover the deficit.
There are two types of subsidy under the FIT scheme: a per-unit subsidy and a
lump-sum subsidy, the calculation methods of which are slightly different (Measures
for the Administration of Renewable Energy Electricity Surcharge Subsidy Funds,
2020). For projects that receive a per-unit subsidy, the FIT price is determined based
on the price gap between generation cost and electricity grid-connection price. The
grid-connection price differs from region to region but is always equal to the
desulfurized coal power price within the region. This is because China has long
remained an economy powered mainly by coal, and the coal power price is set as the
benchmark electricity price. Although less popular, a lump-sum subsidy is sometimes
granted for projects eligible for the FIT scheme. In that case, the subsidy price is
independent of elements such as generation costs and provincial-specific coal power
prices. It is worth noting, however, that both types of subsidy are subjected to a
value-added tax.
(1) 𝑃𝑒𝑟 − 𝑢𝑛𝑖𝑡 𝑠𝑢𝑏𝑠𝑖𝑑𝑦 =𝑔𝑒𝑛𝑒𝑟𝑎𝑡𝑖𝑜𝑛 𝑐𝑜𝑠𝑡 − 𝑑𝑒𝑠𝑢𝑙𝑓𝑢𝑟𝑖𝑧𝑒𝑑 𝑐𝑜𝑎𝑙 𝑝𝑜𝑤𝑒𝑟 𝑝𝑟𝑖𝑐𝑒
1 + 𝑉𝐴𝑇
21
(2) 𝐿𝑢𝑚𝑝 − 𝑠𝑢𝑚 𝑠𝑢𝑏𝑠𝑖𝑑𝑦 =𝑙𝑢𝑚𝑝 − 𝑠𝑢𝑚 𝑠𝑢𝑏𝑠𝑖𝑑𝑦
1 + 𝑉𝐴𝑇
𝑊ℎ𝑒𝑟𝑒:
𝑉𝐴𝑇 = 𝑣𝑎𝑙𝑢𝑒 − 𝑎𝑑𝑑𝑒𝑑 𝑡𝑎𝑥 𝑟𝑎𝑡𝑒
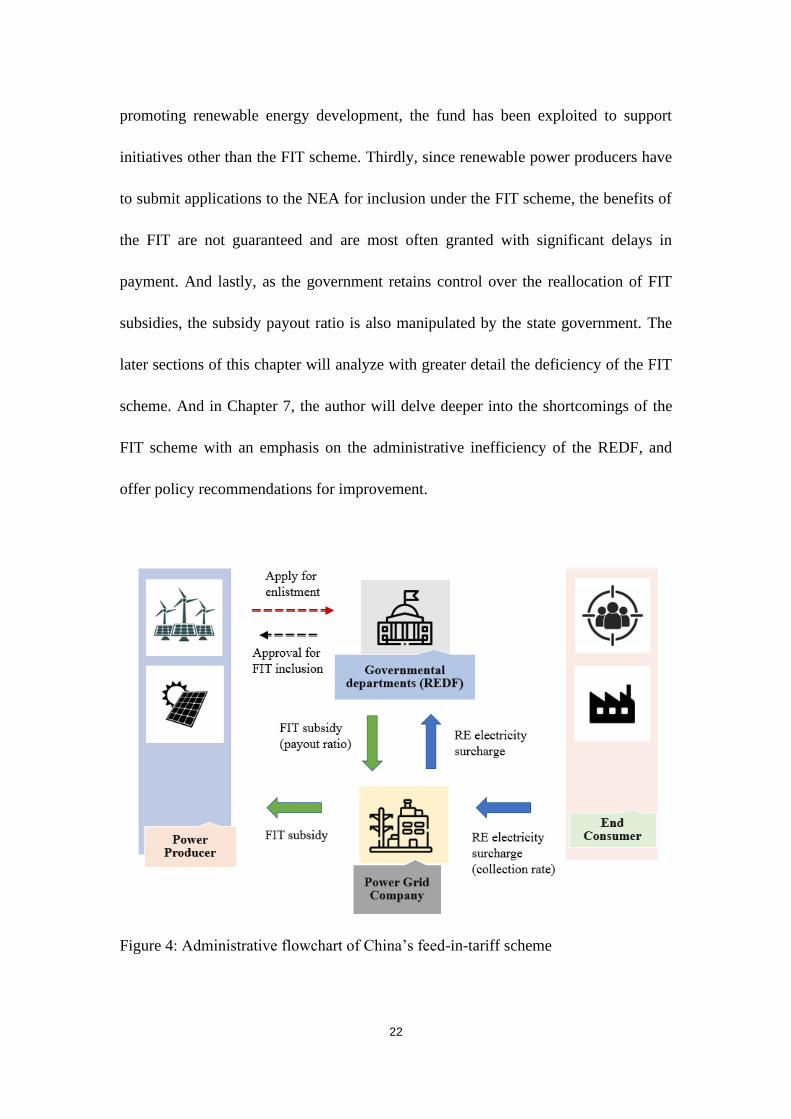
To sum up, the flowchart below illustrates the characteristics of the FIT scheme
in China. The key players are the electricity consumers, power grid companies,
renewable power producers, and on top of that, the REDF administered by relevant
governmental authorities. Just as how any FIT scheme functions in foreign countries,
the electricity consumers pay a per-unit renewable energy surcharge to the power grid
companies. However, what is unique to China’s FIT system is that the RE surcharge
is then passed on to the REDF, which falls under the supervision of the Ministry of
Finance. On the other side of the equation, renewable energy power producers that
wish to be included under the FIT scheme should submit applications to the National
Energy Administration, which verifies project-related information and grants approval
for FIT inclusion. To do so, the NEA manages a catalog system and periodically
publishes the name of newly eligible projects. The power grid companies, following
the directions from the government, subsequently dispatch FIT subsidies to renewable
power producers.
With government oversight, the FIT scheme in China operates with a significant
delay in payment and curtailment in subsidies. Firstly, the RE electricity surcharge
has experienced a relatively low collection rate that led to an enlarging funding deficit
in the REDF. Secondly, although the REDF was established with the sole purpose of
22
promoting renewable energy development, the fund has been exploited to support
initiatives other than the FIT scheme. Thirdly, since renewable power producers have
to submit applications to the NEA for inclusion under the FIT scheme, the benefits of
the FIT are not guaranteed and are most often granted with significant delays in
payment. And lastly, as the government retains control over the reallocation of FIT
subsidies, the subsidy payout ratio is also manipulated by the state government. The
later sections of this chapter will analyze with greater detail the deficiency of the FIT
scheme. And in Chapter 7, the author will delve deeper into the shortcomings of the
FIT scheme with an emphasis on the administrative inefficiency of the REDF, and
offer policy recommendations for improvement.
Figure 4: Administrative flowchart of China’s feed-in-tariff scheme

23
4.1.3 Feed-in Tariff Scheme for Solar Project
The subsidy scheme for solar projects has experienced three phases before a
fully-fledged FIT scheme was introduced. In the first phase, the Chinese government
stipulated a pro-rata subsidy for solar power generation projects. Qualified projects
can receive a lump-sum subsidy equal to 50% of the total initial investment, while
those located in remote areas can receive a subsidy of up to 70% of the total
investment outlay (Notice on the Implementation of the Golden Sun Demonstration
Project (Translated), 2009). According to Fan et al. (2021), the subsidy was in effect
usually granted ex-ante, before the actual grid-connection of the project. This resulted
in a potential loophole where project owners swindle the subsidy but refuse to achieve
the final completion of the project. In turn, loose oversight over subsidy allocation
also promoted the fast growth of photovoltaic power generation. It is estimated that
over 9,000 solar projects were listed under the Golden Sun Demonstration Project
plan within three years since its implementation (Fan et al., 2021).
The first reform for solar power generation subsidy took place in 2013 when the
National Development and Reform Commission (NDRC) announced its plan to
prescribe benchmark electricity prices for solar PV power generation. The policy
marks the inception of China’s feed-in-tariff scheme for solar projects, and more
importantly, it set up a differentiated pricing system under the FIT scheme based on
the location of the project. For centralized solar power plants, the NDRC divided all
China into three regions by the abundance of solar energy and the level of
construction cost. Region I includes most northern and northwestern China, where
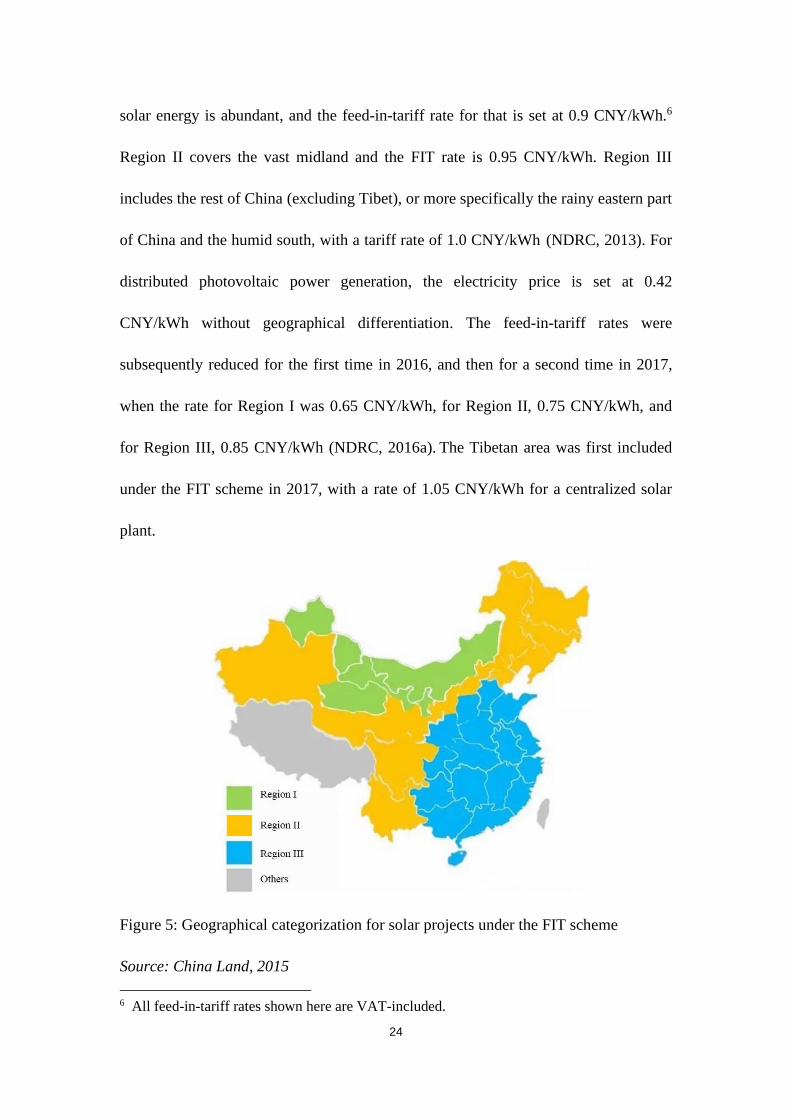
24
solar energy is abundant, and the feed-in-tariff rate for that is set at 0.9 CNY/kWh.6
Region II covers the vast midland and the FIT rate is 0.95 CNY/kWh. Region III
includes the rest of China (excluding Tibet), or more specifically the rainy eastern part
of China and the humid south, with a tariff rate of 1.0 CNY/kWh (NDRC, 2013). For
distributed photovoltaic power generation, the electricity price is set at 0.42
CNY/kWh without geographical differentiation. The feed-in-tariff rates were
subsequently reduced for the first time in 2016, and then for a second time in 2017,
when the rate for Region I was 0.65 CNY/kWh, for Region II, 0.75 CNY/kWh, and
for Region III, 0.85 CNY/kWh (NDRC, 2016a). The Tibetan area was first included
under the FIT scheme in 2017, with a rate of 1.05 CNY/kWh for a centralized solar
plant.
Figure 5: Geographical categorization for solar projects under the FIT scheme
Source: China Land, 2015
6 All feed-in-tariff rates shown here are VAT-included.
25
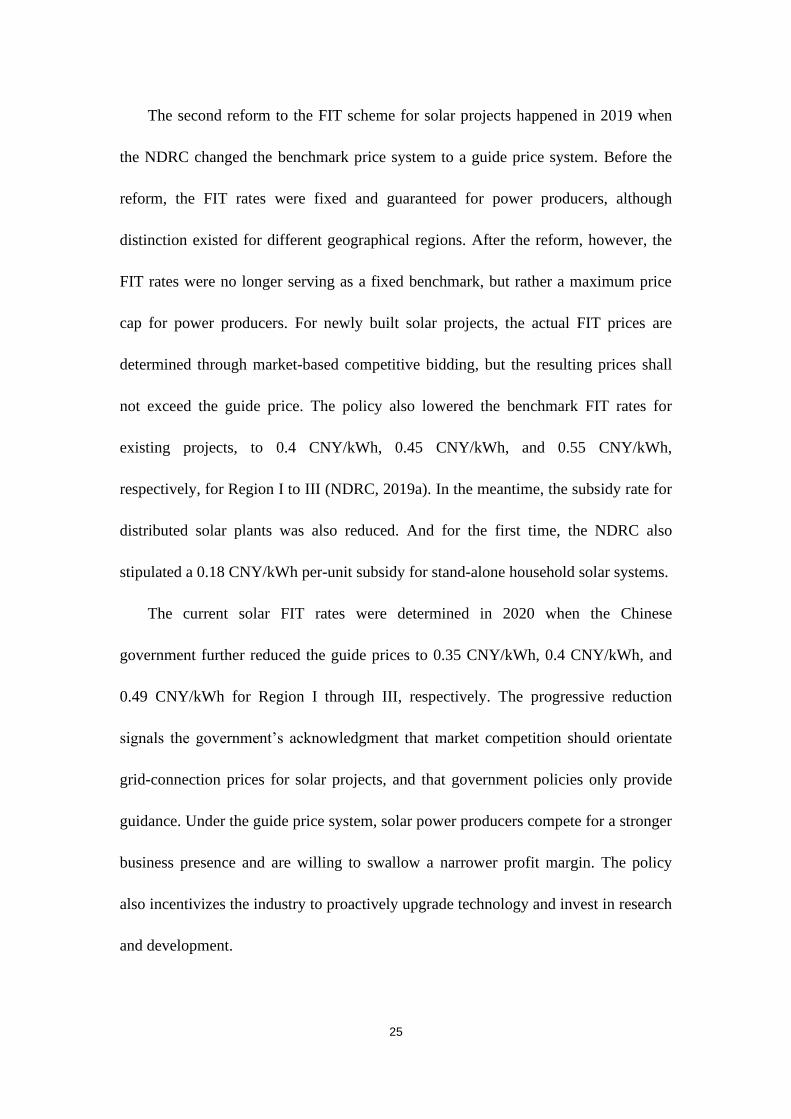
The second reform to the FIT scheme for solar projects happened in 2019 when
the NDRC changed the benchmark price system to a guide price system. Before the
reform, the FIT rates were fixed and guaranteed for power producers, although
distinction existed for different geographical regions. After the reform, however, the
FIT rates were no longer serving as a fixed benchmark, but rather a maximum price
cap for power producers. For newly built solar projects, the actual FIT prices are
determined through market-based competitive bidding, but the resulting prices shall
not exceed the guide price. The policy also lowered the benchmark FIT rates for
existing projects, to 0.4 CNY/kWh, 0.45 CNY/kWh, and 0.55 CNY/kWh,
respectively, for Region I to III (NDRC, 2019a). In the meantime, the subsidy rate for
distributed solar plants was also reduced. And for the first time, the NDRC also
stipulated a 0.18 CNY/kWh per-unit subsidy for stand-alone household solar systems.
The current solar FIT rates were determined in 2020 when the Chinese
government further reduced the guide prices to 0.35 CNY/kWh, 0.4 CNY/kWh, and
0.49 CNY/kWh for Region I through III, respectively. The progressive reduction
signals the government’s acknowledgment that market competition should orientate
grid-connection prices for solar projects, and that government policies only provide
guidance. Under the guide price system, solar power producers compete for a stronger
business presence and are willing to swallow a narrower profit margin. The policy
also incentivizes the industry to proactively upgrade technology and invest in research
and development.
26
Table 1: Summary of FIT rates for solar projects in China
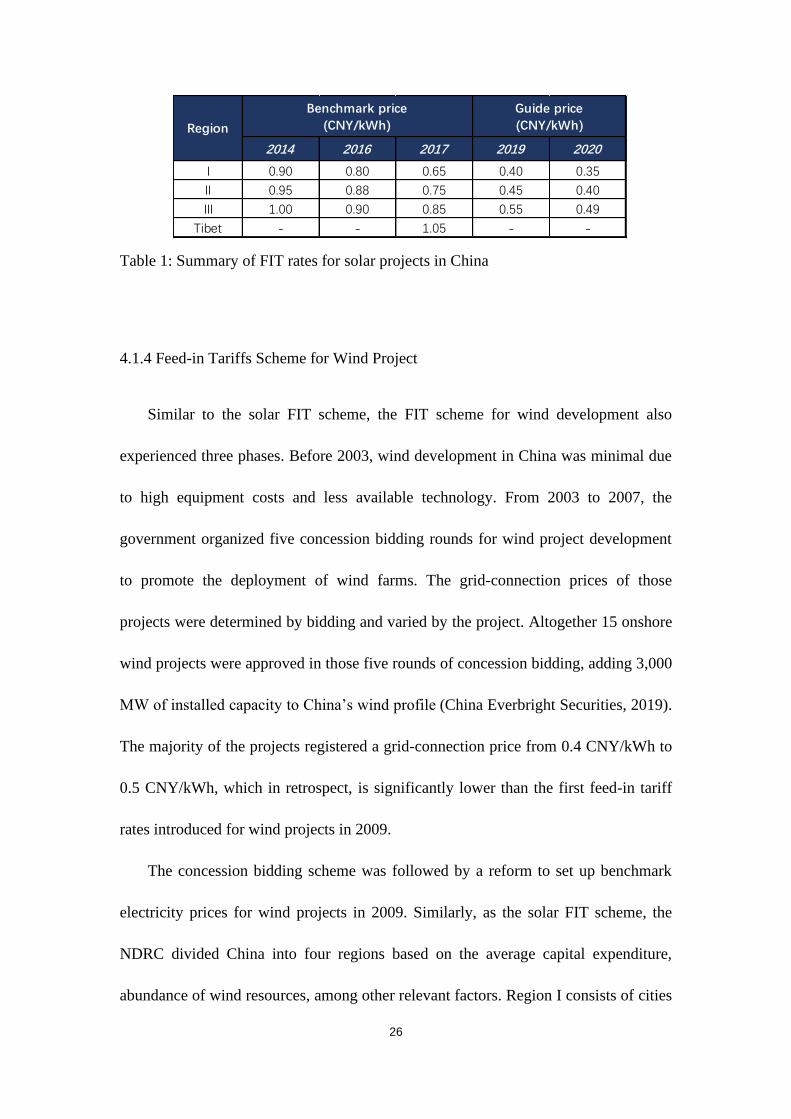
4.1.4 Feed-in Tariffs Scheme for Wind Project
Similar to the solar FIT scheme, the FIT scheme for wind development also
experienced three phases. Before 2003, wind development in China was minimal due
to high equipment costs and less available technology. From 2003 to 2007, the
government organized five concession bidding rounds for wind project development
to promote the deployment of wind farms. The grid-connection prices of those
projects were determined by bidding and varied by the project. Altogether 15 onshore
wind projects were approved in those five rounds of concession bidding, adding 3,000
MW of installed capacity to China’s wind profile (China Everbright Securities, 2019).
The majority of the projects registered a grid-connection price from 0.4 CNY/kWh to
0.5 CNY/kWh, which in retrospect, is significantly lower than the first feed-in tariff
rates introduced for wind projects in 2009.
The concession bidding scheme was followed by a reform to set up benchmark
electricity prices for wind projects in 2009. Similarly, as the solar FIT scheme, the
NDRC divided China into four regions based on the average capital expenditure,
abundance of wind resources, among other relevant factors. Region I consists of cities
2014 2016 2017 2019 2020
I 0.90 0.80 0.65 0.40 0.35
II 0.95 0.88 0.75 0.45 0.40
III 1.00 0.90 0.85 0.55 0.49
Tibet - - 1.05 - -
Benchmark price
(CNY/kWh)Region
Guide price
(CNY/kWh)
27
of Xinjiang and Inner Mongolia, with a FIT price set at 0.51 CNY/kWh. Region II
and III cover the vast northern and northwestern China, with FIT prices of 0.54
CNY/kWh and 0.58 CNY/kWh. The rest part of China is included in region IV with
the highest FIT rate at 0.61 CNY/kWh. The FIT prices for wind projects set in 2009
were also progressively reduced several times. In 2019, the government introduced
the guide price mechanism for wind projects. Under such a mechanism, the officially
announced FIT rates will only act as s maximum cap for newly added wind projects,
while the actual FIT price is determined by competitive bidding (China Everbright
Securities, 2019).
Table 2: Summary of FIT rates for wind projects in China
2009 2015 2016 2018 2019 2020
I 0.51 0.49 0.47 0.40 0.34 0.29
II 0.54 0.52 0.50 0.45 0.39 0.34
III 0.58 0.56 0.54 0.49 0.43 0.38
IV 0.61 0.61 0.60 0.57 0.52 0.47
Guide price
(CNY/kWh)
Benchmark price
(CNY/kWh)Region

28
Figure 6: Geographical categorization for wind project under the FIT scheme
Source: Wu, 2009
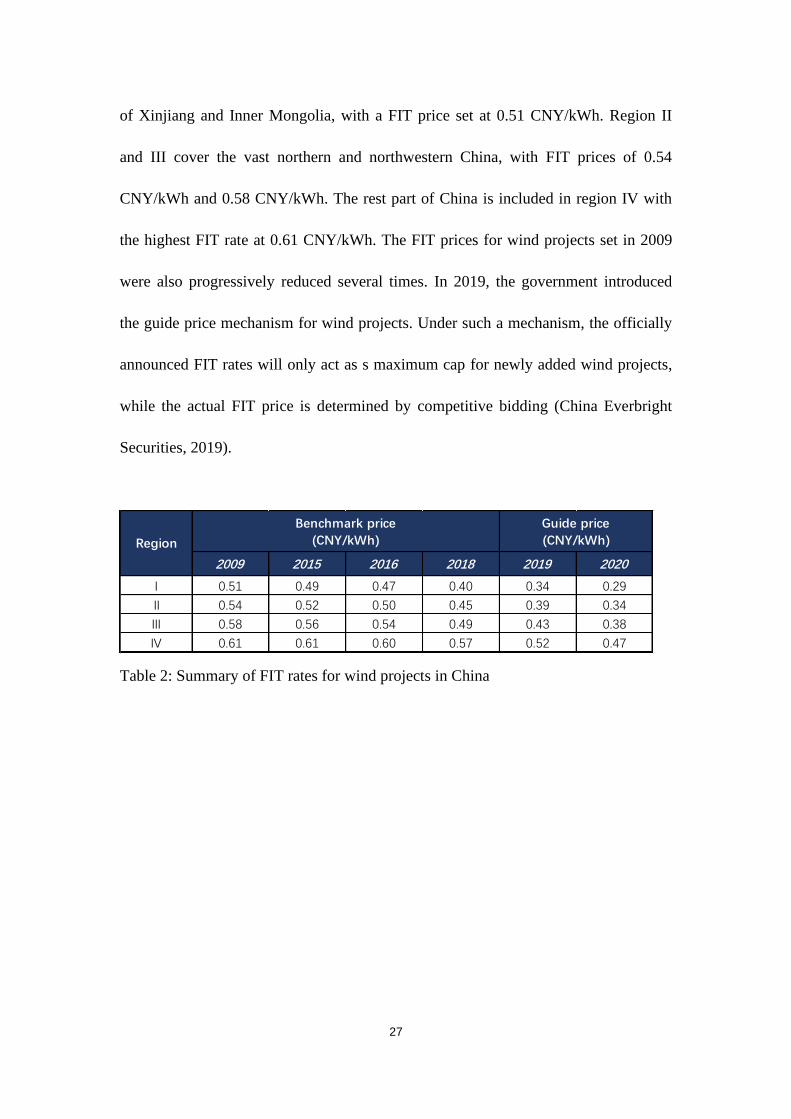
4.1.5 Renewable Energy Electricity Surcharge
The RE electricity surcharge is levied on electricity consumers in the form of a
surcharge over the usual electricity tariffs. The surcharge is collected by power grid
companies and then passed on to the REDF before reallocation to eligible renewable
energy power plants under the FIT scheme. A simplified version of the calculation
formula of the RE surcharge is demonstrated in a government announcement (NDRC,
2006):
29
𝑅𝐸 𝑠𝑢𝑟𝑐ℎ𝑎𝑟𝑔𝑒
= (𝑅𝐸 𝑔𝑒𝑛𝑒𝑟𝑎𝑡𝑖𝑜𝑛 𝑐𝑜𝑠𝑡 − 𝑑𝑒𝑠𝑢𝑙𝑓𝑢𝑟𝑖𝑧𝑒𝑑 𝑐𝑜𝑎𝑙 𝑝𝑜𝑤𝑒𝑟 𝑝𝑟𝑖𝑐𝑒)
∗ 𝑅𝐸 𝑔𝑒𝑛𝑒𝑟𝑎𝑡𝑖𝑜𝑛 𝑣𝑜𝑙𝑢𝑚𝑒
+ 𝑒𝑥𝑐𝑒𝑠𝑠 𝑜𝑓 O&M costs for public RE stand alone power systems
+ 𝑜𝑡ℎ𝑒𝑟 𝑟𝑒𝑎𝑠𝑜𝑛𝑎𝑏𝑙𝑒 𝑐𝑜𝑠𝑡𝑠
𝑊ℎ𝑒𝑟𝑒:
(1) 𝐸𝑥𝑐𝑒𝑠𝑠 𝑜𝑓 𝑂&𝑀 𝑐𝑜𝑠𝑡𝑠 𝑓𝑜𝑟 𝑝𝑢𝑏𝑙𝑖𝑐 𝑅𝐸 𝑠𝑡𝑎𝑛𝑑𝑎𝑙𝑜𝑛𝑒 𝑝𝑜𝑤𝑒𝑟 𝑠𝑦𝑠𝑡𝑒𝑚𝑠
= O&M costs for public renewable energy stand alone electric power system
− average sales price for local provincial level grid connected power ∗ (1 + VAT)
(2) 𝑂𝑡ℎ𝑒𝑟 𝑟𝑒𝑎𝑠𝑜𝑛𝑎𝑏𝑙𝑒 𝑐𝑜𝑠𝑡𝑠
= Renewable energy power generation project grid access expenses
+ other reasonable costs
To conclude, the RE electricity surcharge covers three types of RE costs above
prices for conventional energy sources. According to a translation of the document
issued by NDRC (2007), the first type is the amount to which grid-connected power
prices for renewable energy exceeds the local power price benchmark for desulfurized
coal grid-connected electricity; the second portion covers the amount to which
operation and maintenance costs for public renewable energy stand-alone power
systems are higher than the average sales price for local provincial-level

30
grid-connected power; the last portion, or other reasonable costs, includes grid-access
expenses for renewable energy power generation projects and other relevant expenses.
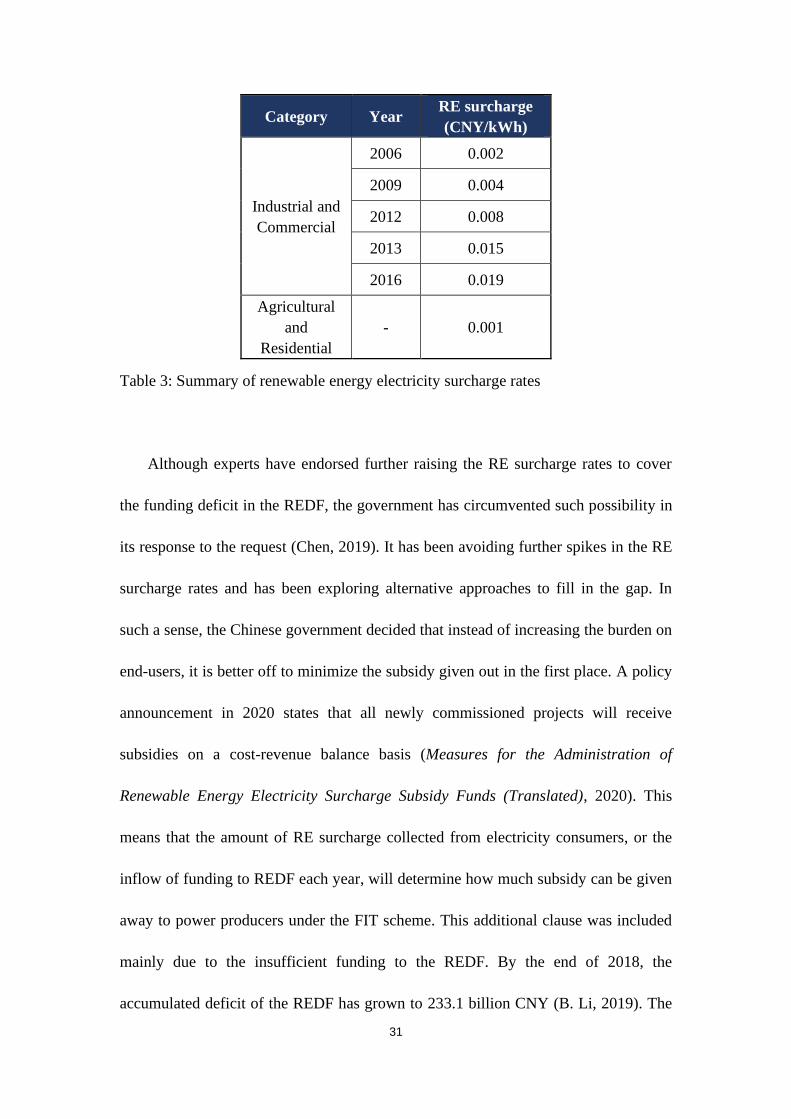
The RE surcharge is levied on end-consumers that can be divided into two types.
The first type includes industrial and commercial users of electricity, and the other
includes agricultural and residential users of electricity. The RE surcharge rate levied
on the second type of consumer – agricultural and residential users – has remained at
the level of 0.001 CNY/kWh since the inception of the policy. The RE surcharge rate
on industrial and commercial consumers, however, has been adjusted upwards many
times to cover the growing funding deficit of the REDF. When first introduced in
2006, the surcharge rate for industrial and commercial consumers was set at 0.002
CNY/kWh, which was then increased to 0.004 CNY/kWh in 2009 (Zhao & Lin, 2016).
During the years, the cost of renewable energy power generation has been declining.
As a result, the industry opened up huge opportunities for investment and the number
of newly added renewable power plants soared. As more power plants had been
constructed, the demand for FIT subsidies also significantly increased. The REDF has
been running a growing deficit, and in response, the government hiked the surcharge
rate for industrial and commercial consumers of electricity to 0.008 CNY/kWh in
2012, and again to 0.015 CNY/kWh in 2013. In 2016, the RE surcharge rate for
industrial and commercial users has hiked again, in all regions except for Xinjiang
and Tibet, to 0.019 CNY/kWh (Han, 2020). The surcharge rate has remained at the
2016 level till today, despite the cry-out of the renewable industry for the government
to further hike the rate due to the expanding deficit in REDF.
31
Category Year RE surcharge
(CNY/kWh)
Industrial and
Commercial
2006 0.002
2009 0.004
2012 0.008
2013 0.015
2016 0.019
Agricultural
and
Residential
- 0.001
Table 3: Summary of renewable energy electricity surcharge rates
Although experts have endorsed further raising the RE surcharge rates to cover
the funding deficit in the REDF, the government has circumvented such possibility in
its response to the request (Chen, 2019). It has been avoiding further spikes in the RE
surcharge rates and has been exploring alternative approaches to fill in the gap. In
such a sense, the Chinese government decided that instead of increasing the burden on
end-users, it is better off to minimize the subsidy given out in the first place. A policy
announcement in 2020 states that all newly commissioned projects will receive
subsidies on a cost-revenue balance basis (Measures for the Administration of
Renewable Energy Electricity Surcharge Subsidy Funds (Translated), 2020). This
means that the amount of RE surcharge collected from electricity consumers, or the
inflow of funding to REDF each year, will determine how much subsidy can be given
away to power producers under the FIT scheme. This additional clause was included
mainly due to the insufficient funding to the REDF. By the end of 2018, the
accumulated deficit of the REDF has grown to 233.1 billion CNY (B. Li, 2019). The

32
widening gap in funding is due to many reasons. Partly this is because more
renewable power plants have been deployed as a result of government support. But on
the other side of the coin, the lack of oversight and regulation over the collection of
RE surcharge is also a major reason behind the REDF being significantly
underfunded.
4.1.6 Green Power Certificate
China introduced the GPC system in February 2017, more than two years before
the enforcement of the RPS policy in May 2019. The three major government bodies
in charge of the FIT scheme – NDRC, NEA, and the MOF – conjointly published a
notice on the issuance and purchase mechanism of the Green Power Certificate,
announcing the first alternative subsidy scheme to the FIT scheme in China. As the
REC in the United States, the GPC in China is an electronic certificate issued by the
central government for every 1 MWh of renewable electricity (excluding electricity
generated by hydropower) produced by power generation companies (International
Institute of Green Finance, CUFE, 2019). However, the GPC in China differs from its
foreign counterpart in that it was originally introduced with an aim to substitute the
FIT scheme, and therefore is only loosely linked to the RPS policy.
Since the GPC system was only recently implemented in China, first as a trial run,
the trading has thus far remained inactive. The trading system is a two-way and
voluntary process. The producer can choose whether to apply for a GPC, and on the

33
other side, the consumer can voluntarily choose to purchase from a pool of products
differentiated by the project site, certified date, price, and etc. On the supply side,
power generation companies that choose to apply for a GPC need to log onto an
online platform managed by the NEA7, register the construction and commission
information of the project, and provide electricity bills or transaction account to prove
that 1MWh of electricity has been sold to a regional power-grid company. The NEA
will then go on to verify the information and issue the GPC to eligible power
generation companies. The certified GPC will be traded on a separate trading platform
where relevant information associated with the project is disclosed along with the
price.8 Each GPC has an individual registry, which will be canceled once sold, and
reselling is not allowed. On the demand side, any public institutions, enterprises, and
natural persons can purchase the GPC traded on the platform, and choose among
differentiated GPC projects at a price determined through seller-buyer negotiation.
In economic terms, the GPC is a tradable commodity but it does not directly
affect the generation of renewable electricity. Once the power producer has fed the
energy into the grid, electricity from renewables and conventional sources is confluent
and cannot be separated. On that account, the GPC does not directly inject more
electricity from renewables into the power grid. In fact, from the power producer’s
perspective, the GPC does not carry more economic value than the FIT subsidy, in
view of the fact that the price of GPC cannot exceed the FIT guide price, and that
7 Renewable energy information management platform (Translated). Accessible at:
http://djfj.renewable.org.cn/default/coframe/auth/login/login.jsp
8 The GPC trading platform is accessible at: http://www.greenenergy.org.cn/

34
once the GPC is sold, the corresponding amount of electricity generation is no longer
eligible for FIT subsidy.
4.1.7 Renewable Portfolio Standards
The Renewable Portfolio Standards policy in China still lags behind its foreign
counterparts in design, enforcement, and administration. The 2006 REL provided a
legal context for the RPS policy in stipulating that the State Council will release
national targets for renewable energy and design policy guidelines for the local
governments. In 2010, the government briefly mentioned its plan to progressively roll
out the RPS policy in an announcement to promote the development of strategic and
emerging industries (State Council, 2010). However, the narrative was buried among
other grandiose topics and no concrete measures were proposed in the document.
Almost a decade later, the NEA published a draft version of the RPS policy in March
2018, calling for public opinions and suggestions (NEA, 2018). In May 2019, the
NEA issued the final policy decision in a document titled “Notice on the
Establishment of the Consumption Guarantee Mechanism on Renewable Energy
Electricity (translated)”; the policy became known as China’s Renewable Portfolio
Standards. This policy prescribes province-specific goals for renewable power
consumption during 2018 and 2020. Each province is assigned with two targets: a
mandatory and enforceable minimum quota and a non-binding target that the
provincial government is encouraged to achieve. It is worth noting that the state
35
government has two measurements for renewable power consumption: one stipulates
the power consumption target for all renewable energies including hydropower, and
another stipulates power consumption only from wind and solar energy. Since this
paper is focused on power generation from wind and solar, the targets described
below are also consistent with the second measurement that excludes hydropower.
Among the administrative regions, Qinghai province, where both solar and wind
resources are abundant, is mandated the highest mandatory quotas at 19% in 2018 and
25% in 2020. The lowest minimum quotas, on the other hand, are set for Shanghai
municipality at 2.5% in 2018 and 3% in 2020 (NDRC, 2019c). Since the policy was
published in May 2019, the targets for 2018 were only retrospective, and the targets
for 2019 were also non-binding. In fact, this policy was implemented as a practice test
in 2019, giving ample time for provincial governments and regional power grid
companies to adjust their renewable power portfolio. According to the policy, the
quota targets will be binding and the RPS system will start to possess punitive power
from the beginning of 2020.
In May 2020, the NEA and the NDRC revisited the targets set in 2019 and
published another policy with revised quotas for 2020 (NDRC, 2020). The minimum
consumption quota for Shanghai municipality, for example, was raised to 4% in the
May 2020 policy from 3% as stipulated in the May 2019 policy. The minimum quota
for Hebei Province, conversely, was revised downwards from 15% to 12.5%. For
Shandong Province, the non-binding target of 11% stipulated in the 2019 document
36
was set as the minimum quota in the 2020 document, while the non-binding target
was raised to 12.1%.
Although the RPS guidelines were stipulated by the state government in 2019, the
enforcement at the provincial level progressed slowly. After the release of the guiding
policy, multiple provincial governments successively announced the locally adapted
version of the RPS system. Shandong Province was quick to respond and drafted a
local interpretation of the guiding policy by the end of 2019 in accordance with the
first state announcement, in which the minimum provincial target was set at 11%.
Shanghai municipality, on the other hand, implemented the RPS system in February
2021 and claims compliance with the revised quota of 4% (Shanghai Development
and Reform Commission, 2021). Guangdong Province also made a public
announcement in March 2021, setting provincial guidelines effective on April 1, 2021,
and valid for 3 years (Guangdong Provincial Development and Reform Commission,
2021).
According to the state policy guidelines, the responsible parties for renewable
power consumption are two types of entities (NDRC, 2019c). The first type is power
grid companies at provincial and local levels. The second type is large electricity
consumers that directly purchase electricity in the wholesale market or electricity
prosumers that equip power plants for self-production. Both parties are responsible for
the provincially designated renewable power quota, but electricity for agricultural and
heating uses is exempted from compliance with the RPS.

37
As the RPS policy was implemented after the GPC system, the two schemes are
largely misaligned. The main approach for compliance with the RPS policy is
increasing the purchase or consumption of electricity generated from renewable
sources. Electricity consumers with compliance obligations can choose to consume or
self-produce more electricity from renewable sources. In the meantime, electricity
suppliers can fulfill compliance responsibility by inter-provincial trade of electricity,
purchase of ownership for distributed renewable energy plants, and etc. (Shanghai
Development and Reform Commission, 2021). The complementary approaches may
vary among provinces but fall within the following two categories. The first one is
through the trading of GPC, which certifies that 1MWh of electricity is generated
from renewable energy. The second approach is by trading excess units of electricity
consumed or generated above the provincial mandatory quotas.
The trading system of excess RE generation differs from the GPC system in that
the former has multiple markets at the municipality, provincial, and regional levels,
and that the amount of RE traded in the market must be in excess of the entity’s
compliance obligation. Beijing municipality was the first to introduce an excess RE
generation trading market. In January 2021, Beijing Power Exchange Center
published a manual, in which the Center describes the excess RE generation trading
system as the principal platform for RPS administration and compliance assessment.
China Southern Power Grid also announced in April 2021 that 5 provinces under its
jurisdiction will trade in a common market for excess RE generation (H. Wang & Lan,
2021). In the announcement, China Southern Power Grid also claims that 2,716
38
certificates of unit excess RE generation have been verified and registered. The excess
RE generation trading system as well as the RPS scheme itself is still incubating and
evolving, and the implementation progress so far varies among provinces; therefore, it
is difficult to presume the future role of the excess RE generation trading system.
4.1.8 Monitoring and Evaluation System of Wind and Solar Investment
In January 2019, before the RPS policy was implemented nationwide, the NDRC
issued a notice on promoting the grid parity of solar and wind power generation
(NDRC, 2019b). The notice stipulates that to satisfy the RPS goals for each province,
solar plants and wind farms that can achieve grid parity or grid connection at low
generation cost will be prioritized over other similar power generation projects. The
government encourages renewable energy power producers to compete with each
other to eventually achieve technological breakthroughs and reach grid parity. In fact,
the notice also emphasizes the importance of a monitoring and evaluation system that
assigns ratings to provinces on the capacity of new solar and wind projects. A red
zone is a region with substantial renewable energy production and will not be allowed
to build new solar and wind projects unless the project does not require subsidy or is
categorized as an anti-poverty or demonstration project. In addition, an orange zone
will be encouraged to progress towards grid parity with some limitations on new
installations, and a green zone where renewable energy power production is still in
high demand should strive to meet the minimum RPS goals for renewable energy
39
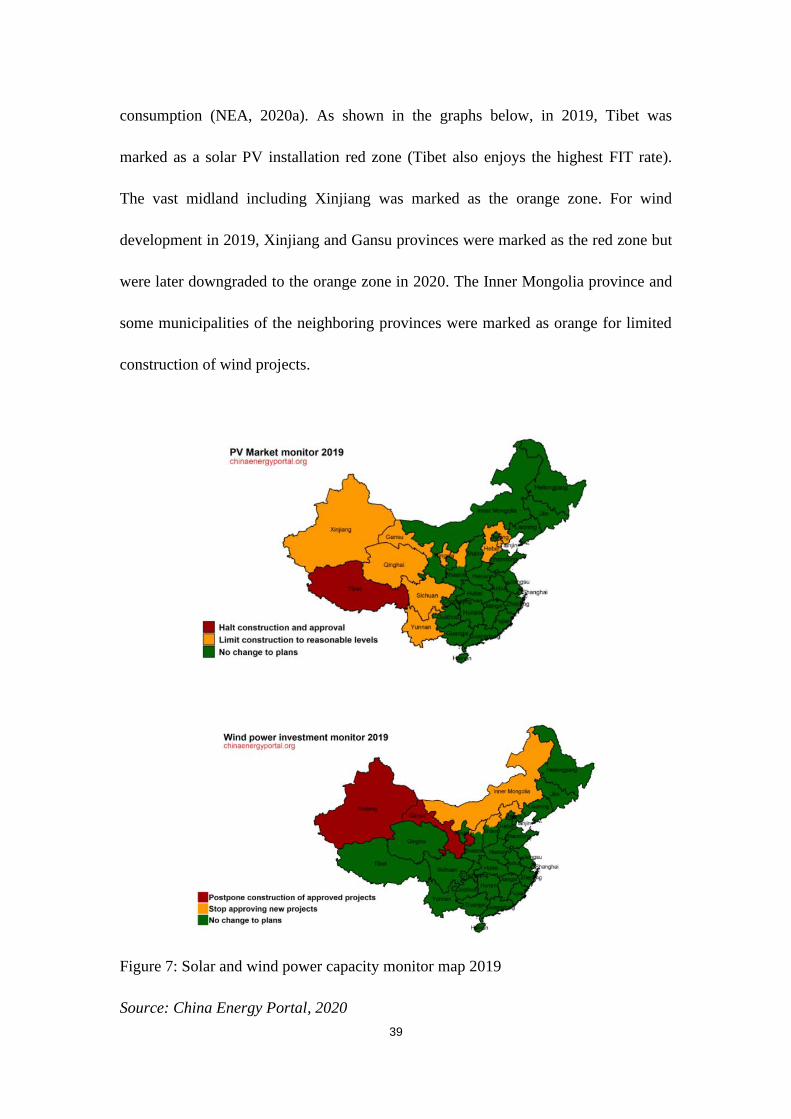
consumption (NEA, 2020a). As shown in the graphs below, in 2019, Tibet was
marked as a solar PV installation red zone (Tibet also enjoys the highest FIT rate).
The vast midland including Xinjiang was marked as the orange zone. For wind
development in 2019, Xinjiang and Gansu provinces were marked as the red zone but
were later downgraded to the orange zone in 2020. The Inner Mongolia province and
some municipalities of the neighboring provinces were marked as orange for limited
construction of wind projects.
Figure 7: Solar and wind power capacity monitor map 2019
Source: China Energy Portal, 2020

40
4.2 Existing issues with China’s current subsidy schemes
4.2.1 Funding deficit of the REDF
The REDF, the major source of funding for renewable energy subsidies under the
FIT scheme, has been running a large deficit. According to the Ministry of Finance
(2020e), there are three main reasons behind the REDF being underfunded. Firstly,
the RE electricity surcharge has not been adjusted after 2016 to reflect the growing
deficit of the REDF. Secondly, the Ministry of Finance states that in many cases, the
RE surcharge that is payable to the REDF was not collected on time or even left
uncollected, especially from self-prosuming power companies and local power grid
companies. According to Junfeng Li, the Director of National Center for Climate
Change Strategy and International Cooperation (NCSC), who also participated in the
drafting of the 2006 Renewable Energy Law, 35% to 40% of the RE surcharge was
left uncollected due to the lack of supervision and enforcement (Zheng, 2019). Li says
this is because the relevant department of the government failed to effectively collect
surcharges from household electricity usage, and estimates this gap to be a staggering
19 billion CNY. On the other hand, the self-produced electricity by power suppliers
was also left well-hidden and largely unregulated. Li states that the total uncollected
surcharge from household and self-produced electricity usage amounts to 40 billion
CNY, almost one-third of the accumulated deficit of the REDF by the time.
According to an industry research report issued by a Chinese securities company,
from 2012 to 2018, only around 60% of the collectible RE surcharge was actually

41
paid to the REDF. The numbers varied across the years, with 2012 registering the
lowest collection rate at 56.74% and 2017 recording a higher collection rate at 69.17%
(China Everbright Securities, 2019).
Table 4: RE surcharge payable to and collected for the REDF
Source: China Everbright Securities, 2019
And thirdly, in some regions, the renewable energy installed capacity has
exceeded the level determined by the national plan due to the lack of scale control.
Recalling the monitoring and evaluation system implemented by the central
government of China, Xinjiang and Gansu province were marked as investment red
zone for wind development in 2019, falling under the category of excessive growth in
renewable energy power plant installation. Likewise, Tibet was marked red for solar
development in 2019, along with the other provinces in central China being marked
orange for a halt in new installation of solar plants.
Industrial and
commercialResidential
Industrial and
commercialResidential
2012 0.008 0.001 42,426.32 6,227.70 345.64 196.11 56.74%
2013 0.010 0.001 45,452.32 6,776.15 449.94 297.98 66.23%
2014 0.015 0.001 47,288.23 6,929.46 716.25 491.38 68.60%
2015 0.015 0.001 47,203.35 7,276.10 715.33 444.87 62.19%
2016 0.019 0.001 50,069.45 8,054.04 959.37 557.84 58.15%
2017 0.019 0.001 53,226.66 8,694.77 1,020.00 705.50 69.17%
2018 0.019 0.001 58,036.00 9,685.00 1,112.37 691.10 62.13%
5,318.90 3,384.78 Total
Collectible
surcharge
Collected
surcharge
Collection
rateYear
Surcharge rate
(CNY/kWh)
Electricity consumption
(100 million kWh)
42
With the REDF running a significant budget deficit, only a selected pool of newly
installed renewable power plants can be enlisted under the FIT subsidy scheme. The
verification process usually takes many months or even years. And even though
approval to enlistment is granted, most of the projects receive only a slice of the
promised subsidy and even that small portion is usually given out in delays.
Acknowledging the delay in subsidy allocation, the Ministry of Finance issued a
notice to provide guidance for the prioritization of certain projects (Ministry of
Finance, 2020a). According to the notice, the FIT subsidy allocation should prioritize
and given in full to distributed solar PV projects under 50kW of installed capacity,
and then to solar PV projects whose grid-connection prices are determined through
competitive bidding. Projects newly enlisted under the FIT scheme will also be
prioritized before those enlisted before. The next in line are PV “leader” projects
announced by the state; for such projects, the state will guarantee the allocation of 50%
of the FIT subsidy payable. For all other projects, the FIT subsidy will be allocated by
an equal proportion but with no guarantee of the amount. It is estimated by industry
experts that renewable power projects that are enlisted only receive 25 to 30% of the
subsidy payable and that a 100% subsidy payment ratio will only be reached until
around 2040 (CPNN, 2020).

43
4.2.2 Waste-to-energy eligibility under the FIT subsidy scheme
There are three subcategories of renewable power projects that have been
included in the FIT subsidy list: wind, solar, and biomass. While the bulk of subsidy
funding flows to wind and solar projects, biomass still receives roughly 5% of the
total subsidy, and most projects that were approved under the biomass category are in
reality waste-to-energy incineration projects. Traditional sources of biomass energy,
according to the definition by the U.S. Energy Information Administration, include
wood processing waste, agricultural crops, animal manure and human sewage, and
biogenic materials in municipal solid waste (MSW) (U.S. Energy Information
Administration, 2021). Most power plants included under the FIT subsidy list are
waste incineration projects that generate electricity from MSW, or better known as
garbage. In some developed countries, where an advanced waste recycling system has
been operating for decades, the garbage is usually well-sorted for MSW electricity
generation to properly achieve its goal of environmental protection. For China,
however, a country where a nationwide municipal waste recycling campaign started
only in 2019, the composition of MSW is far less optimal for electricity generation.
MSW incineration has been proven to be a more environmentally friendly waste
management process than landfills. It is, however, not anywhere close to being
considered a renewable energy source for power generation. According to the analysis
of L. Wang & Li (2017) on the greenhouse gas emissions of a waste incineration
project in Beijing, the net CO2 emissions per unit of waste is 0.165 t, and the
electricity generated per unit of waste is 298.27 kWh. We can do a simple calculation
44
here to derive the CO2 emissions per kWh of electricity generated from a sample
waste incineration project and arrive at 553.19 g/kWh. This is lower than the
predicted CO2 emissions from coal-fired power plants at 796.7 g/kWh but is almost
20 times higher than the average per unit electricity CO2 emissions of solar PV
projects, which is predicted at 33-50 g/kWh (Y. Li, n.d.).
If waste-to-energy incineration plants are emitting far more greenhouse gases
than clean energy sources, the current approach to subsidize MSW power generation
projects under the REDF should be reevaluated for maximum efficiency in resource
allocation. According to Luan (2021), by 2021, a cumulative capacity totaling 28 GW
of biomass power generation projects have been approved to receive FIT subsidy
under the REDF, amounting to a cumulative 99 billion CNY under the subsidy
scheme. In reality, the Chinese government has also realized this issue and announced
to enforce stricter supervision on emission standards of MSW plants. We can expect
the country to cut subsidies for waste-to-energy incineration projects and redirect the
resources to wind and solar projects in the future.
4.2.3 Delay in the approval process for FIT enlistment
The red tape in the FIT approval process caused significant delays in subsidy
payment to eligible projects. Before 2020, the Chinese central government managed
the FIT subsidy list using a catalog system. For inclusion under the FIT scheme,
power producers submit an application to the NEA, which verifies the project’s status
45
and grants approval. All approved projects within a certain time will be compiled into
a catalog and will be publicly notified. It is after the notification when the project will
finally start to receive FIT subsidies, or at least, become eligible for FIT subsidies.
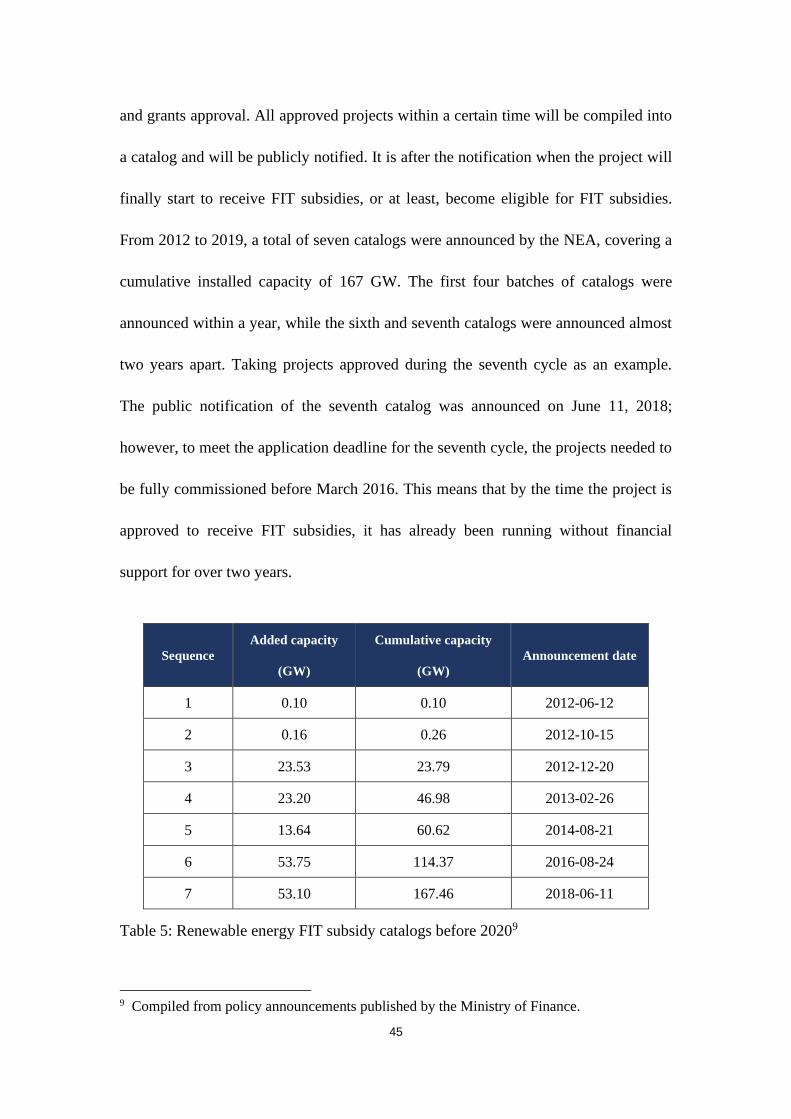
From 2012 to 2019, a total of seven catalogs were announced by the NEA, covering a
cumulative installed capacity of 167 GW. The first four batches of catalogs were
announced within a year, while the sixth and seventh catalogs were announced almost
two years apart. Taking projects approved during the seventh cycle as an example.
The public notification of the seventh catalog was announced on June 11, 2018;
however, to meet the application deadline for the seventh cycle, the projects needed to
be fully commissioned before March 2016. This means that by the time the project is
approved to receive FIT subsidies, it has already been running without financial
support for over two years.
Sequence
Added capacity
(GW)
Cumulative capacity
(GW)
Announcement date
1 0.10 0.10 2012-06-12
2 0.16 0.26 2012-10-15
3 23.53 23.79 2012-12-20
4 23.20 46.98 2013-02-26
5 13.64 60.62 2014-08-21
6 53.75 114.37 2016-08-24
7 53.10 167.46 2018-06-11
Table 5: Renewable energy FIT subsidy catalogs before 20209
9 Compiled from policy announcements published by the Ministry of Finance.
46
Acknowledging the delay in the approval process, the Chinese government
underwent a reform in 2020 to streamline the administration of the FIT scheme. The
catalogs previously controlled by the NEA are replaced by lists of renewable energy
projects managed by the provincial grid companies (Ministry of Finance, 2020).
Instead of a top-down approach where the central government directly oversees and
verifies the projects, the new subsidy management system revolves around provincial
power grid companies, leaving the central government with only supervision duties.
The new system is also based entirely on an online platform, where power producers
register project information, and power grid companies verify project status before
submitting the request to provincial and then central governments for final approval.
With a more efficient subsidy management system in place, in 2020 alone, ten batches
of renewable power projects were approved and included under the FIT scheme. It is
estimated by BNEF that by April 2021, a total installed capacity of 566 GW
(including the projects previously approved under the catalog system) has been
included in the FIT scheme, nearly three times as much as the total installed capacity
approved under the catalog system.
The majority of deployed renewable power projects, however, remain untapped
by the FIT subsidy. Based on the statistics published by the NEA, by 2020, the
cumulative installed capacity of renewable energy has reached 934 GW in China. In
contrast, by the end of 2020, only 310 GW of that has been included under the FIT
subsidy system (Luan, 2021). The first four months of 2021 have seen a large increase
in the capacity of projects approved for FIT subsidy, totaling 256 GW (Luan, 2021).
47
These newly approved projects, however, are mainly projects commissioned before
2020 but were put on the waitlist for FIT inclusion. As the Chinese government
continues to reduce FIT rates for newly approved renewable energy projects, we can
expect to see a shrinking number of projects approved for FIT subsidy in the near
future. In fact, the Ministry of Finance already issued a notice in 2020 stating that
offshore wind and solar thermal projects commissioned after the end of 2021 will no
longer be included under the FIT scheme (Ministry of Finance, 2020).
4.2.4 Abandonment of wind and solar resources
Abandonment of wind and solar resources in regions with high generation but
low consumption capacity has been a disturbing issue for the government. In 2018,
the NDRC issued a document addressing the resource abandonment issue and set
annual targets for improvement (NDRC, 2018). The targets for 2018 were to keep
wind abandonment rate below 12% and solar abandonment rate below 5%. Both wind
and solar abandonment rates should be controlled at below 5% by 2020. By the
government’s effort, the wind abandonment rate decreased gradually from 17.1% in
2012 to 3.4% in 2020 while solar abandonment rate decreased from 10.3% in 2015 to
2% in 2020 (State Grid New Energy Cloud, 2021). According to a study by Qi et al.
(2018), roughly 16% of overall wind generation was abandoned from 2010 to 2016,
resulting in an estimated loss of 1.2 billion USD in the opportunity cost of wind
generation.
48
There are four reasons behind wind and solar abandonment, according to the
study of S. Li et al. (2017). Firstly, the curtailment can be attributed to the
fast-growing development of renewable energy in China. Secondly, S. Li et al. (2017)
argue that the deployment of renewable energy power outpaced the construction of
grid transmission lines. The other two factors are identified as the incompatibility of
renewable energy with the power peak system and the underdeveloped market for
renewable energy consumption.
The hyper-development of renewable energy power generation in China during
the 2010s could be the leading reason behind the curtailment. In 2012, the cumulative
installed capacity of photovoltaics was 4.2 GW. The number skyrocketed to 204.7
GW in 2019, almost increased by 50% in merely 7 years (“Solar Power in China,”
2021). Wind power also experienced a high-speed growth during the same period,
tripling the cumulative capacity of 75 GW in 2012 to 210 GW in 2019 (“Wind Power
in China,” 2021). Many power producers went into the business searching for profits
and taking advantage of the FIT subsidy scheme, without possessing the key
technologies of efficient power transmission or meteorological forecast. In addition,
the underdeveloped inter-provincial electricity transmission system could also be an
impediment. Since many renewable energy power plants were located in remote areas
such as Xinjiang and Gansu Province, without efficient transmission systems, the
power either has to be consumed locally or abandoned. Even with solid government
support, without a ravenous market to consume, the supply of renewable energy
power will eventually exceed the demand and result in overcapacity. The abundance

49
of newly installed power plants widened the gap of deficit in the FIT subsidy scheme
and eventually took a toll on the end-users from whom the REDF collected RE
electricity surcharge. In light of that, from a perspective of efficient resource
allocation, the government should not continue to fund projects which are no longer
operative or register an irregularly high abandonment rate. Funding for a project with
high curtailment is highly inefficient and wasteful, especially when there are other
projects in need of such funding.
4.2.5 Poor Sales Performance of the Green Power Certificates
The GPC has recorded poor sales performance since its first appearance.
Inasmuch as the misalignment between the GPC system and the RPS system, as well
as the fact that the current RPS system is still in a trial run, sales of GPC depend
solely on voluntary action. Although the government intended to brand GPC as an
alternative for the FIT scheme, the sales record of GPC has been a complete fiasco.
By June 2021, the total number of tradable GPC (wind and solar) approved by the
government was 32 million; in other words, 32 million MWh of electricity generated
from renewable energy seeks the sales of GPC as an alternative for the FIT subsidy.
In contrast, the total number of GPC sold up to date was merely 76 thousand,
accounting for 0.24% of the total tradable GPC in the market. Out of the 76 thousand
GPC, only 172 were solar GPC. This is because the price of GPC is marked to the

50
cost of power production, and solar power generation is usually more expensive than
wind.
Judging from the sales data, whether the sales of GPC can alleviate the financial
burden of the FIT scheme is highly doubtful. In fact, some provinces introduced a
trading system of excess RE generation to complement the RPS policy in 2021.
Although compared to the heterogenous trading markets for excess RE generation, the
GPC system has a longer history and better uniformity, it is difficult to judge whether
the GPC system possesses a competitive edge due to its poor sales record. It is
possible that once a standardized trading system for excess RE generation is
introduced nationwide, the GPC system will be forced out of the market and into
non-existence.
51
5 Methods of analysis
5.1 Analytical framework
In this chapter, the author intends to model the economic feasibility of a solar PV
project under China’s current subsidy policy. There are various methods of analysis to
evaluate the revenue and cost balance of a project, for example, LCOE, net present
value, and internal rate of return, among many others. In this study, the author will
focus on the key financial measurements of the hypothetical project. By using
financial models to predict the cash inflows and outflows during the project’s life
span, the analysis will serve two purposes: 1) provide insights for power suppliers
with regards to production optimization; and 2) evaluate the effectiveness of various
government policies combining subsidy and alternative incentives with an aim for
maximizing the efficiency of public resource allocation.
The author performs an economic analysis using a discounted cash flow (DCF)
model, with key model indicators being the net present value (NPV), the internal rate
of return (IRR), and the payback period (PBP). The hypothetical project is assumed to
be a grid-connected, centralized solar photovoltaic project located in Zhejiang
Province of China. As the bedrock of this analysis, the baseline model is established
upon the assumptions that no subsidy or any varieties of financial incentives will be
granted to the project, nor will the project employ debt financing instruments. Thus,
the baseline model forecasts the economic feasibility of the project in the worst-case
scenario. When conducting further analysis, additional inputs, such as the subsidy

52
payout ratio and the debt-to-equity ratio, will be annexed to the baseline case to
reflect the impact of such parameters on the cost-benefit balance of the project. The
implications of changes in key financial measurements will serve to justify the policy
recommendations proposed in the later chapters of this thesis. Among many
assumptions made in this chapter, the main focus of this model is to evaluate the
impact of subsidies under the feed-in-tariffs scheme and propose possible routes of
improvements to the administration of that scheme.
The DCF model evaluates the economic feasibility of the project by discounting
every future cash flow into the present period, at an interest rate that equates to the
time value of money. Then by subtracting the initial cash outflow, which in the case
of a power generation project, is equivalent to the initial capital expenditure, the key
result is indicated as the net present value of the project. Meanwhile, the internal rate
of return is the interest rate at which the net present value of the project is equal to
zero, or in other words, the discounted cost and benefit of the project offsets each
other and the project yields zero profit. The payback period is the number of years
required to recover an initial investment outlay without discounting. Generally
speaking, a project with higher NPV and IRR, or lower PBP is more desirable for the
investors. The key outputs of this model are based on the following mathematic
equations:

53
(1) 𝐷𝐶𝐹 = 𝐶𝐹1
1 + 𝑟+
𝐶𝐹2
(1 + 𝑟)2+ ⋯ +
𝐶𝐹𝑛
(1 + 𝑟)𝑛
𝑊ℎ𝑒𝑟𝑒:
𝐷𝐶𝐹 = 𝑑𝑖𝑠𝑐𝑜𝑢𝑛𝑡𝑒𝑑 𝑐𝑎𝑠ℎ 𝑓𝑙𝑜𝑤
𝐶𝐹𝑛 = 𝑛𝑒𝑡 𝑐𝑎𝑠ℎ 𝑓𝑙𝑜𝑤 𝑖𝑛 𝑡ℎ𝑒 𝑛𝑡ℎ 𝑝𝑒𝑟𝑖𝑜𝑑
𝑟 = 𝑖𝑛𝑡𝑒𝑟𝑒𝑠𝑡 𝑟𝑎𝑡𝑒
(2) 𝑁𝑃𝑉 = ∑𝐶𝐹𝑡
(1 + 𝑟)𝑡− 𝑖𝑛𝑖𝑡𝑖𝑎𝑙 𝑖𝑛𝑣𝑒𝑠𝑡𝑚𝑒𝑛𝑡
𝑛
𝑡=1
(3) 0 = 𝐶𝐹0 +𝐶𝐹1
(1 + 𝐼𝑅𝑅)+
𝐶𝐹2
(1 + 𝐼𝑅𝑅)2+ ⋯ +
𝐶𝐹𝑛
(1 + 𝐼𝑅𝑅)𝑛
𝑊ℎ𝑒𝑟𝑒:
𝐶𝐹0 = 𝑖𝑛𝑖𝑡𝑖𝑎𝑙 𝑖𝑛𝑣𝑒𝑠𝑡𝑚𝑒𝑛𝑡 𝑜𝑢𝑡𝑙𝑎𝑦
(4) 𝑃𝐵𝑃 = 𝑓𝑢𝑙𝑙 𝑦𝑒𝑎𝑟𝑠 𝑢𝑛𝑡𝑖𝑙 𝑟𝑒𝑐𝑜𝑣𝑒𝑟𝑦 + 𝑢𝑛𝑐𝑜𝑣𝑒𝑟𝑒𝑑 𝑐𝑜𝑠𝑡 𝑖𝑛 𝑡ℎ𝑒 𝑙𝑎𝑠𝑡 𝑦𝑒𝑎𝑟
𝑐𝑎𝑠ℎ 𝑓𝑙𝑜𝑤 𝑑𝑢𝑟𝑖𝑛𝑔 𝑡ℎ𝑒 𝑙𝑎𝑠𝑡 𝑦𝑒𝑎𝑟
5.2 Baseline model specifications
To assist the evaluation of the effects of various policy channels, the baseline
model removes all policy incentives and financing means, leaving the model to show
the cost-revenue balance of the project in the worst-case scenario. It is worth noting
that the baseline model is constructed upon certain assumptions that only serve as a
foundation for further analysis; it carries no significance in reference to the revenue
and cost structure of a project on the ground. Moreover, the assumptions are
54
overgeneralized in order to provide the metrics of an average solar PV project in
China. The costs in initial installation, for example, should be adjusted for a real-life
project based on the actual development plan.
In the calculations of the baseline model, the following key assumptions are made:
1. The project is a 20 MW grid-connected, ground-mounted, and centralized solar
PV plant located in Zhejiang Province;
2. The construction period of the project is one year starting from the beginning of
2019, during which period the total amount of initial investment outlay is
expensed and no revenue is generated through the project;
3. The operation period is 30 years starting from the beginning of 2020;
4. The baseline project is financed 100% by equity, and therefore no debt interest
payment is expensed;
5. The corporate tax rate is 25%, without taking into account tax deductions for
renewable energy power producers;
6. Referring to the CPI index of China by the end of 2019, the inflation rate is
assumed to be constant at 3%, applicable to the costs of the project;
7. No subsidy under the FIT scheme is granted to the project during its entire life
span; only the revenue from selling electricity is considered
8. The quantitative effects of net-metering and renewable portfolio standards are also
not considered.
55
5.2.1 Generation
To calculate the annual cash inflow of the project, we should first estimate the
annual electricity generation of the project. The nameplate capacity, as the name itself
suggests, does not equate to the actual generation output of the project. Due to the
varying technologies of the solar panels – for example, whether the panels track the
sun or not (the tracking feature), or whether there are batteries installed in the system
(the energy storage feature) – and other meteorological factors, the actual generation
of the project is usually below the maximum output. It is estimated that the capacity
factor for an average solar power plant in China is relatively low at 17% (“Solar
Power in China,” 2021), which will be used as our assumption. The degradation rate
translates into less power produced as the system ages. Performance of the panels
declines, resulting in a year-on-year reduction in generation level of the modules, due
to unavoidable circumstances such as UV exposure and weather cycles (Pickerel,
2017). According to Dhimish & Alrashidi (2020), the degradation rate of
photovoltaics is equal to 1.15% a year in Japan, 1.3% a year in the Republic of Korea,
and ranges from 0.8% to 1.25% per year in the USA. Since the latitude of Beijing is
similar to that of Japan, ROK, and the USA, we will assume that the degradation rate
of photovoltaics in China is equal to 1%/year. In addition, we will assume that the
total operational days of the project in a year be 360 days, taking into account the
days when the solar plant is shut down for annual maintenance or experience irregular
power outages.
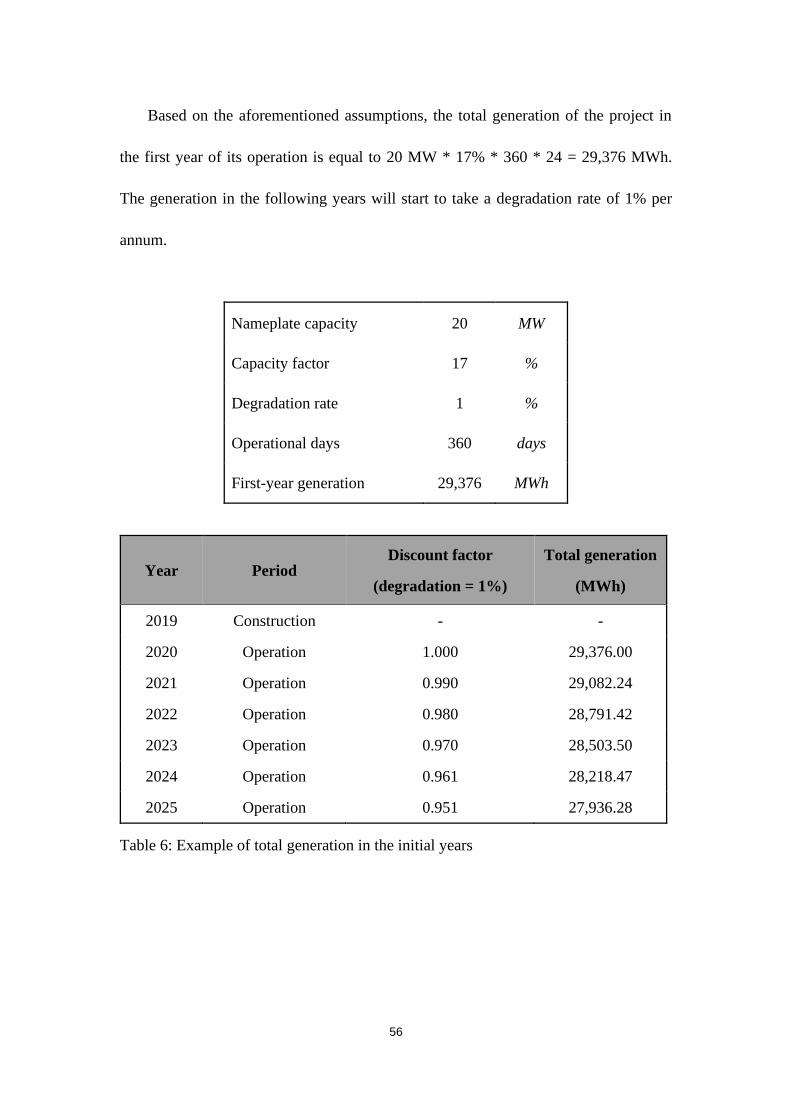
56
Based on the aforementioned assumptions, the total generation of the project in
the first year of its operation is equal to 20 MW * 17% * 360 * 24 = 29,376 MWh.
The generation in the following years will start to take a degradation rate of 1% per
annum.
Nameplate capacity 20 MW
Capacity factor 17 %
Degradation rate 1 %
Operational days 360 days
First-year generation 29,376 MWh
Year Period Discount factor
(degradation = 1%)
Total generation
(MWh)
2019 Construction - -
2020 Operation 1.000 29,376.00
2021 Operation 0.990 29,082.24
2022 Operation 0.980 28,791.42
2023 Operation 0.970 28,503.50
2024 Operation 0.961 28,218.47
2025 Operation 0.951 27,936.28
Table 6: Example of total generation in the initial years
57
5.2.2 Revenue
China implements a FIT scheme for wind and solar power generation, though the
administration of which is somewhat different from that in other countries. Under the
FIT scheme, the revenue of a solar PV project in China consists of two parts: 1) the
revenue received from power-grid companies at a per-unit price equal to that of
desulfurized coal power; and 2) the subsidy provided by the REDF that is equivalent
to the difference between the benchmark price (or the guide price after 2019) under
the FIT scheme and the desulfurized coal power price. As demonstrated in the first
equation below, the subsidy amount under the FIT scheme is equal to the FIT price,
subtracted by the desulfurized coal power price, which is unique for each province.
Since we hypothesize that the baseline project does not receive any subsidy under the
FIT scheme during its life span, the revenue of the project is equivalent to the revenue
received from power grid companies at the benchmark coal power price. The second
formula below shows the discounted total revenue during the base-case project’s life
cycle.
(1) 𝑃𝐹𝐼𝑇 = 𝑃𝑐 + 𝑃𝑠
𝑊ℎ𝑒𝑟𝑒:
𝑃𝐹𝐼𝑇 = 𝑡𝑜𝑡𝑎𝑙 𝑝𝑟𝑖𝑐𝑒 𝑢𝑛𝑑𝑒𝑟 𝐹𝐼𝑇 𝑠𝑐ℎ𝑒𝑚𝑒
𝑃𝑐 = 𝑑𝑒𝑠𝑢𝑙𝑓𝑢𝑟𝑖𝑧𝑒𝑑 𝑐𝑜𝑎𝑙 𝑝𝑜𝑤𝑒𝑟 𝑝𝑟𝑖𝑐𝑒
𝑃𝑠 = 𝑠𝑢𝑏𝑠𝑖𝑑𝑦 𝑢𝑛𝑑𝑒𝑟 𝐹𝐼𝑇 𝑠𝑐ℎ𝑒𝑚𝑒
58
(2) 𝛱 = ∑𝑄𝑡 ∙ 𝑃𝑐,𝑡
(1 + 𝑉𝐴𝑇) ∙ (1 + 𝑟)𝑡
𝑛
𝑡=1
𝑄𝑡 = 𝑄𝑡−1 ∙ (1 − 𝑑)
𝑊ℎ𝑒𝑟𝑒:
𝛱 = 𝑡𝑜𝑡𝑎𝑙 𝑟𝑒𝑣𝑒𝑛𝑢𝑒
𝑄𝑡 = 𝑡𝑜𝑡𝑎𝑙 𝑒𝑙𝑒𝑐𝑡𝑟𝑖𝑐𝑖𝑡𝑦 𝑔𝑒𝑛𝑒𝑟𝑎𝑡𝑖𝑜𝑛 𝑖𝑛 𝑝𝑒𝑟𝑖𝑜𝑑 𝑡
𝑃𝑐,𝑡 = 𝑑𝑒𝑠𝑢𝑙𝑓𝑢𝑟𝑖𝑧𝑒𝑑 𝑐𝑜𝑎𝑙 𝑝𝑜𝑤𝑒𝑟 𝑝𝑟𝑖𝑐𝑒 𝑖𝑛 𝑝𝑒𝑟𝑖𝑜𝑑 𝑡
𝑉𝐴𝑇 = 𝑣𝑎𝑙𝑢𝑒 − 𝑎𝑑𝑑𝑒𝑑 𝑡𝑎𝑥 𝑟𝑎𝑡𝑒
𝑟 = 𝑑𝑖𝑠𝑐𝑜𝑢𝑛𝑡 𝑟𝑎𝑡𝑒
𝑑 = 𝑑𝑒𝑔𝑟𝑎𝑑𝑎𝑡𝑖𝑜𝑛 𝑟𝑎𝑡𝑒
For the baseline model, since the project is a 20 MW grid-connected, centralized
solar PV plant, 100% of the electricity generated will be sold to the power grid
companies at the benchmark on-grid electricity price for desulfurized coal power
generation. Zhejiang province, in which the hypothetical project is located, was
selected as the demonstration province for a trial run of a pilot policy, which replaces
the current standardized coal-fired benchmark electricity price with a floating price
consisting of a base price and a margin. The desulfurized coal-power base price,
including value-added tax and net of any subsidy, is set by the Zhejiang Provincial
Development and Reform Commission at 415.3 CNY/MWh for power generation
after 2015.
In July 2019, a new policy was implemented to reduce the rate of value-added tax
for the power generation industry from 16% to 13% (Great Wall Securities, 2019).
59
Theoretically, the value-added tax rate is borne by the consumers who purchase the
final product. A change in the VAT rate will affect both revenue and cost of the
power producer proportionally, and therefore should be a straight pass-through with
no impact on the profitability of the project. On the revenue side, this new policy
reduces the first portion of the revenue received by power producers, to an extent that
can be calculated as 415.3 CNY/MWh - 415.3 CNY/MWh * (1 + 13%) / (1 + 16%) =
10.7 CNY/MWh. The updated coal-power base price, including VAT, should be
415.3 – 10.7 = 404.6 CNY/MWh.
Pursuant to a policy announced by the Zhejiang Provincial Development and
Reform Commission in December 2019 to further reduce the base price of
desulfurized coal, another 3.4 CNY/MWh should be subtracted. Unlike other
provinces in China, where a unified coal-fired electricity benchmark price is
stipulated for any project connected to the grid, Zhejiang province allows a 10%
premium above the base price and a 15% discount below the base price. It is for that
reason, each coal-fired power plant has a different on-grid electricity price, but within
the range of the prescribed cap and floor. For the simplicity of the analysis here, the
author will subtract another 3.4 CNY/MWh from the coal-power base price after the
reduction in the VAT rate, rendering a current base price of 404.6 – 3.4 = 401.2
CNY/MWh. The baseline model refers to this rate as the current desulfurized coal
power price, ignoring the effect of the floating price mechanism. Since the revenue
gained by power producers through selling electricity to power grid companies is net
60
of value-added tax, the actual per-unit gain on electricity sales, without the FIT
subsidy, is 401.2 CNY/MWh / (1 + 13%) = 355.04 CNY/MWh.
The discount rate, or the required rate of return, is another key assumption in the
DCF model that could significantly inflate the project NPV. It is referenced as the
minimum rate of return that the investor would accept based on the particular risk
profile of the project. Based on prior research, the discount rate of solar PV projects in
European countries usually takes 5% (Cucchiella et al., 2017); the rate in China,
however, should be higher considering the lower bankability of projects in a
developing economy. Yuan et al. (2014) stated in their research that, according to the
Beijing Municipal Commission of Development and Reform, the benchmark required
rate of return for a traditional power production project in China was 8%; nonetheless,
in light of a higher risk associated with the development of a solar PV project, they
have adjusted the required rate of return for a solar plant to 10%. Given that the
benchmark interest rate of commercial long-term loans in China is around 5% (China
Construction Bank, 2015), and that the required rate of return should exceed the cost
of financing, the author verifies that 10% is plausible and will use the number as the
hypothetical discount rate in the baseline model.
5.2.3 Capital costs
Capital cost is an item of one-time initial capital expenditure on the planning,
construction, and development of the project. In project finance, it is usually termed

61
CAPEX, or initial capital expenditure. CAPEX is the largest cash outflow in the
project’s life cycle; it usually can take up over 50% of the total expenditure. The
CAPEX of a photovoltaic project consists of two major categories: the hard costs and
the soft costs. In the hardware cost category, the cost of solar modules is usually the
largest bulk of costs for a project. Other hardware may include the inverter, mounting
materials – or solar module racking that is used to fix solar panels on surfaces – and
other electronics such as cables, ICT devices, and compact substations. The soft costs
of developing a project can come from designing and planning, installation cost,
shipping equipment, grid connection work, securing permits for land, headcount costs,
and etc.
The table below provides an estimated breakdown of the average capital
expenditure of a >10 MW grid-connected, ground-mounted, centralized photovoltaic
project commissioned by the end of 2019. The costs are estimated on a per watt
nameplate capacity basis, and the impact of value-added tax is assessed at the bottom.
It is also worth noting that the types of hardware, such as module and inverter, vary
significantly across manufacturers; therefore, the table can do no better than provide a
generalized view of the project’s costs. The costs of hardware for solar PV plants
have also declined drastically during the past decade and are continuing to drop as
technology improves. The author will use the 2019 national average estimated by the
IEA for the cost of modules to represent the largest expenditure in CAPEX. Since
Zhejiang province falls under the third resource category of solar development, which
receives the highest feed-in-tariff rate among all three regions on account of higher
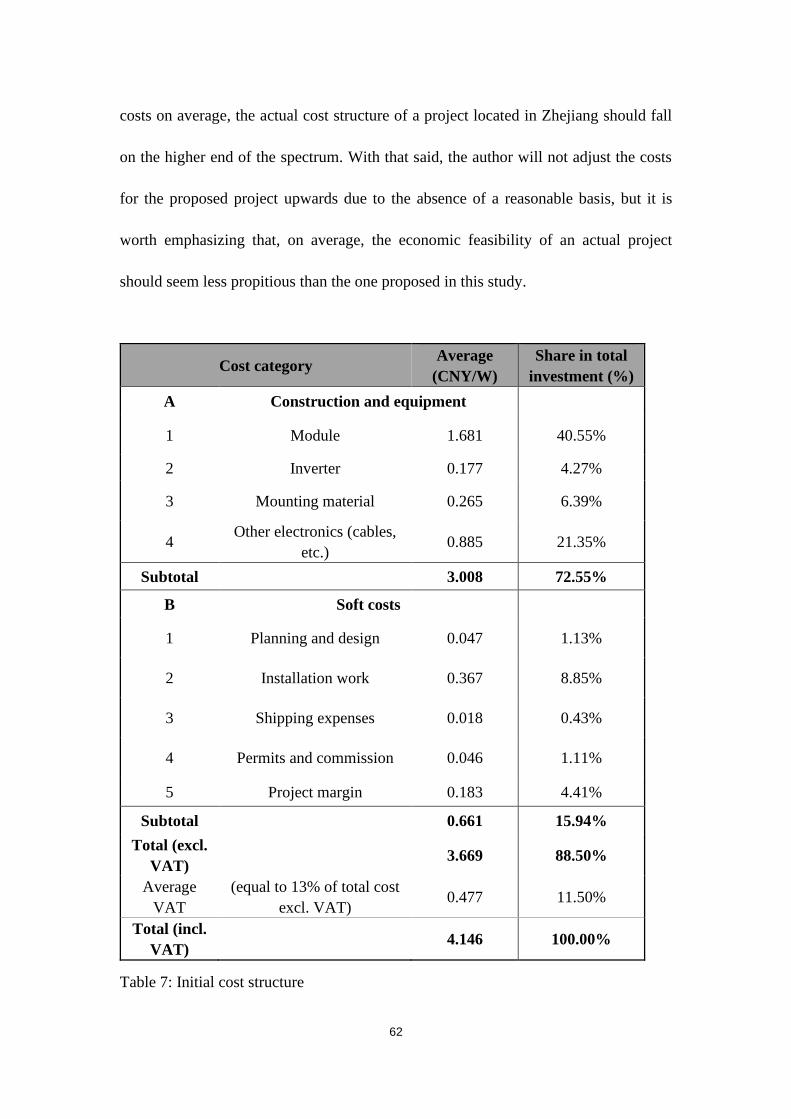
62
costs on average, the actual cost structure of a project located in Zhejiang should fall
on the higher end of the spectrum. With that said, the author will not adjust the costs
for the proposed project upwards due to the absence of a reasonable basis, but it is
worth emphasizing that, on average, the economic feasibility of an actual project
should seem less propitious than the one proposed in this study.
Cost category Average
(CNY/W)
Share in total
investment (%)
A Construction and equipment
1 Module 1.681 40.55%
2 Inverter 0.177 4.27%
3 Mounting material 0.265 6.39%
4 Other electronics (cables,
etc.) 0.885 21.35%
Subtotal 3.008 72.55%
B Soft costs
1 Planning and design 0.047 1.13%
2 Installation work 0.367 8.85%
3 Shipping expenses 0.018 0.43%
4 Permits and commission 0.046 1.11%
5 Project margin 0.183 4.41%
Subtotal 0.661 15.94%
Total (excl.
VAT) 3.669 88.50%
Average
VAT
(equal to 13% of total cost
excl. VAT) 0.477 11.50%
Total (incl.
VAT) 4.146 100.00%
Table 7: Initial cost structure
63
Source: 1) IEA, 2020b; 2) the average VAT is calculated based on the 2019 policy in
Zhejiang Province to reduce the rate of VAT down to 13% for the power generation
industry.
For our baseline model of a 20 MW centralized PV system, the CAPEX of the
project is estimated to be 3.669 CNY/W * 20 MW = 73.38 million CNY. It is worth
noting that in reality, the VAT is levied on the initial investment outlay and
reimbursed by the consumers when the project starts operation. Since the construction
period of the proposed project only takes one year, the time value of money will not
have a material impact on the project’s profitability, and therefore we will exclude
VAT in both cost and revenue calculations. Since we ignore the effect of debt
financing in the baseline model, we will assume that the total CAPEX of 73.38
million CNY is drawn down in the first year, financed 100% by equity.
5.2.4 Operational expenditure
The operation and maintenance cost, or better known as OPEX in project finance, is
an annual expenditure during the operation period of the project. It is a key
component of a solar plant, as ensuring the quality of operation and maintenance
serves is essential to mitigate potential risks of the project (IRENA, 2019). It consists
of annual maintenance of equipment and facilities, cleaning fees, insurance, and etc.
Based on a previous study by Yuan et al. (2014), the OPEX in the first year after
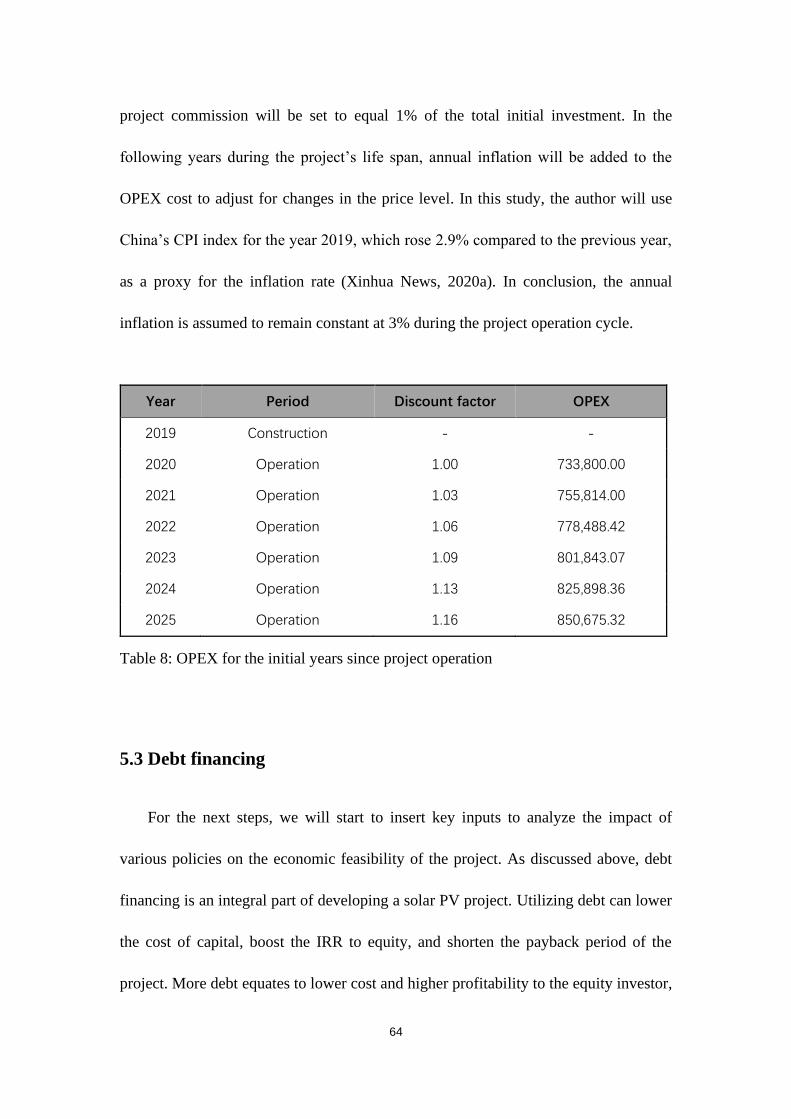
64
project commission will be set to equal 1% of the total initial investment. In the
following years during the project’s life span, annual inflation will be added to the
OPEX cost to adjust for changes in the price level. In this study, the author will use
China’s CPI index for the year 2019, which rose 2.9% compared to the previous year,
as a proxy for the inflation rate (Xinhua News, 2020a). In conclusion, the annual
inflation is assumed to remain constant at 3% during the project operation cycle.
Year Period Discount factor OPEX
2019 Construction - -
2020 Operation 1.00 733,800.00
2021 Operation 1.03 755,814.00
2022 Operation 1.06 778,488.42
2023 Operation 1.09 801,843.07
2024 Operation 1.13 825,898.36
2025 Operation 1.16 850,675.32
Table 8: OPEX for the initial years since project operation
5.3 Debt financing
For the next steps, we will start to insert key inputs to analyze the impact of
various policies on the economic feasibility of the project. As discussed above, debt
financing is an integral part of developing a solar PV project. Utilizing debt can lower
the cost of capital, boost the IRR to equity, and shorten the payback period of the
project. More debt equates to lower cost and higher profitability to the equity investor,
65
but the lenders usually demand a certain ratio of equity investment because that way,
their interests are better protected in an event of business decline. The Chinese
government stipulates that for a fixed asset investment project in the power sector, at
least 20% of the initial investment should be funded by equity (State Council, 2015).
Such a ratio, however, is unlikely to be achieved by private-owned enterprises due to
their insufficient credit history compared to state-owned enterprises; a minimum
equity ratio of 30% is usually demanded by lenders for private-owned enterprises
(CPIA, 2020). Taking heed of the minimum equity ratio, the author created four
scenarios to be compared with the baseline model. The selected equity ratio ranges
from 20% (the lower bound as prescribed by the Chinese government) to 100% (the
assumption in the baseline case). In addition, all other hypotheses, such as no FIT
subsidy during the project’s life span and no tax break for renewable energy power
producers, remain the same as the baseline model.
There are different types of debt depending on the format of repayment. Here we
will assume the debt is mortgage type, which means a fixed amount of annuity that
includes both interest expense and principal repayment is made each year. The other
type of debt that is very often used for renewable energy projects is debt sculpting. In
debt sculpting, the principal and interest obligations are calculated to match the
strength of net operating income in each year. In such a case, a fixed debt service
coverage ratio (DSCR) – the ratio of net operating income in each period over total
debt service in the same period – is given throughout the debt tenor. It is difficult,
however, to find an industry average DSCR ratio for the power generation sector. On
66
the other hand, the mortgage type of debt is contingent only on two assumptions: debt
tenor and the cost of debt. Since both have readily available industry average data,
here the author will structure the debt using the mortgage type.
According to industry information, the standard tenor of debt for solar projects is
within 15 years (CPIA, 2020). Since we make no assumptions on the creditworthiness
of the producer, we will use the standard 15 years as the tenor of debt in our model.
The cost of debt, conversely, can be very different depending on project specifics.
According to the Industrial and Commercial Bank of China, one of the major
commercial banks in China, the interest rate of long-term commercial loans over 5
years is set at 4.9% (Industrial and Commercial Bank of China, 2015). Based on
previous studies and taking into account the associated risks of a 15-year loan for a
solar PV plant, we will adjust the standard long-term interest rate upwards to 6% as
the hypothesis in this study.
5.4 Preferential tax policy
Based on enterprise income tax law effective from January 2008, renewable
energy project developers enjoy income tax exemption for the first three years of
project operation, followed by another 3 years with a preferential tax rate of 12.5%,
compared to the benchmark tax rate of 25% (BNEF, 2021).
The preferential tax policy, coupled with the standard accounting treatment for
net operating loss carryforward (NOLC), however, only plays a minor role in
67
assessing the profitability of the project. Net operating loss carryforward is a
beneficial policy that exempts a company from corporate income tax burdens if the
entity had experienced a substantial net operating deficit in the previous fiscal year.
The net income loss can be carried forward into the subsequent periods to offset the
company’s taxable income, but the NOLs usually cannot be extended indefinitely into
the future. According to Article 18 of the Enterprise Income Tax Law of the People’s
Republic of China amended in 2018, the Chinese government allows a maximum of 5
years for NOLC. The project in this model renders an NOL in the construction period
due to the initial investment expenditure, which can be carried forward for 5 years,
deducting the taxable income in the first 5 years of the project’s operation.
Consequently, the preferential tax policy for renewable power producers is, in effect,
inefficacious to the project during the first 5 operational years. With that said, the 12.5%
preferential tax treatment is applicable on the 6th year of the project’s operation, when
the project is no longer qualified for NOLCs.
In this analysis, the preferential tax policy is applied to the project after factoring
in debt financing. With a comparative analysis, the author intends to discover the
impact of a tax holiday on projects with different debt structures, namely, on the
baseline model and 4 other scenarios in the previous analysis, with a debt ratio of 30%,
50%, 70%, and 80%, respectively.
68
5.5 Subsidy under the FIT scheme
The per-unit price of electricity under the FIT scheme consists of two parts: the
benchmark price of desulfurized coal power and the price-gap subsidy that is equal to
the difference between total FIT price and the benchmark coal price. The second
portion is paid through the REDF and allocated by the Ministry of Finance. The NEA
maintains a list of approved projects for FIT subsidies, and adds new projects into the
list periodically after verification. Only those projects approved by the NEA to
receive the FIT subsidy are eligible for the second portion of revenue, whereas those
not enlisted or those experiencing a delay in FIT subsidy payment only receive the
first portion of revenue equivalent to the benchmark coal power price. The FIT
subsidy is paid out to power producers annually via the REDF for a maximum of 20
years since grid connection (Ministry of Finance, 2020e).
The approval and maintenance of the list of eligible projects by the NEA were
redundant and inefficient, frequently resulting in delays in the approval process and in
subsidy payments. With an aim to streamline the process, China’s Ministry of Finance
released a document in 2020 changing the previous catalog system to a list system for
the management of eligible projects (Ministry of Finance, 2020b). The document,
however, not only benefited renewable power producers by rationalizing the list
management but also enforced a stricter rule on the criteria of solar projects for
approval under the FIT scheme. The document states that, in order to qualify for FIT
subsidies, conventional centralized solar projects should have been fully connected to
the grid before July 2017, but the deadline for photovoltaic leader projects and other

69
solar projects whose prices are determined through bidding can be extended to the end
of 2019 (Ministry of Finance, 2020b). Likewise, it also sets a due date for
conventional wind projects by the end of 2019. With a sunset clause under which
centralized renewable energy projects will not receive FIT subsidy starting from 2020,
this policy announcement calls a halt to the universal FIT scheme and ushers in the
era of competitive bidding and grid-parity for renewables. Nevertheless, this does not
intend to forbid all newly commissioned renewable energy plants from accessing FIT
subsidies. In fact, although the document raised an outcry among the industry,
especially among those who only just entered the market expecting the business to be
lucrative, the true purpose of this policy is to foster a healthy market competition in
light of the decreasing costs for renewable power generation and reward producers
who can achieve near grid-parity.
Against the backdrop of a gradually reducing total price of FIT, in the first half of
2020, 295 newly commissioned centralized solar PV projects out of 346 applicants
were approved for inclusion under the REDF subsidy list, with the total FIT price
determined through a bidding process (NEA, 2020b). The lowest price among
approved solar PV projects is 242.7 CNY/MWh and the average year-on-year
reduction in bidding price is 78.5 CNY/MWh. However, the approved projects are
geographically concentrated in 15 provinces and municipalities, channeling funds into
only half of China’s administrative regions. Zhejiang province registered 25 approved
projects in 2020, totaling an installed capacity of 2.5 GW. On top of that, the highest
70
bidding price among projects approved in Zhejiang Province is 449.3 CNY/MWh –
well below the official FIT for the third resource region at 490 CNY/MWh.
5.5.1 Basic assumptions
The operation of the project, as stated, is assumed to start at the beginning of
2020, following a one-year construction period in 2019. This assumption is made in
line with the sunset clause on the phaseout of renewable energy FIT subsidy that
precludes centralized PV projects commissioned after the end of 2019 from the FIT
scheme. The author hypothesizes that the project is enlisted at the beginning of the
first operational year, without any delay in the application and approval process.
Given the fact that the total FIT price was determined through bidding after 2019,
and that the actual bidding prices for solar PV projects approved in 2020 are poles
apart, to pose a one-fit-for-all assumption on the amount of FIT subsidy is a great
challenge. Since the main emphasis of this paper rests in assessing the impact of a
subsidy payment delay on the economic feasibility of renewable power projects, the
author will refer to the highest approved tender price in 2020 so as to display the
impact in the most conspicuous way. As the highest tender in 2020 was priced at
449.3 CNY/MWh, the author will assume the total FIT price to be its approximate,
450 CNY/MWh. We have seen in Chapter 4 that the FIT subsidy paid to power
producers is net of value-added tax, or subsidy paid = subsidy payable / (1 +
71
value-added tax). Therefore, the final FIT subsidy received by the power producer
should be (450 – 401.2) / (1 + 13%) = 43.19 CNY/MWh.
In the assessment of the impact of FIT subsidy, the author will assume that the
proposed project is funded 30% by equity and 70% by debt, which is allegedly the
standard capital structure for a renewable energy plant owned by private developers.
The repayment of debt is also assumed to be the mortgage type. In addition, all
assumptions with regards to corporate income tax, such as NOLC and preferential tax
policy for renewable energy projects, still hold for the analysis here.
5.5.2 Subsidy payout ratio
Owing to the inefficient administration of the REDF, the subsidy payment under
the FIT scheme has been most often delayed and curtailed. Although the REDF was
established with an aim to stimulate renewable energy production, in practice, the
REDF has been channeled into causes other than providing funding for the FIT
scheme. In this section, the author intends to assess the extent to which a delay in FIT
subsidy payment damages the economic feasibility of a centralized solar PV project
located in Zhejiang Province. Two cases are created to contrast the key financial
measurements of the project with full FIT subsidies paid in time and with curtailed
and delayed subsidy payments.
Under the first scenario, the full FIT subsidy payments are granted in a timely
fashion throughout the project’s life span. In this case, the project should be able to
72
reap the benefits of the FIT scheme to its utmost. The annual subsidy under the FIT
scheme paid to the project owner for a maximum of 20 years, net of value-added tax,
should be constant at 43.19 CNY/MWh. In contrast, the second scenario models a
curtailed payment under the FIT scheme due to the enlarging deficit in the REDF.
Moreover, the curtailment in subsidy amount will also render a prolonged payment
schedule, whereby the overdue subsidy payment will be remunerated to the power
producer beyond the 20-year time frame.
To improve the accuracy of the analysis here, instead of hypothesizing a constant
subsidy payout ratio throughout the project’s operational years, the author will use the
CREST model generated by Luan (2021) to provide a more dynamic view of the
subsidy payment schedule. The model is based on a 2020 national policy, which
prescribes that any payment from the REDF will be determined on a cost-revenue
balance basis (Ministry of Finance, 2020a). In other words, the subsidy payout ratio is
proportionate to the income from renewable energy electricity surcharge collected
from electricity consumers.
The CREST model provides the historical trend and a forecast of both the yearly
supply and demand of the FIT subsidy for renewable energy from 2012 to 2050. On
the supply side, the REDF is funded by the RE electricity surcharge collected by two
types of power consumers: commercial and industrial consumers, and agricultural and
residential consumers. The RE surcharge rate on the former type of consumers was
hiked four times from 2006 to 2016 and has remained at 19 CNY/MWh since the last
upward adjustment in 2016. The RE surcharge rate on the second type of consumption,
73
contrarily, has remained constant at 1 CNY/MWh. Based on actual electricity
consumption data by segment, and with a forecast of power demand growth going
forward into 2050, the CREST model configures an estimate of annual subsidy supply
from 2012 to 2050. In the meantime, the annual demand of subsidy is contingent on
the number of projects approved each year, and the capacity thereof. Dividing the
total yearly demand by the total supply, the FIT subsidy payout ratio is then
calculated in accordance with the cost-revenue balance principle prescribed by the
state government.
As stipulated by the Chinese government, renewable energy projects will be
eligible for FIT subsidies for a maximum of 20 years since grid connection. However,
since the REDF is currently experiencing a widening gap in funding, projects enlisted
after 2019 might experience significant delays in FIT subsidy payment in the initial
years of operation. In addition, the payout percentage should register a j-curve that
bottoms out in two to three years following the first subsidy payment and gradually
increase in the subsequent years, in view of the fact that over 60% of projects by
capacity currently under the subsidy list were enlisted between 2020 and the first half
of 2021. The demand for subsidy should peak by around the end of 2021, as a result
of the subsidy phaseout for centralized PV projects. On this account, the following
table presents a j-shaped curve of payout percentage as discussed. Although in an
ideal scenario, the full amount of subsidy is paid within a maximum of 20 years, the
model allocates delayed subsidy payment into later years and thereby smooths capital
inflow during the project’s full life cycle.

74
Times Operation Payout ratio
2020 Op Yr 1 47%
2021 Op Yr 2 17%
2022 Op Yr 3 18%
2023 Op Yr 4 23%
2024 Op Yr 5 25%
2025 Op Yr 6 31%
2026 Op Yr 7 34%
2027 Op Yr 8 36%
2028 Op Yr 9 39%
2029 Op Yr 10 42%
2030 Op Yr 11 44%
2031 Op Yr 12 46%
2032 Op Yr 13 50%
2033 Op Yr 14 53%
2034 Op Yr 15 59%
2035 Op Yr 16 66%
2036 Op Yr 17 79%
2037 Op Yr 18 86%
2038 Op Yr 19 97%
2039 Op Yr 20 114%
2040 Op Yr 21 126%
2041 Op Yr 22 138%
2042 Op Yr 23 138%
2043 Op Yr 24 139%
2044 Op Yr 25 139%
2045 Op Yr 26 139%
2046 Op Yr 27 138%
2047 Op Yr 28 38%
2048 Op Yr 29 0%
2049 Op Yr 30 0%
Table 9: Subsidy payout ratio by year
Source: Luan (2021)
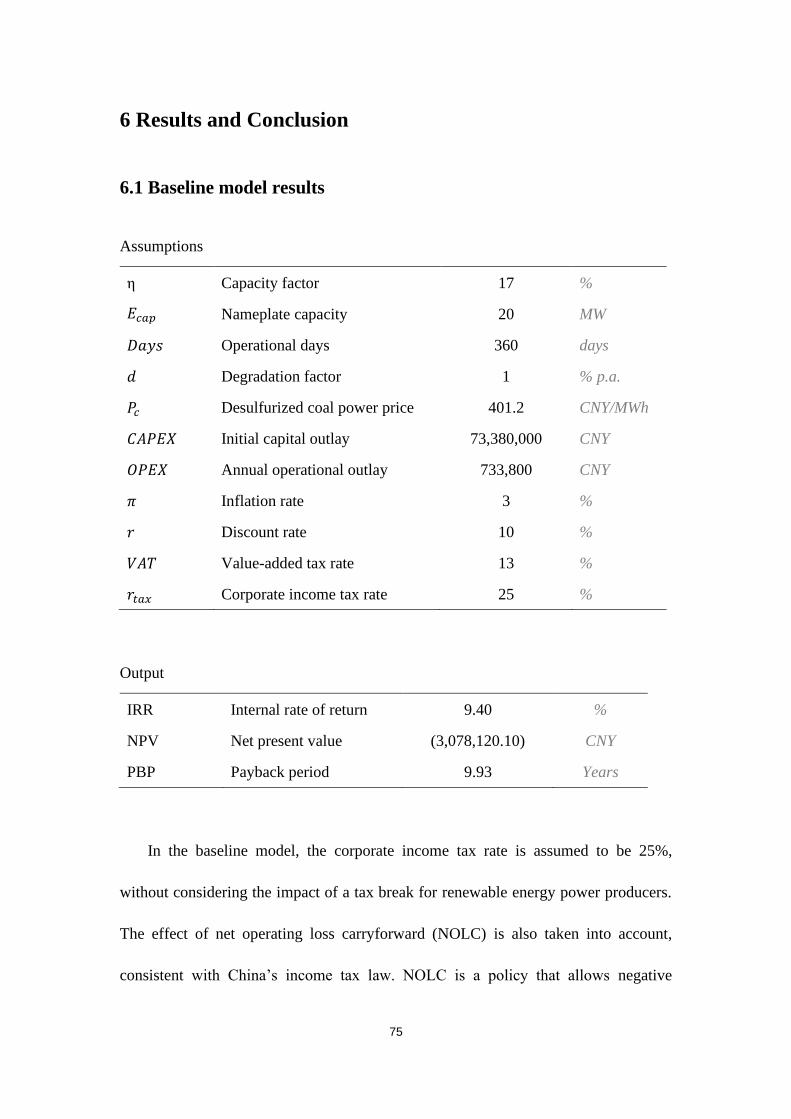
75
6 Results and Conclusion
6.1 Baseline model results
Assumptions
η Capacity factor 17 %
𝐸𝑐𝑎𝑝 Nameplate capacity 20 MW
𝐷𝑎𝑦𝑠 Operational days 360 days
𝑑 Degradation factor 1 % p.a.
𝑃𝑐 Desulfurized coal power price 401.2 CNY/MWh
𝐶𝐴𝑃𝐸𝑋 Initial capital outlay 73,380,000 CNY
𝑂𝑃𝐸𝑋 Annual operational outlay 733,800 CNY
𝜋 Inflation rate 3 %
𝑟 Discount rate 10 %
𝑉𝐴𝑇 Value-added tax rate 13 %
𝑟𝑡𝑎𝑥 Corporate income tax rate 25 %
Output
IRR Internal rate of return 9.40 %
NPV Net present value (3,078,120.10) CNY
PBP Payback period 9.93 Years
In the baseline model, the corporate income tax rate is assumed to be 25%,
without considering the impact of a tax break for renewable energy power producers.
The effect of net operating loss carryforward (NOLC) is also taken into account,
consistent with China’s income tax law. NOLC is a policy that allows negative

76
income in the previous fiscal year to offset any taxable income in future periods.
China’s corporate tax code allows a maximum of 5 years for NOLC, which means the
deferred tax asset can be carried forward to offset a positive net income in the nearest
5 future periods. When we factor in the effect of NOLC, the result of the baseline
model shows an IRR of 9.40%, lower than the required rate of return at 10%.
Therefore, the NPV for this project is also negative, totaling a 3.1 million CNY
deficit.
Both IRR and NPV are useful measurements of investment return, but the two
methods focus on different aspects of the project. The NPV method is biased towards
cash flows in the nearer time periods, whereas the IRR method presents a more
holistic view of the project’s profitability during its entire life cycle. Since the project
in question incurs a large investment outlay in the first period, the NPV is naturally
biased towards the initial cash outflow. In addition, the undiscounted payback period
for this project is 9.93 years, which means it will take almost 10 years to repay the
initial investment outlay.10 It is worth noting, however, that a solar PV project
financed 100% by equity is nearly impossible in practice. Since a photovoltaic project
requires a large sum of initial capital expenditure and the payback period is extended,
debt financing is very often utilized to lower the cost of investment. The project will
demonstrate more a promising financial position when lenders contribute to the
project because debt is usually cheaper than equity.
10 The payback period takes into account the construction period. In other words, the calculation
starts from the year the loan is drawn down.
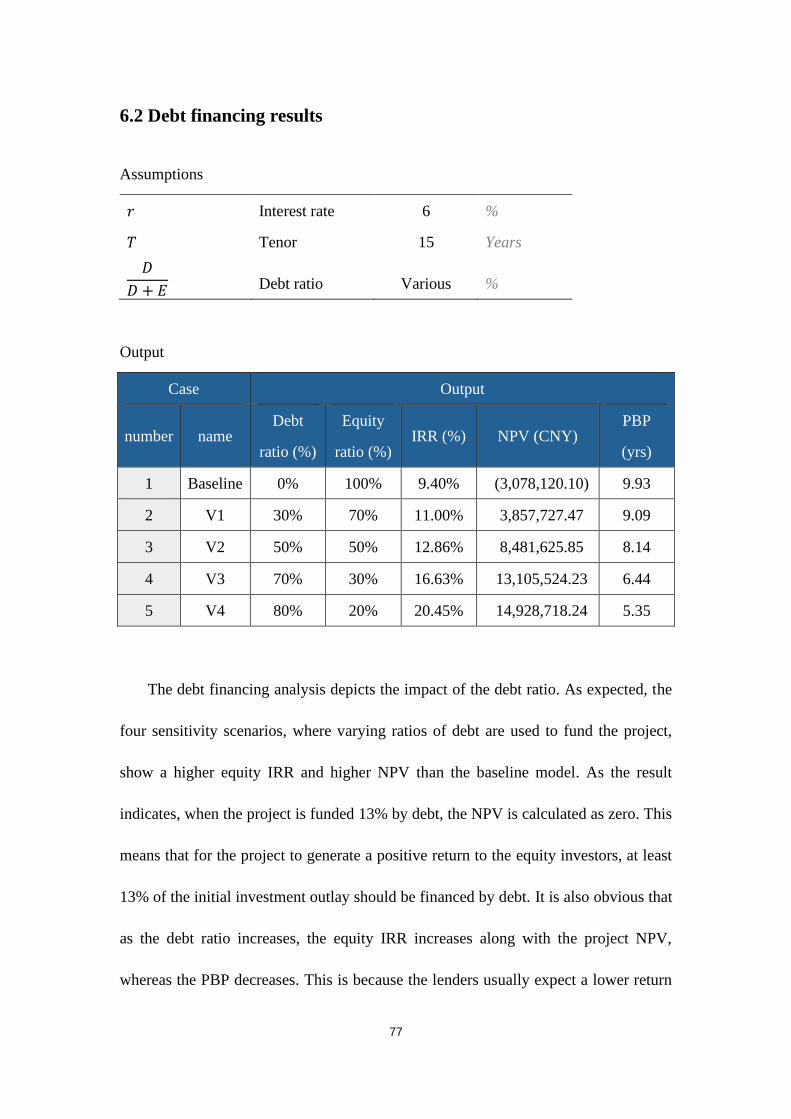
77
6.2 Debt financing results
Assumptions
𝑟 Interest rate 6 %
𝑇 Tenor 15 Years
𝐷
𝐷 + 𝐸 Debt ratio Various %
Output
Case Output
number name Debt
ratio (%)
Equity
ratio (%) IRR (%) NPV (CNY)
PBP
(yrs)
1 Baseline 0% 100% 9.40% (3,078,120.10) 9.93
2 V1 30% 70% 11.00% 3,857,727.47 9.09
3 V2 50% 50% 12.86% 8,481,625.85 8.14
4 V3 70% 30% 16.63% 13,105,524.23 6.44
5 V4 80% 20% 20.45% 14,928,718.24 5.35
The debt financing analysis depicts the impact of the debt ratio. As expected, the
four sensitivity scenarios, where varying ratios of debt are used to fund the project,
show a higher equity IRR and higher NPV than the baseline model. As the result
indicates, when the project is funded 13% by debt, the NPV is calculated as zero. This
means that for the project to generate a positive return to the equity investors, at least
13% of the initial investment outlay should be financed by debt. It is also obvious that
as the debt ratio increases, the equity IRR increases along with the project NPV,
whereas the PBP decreases. This is because the lenders usually expect a lower return
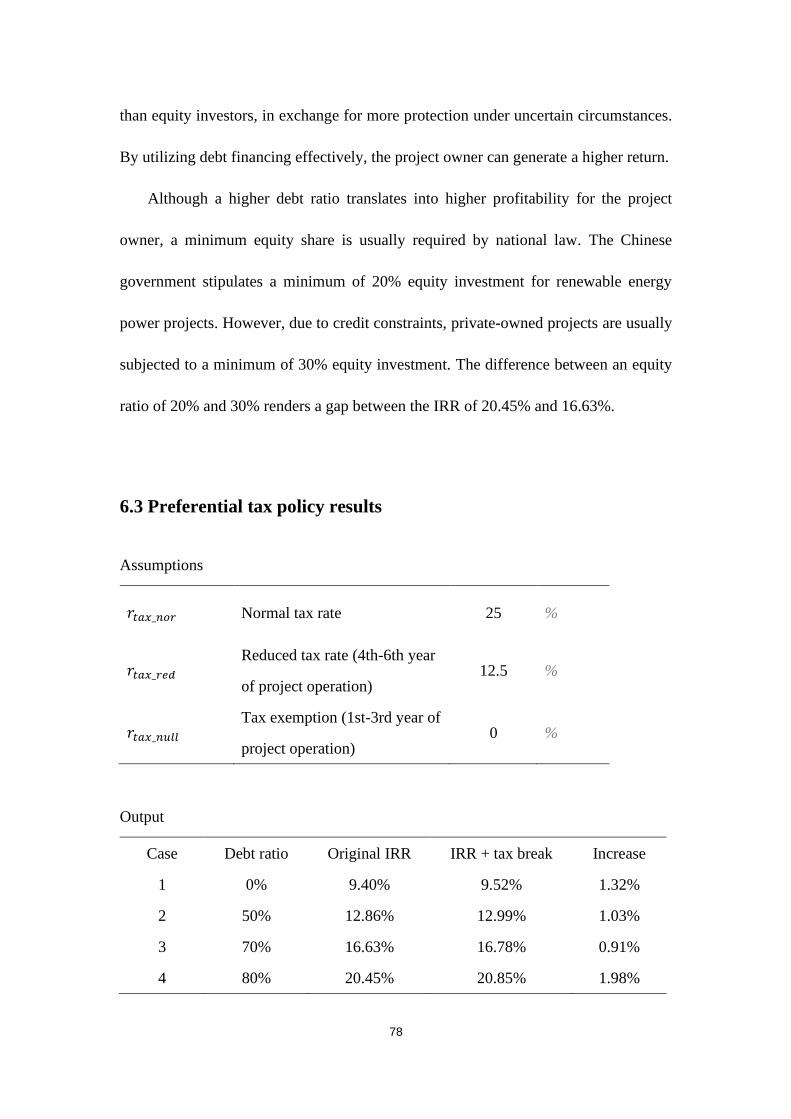
78
than equity investors, in exchange for more protection under uncertain circumstances.
By utilizing debt financing effectively, the project owner can generate a higher return.
Although a higher debt ratio translates into higher profitability for the project
owner, a minimum equity share is usually required by national law. The Chinese
government stipulates a minimum of 20% equity investment for renewable energy
power projects. However, due to credit constraints, private-owned projects are usually
subjected to a minimum of 30% equity investment. The difference between an equity
ratio of 20% and 30% renders a gap between the IRR of 20.45% and 16.63%.
6.3 Preferential tax policy results
Assumptions
𝑟𝑡𝑎𝑥_𝑛𝑜𝑟 Normal tax rate 25 %
𝑟𝑡𝑎𝑥_𝑟𝑒𝑑 Reduced tax rate (4th-6th year
of project operation) 12.5 %
𝑟𝑡𝑎𝑥_𝑛𝑢𝑙𝑙 Tax exemption (1st-3rd year of
project operation) 0 %
Output
Case Debt ratio Original IRR IRR + tax break Increase
1 0% 9.40% 9.52% 1.32%
2 50% 12.86% 12.99% 1.03%
3 70% 16.63% 16.78% 0.91%
4 80% 20.45% 20.85% 1.98%
79
The tax holiday policy, surprisingly, does not have a significant impact on the
profitability of the project. According to the state government, a tax break should
ideally serve as an alternative stimulus for the development of renewable energy
production. However, due to the treatment of NOLC, the benefit of a tax break is
trivialized. The above output table presents a comparison of equity IRR before and
after the introduction of a tax break for two otherwise identical scenarios. As can be
seen from the table, the benefit of a tax break on the equity IRR is marginal. The
increase in IRR after the application of the preferential tax policy is around 1% for
projects with various debt structures. This is because large infrastructure projects
require a large sum of cash outflow in the construction period. The NOL in the
construction year usually carries into the operational years. In reference to an upper
limit on NOLC, the proposed project can still benefit from the tax holiday in its 6th
year of operation. However, since the reduction in corporate income tax rate is only
12.5% in the 6th period, the impact of the tax holiday policy on the project’s economic
feasibility is minimal.
In addition, projects with a higher debt ratio generally benefit less from the tax
holiday. This is because a project financed with more debt generates less gross
income during the operational years, in return for a lower initial investment outlay for
equity investors. As the size of taxable income decreases, the reduction in tax expense
also decreases, resulting in a less significant impact of the tax holiday on projects with
a higher debt ratio. However, when the project is financed 80% by debt, it starts to
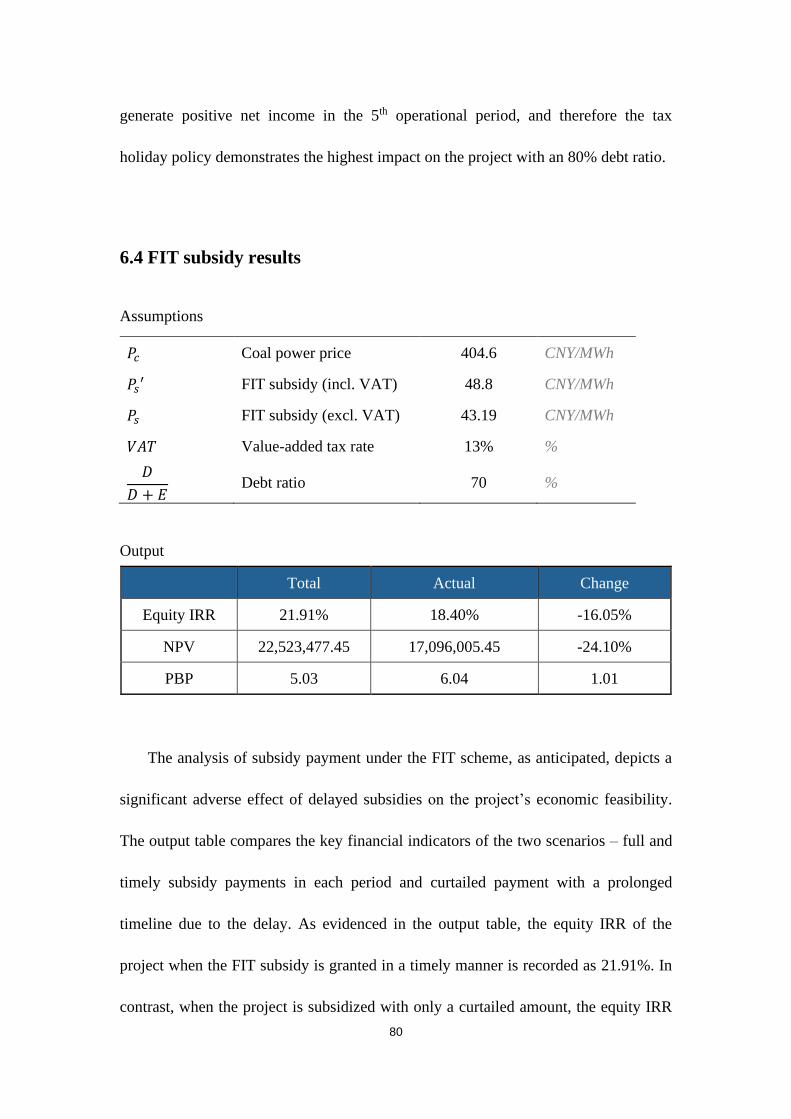
80
generate positive net income in the 5th operational period, and therefore the tax
holiday policy demonstrates the highest impact on the project with an 80% debt ratio.
6.4 FIT subsidy results
Assumptions
𝑃𝑐 Coal power price 404.6 CNY/MWh
𝑃𝑠′ FIT subsidy (incl. VAT) 48.8 CNY/MWh
𝑃𝑠 FIT subsidy (excl. VAT) 43.19 CNY/MWh
𝑉𝐴𝑇 Value-added tax rate 13% %
𝐷
𝐷 + 𝐸 Debt ratio 70 %
Output
Total Actual Change
Equity IRR 21.91% 18.40% -16.05%
NPV 22,523,477.45 17,096,005.45 -24.10%
PBP 5.03 6.04 1.01
The analysis of subsidy payment under the FIT scheme, as anticipated, depicts a
significant adverse effect of delayed subsidies on the project’s economic feasibility.
The output table compares the key financial indicators of the two scenarios – full and
timely subsidy payments in each period and curtailed payment with a prolonged
timeline due to the delay. As evidenced in the output table, the equity IRR of the
project when the FIT subsidy is granted in a timely manner is recorded as 21.91%. In
contrast, when the project is subsidized with only a curtailed amount, the equity IRR
81
is 18.4%, with a 16.05% decrease from the upper-case scenario. The NPV of the
project is also considerably larger if the project could receive the promised amount of
subsidy when the payment is due. If the subsidy payout ratio is contingent on the
cost-revenue balance principle, the NPV of the project will record a 24.1% reduction
than in the ideal situation. In addition, if the payment is delayed, the undiscounted
payback period will be extended by 1.01 years, which means the project will continue
to register a cumulative income loss for an additional year.
In light of the above discussion, we can safely conclude that the delay in subsidy
payment under the FIT scheme and a reduction in payout ratio will substantially
injure the financials of the project. Although the decline in equity IRR might seem to
be within the comfort zone in absolute terms, one cannot neglect a reduction in NPV
that is over 24%. On top of that, extending the payback period for another year will no
doubt hurt the bankability of the project. On one hand, a prolonged payback period
means the project owner will have to wait longer to achieve the break-even point of
their investment and have to survive the cumulative operating loss for an additional
year. On the other hand, a longer payback period may discourage investors who have
liquidity concerns. Since a renewable energy plant requires a large amount of capital
expenditure, many things could potentially go wrong and result in an unrecoverable
investment.
There are many key assumptions that could potentially change the magnitude of
the worsened profitability here. For example, the NPV method is very sensitive to the
assumption of the discount rate. Since a large bulk of the delayed subsidy payment is
82
recovered during the later years of the project’s operation cycle, a higher discount rate
could lead to a smaller present value of the subsidy revenue, and thereby a wider gap
in NPV calculation. Moreover, the per-unit price of FIT subsidies also plays an
important role. By imposing competitive bidding on newly commissioned projects,
the Chinese government is fostering a market-oriented pricing mechanism for
renewable power plants. The subsidy portion under the FIT scheme, in excess of the
benchmark coal power price, has been decreasing against the backdrop of the
government’s endorsement for RE grid-parity. In light of a decreasing FIT subsidy,
the adverse effect of a reduced payout ratio could be shrinking as well.

83
7 Policy Recommendation
In the previous chapters, the author modeled the impact of various government
policies on the economic feasibility of a centralized solar PV project located in
Zhejiang Province, China. Such analysis outperforms descriptive analysis of policy
interventions and strives to provide quantitative reasoning in favor of or against
China’s various state policies on the FIT scheme. By comparing the variations in a set
of profitability measurements, the effects of different policy channels can be visibly
demonstrated and contrasted on an equal footing with one other.
In reference to the output results of the model, the author concludes with four
policy recommendations to complement the current policy on renewable energy
power generation: 1) bridge the gap between the supply and demand for subsidy
under the FIT scheme by improving the economic and operational efficiency of the
REDF; 2) generate more revenue streams into the REDF by reallocating public
resources from fossil fuel subsidies; 3) supplement the phaseout of the FIT scheme
with the introduction of effective alternatives, and 4) renewable projects should be
closely monitored for the abandonment rate of resources. All such policy
recommendations as mentioned are built upon the Chinese government’s resolution to
transform the energy mix and promote the share of renewables in the energy mix. In
2019, the top 10 countries with the highest share of renewables in the primary energy
mix registered a percentage of renewables from 16.98% to 9.98%. China, on the other
hand, recorded the renewable energy share as 4.68% of the primary energy mix in the

84
same year (Y. H. Zhang, 2021). To achieve a transformation in the energy
consumption structure, interaction of multiple policy channels is required.
7.1 Improve the efficiency of the REDF
The REDF, being the main source of supply for renewable energy subsidy under
the FIT scheme, has been running a deficit that continues to expand. The deficit, on
one hand, signals a growing demand for FIT subsidies resulted from the exponential
development of renewable energy power production. But more importantly, on the
other hand, the growing deficit discourages further development by squeezing the
profit margin for power producers. As it has been pointed out, the NPV for a project
that satisfies all assumptions made in this analysis only becomes positive when the
project can secure over 13% of debt in the initial investment outlay. Such requirement
on the financing structure presumes certain history of credibility demonstrated by the
project owner and therefore precludes newcomers from making profits in the industry.
In light of the principle set by the government that the subsidy payout ratio is
determined on a cost-revenue balance basis, or more specifically, by the collection
rate of the RE electricity surcharge, the key issue here boils down to how to improve
the administrative process of the REDF. The author proposes several refinements to
the functionality of the REDF. Firstly, since the FIT subsidy is, in effect, borne by
electricity end-users in the form of a per-unit RE electricity surcharge, the collection
rate of such surcharge should be raised through more effective enforcement and

85
heavier regulations. Secondly, the verification and approval process of enlisting
power generation projects for subsidy should be streamlined to ensure payment in a
timely fashion. Thirdly, as the RE electricity surcharge in China only accounts for a
minimal percentage of total electricity bill compared to other industrial economies,
the Chinese government should consider raising the surcharge rate again. Last but not
the least, the use of REDF should be subject to public scrutiny to make sure every
penny is spent on the promotion of renewable energy development, as is suggested to
be the sole purpose of the fund.
To start off, a more effective regulatory and enforcement mechanism is required
to increase the collection rate of RE electricity surcharge. Although the surcharge rate
on agricultural and residential use of electricity has remained at 0.001 CNY/kWh, the
surcharge rate on commercial and industrial electricity use has been raised several
times from 0.008 CNY/kWh to 0.019 CNY/kWh during 2006 and 2016. The rise in
RE surcharge rate was enforced to remedy the REDF’s growing deficit, which was
registered at 55 billion CNY in the first half of 2016 (Reuters, 2016). While the
surcharge rate has not been further raised, the deficit in the REDF continued to grow
and reached 233.1 billion CNY by the end of 2018 (B. Li, 2019). Although industry
experts have researched the possibility of further hiking the premium rate to 0.029
CNY/kWh, the NDRC circumvented the idea in its reply to the proposal (Chen,
2019).
As has been discussed in the previous chapters, the main reason behind the
widening budget deficit is the inadequate collection rate of RE electricity surcharge –
86
only around 60% of the surcharge payable has been effectively collected during 2012
and 2018 (China Everbright Securities, 2019). Based on a tripartite government
document, there are four channels of electricity sales on which a RE surcharge is
levied: direct sales of electricity from power generators to large consumers, sales
through independent local power grid companies, self-consumption of electricity
prosumers, and other sales through regional power grid companies (Ministry of
Finance, 2011). The second and the third channels are often loosely regulated, leading
to a low collection rate of RE electricity surcharge. Due to the particular
characteristics of off-grid electricity prosumers, it is difficult for the government to
regulate their use of electricity. The oversight responsibility of collecting such RE
surcharge, therefore, should be shared among the government, relevant stakeholders,
and the public.
Secondly, the government should make every effort to guarantee timely payment
to projects qualified for receipt of FIT subsidies. Prompt payment to the project, as
has been demonstrated in the model, translates into significantly higher NPV and a
shorter payback period. Delay in payment, in contrast, can have an adverse effect on
the profitability of the project, resulting in a 24.1% decrease in the NPV of the
proposed project. In consideration of such consequences, it is necessary that the
government further streamline the verification and approval process for project
enlistment under the REDF to ensure prompt payment of FIT subsidies.
Recognizing the delay in the approval process, the government took the first step
to streamline the bureaucracy. The Chinese central government announced in January
87
2020 that the catalog system for managing renewable energy subsidy list will be
changed to a list system (Ministry of Finance, 2020c). Under the old catalog system,
the project owners directly submit applications to the NEA website, with the central
government performing the majority of verification duties. Newly approved projects
within a certain period, expanding from months to even years, are compiled into a
catalog. Once the catalog is made public, the projects are officially included under the
FIT scheme. From 2012 to 2018, a total of 7 catalogs were published, covering an
installed capacity of 167 GW (China Everbright Securities, 2019). Those catalogs
were approved with a large time gap between one another, the farthest being 22
months apart (China Everbright Securities, 2019). What that means is, once a project
misses the submission deadline for the last catalog, it will have to wait for another 22
months before it could be officially included under the subsidy list.
The new list system reduces the burden on the central government by assigning
most verification duties to the regional power grid companies and provincial energy
departments. The power producers submit applications to the regional power grid
company for the first round of screening, which is then passed on to the provincial
energy department for a re-examination. After two rounds of initial screening, the
application will be eventually presented to the central government for final
confirmation (Policy Graph, 2021). At the time of writing, there have been 10 lists
approved in 2020 and 9 lists approved in 2021 (Policy Graph, 2021). Before the list
system was introduced in 2020, solar projects included under the subsidy list only
account for 24.6% of all commissioned solar projects by total installed capacity
88
(China Electricity Council, 2020). Similarly, for wind, the capacity that is covered by
subsidy makes up only a portion of the total installed capacity by the end of 2019, at
66% (China Electricity Council, 2020). In 2020 and 2021, the new list system
prompted a surge in the number of newly approved projects; many eligible projects in
stock that were waitlisted finally received approval for enlistment. By the end of the
first quarter in 2021, the proportion of renewable energy projects included under the
subsidy accounts for 59.7% of total renewable projects by installed capacity.11
Although the reform in the subsidy list management has allowed more projects to
enjoy the benefit of the FIT scheme, there is still room for policy improvement. The
19 lists published after the initiation of the new list system are not exhaustive; there
are eligible projects in stock that have been waiting in line but yet to receive the first
payment of promised subsidy. In addition, viewing from a different angle, as more
projects in stock are approved for receipt of subsidy, more pressure is put on the
government to effectively manage the widening funding gap in the REDF. If the
government fails to inject fresh revenue streams into the REDF, the loss will be
eventually borne and shared by each project owner in the form of a shrunken subsidy
payout ratio.
Thirdly, the government should consider hiking the RE electricity surcharge rate
to fill the funding gap in the REDF. The current RE surcharge rate on industrial and
commercial consumption has not been raised since 2016, while the current rate on
residential use has remained at 0.001 CNY/kWh since initiation. The graph below
11 The data on the total installed capacity of renewable energy is from NEA (2021). The data
on capacity included under FIT is extracted from Luan (2021).

89
demonstrates the per-unit RE surcharge as a percentage of total electricity tariffs in
three administrative regions of China. Although the electricity pricing system varies
among different regions, some more complex than others, the graph provides a
general depiction of the burden of RE surcharge on end consumers. In the
above-mentioned three administrative regions, residential RE surcharge takes up less
than 0.2 percent of the total per-unit electricity price, whereas industrial RE surcharge
accounts for roughly 3% of the total electricity tariffs.
Figure 8: RE surcharge as a percentage of electricity tariffs in three municipalities
(province) in 202012
12 Each province or municipality in China enforces a unique electricity pricing system. The
rate structures and the tariffs therein are very distinctive across regions. The electricity tariffs
for the above-mentioned 3 regions refer to a specific rate in a tiered pricing structure, instead
of the average within the same structure. For example, if the pricing system is seasonal, the
author refers to the non-summer rate. If the structure is based on time of use, the author
selects the non-peak and non-trough hour rate. If the pricing system is based on peak demand,
90
Some developed economies that administer a similar pricing structure record a
substantially higher RE surcharge rate. In Germany, for example, the RE electricity
surcharge, or the EEG (Erneuerbare-Energien-Gesetz) rate accounted for 23% of
electricity price for private households consuming between 2,500 and 5,000 kWh in
2017 (Federal Ministry of Economic Affairs and Energy, 2021b). The BMWI,
Germany’s Ministry of Economic Affairs and Energy, reduced the EEG rate for two
consecutive years from 6.880 ct/kWh in 2017 to 6.405 ct/kWh in 2019 (Federal
Ministry of Economic Affairs and Energy, 2021a), yet the rate remains considerably
higher than that in China. Japan, on the other hand, also registers a higher share of RE
surcharge in the total electricity tariff than China. According to Japan’s Ministry of
Economy, Trade and Industry (2020), the percentage of RE surcharge in total
electricity bills for industrial and commercial use was 15%, while that for residential
electricity use was 11% in 2019. The unit price of RE surcharge has also increased
after the FIT scheme was implemented in Japan in 2012. The surcharge rate in 2012
was 0.22 JPY/kWh but substantially increased to 2.95 JPY/kWh in 2019 and 2.98
JPY/kWh in 2020 (Tokyo Electric Power Company Holdings, 2019).
An increase in the electricity bill, no matter how minimal, might significantly
impact China’s poorest households. Premier Li Keqiang stated at the third press
conference of the 13th National People's Congress that 600 million Chinese were
living on a monthly income of 1,000 CNY (150 USD) (Xinhua News, 2020b). Hiking
the RE surcharge on residential consumption would greatly affect those living under
the author refers to the middle-level demand for residential use and the highest level of
demand for industrial use.
91
the minimum wage line. With that said, a raise in the RE surcharge on industrial
end-users might serve as a reasonable starting point in order to narrow the funding
gap in the REDF. For the next steps, the government can also consider a combination
of increasing the RE surcharge rate for residential electricity consumers and a direct
transfer program targeted towards the poorest households. By targeted transfer, the
government could alleviate the financial burden on the poor and allow the recipients
to pay for electricity bills.
Fourthly, although the REDF was erected for the sole benefit of renewable energy
development, a portion of the fund has been exploited to support the development of
non-renewable energy. The fund has been struggling to feed the hungry mouths of
renewable energy producers, and the gap between the supply and demand of FIT
subsidies has been widening since the fund’s inception. However, the government has
allocated a portion of the REDF to support the growth of non-clean energy. According
to a 2019 government document, the funding from REDF has been used to support the
exploitation and utilization of unconventional natural gas such as coalbed methane,
shale gas, and tight gas (Ministry of Finance, 2019). The subsidy standard in 2018 was
fixed at 0.3 CNY/cubic meter, which was then changed to a progressive scheme in
2019.
Additionally, since the announcement of the first subsidy catalog in 2012,
multiple waste incineration projects were enlisted under the REDF subsidy list,
exploiting the revenue from RE electricity surcharge (Ministry of Finance, 2012). To
begin with, municipal solid waste is sourced from everyday items we use and then
92
throw away, and therefore, it is non-renewable in a technical point of view. Moreover,
the sustainability of waste-to-energy technology is highly debatable. In a study of the
environmental impact of municipal solid waste incineration projects in France, Beylot
& Villeneuve (2013) highlighted the large variability among waste-to-energy
technology, depending on the incinerator technical characteristics. Indeed, even
though the potential adverse effects of waste-to-energy projects on the climate and
environment might be varied, the possibility of tremendous environmental burdens
cannot be overlooked. The director of NCSC, Li Junfeng, opposes the inclusion of
waste-to-energy projects under the REDF, saying that incineration is a measure to
treat urban and rural waste, and should not compete with wind and solar projects for
the limited funding resource under the FIT scheme (Zheng, 2019).
7.2 Reallocate public resources from fossil fuel subsidy
A subsidy swap – reallocation of the savings from reducing fossil fuel subsidy to
fund the clean energy transition – could magnify the contributions to long-term
emissions reduction (Bridle et al., 2019). Indeed, the provision of subsidies for fossil
fuels not only drains limited public resources but also impedes the development of
sustainable technologies. A clean energy subsidy swap could free up resources for
more pressing priorities and address the widening funding gap for renewables under
the FIT scheme. The Global Subsidies Initiative refers to subsidy swap as a
redirection of government resources with two key elements that can take place

93
independently: 1) fossil fuel subsidies are reduced and; 2) measures are taken to
increase the deployment of sustainable energy (Bridle et al., 2019). Since the paper
has already discussed extensively how to stimulate renewable energy deployment
from the perspective of policy-makers, this section will be mainly centered upon the
current status of fossil fuel subsidies in China and the possibility to reallocate such
resources to renewables.
There is no consensus over the current volume of fossil fuel subsidies in China
due to the various measurements among different institutions. The IMF uses the
broader definition based on post-tax consumer subsidies, as opposed to pre-tax
consumer subsidies that are more widely adopted. The difference between the two
concepts is that post-tax consumer subsidies give full consideration to two forms of
taxation – both a general excise tax and a levy on negative externalities such as local
pollution, traffic congestion, and global warming (IMF, 2021). The IMF includes the
hidden effects of these externality costs, which represent another form of subsidy to
fossil fuels. According to the IMF estimates, the total post-tax subsidies for fossil
fuels in China have reached 1791.8 billion USD in 2017, the largest component being
the externalities on local air pollution at 1093.6 billion USD (IMF, 2021). The IEA,
on the other hand, uses the measurement of pre-tax consumer subsidies. The fossil
fuel subsidies in the IEA standards are broken down by energy source, including
subsidies for oil, electricity, and gas. As shown in the graph below, the total amount
of subsidies given out to fossil fuels in China was estimated by the IEA at roughly 51
billion USD in 2018 and 30 billion USD in 2019.
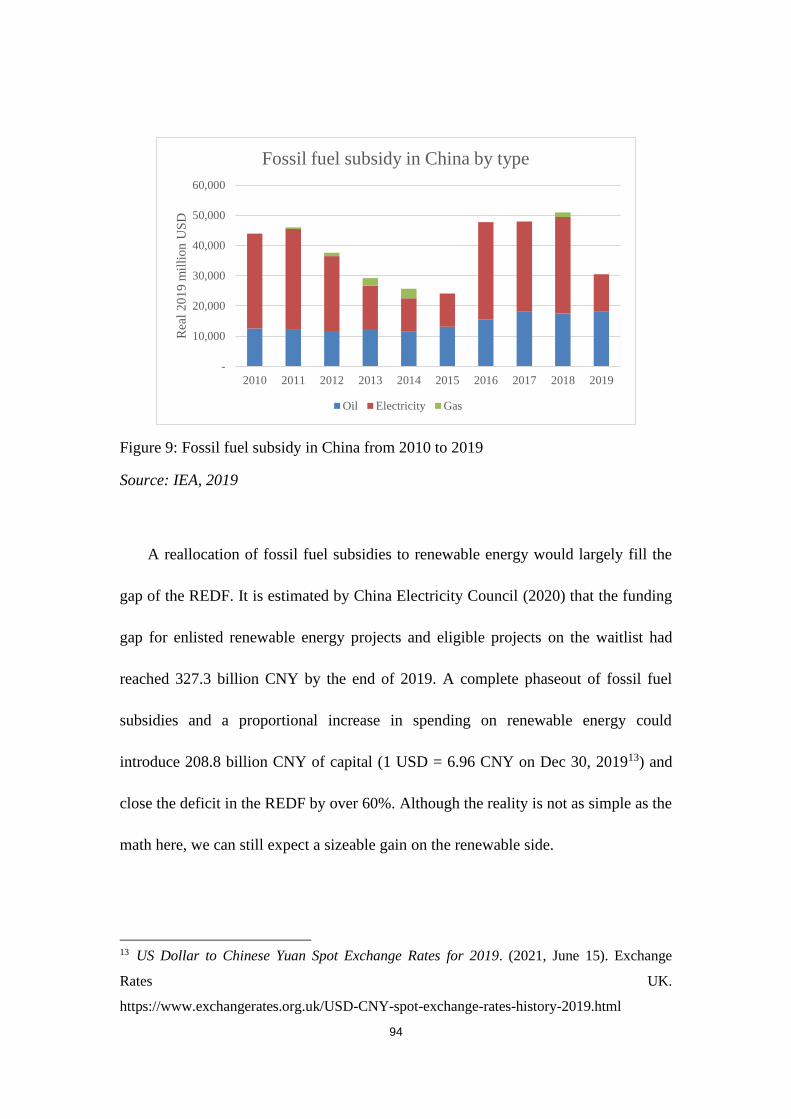
94
Figure 9: Fossil fuel subsidy in China from 2010 to 2019
Source: IEA, 2019
A reallocation of fossil fuel subsidies to renewable energy would largely fill the
gap of the REDF. It is estimated by China Electricity Council (2020) that the funding
gap for enlisted renewable energy projects and eligible projects on the waitlist had
reached 327.3 billion CNY by the end of 2019. A complete phaseout of fossil fuel
subsidies and a proportional increase in spending on renewable energy could
introduce 208.8 billion CNY of capital (1 USD = 6.96 CNY on Dec 30, 201913) and
close the deficit in the REDF by over 60%. Although the reality is not as simple as the
math here, we can still expect a sizeable gain on the renewable side.
13 US Dollar to Chinese Yuan Spot Exchange Rates for 2019. (2021, June 15). Exchange
Rates UK.
https://www.exchangerates.org.uk/USD-CNY-spot-exchange-rates-history-2019.html
-
10,000
20,000
30,000
40,000
50,000
60,000
2010 2011 2012 2013 2014 2015 2016 2017 2018 2019
Rea
l 2
01
9 m
illi
on U
SD
Fossil fuel subsidy in China by type
Oil Electricity Gas

95
The logic behind a reduction in subsidy for fossil fuels is to increase the price of
the commodity over the cost. The IMF (2021) recommended several approaches
based on country experiences. Firstly, there should be gradual step-by-step price
increases for fossil fuels. Since a subsidy reimburses the producer for the cost in
excess of the price accepted by the consumer, a gradual increase in the commodity
price will rebalance the equilibrium and reduce subsidy expenses for the government.
In addition, the IMF also suggests targeted programs or cash transfers in the
protection of the poor against the adverse impact of a price spike in fossil fuel
commodities. A comprehensive energy sector reform plan is also mentioned as a key
ingredient to a successful subsidy swap program. As an important component of the
reform plan, an efficient carbon pricing system is highly demanded. By putting a halt
to the current emission trajectory, a nationwide carbon market could potentially
discourage further investment into fossil fuels and thereby redirecting more funding
resources into the renewable sector. Moreover, since fossil fuels and renewables are
substitutes in the power market, by enforcing an emissions trading system, the
Chinese government could galvanize more demands for renewables and eventually
seal the price gap in renewable power production. In fact, the country has already
begun pilot emission trading schemes (ETS) in 7 provinces and municipalities since
2011 (Tan Jiao Yi, 2021). In 2017, China decided to implement the ETS nationwide,
initially covering the power generation sector and later expanding to seven other
sectors (IEA, 2020d). The Ministry of Ecology and Environment (2021) issued the
96
official policy announcement by the end of 2020 and scheduled the measures to come
into effect in February 2021.
7.3 Provide alternatives to the FIT subsidy
In light of the Chinese government’s resolution to gradually phase out subsidy
under the FIT scheme, it is imperative to develop other market-based funding
mechanisms for renewable energy power producers as alternatives to the current
subsidy system. Although as the results demonstrate, the withdrawal of FIT subsidy
will do nothing but hurt the development of renewable energy by squeezing the
already thin profit margin, the government’s intention to cut down FIT subsidy is
unquivering. In response to the trend of a decreasing FIT subsidy, the author here
proposes three measures as alternatives: 1) encourage public and private financial
institutions to provide easy-to-access debt capital to renewable energy projects; 2) an
effective taxation system that delivers tangible benefits to renewable power producers;
3) expand the market for Green Power Certificates;
Firstly, the government should encourage low-cost and easily accessible term
loans to renewable energy power producers as an alternative source of financing. Qin
(2020) suggests that the most plausible means to narrow the funding gap in the REDF
is to issue the so-called government-based agency bonds. He recommends that the
first round of agency bonds total 300 billion CNY with a tenor of 20 years, which
would fully cover the accumulated deficit of the REDF by the end of 2020. The
97
interest rate, Qin estimates, could be as low as 3%, or even 2%, assuming equal
credibility as a government bond in the same time. As promising as it might sound,
the author posits that an interest rate on a loan to renewable energy projects cannot be
held as equivalent to a government bond with the same maturity, considering the
business risk and project-specific risk associated with renewable energy projects. On
top of that, assuming the obligations of a 300 billion CNY debt instrument that is
correlated to a single industry, if managed poorly, might have a ripple effect on the
agency’s balance sheet, and therefore could be very risky for the issuer.
A fully-fledged financing mechanism for renewable projects requires interaction
of multiple policy channels and the consorted efforts of all stakeholders and the
general public. Although this paper is confined to discuss the actions of the
government, we should also highlight the indispensable role of the private sector. To
the benefit of the renewable sector, the public now has a growing appetite for green
investing and the financial institutions are increasingly lenient on lending to
renewable projects. Needless to say, the government should also assume its duty to
create a favorable financing environment for the borrowers. To begin with, the
government should establish a set of reporting metrics to be routinely disclosed to the
investors. Such transparency can mitigate investors’ concerns over project-specific
risks and reduce borrowing costs for power producers arising from information
asymmetry. Since the repayment of debt is contingent on the performance of the
power plant, or more specifically, on uncontrollable factors such as the intensity of
natural resources, there is also a fundamental need to enhance the credibility of the

98
project and lower payment default risk. In that regard, the government could
encourage the use of credit enhancement facilities such as guarantees provided by the
government, or first-loss provisions supported by major banks.
Secondly, the current taxation landscape on renewable power projects could be
improved to deliver more tangible benefits to power producers. The government
should extend the corporate income tax exemption policy to cover a longer period of
the project’s operation. As have been demonstrated with the model, the tax break
prescribed by the Chinese government – zero rates during the first 3 years of
operation and halved rate in the subsequent 3 years of operation – overlaps with the
accounting treatment of net operating loss carryforwards and therefore only has a
marginal impact on the project. With consideration for the NOLC treatment, only a
corporate income tax reduction in the years after the fifth period of operation would
bring concrete profit to the project. In response to a decreasing FIT price, the
government could revise the current corporate income tax exemption program to
stimulate the development of renewable energy power production. In fact, the tax
exemption policies could replace the FIT scheme as the major supportive program for
renewable power generation. As has been discussed before, the administration of the
FIT scheme in China is overcomplicated and inefficient. Conversely, tax exemption
policies directly benefit power producers by changing their accounting treatment and
thereby, their tax expenses and overall profitability.
On the other hand, a reduction in the VAT rate would directly benefit the end
consumers with no material impact on power producers. This is because a shrinking

99
VAT rate reduces the revenue and the cost of the project simultaneously and
proportionally. On that account, a reduction in the VAT rate would transfer the
economic value equivalent to the VAT to the end consumers, by-passing the power
producers. However, a decrease in the VAT rate could invigorate the consumption of
renewables and thereby incentivize the deployment of renewable power.
In addition to the current corporate tax break and a reduced VAT rate, the
Chinese government could also resort to other preferential tax policies to lure in
investors. The PTC and ITC structures in the U.S. might serve as a valuable reference.
The Production Tax Credit (PTC) is a dollar-for-dollar offset of taxes due, contingent
on the total electricity generation output of the renewable power plant. The PTC rate
for wind projects is equal to 2.5 US cents per kWh of generation, and the claim of
such credits is based on the year the project starts construction (Thomson Reuters,
2021). In comparison, the Investment Tax Credit (ITC) offsets taxes due based on the
capital investment value of the project, or more specifically, the CAPEX of the
project. Solar project owners are eligible for claiming 26% of the project’s capital
costs if they start construction between 2021 and 2022 (Thomson Reuters, 2021). The
unused ITC amount can be carried backward for 1 year and forward for 20 years, after
which half of the unused ITC amount will expire while the other half remains
deductible (U.S. Department of Energy, 2021). The PTC is paid out in 10 years and
any unused amount can also be carried forward into future fiscal years, although the
PTC scheme has been phased out for projects commencing construction after 2020
(Congressional Research Service, 2020). Two key characteristics of the PTC and ITC
100
schemes in the U.S. could offer some insight for China. Firstly, under both PTC and
ITC structures, the amount of tax credits is dependent on the specifics of the project,
either capital costs or total electricity generation. Such structures might deliver higher
economic value to certain projects than corporate tax rate reduction. Secondly, PTC
and ITC can be carried forward to offset taxes payable in future periods. Hence, tax
credit structures, by design, have a larger impact on a project’s profitability and can
ensure tangible benefits to power producers.
Thirdly, the government should stimulate the demand for Green Power
Certificates as an alternative to FIT subsidies. The subsidy under the FIT scheme
takes two forms: a per-unit subsidy that is equal to the difference between
grid-connection price and generation cost, and a lump-sum subsidy that disregards the
price gap. The Chinese government stipulates that the sales price of GPC shall not
exceed the amount of subsidy under the FIT scheme, and the amount of power
generation renumerated by GPC will no longer be eligible for FIT subsidy (Han,
2020). Since the GPC is traded in an open market based on the demand-and-supply
balance, the price of GPC in a perfectly competitive market should equate to the
difference between generation cost and sales price. Therefore, regardless of the
payment schedule, the GPC brings the same economic value as the per-unit subsidy
under the FIT scheme.
With consideration for the delay in FIT subsidy payment, a fully functional GPC
trading system can outperform the FIT scheme with its timely payment schedule. The
GPC is traded in an open market in real-time, which means that buying and selling
101
have no apparent delay. According to the transaction manual of GPC, sales revenue
will be transferred to the seller in the next business day after the transaction (National
Renewable Energy Information Management Center, 2017). In conclusion, an
efficient GPC system with sufficient trading volume will benefit the power producers,
and in the meantime, lessen the financing burdens of the REDF by reducing the
demand for FIT subsidies.
Nevertheless, the current GPC system still awaits reform. As of now, the GPC
system in China has remained a trial run and only demonstrated limited effect. To
start with, the pricing mechanism of GPC is defective due to significantly off-balance
demand and supply. The number of registered GPC exceeds 31 million, while the
number of GPC sold only totals 70 thousand, and that leaves over 31 million of GPC
available for sale in the market (GPC Trading Platform, n.d.). Currently, the price of
GPC is settled through negotiation between the seller and the buyer. Once sold, the
corresponding GPC will be unregistered on the platform and cannot be repurchased
by another entity (National Renewable Energy Information Management Center,
2017). Moreover, since the GPC scheme was introduced before and independently
from the RPS scheme in China, the two schemes had remained unattached under most
circumstances. The main purpose of the GPC, as stated by the government, has been
to provide alternative funding to the FIT subsidy, and the enforcement of the scheme
has been based on voluntary commitment of individuals, companies, and public
entities.
102
Conversely, in the U.S., where the REC system has been operating for decades,
the pricing mechanism functions with a higher level of economic efficiency. The REC
system in the U.S. operates in conjunction with the RPS program, which has been
enacted as a mandatory renewable energy policy in 29 states and the District of
Columbia (U.S. Energy Information Administration, 2019). To fulfill the enforceable
renewable energy consumption goals under the RPS scheme, utilities that fall short of
the mandated requirements purchase RECs from other power suppliers with excess
renewable power generation. Since there exists ample demand and supply, the price of
such RECs is determined in a competitive environment with sufficient consideration
for factors such as the vintage year, type of technology, project location, and whether
the RECs were generated for RPS compliance (“Renewable Energy Certificate
(United States),” 2021).
The amalgamation of RPS and REC in the United States offers some valuable
lessons to be learned. Until today, China has mainly relied on the FIT scheme for the
promotion of renewable energy electricity. The FIT scheme has undoubtedly led to an
initial expansion in renewable deployment and thereby resulting in further technology
improvement and cost reduction. However, it can only go thus far by itself. After the
initial stage, it is time for China to introduce a complementary mechanism that is
more market-oriented and cost-effective for the state government. A reform of the
current RPS scheme could address the growing funding deficit under the FIT scheme
and possibly invigorate further development in renewables. The NEA published a
draft policy in April 2021, proposing to raise the share of electricity generated from
103
wind and solar to 11% by the end of 2021, followed by a year-on-year increase that
would eventually lead to 16.5% of total electricity from wind and solar by 2025
(Credit Energy, 2021). A complementary RPS scheme could set a consumption target
that approximates 16.5% with a certain degree of differentiation among provinces.
7.4 Reduce the abandonment rate of wind and solar power plants
Efficient use of public resources is attained only when the abandonment rates of
wind and solar projects are minimized. When the installed capacity exceeds the
absorptive capacity of the region, the excess will either have to be transmitted to
another region for consumption or abandoned. The overall abandonment rate of
renewable energy has fallen from 16% in 2012 to 3.6% in 2021 (State Grid New
Energy Cloud, 2021). However, the abandonment rate is still higher in certain regions.
The main reason behind the abandonment of resources is the underdevelopment of
inter-provincial transmission networks. To address the root of the issue, the
government could explore a mixture of policies. For a starter, the government can
introduce energy storage technology to renewable power generation; this could
mitigate the intermittency of renewable electricity as well as reduce the abandonment
of extra capacity. Meanwhile, demand-side management could be employed to
contract consumer demand during peak hours and thereby reducing the need for
installing excess capacity.
104
Aside from immature transmission networks, another reason for the abandonment
of renewable energy in certain areas arises from illegal action of solar plant owners,
who secretly install additional photovoltaic panels in an attempt to inveigle more
subsidy from the public pocket (Hou & Lu, 2020). Since the subsidy payment under
the FIT scheme is contingent on the actual output of the power plant, once the project
is enlisted for FIT subsidies, some solar plant operators covertly install more solar
modules so that the total electricity generation would be higher. In response, the
government can put a cap on the abandonment rate for eligible projects and retract
FIT subsidies once the maximum threshold is breached. Such a policy will encourage
government oversight on project specifics and guarantee an efficient allocation of
public goods, such as land, to the most trustworthy. Moreover, a maximum
abandonment rate would also pressure individual power producers to make sure their
plant is performing to its utmost. If regulations punish power producers who
arbitrarily abandon excess capacity, those deceivers would be deterred from
deploying extra units in the first place.

105
8 Conclusion
The economic feasibility of a ground-mounted, grid-connected, and centralized
solar PV project located in Zhejiang Province is assessed. With the discounted cash
flow model as a foundation, the author performed a sensitivity analysis to study the
impact of different policy schemes on the profitability of the proposed project. The
results show that the project will only have a positive NPV when funded 13% or more
by debt. In addition, the model demonstrates that the curtailment in the FIT subsidy
payout ratio will reduce project NPV by 24.1%. Moreover, the current preferential tax
policy for renewable power producers delivers only minimal benefit to power
producers, increasing the equity IRR of projects with distinctive debt ratios by
approximately 1%.
This thesis constructs policy recommendations in accordance with the outputs of
the discounted cash flow model. By performing a sensitivity analysis, the impact of a
change in key assumptions is visibly displayed in the key financial measurements.
Based on the changes in project NPV, IRR, and PBP, the following conclusions are
drawn:
(1) Delayed or curtailed subsidy payment under the FIT scheme can materially impact
the economic feasibility of renewable power generation projects. The main reason
behind the growing deficit in FIT funding is the inefficient administration of the
REDF. To address this issue, the government should first make every effort to
106
raise the collection rate of RE electricity surcharge. Secondly, to ensure timely
payment of FIT subsidies to power suppliers, the government could further
streamline the application and verification process for renewable projects to be
included under the FIT scheme. Additionally, the government could consider
hiking the RE surcharge rate for industrial and commercial users. Last but not the
least, the government should stop funding non-renewable projects with the REDF.
(2) China still heavily subsidizes fossil fuels. An efficient and fully functioning
emissions trading system at the national level that covers all sectors could put a
price tag on the negative externalities associated with the use of fossil fuels, and
facilitate the reallocation of capital resources to renewable energy.
(3) In the context of a fading FIT scheme, the government could rely on alternative
support schemes that are more cost-efficient and market-oriented. Firstly, the
availability of accessible and cost-efficient financing is key to the survival of a
renewable power plant. Given that the FIT payment is most often delayed and
curtailed, the government could encourage private sector involvement in
renewable investments by creating a favorable business environment. Secondly,
the government could consider reform to the current preferential tax policy to
deliver more tangible benefits to the power producers. The tax break does not
impose a financial burden on electricity consumers and requires less government
administration. Thirdly, the market for GPC could be expanded by imposing
mandatory but differentiated RPS targets for each province.
107
(4) The abandonment rate of wind and solar resources could be further decreased by
implementing technologies such as efficient transmission networks and
demand-side management.
The paper adopts both quantitative and qualitative approaches to analyze the
policy impact of China’s current subsidy schemes on renewable power production.
The uniqueness of this paper is that it extensively discusses the evolution of China’s
subsidy schemes, and proposes policy recommendations based on an economic
feasibility analysis. However, the paper is not without flaws. The author wants to
direct readers’ attention to the following limitations:
(1) The financial model in this study is constructed using generalized assumptions.
The economic feasibility of the proposed project might not truly reflect the cost
structure, financing needs, and policy context of a renewable energy power
generation project in reality. In addition, since the electricity pricing system in
China is differentiated among provinces, the author chose her hometown,
Zhejiang Province, as the location for the hypothetical project due to limited time
and resources. The conclusions of this thesis should be applied with caution on
projects located in other provinces in China.
(2) The paper is written during the transitional period for the RPS and ETS schemes
in China, and therefore the author cannot discuss the policy implications of the
RPS and ETS schemes extensively. The RPS scheme has started a trial run in
108
2019 and was scheduled to become legally binding in 2020. On the other hand, a
nationwide ETS scheme was announced by the end of 2020; the efficacy of such a
scheme has not been reported.
(3) Each policy recommendation for reform in the current subsidy scheme in China
was proposed under separation frames. In other words, the author has not
considered the sum of the individual impacts of the policy mechanisms proposed
in this thesis.
Due to limited time and resources, the research as presented is not
all-encompassing. Therefore, the author would also like to stimulate future research in
the areas below:
(1) The author identified the low collection rate of RE electricity surcharge as a key
reason behind the REDF being underfunded. Further research could focus on the
policy and regulatory solutions to a low RE surcharge collection rate.
(2) The author proposed raising the RE surcharge rate as a last resort if the REDF still
runs a deficit at a 100% RE surcharge collection rate. However, the scope (raising
surcharge rate for industrial or residential use, or both?), the potential impact
(does a rate hike adversely impact electricity end-users?), and the scale (by how
much should the rate be further increased?) of such a hike remain topics for future
research.
109
(3) The author also proposed reform in current preferential tax policies. In particular,
the author referred to the PTC and ITC in the United States, claiming that the
eligibility for tax credits to be carry forward could deliver tangible benefits to
power producers if the tax scheme is implemented in China. However, the author
acknowledges that the taxation systems in China and the United States are vastly
different and it requires further research to prove the tax credits system applicable
to China.
(4) Lastly, the author draws on the experience of foreign countries in claiming that a
fully-developed RPS system would expand the GPC market in China. However,
the GPC system was introduced earlier and separately from the RPS scheme in
China. Therefore, further research is recommended to study the stimulus effect of
the RPS scheme on the GPC system in China.
110
Bibliography
2020 Wind power investment monitor & 2019 PV Market environment monitor.
(2020). China Energy Portal.
https://chinaenergyportal.org/2020-wind-power-investment-monitor-2020-pv-
market-environment-monitor/
Barbose, G. L. (2019). U.S. Renewables Portfolio Standards: 2019 Annual Status
Update | Electricity Markets and Policy Group [Slides]. Berkeley Lab.
https://emp.lbl.gov/publications/us-renewables-portfolio-standards-2
Beijing Power Exchange Center. (2021). Notice of Trading Rules for Electricity
Excess Consumption (Trial) in Beijing (Translated).
https://www.china5e.com/uploadfile/2021/0128/20210128035810985.pdf
Beylot, A., & Villeneuve, J. (2013). Environmental impacts of residual Municipal
Solid Waste incineration: A comparison of 110 French incinerators using a life
cycle approach. Waste Management, 33(12), 2781–2788.
https://doi.org/10.1016/j.wasman.2013.07.003
BNEF. (2021). China Country Profile.
https://www.bnef.com/core/country-profiles/chn
Bridle, R., Sharma, S., Mostafa, M., & Geddes, A. (2019). Fossil Fuel to Clean
Energy Subsidy Swaps: How to pay for an energy revolution. International
Institute for Sustainable Development.

111
https://www.iisd.org/system/files/publications/fossil-fuel-clean-energy-subsid
y-swap.pdf
Carbon Neutrality: Paths and Options for Energy Transition (Translated). (2021,
March 22). China Alliance of Social Value Investment.
https://www.casvi.org/h-nd-1168.html
Chen, J. (2019). Representative Cao Renxian: It is recommended to increase the price
of renewable energy surcharge by 1 cent (Translated). Chinese Peasants and
Workers Democratic Party.
http://www.ngd.org.cn/jczt/jj2019qglk/2019fcsl/62425.htm
China Construction Bank. (2015). Chinese Yuan loan benchmark interest rate table
(Translated). http://www.ccb.com/cn/personal/interest/rmbcredit.html
China Electricity Council. (2020). Renewable energy subsidies in delay and policy
suggestions (Translated).
https://www.cec.org.cn/upload/1/pdf/1611189701502.pdf
China Everbright Securities. (2019). The history of the renewable energy development
fund (Translated).
https://pdf.dfcfw.com/pdf/H3_AP201910281369899774_1.pdf?157228628900
0.pdf
Climate Watch. (2018). Global Historical Emissions [Dataset].
https://www.climatewatchdata.org/ghg-emissions?calculation=CUMULATIV
E&chartType=percentage&end_year=2018®ions=WORLD&start_year=1990
112
Congressional Research Service. (2020, April). The Renewable Electricity Production
Tax Credit: In Brief. https://fas.org/sgp/crs/misc/R43453.pdf
Country Rankings. (2020). IRENA.
https://www.irena.org/Statistics/View-Data-by-Topic/Capacity-and-Generatio
n/Country-Rankings
CPIA. (2020). Analysis on the investment capital of photovoltaic power station and
the internal rate of return of total investment (Translated). BJX News.
http://guangfu.bjx.com.cn/news/20200610/1079889.shtml
CPNN. (2020). The Ministry of Finance re-emphasizes the principle of granting
subsidies for renewable energy with “revenue-based expenditures and clear
priorities” (Translated). http://www.cspplaza.com/article-18493-1.html
Credit Energy. (2021, April 21). Energy Database丨 16.5%: The proportion of
national wind and solar power generation will reach 16.5% in 2025
(Translated). Credit Energy.Gov.
http://www.creditenergy.gov.cn/article/6d4419459a5345029daecdebb1b304a9
Cucchiella, F., D’Adamo, I., & Gastaldi, M. (2017). Economic Analysis of a
Photovoltaic System: A Resource for Residential Households. Energies, 10(6),
814. https://doi.org/10.3390/en10060814
Dhimish, M., & Alrashidi, A. (2020). Photovoltaic Degradation Rate Affected by
Different Weather Conditions: A Case Study Based on PV Systems in the UK
and Australia. Electronics, 9(4), 650.
https://doi.org/10.3390/electronics9040650

113
Dong, F., Shi, L., Ding, X., Li, Y., & Shi, Y. (2019). Study on China’s Renewable
Energy Policy Reform and Improved Design of Renewable Portfolio Standard.
Energies, 12(11), 2147. https://doi.org/10.3390/en12112147
Du, Y. F. (2019, June 21). Ministry of Finance issues renewable energy tariff
subsidies. Xinhua News.
http://www.xinhuanet.com/power/2019-06/21/c_1210165971.htm
Dusonchet, L., & Telaretti, E. (2015). Comparative economic analysis of support
policies for solar PV in the most representative EU countries. Renewable and
Sustainable Energy Reviews, 42, 986–998.
https://doi.org/10.1016/j.rser.2014.10.054
Ezekiel, U. (2021). Energy Project Valuation Model (9.0.7) [Dataset]. BNEF.
https://www.bnef.com/insights/11068
Fan, R., Luo, X. Q., & Liu, Y. (2021, February 19). On electricity price and subsidy
policy of photovoltaic power generation projects (Translated). China Law
Insight.
https://www.chinalawinsight.com/2021/02/articles/environment-2/%E6%B5%
85%E8%B0%88%E5%85%89%E4%BC%8F%E5%8F%91%E7%94%B5%E
9%A1%B9%E7%9B%AE%E7%9A%84%E7%94%B5%E4%BB%B7%E4%
B8%8E%E8%A1%A5%E8%B4%B4%E6%94%BF%E7%AD%96/#_ftnref4
Federal Ministry of Economic Affairs and Energy. (2021a). State-imposed
components of the electricity price. Energy Prices and Transparency for
Consumers.

114
https://www.bmwi.de/Redaktion/EN/Artikel/Energy/electircity-price-compone
nts-state-imposed.html
Federal Ministry of Economic Affairs and Energy. (2021b). The electricity price.
Energy Prices and Transparency for Consumers.
https://www.bmwi.de/Redaktion/EN/Artikel/Energy/electricity-price-compone
nts.html
GPC trading platform. (n.d.). GPC Trading Platform. Retrieved June 10, 2021, from
http://www.greenenergy.org.cn/
Great Wall Securities. (2019). Zhejiang Province cuts coal-fired benchmark
electricity prices (Translated).
http://pdf.dfcfw.com/pdf/H3_AP201907171339214080_1.pdf
Guangdong Provincial Development and Reform Commission. (2021). Guangdong
Provincial Development and Reform Commission’s implementation plan for
the guarantee of renewable energy power consumption (for trial
implementation) (Translated).
http://drc.gd.gov.cn/gfxwj5633/content/mpost_3232684.html
Han, Y. R. (2020). Summary of Renewable Energy Surcharge and Subsidy Policy
(Translated). BJX News.
https://news.bjx.com.cn/html/20201210/1121314.shtml
Hou, B. L., & Lu, H. T. (2020, September 8). Photovoltaic capacity expansion: more
power generation, but also more management. China Law Insight.
https://www.chinalawinsight.com/2020/09/articles/environment-2/%E5%85%
115
89%E4%BC%8F%E5%A2%9E%E5%AE%B9%EF%BC%9A%E5%A4%9A
%E5%8F%91%E7%94%B5%E4%BA%86%EF%BC%8C%E4%B9%9F%E8
%A6%81%E7%AE%A1%EF%BC%81/
IEA. (n.d.). China Country Profile. Key Energy Statistics, 2018. Retrieved June 14,
2021, from https://www.iea.org/countries/china
IEA. (2019). Fossil fuel subsidies database 2010–2019 [Dataset].
https://www.iea.org/topics/energy-subsidies
IEA. (2020a). Data and Statistics [Dataset].
IEA. (2020b). National Survey Report of PV Power Applications in China 2019.
https://iea-pvps.org/wp-content/uploads/2020/09/NSR_China_2019.pdf
IEA. (2020c, May 13). Electricity mix in China, Q1 2020 [Dataset].
https://www.iea.org/data-and-statistics/charts/electricity-mix-in-china-q1-2020
IEA. (2020d, June). China’s Emissions Trading Scheme. China’s Emissions Trading
Scheme. https://www.iea.org/reports/chinas-emissions-trading-scheme
IMF. (2013). Reforming Energy Subsidies Summary Note.
https://www.imf.org/external/np/fad/subsidies/pdf/note.pdf
IMF. (2021). Fossil Fuel Subsidies. Climate Change: Fossil Fuel Subsidies.
https://www.imf.org/en/Topics/climate-change/energy-subsidies#Energy%20S
ubsidies
Industrial and Commercial Bank of China. (2015). Chinese Yuan loan interest rate
table (Translated).
http://www.icbc.com.cn/icbc/%E9%87%91%E8%9E%8D%E4%BF%A1%E6
116
%81%AF/%E5%AD%98%E8%B4%B7%E6%AC%BE%E5%88%A9%E7%8
E%87%E8%A1%A8/%E4%BA%BA%E6%B0%91%E5%B8%81%E8%B4%
B7%E6%AC%BE%E5%88%A9%E7%8E%87%E8%A1%A8/default.htm
International Institute of Green Finance, CUFE. (2019). The Development, Problems
and Suggestions of Green Power Certificate System in China (Translated).
Xinhua Finance. http://greenfinance.xinhua08.com/a/20190612/1844712.shtml
IRENA. (2019, November). Future of Solar Photovoltaic: Deployment, investment,
technology, grid integration and socio-economic aspects.
https://irena.org/-/media/Files/IRENA/Agency/Publication/2019/Nov/IRENA_
Future_of_Solar_PV_2019.pdf
Is the PV grid-connected benchmark electricity price adjusted reasonable?
(Translated). (2015). China Land.
http://www.chnland.com/news/changjianwenti/show-368.html
Li, B. (2019). Renewable energy power generation project subsidy funding gap
reaches 233.1 billion CNY (Translated). Sina Finance.
http://finance.sina.com.cn/chanjing/cyxw/2019-12-27/doc-iihnzahk0224638.sh
tml
Li, S., Wang, J., Liu, Q., Li, L., Hua, Y., & Liu, W. (2017). Analysis of Status of
Photovoltaic and Wind Power Abandoned in China. Journal of Power and
Energy Engineering, 05(01), 91–100. https://doi.org/10.4236/jpee.2017.51007
117
Li, Y. (n.d.). Analysis on the carbon emission problem of photovoltaic power
generation. China 5e. Retrieved June 14, 2021, from
https://www.china5e.com/m/news/news-931199-0.html
Luan, J. (2021). China Renewable Energy Subsidy Tool (1.0) [Dataset]. BNEF.
https://www.bnef.com/insights/26111?query=eyJxdWVyeSI6InN1YnNpZHkg
dG9vbCIsInBhZ2UiOjEsIm9yZGVyIjoicmVsZXZhbmNlIn0%3D
Measures for the Administration of Renewable Energy Electricity Surcharge Subsidy
Funds (Translated). (2020).
http://www.gov.cn/zhengce/zhengceku/2020-02/05/5474795/files/f9ad07b5d2
8f4f29b5ca576264a2245d.pdf
Ministry of Ecology and Environment. (2021). Measures for the Administration of
Carbon Emissions Trading (for Trial Implementation) (Translated).
http://www.mee.gov.cn/xxgk2018/xxgk/xxgk02/202101/t20210105_816131.h
tml
Ministry of Economy, Trade and Industry. (2020). Current status of renewable energy
at home and abroad: Proposal of issues of this year’s procurement price
calculation committee (Translated).
https://www.meti.go.jp/shingikai/santeii/pdf/061_01_00.pdf
Ministry of Finance. (2011). Notice on Issuing the Interim Measures for the
Administration of the Collection and Use of the Renewable Energy
Development Fund (Translated).
http://www.gov.cn/gongbao/content/2012/content_2131981.htm
118
Ministry of Finance. (2012). Renewable energy surcharge subsidy catalog (first batch)
announced (Translated).
http://www.gov.cn/banshi/2012-06/27/content_2171188.htm
Ministry of Finance. (2019). Supplementary Notice of the Ministry of Finance on the
“Interim Measures for the Management of Special Funds for the Development
of Renewable Energy” (Translated).
http://www.gov.cn/xinwen/2019-06/20/content_5401801.htm
Ministry of Finance. (2020a). Interpretation of “Promoting the Healthy Development
of Non-hydro Renewable Energy Power Generation” (Translated).
http://www.gov.cn/zhengce/2020-02/03/content_5474142.htm
Ministry of Finance. (2020b). Notice on review of the list of renewable energy power
generation subsidy projects (Translated).
http://www.gov.cn/zhengce/zhengceku/2020-03/23/content_5494490.htm
Ministry of Finance. (2020c). Opinions on promoting the healthy development of
non-hydro renewable energy power generation (Translated).
http://www.gov.cn/zhengce/zhengceku/2020-02/03/content_5474144.htm
Ministry of Finance. (2020d). Reply of the Ministry of Finance to Recommendation
No. 8605 of the Third Session of the Thirteenth National People’s Congress
(Translated). https://www.china5e.com/news/news-1101823-1.html
Ministry of Finance. (2020e). Supplementary Notice on Issues Related to “Opinions
on Promoting the Healthy Development of Non-hydro Renewable Energy

119
Power Generation” (Translated).
http://www.gov.cn/zhengce/zhengceku/2020-10/21/content_5552978.htm
The Ministry of Finance issues the 2021 renewable energy electricity surcharge
subsidy fund budget notice (Translated). (2020, November 23). National
Demand Side Management Platform.
http://dsm.ndrc.gov.cn/dsm_portalweb/rest/siteChannels/5487.html
National Bureau of Statistics. (2021, May). National Data [Dataset].
https://data.stats.gov.cn/english/easyquery.htm?cn=A01
National Renewable Energy Information Management Center. (2017).
Implementation Rules for Voluntary Subscription Transactions of Green
Power Certificates (for Trial Implementation) (Translated).
http://www.greenenergy.org.cn/upload/agreement/ssxz.pdf
NDRC. (2006). Trial Measures for the Administration of Renewable Energy Power
Generation Prices and Cost Sharing (Translated).
http://www.gov.cn/ztzl/2006-01/20/content_165910.htm
NDRC. (2007, January). Interim Measure on Allocation of Income from Surcharges
on Renewable Energy Power Prices.
https://chinaenergyportal.org/wp-content/uploads/2017/01/1-2007ChinaInteri
mMeasureonAllocationofRevenueonSurchargestoRenewableEnergyPowerPric
es-English-1.pdf
NDRC. (2013). National Development and Reform Commission on the use of price
leverage and the promotion of healthy development of the photovoltaic
120
industry (Translated).
https://www.ndrc.gov.cn/xxgk/zcfb/tz/201308/t20130830_963934.html
NDRC. (2016a). National photovoltaic power generation benchmark on-grid tariff
table (Translated).
https://www.ndrc.gov.cn/xxgk/zcfb/tz/201612/W020190905516172034585.pd
f
NDRC. (2016b). Notice of the National Development and Reform Commission on
Adjusting the Benchmarking On-grid Tariff for Photovoltaic and Onshore
Wind Power (Translated).
https://chinaenergyportal.org/notice-on-adjustments-to-feed-in-tariffs-for-onsh
ore-wind-and-pv-power/
NDRC. (2017). Notice on the Trial Implementation of the Renewable Energy Green
Power Certificate Issuance and Voluntary Subscription Transaction System
(Translated). http://www.gov.cn/xinwen/2017-02/03/content_5164836.htm
NDRC. (2018). Clean Energy Consumption Action Plan (2018–2020) (Translated).
https://www.ndrc.gov.cn/xxgk/zcfb/ghxwj/201812/W02019090549573935848
1.pdf
NDRC. (2019a). Notice of the National Development and Reform Commission on
Improving the On-grid Tariff Mechanism for Photovoltaic Power Generation
(Translated).
https://www.ndrc.gov.cn/xxgk/zcfb/tz/201904/t20190430_962433.html

121
NDRC. (2019b). Notice of the NDRC and the NEA on Actively Promoting Grid Parity
of Wind Power and Photovoltaic Power Generation (Translated).
https://www.ndrc.gov.cn/xxgk/zcfb/tz/201901/t20190109_962365.html
NDRC. (2019c). Notice of the NDRC and the NEA on Establishing and Improving the
Guarantee Mechanism for Renewable Energy Power Consumption
(Translated). http://zfxxgk.nea.gov.cn/auto87/201905/t20190515_3662.htm
NDRC. (2020). NDRC and NEA on the Responsibility Weights of Renewable Energy
Power Consumption in Each Provincial Administrative Region in 2020
(Translated).
https://www.ndrc.gov.cn/xxgk/zcfb/tz/202006/t20200601_1229674.html
NEA. (2018). National Energy Administration on Soliciting Opinions on the
“Renewable Energy Power Quota and Evaluation Measures (Draft for
Solicitation of Comments)” (Translated).
http://zfxxgk.nea.gov.cn/auto87/201803/t20180323_3131.htm
NEA. (2020a). National Energy Administration on the release of the ``2020 Wind
Power Investment Monitoring and Early Warning Results’’ And the notice of
``Results of Environmental Monitoring and Evaluation of the Photovoltaic
Power Generation Market in 2019’’ (Translated).
http://www.gov.cn/zhengce/zhengceku/2020-04/08/content_5500246.htm?ivk
_sa=1023197a

122
NEA. (2020b). The overall situation of national subsidy bidding for photovoltaic
power generation projects in 2020 (Translated).
http://www.nea.gov.cn/2020-06/28/c_139172962.htm
NEA. (2021). China’s installed renewable energy power generation capacity reaches
948 million kilowatts (Translated).
http://www.nea.gov.cn/2021-05/08/c_139932549.htm
Notice of the Ministry of Finance on Issuing the Budget of Additional Subsidy Funds
for Renewable Energy Electricity Prices in Advance for 2020 (Translated).
(2019). Ministry of Finance. http://www.tanjiaoyi.com/article-29515-1.html
Notice on the implementation of the Golden Sun Demonstration Project (Translated).
(2009). http://www.gov.cn/zwgk/2009-07/21/content_1370811.htm
Pickerel, K. (2017, June 5). What causes solar panel degradation? Solar Power
World.
https://www.solarpowerworldonline.com/2017/06/causes-solar-panel-degradat
ion/#:~:text=What%20causes%20solar%20panel%20degradation%3F&text=P
erformance%20declines%20as%20solar%20cells,80%25%20production%20at
%2025%20years
Policy Graph. (2021). State Grid New Energy Cloud.
http://sgnec.esgcc.com.cn/policygraph
Qi, Y., Lu, J. Q., & Zhu, M. Y. (2018, March 1). Wind curtailment in China and
lessons from the United States. Brookings-Tsinghua Center for Public Policy.

123
https://www.brookings.edu/research/wind-curtailment-in-china-and-lessons-fr
om-the-united-states/
Qin, H. Y. (2020). Issuing bonds to completely resolve renewable energy subsidies
payment delay (Translated). Wind Energy (Translated), 06(1).
The race to zero emissions, and why the world depends on it. (2020, December 2).
UN News.
https://news.un.org/en/story/2020/12/1078612#:~:text=The%20European%20
Union%2C%20Japan%20and,will%20do%20so%20before%202060
Renewable Energy Certificate (United States). (2021, June 12). In Wikipedia.
https://en.wikipedia.org/wiki/Renewable_Energy_Certificate_(United_States)
Renewable Energy Law of the People’s Republic of China (Amended according to the
Decision of the 12th Meeting of the Standing Committee of the 11th National
People’s Congress of the People’s Republic of China on December 26, 2009).
(2013).
http://english.mofcom.gov.cn/article/policyrelease/Businessregulations/20131
2/20131200432160.shtml
Renewable Energy Law of the People’s Republic of China (Translated). (2005,
February). http://www.gov.cn/ziliao/flfg/2005-06/21/content_8275.htm
Report: China emissions exceed all developed nations combined. (2021, May 7). BBC
News. https://www.bbc.com/news/world-asia-57018837

124
Reuters. (2016, September 15). China’s renewable energy subsidy gap this year is
expected to exceed 60 billion yuan (Translated).
https://www.reuters.com/article/instant-article/idCNKCS11L09H
Shanghai Development and Reform Commission. (2021). Shanghai Renewable
Energy Power Consumption Guarantee Implementation Plan (Translated).
https://www.shanghai.gov.cn/nw49248/20210218/8194104e217842bdb36e22
93a283df4b.html
Solar power in China. (2021, June 14). In Wikipedia.
https://en.wikipedia.org/wiki/Solar_power_in_China#Solar_PV_by_province
Sovacool, B. K. (2017). Reviewing, Reforming, and Rethinking Global Energy
Subsidies: Towards a Political Economy Research Agenda. Ecological
Economics, 135, 150–163. https://doi.org/10.1016/j.ecolecon.2016.12.009
State Council. (2010). State Council on Accelerating Cultivation and Development
Decisions on strategic emerging industries (Translated).
http://www.gov.cn/zwgk/2010-10/18/content_1724848.htm
State Council. (2015). Notice of the State Council on Adjusting and Improving the
Capital System of Fixed Asset Investment Projects (Translated).
http://www.gov.cn/zhengce/content/2015-09/14/content_10161.htm
State Grid New Energy Cloud. (2021). Renewable energy consumption overview
(Translated).
http://sgnec.esgcc.com.cn/renewableEnergy/consumptionSituation

125
State Taxation Administration. (2019). Corporate Income Tax Law of the People’s
Republic of China (Translated).
http://www.chinatax.gov.cn/chinatax/n810341/n810825/c101434/c28479830/c
ontent.html
Subsidy. (2021, April 27). In Investopedia.
https://www.investopedia.com/terms/s/subsidy.asp
Tan Jiao Yi. (2021, June 9). The blue print of a national emissions trading system
(Translated). http://www.tanjiaoyi.com/article-33649-1.html
Taylor, M. (2020). Energy subsidies: Evolution in the global energy transformation to
2050. IRENA.
https://www.irena.org/-/media/Files/IRENA/Agency/Publication/2020/Apr/IR
ENA_Energy_subsidies_2020.pdf
Thomson Reuters. (2021). Investment Tax Credit (ITC). Thomson Reuters Practical
Law.
https://uk.practicallaw.thomsonreuters.com/1-517-6442?transitionType=Defau
lt&contextData=(sc.Default)&firstPage=true
Tokyo Electric Power Company Holdings. (2019). The Unit Price of the Renewable
Energy Power Promotion Surcharge. The Unit Price of the Renewable Energy
Power Promotion Surcharge.
https://www.tepco.co.jp/en/corpinfo/illustrated/charge/1253688_6509.html
U.S. Department of Energy. (2021, February). Guide to the Federal Investment Tax
Credit for Commercial Solar Photovoltaics.

126
https://www.energy.gov/sites/prod/files/2021/02/f82/Guide%20to%20the%20
Federal%20Investment%20Tax%20Credit%20for%20Commercial%20Solar%
20PV%20-%202021.pdf
US Dollar to Chinese Yuan Spot Exchange Rates for 2019. (2021, June 15). Exchange
Rates UK.
https://www.exchangerates.org.uk/USD-CNY-spot-exchange-rates-history-20
19.html
U.S. Energy Information Administration. (2019). Renewable energy explained:
Portfolio standards. USEIA.
https://www.eia.gov/energyexplained/renewable-sources/portfolio-standards.p
hp
U.S. Energy Information Administration. (2021). Biomass—renewable energy from
plants and animals. USEIA. https://www.eia.gov/energyexplained/biomass/
Wang, H., & Lan, W. (2021, April 20). Renewable energy electricity consumption
trading opened in five southern provinces of China (Translated). China News.
https://www.chinanews.com/cj/2021/04-20/9459616.shtml
Wang, L., & Li, Y. (2017). Greenhouse gas (GHG) emissions and its influencing
factors in Beijing municipal solid waste incineration power plant. Chinese
Journal of Environmental Engineering, 11(12).
https://doi.org/10.12030/j.cjee.201705012
Wind power in China. (2021, June 6). In Wikipedia.
https://en.wikipedia.org/wiki/Wind_power_in_China

127
Wu, J. (2009). China wind: New feed-in tariff guidelines introduced. BNEF.
https://www.bnef.com/insights/1687
Xinhua News. (2020a). China’s CPI up 2.9 pct in 2019.
http://www.xinhuanet.com/english/2020-01/09/c_138690441.htm
Xinhua News. (2020b). Opinions on “600 million people earn 1,000 CNY a month”
(Translated).
http://www.xinhuanet.com/politics/2020-06/22/c_1126144559.htm
Yuan, J., Sun, S., Zhang, W., & Xiong, M. (2014). The economy of distributed PV in
China. Energy, 78, 939–949. https://doi.org/10.1016/j.energy.2014.10.091
Zhang, F., Deng, H., Margolis, R., & Su, J. (2015). Analysis of distributed-generation
photovoltaic deployment, installation time and cost, market barriers, and
policies in China. Energy Policy, 81, 43–55.
https://doi.org/10.1016/j.enpol.2015.02.010
Zhang, Y. H. (2021). Thinking and suggestions for China’s energy structure
transformation. International Petroleum Economics, 29(2).
Zhao, A., & Lin, J. Q. (2016). How big is the gap in the renewable energy
development fund? (Translated). Rock Environment and Energy Institute.
https://www.china5e.com/m/news/news-930901-1.html
Zhejiang Provincial Development and Reform Commission. (2019). Notice of the
Provincial Development and Reform Commission on the adjustment of
electricity prices (Translated).
http://fzggw.zj.gov.cn/art/2019/12/31/art_1599544_41397951.html

128
Zheng, X. G. (2019, February 27). Li Junfeng: renewable energy surcharge should be
fully collected and well used [Interview]. Wechat Official Platform.
https://mp.weixin.qq.com/s/JGhB0MCMxH7E-8VFqP0sfQ


