
1
August 14, 2003 Blackout
Summary based on NERC reports, Power System Engineering
Research Center Report, and DOE Reports
2
Overview
● Overview of power system and reliability● Pre-outage conditions on August 14● Trigger events and start of cascade● Wide area cascade● Root causes● Canada Restoration Activities
3
Reliability Overview
● Balance generation and demand● Balance reactive power supply and demand● Monitor flows and observe thermal limits● Observe power and voltage stability limits● Operate for unplanned contingencies● Plan, design and maintain a reliable system● Prepare for emergencies
Reliably operate the system you have!
4
3 Interconnections / 10 NERC Regions
5
NERC Control Areas
6
NERC Reliability Coordinators

2
7
Footprints of Reliability Coordinators in Midwest
8
Blackout Statistics60 Million people in 8 states and 2
provincesAlmost 62,000 Mw of load
PJM Interconnection – 4,000 MwMidwest ISO – 18,500 MwHydro Quebec – 100 MwOntario IMO – 21,000 MwISO New England – 2,500 MwNew York ISO – 24,400 Mw
34,000 Miles of Transmission290+ Generating Units
9
August 14 Conditions Prior to Blackout● Planned outages
Cook 2, Davis Besse nuclear plantsEast Lake 4, and Monroe 1
● Transfers high to northeast U.S. + OntarioNot unusually so and not above transfer limits
● Critical voltage dayVoltages within limitsOperators taking action to boost voltages
● FrequencyTypical for a summer day
● System was within limits prior to 15:05, on both actual and contingency basis
10
Warm But Not Unusual for August
11
August 14 Imports to Northeast-Central Compared to 6/1 to 8/13/2003
-8000
-6000
-4000
-2000
0
2000
4000
6000
0:00
2:00
4:00
6:00
8:00
10:00
12:00
14:00
16:00
18:00
20:00
22:00
Hour (EDT)
MW
Max ImportsMax ExportsAverage14-Aug
Impo
rtsEx
ports
16:00
12
Pre-Blackout Loads, Generation and Interchange
3
13
Voltages Prior to 15:05 EDT August 14
14
Frequency Typical for Summer Day
15
Blackout Sequence of Events
16
Characteristics of a Disturbance● Frequency excursions
Generation > Load = Frequency RiseGeneration < Load = Frequency Decline
● Voltage Excursions (in the blackout region)
Declines, leading to voltage collapse in some areas− Insufficient reactive power (VARs) is the
principal reason for voltage decline and collapse
Overvoltages after load trips
17
Frequency in Chattanooga, TN
18
Frequency excursions in the Midwest

4
19
Frequency in Ann Arbor, MI
20
Unusual Voltage Problems
21
“Softswitching Technologies – I-grid Monitors”
22
“Softswitching Technologies – I-grid Monitors”
23
“Softswitching Technologies – I-grid Monitors”
24
Voltage Collapse on Staten Island

5
25
Blackout was NOT Caused by
● Heavy wide-area transfers● Low voltages, voltage collapse● Lack of IPP voltage/reactive support● Frequency anomalies● Cinergy outages starting at 12:08● East Lake 5 trip at 13:31
Contributing factor to later events, but not by itself causal to the blackout
● DPL Stuart-Atlanta trip at 14:02Contributing factor to loss of MISO real-time monitoring, but not electrically significant 26
Blackout Sequence – Phase 1
27
Outage Sequence of EventsTransmission Map Key
ONTARIO
Transmission Lines
765 kV500 kV345 kV230 kV
Transmission Lines
765 kV500 kV345 kV230 kV
28
East Lake 5 Trip: 1:31:34 PM
ONTARIO
2
1
ONTARIO
29
East Lake 5 Exciter Failure Causes Trip
30
Stuart Atlanta Trip: 2:02 PM
ONTARIO

6
31
System Operator Comments
● Phone call from Cinergy operator to MISO Operator at 2:36pm:
“I hate to worry you, but I think we’re a trip away from … setting a little history.”
32
MISO State Estimator and Reliability Analysis
● MISO state estimator and contingency analysis ineffective from 12:37 to 16:04
State estimator not solving due to missing information on lines out in Cinergy then DPLHuman error in not resetting SE automatic trigger
● Using Flowgate Monitoring tool to monitor conditions on previously identified critical flowgates
33
FirstEnergy Computer Failures
● 14:14 Alarm processing subsystem fails and operators are not aware
No further status changes or alarms to FE operatorsReal-time displays no longer show current information
● 14:20 Several remote consoles fail● 14:41 EMS server hosting alarm processor and other
functions fails to backup● 14:54 Backup server fails
EMS continues to function but with very degraded performance (59 second refresh)FE system data passed normally to others: MISO and AEPAGC function degraded and strip charts flat-lined
● 15:08 IT warm reboot of EMS appears to work but alarm process not tested and still in failed condition
● No contingency analysis of events during the day including loss of East Lake 5 and subsequent line trips
34
Phone Calls between MISO and First Energy
● 3:36pm – MISO asks “… what is going on over there?”
● First Energy says they are unsure.● MISO replies, “I wonder what is
going on here. Something strange is happening.”
35
Phone Calls to FirstEnergy
● FE received calls from MISO, AEP, and PJM indicating problems on the FE system but did not recognize evolving emergency
14:32 AEP calls regarding trip and reclose of Star-S. Canton15:19 AEP calls again confirming Star-S. Canton trip and reclose15:35 Calls received about “spikes” seen on system15:36 MISO calls FE regarding contingency overload on Star-Juniper for loss of Hanna-Juniper15:45 FE tree trimming crew calls in regarding Hanna-Juniper flashover to a treePJM called MISO at 15:48 and FE at 15:56 regarding overloads on FE system
36
Phone Calls to FirstEnergy
● First Energy told MISO that the voltage on a major line was dangerously low. “Do you have any idea what is going on?”
● MISO replied that the Hanna-Juniper line was out, adding “I am wondering if it is still out.”
● “We have no clue” First Energy replied. “Our computer is giving us fits too. We don’t even know the status of some of the stuff around us.”
● MISO comments: “I can’t get the big picture of what’s going on. Strange things are all happening at the same time.”

7
37
“You’re On the Air!”
38
“You’re On The Air!”
39
Blackout Sequence – Phase 2
40
Chamberlin-Harding (3:05:41)
41
Chamberlin-Harding Indication of Ground Fault Due to Tree Contact as Measured by DFR at Juniper
42
(3:05:41) Hanna-Juniper(3:32:03)
8
43
Hanna Juniper Confirmed as Tree Contact atLess than Emergency Ratings of Line
44
“LEGAL” RESTRICTIONS ON VEGETATION MANAGEMENT--BEFORE
45
“LEGAL” RESTRICTIONS ON VEGETATION MANAGEMENT--AFTER
46
Effects of Ambient Conditions on Ratings
47
(3:05:41)(3:32:03)
Star- S. Canton (3:41:35)
48
Situation after Initial Trips 3:05:41 – 3:41:35
ONTARIO
9
49
Canton Central – Tidd(3:45:41)
50
138 kV Lines Overload and Cascade Near Akron
Simulated 138 kV Line Loadings
0
20
40
60
80
100
120
140
160
180
200
Outages
% o
f Nor
mal
Rat
ings
(Am
ps)
Dale-W.Can138 kV
W.Ak-PVQ22 138 kV
Cham-W.Ak138 kV
E.Lima-N.Fin 138 kV
CantC Xfmr
W.Ak-PVQ21 138 kV
Babb-W.Ak138 kV
E.Lima-N.Lib 138 kV
Clov-Torrey138 kV
Dale-W
.Can
138 kV
W.A
k 138 kVB
kr Failure
E.Lima-N
.Fi n138 kV
CantC
Xfmr
W.A
k-PV Q21
138 kV
Babb-W
.Ak
138 kV
E.Lima-N
.Li b138 kV
Clov-Torre y
138 kV
Star-S.Cant
345 kV
Hanna-Jun
345 kV
Hard-C
hamb
345 kV
Cham
-W.A
k138 kV
5115:05:41 ED
T
15:32:03 EDT
15:41:35 EDT
15:51:41 EDT
16:05:55 EDT
0
20
40
60
80
100
120
140
% o
f Nor
mal
Rat
ings
Canton C
entral Transformer
Babb-W
.Akron 138 kV H
arding-C
hamberlin
Hanna-
Juniper
Star-S.Canton
Cloverdale-Torrey 138 kV
E.Lima-N
ew Liberty 138 kV
W.Akron-Pleasant Valley 138 kV
E.Lima-N
.Finlay 138 kV
Cham
berlin-W.A
kron 138 kV
W.A
kron 138 kV Breaker
Dale-W
.Canton 138 kV
Sammis-Star
138 kV Cascade Contributes Furtherto Overload of Sammis-Star
52
Sammis-Star(4:05:57.5)
53
Sammis-Star Zone 3 Relay Operateson Steady State Overload
54
Actual Loading on Critical Lines
0
400
800
1200
1600
12:00 13:00 14:00 15:00 16:00
Time - EDT
Flow
s (M
W)
Harding - ChamberlinHanna - JuniperStar - South CantonSammis - Star
East Lake 5 Trip
Harding - Chamberlin Line Trip
Hanna - Juniper Line Trip
Sammis - Star Line Trip
Star - South Canton Line Trip

10
55
Actual Voltages Leading to Sammis-Star
250
270
290
310
330
350
370
15:00 16:00Time - EDT
Vol
tage
(kV)
Star
Hanna
Beaver
Perry
100% Voltage
95% Voltage
90% Voltage
Sammis - Star 345 kV Line Trip
Star - South Canton345 kV Line Trip
Hanna - Juniper345 kV Line Trip
Harding - Chamberlin345 kV Line Trip
Gaps in Data Records
56
Cascade Sequence 1
57
Major Path to Cleveland Blocked after Loss of Sammis-Star 4:05:57.5 PM
RemainingPaths
58
Cascade Sequence 2
59
345 kV Lines Trip Across Ohio to West
ONTARIO
60
Generation Trips 4:09:08 – 4:10:27 PM
ONTARIO
11
61
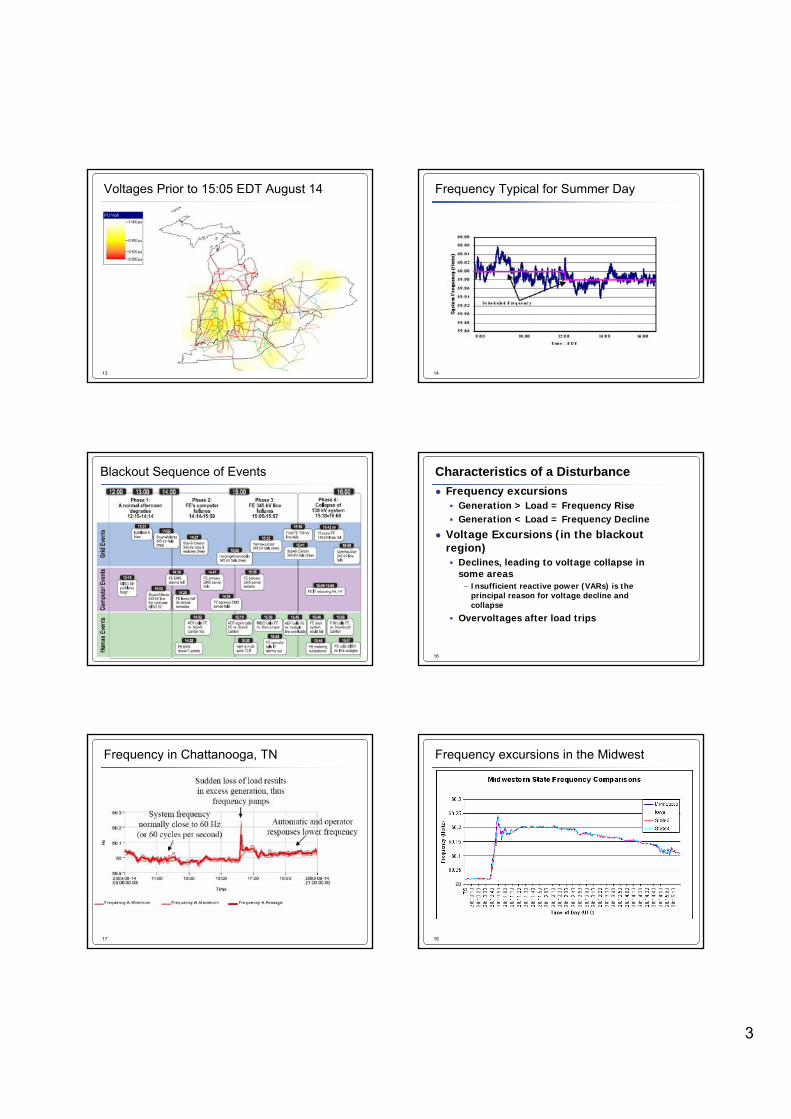
Cascade Sequence 3
62
345 kV Transmission Cascade Moves North into Michigan 4:10:36 – 4:10:37 PM
63
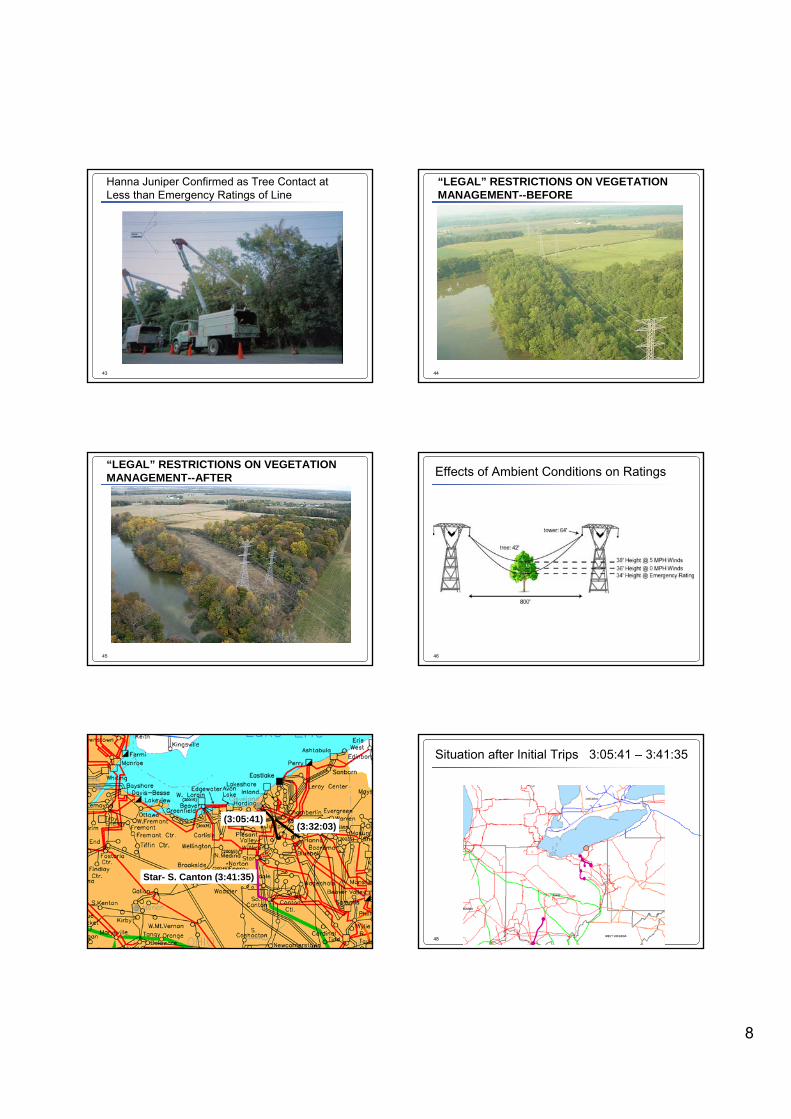
Blackout Sequence – Phase 3
64
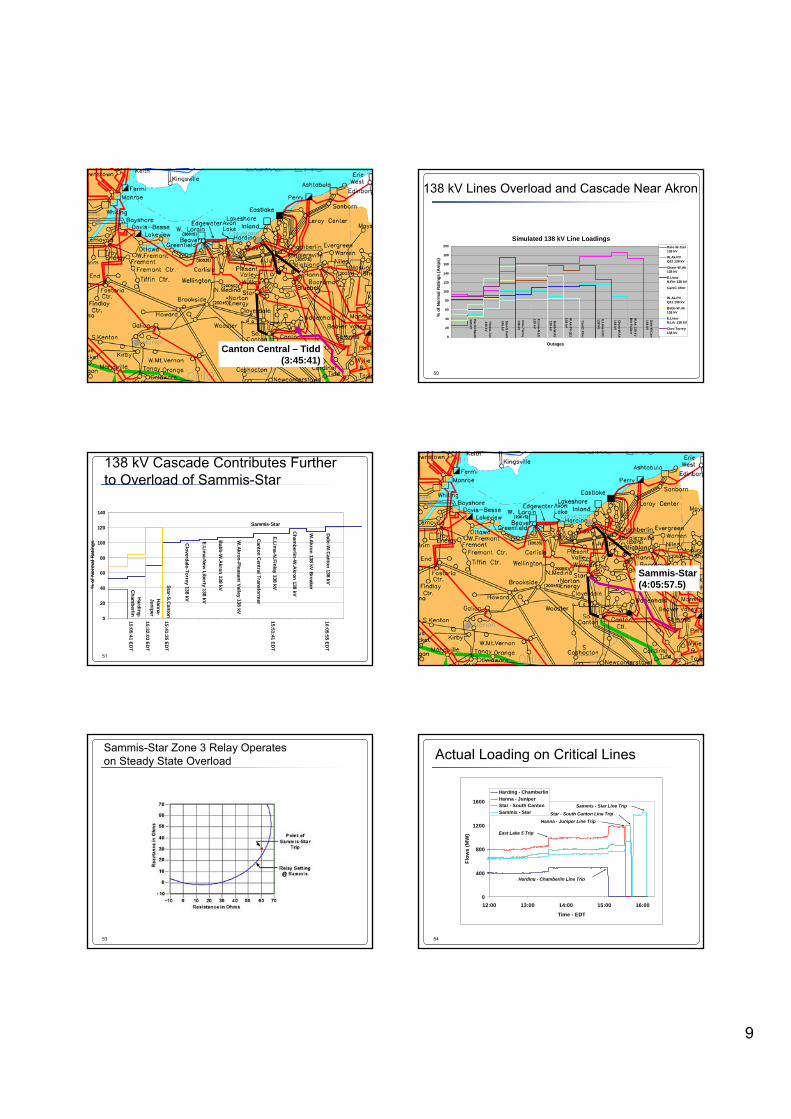
Cascade Sequence 4
65
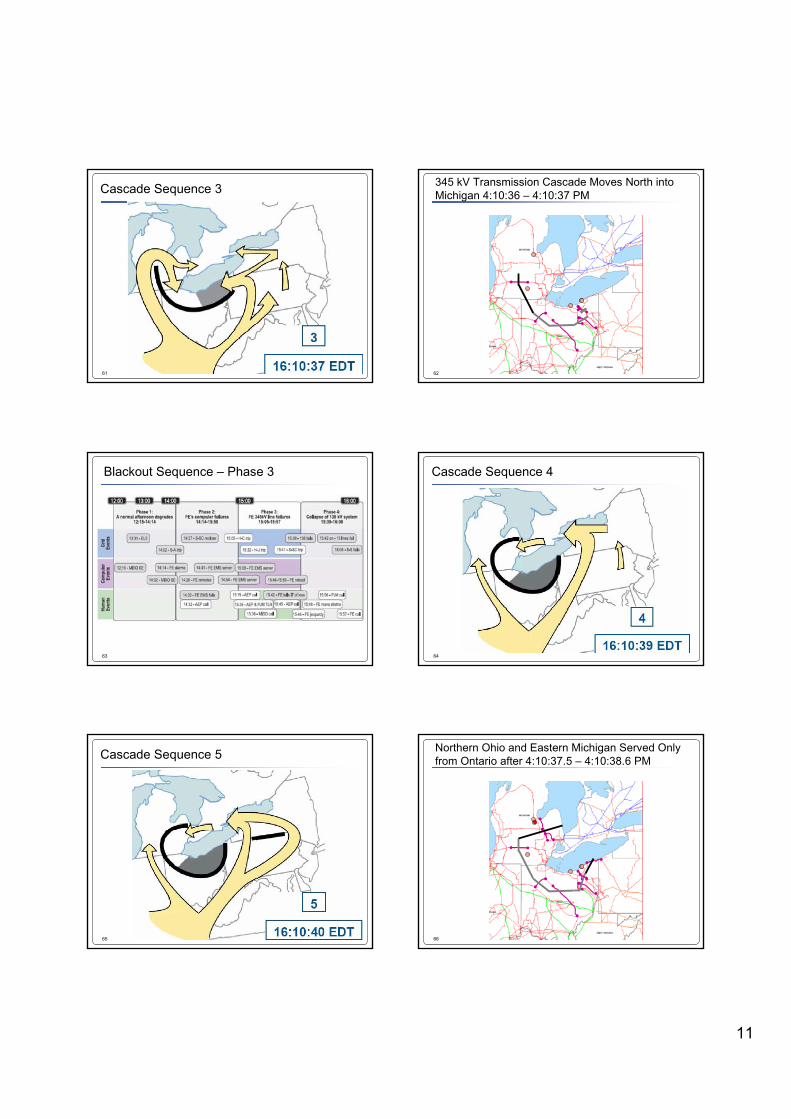
Cascade Sequence 5
66
Northern Ohio and Eastern Michigan Served Only from Ontario after 4:10:37.5 – 4:10:38.6 PM
12
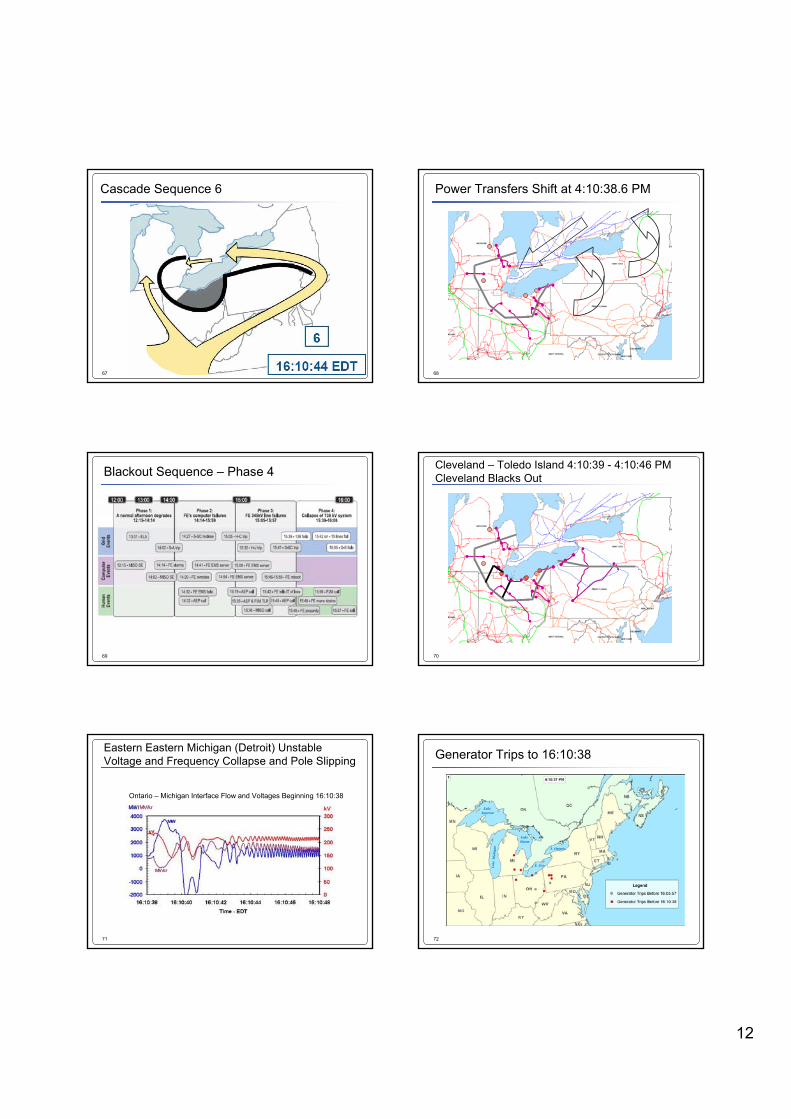
67
Cascade Sequence 6
68
Power Transfers Shift at 4:10:38.6 PM
69
Blackout Sequence – Phase 4
70
Cleveland – Toledo Island 4:10:39 - 4:10:46 PMCleveland Blacks Out
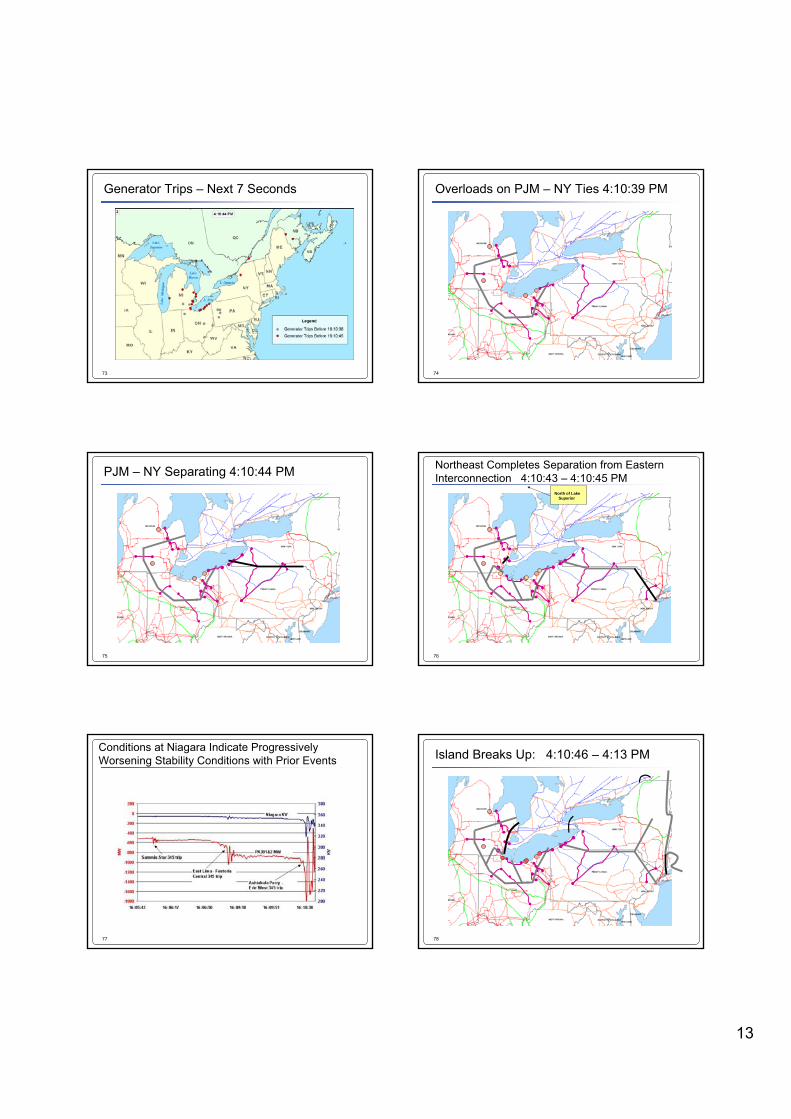
71
Eastern Eastern Michigan (Detroit) UnstableVoltage and Frequency Collapse and Pole Slipping
Ontario – Michigan Interface Flow and Voltages Beginning 16:10:38
72
Generator Trips to 16:10:38
13
73
Generator Trips – Next 7 Seconds
74
Overloads on PJM – NY Ties 4:10:39 PM
75
PJM – NY Separating 4:10:44 PM
76
Northeast Completes Separation from Eastern Interconnection 4:10:43 – 4:10:45 PM
North of LakeSuperior
77
Conditions at Niagara Indicate Progressively Worsening Stability Conditions with Prior Events
78
Island Breaks Up: 4:10:46 – 4:13 PM

14
79
Cascade Sequence 7
80
Frequency in Ontario and New York during BreakupNiagara Generation Stays with Western NY
81
Frequencies in Separated Areas
82
Generator Trips – After 16:10:44
83
Cascade Sequence 8
84
Areas Affected by the BlackoutService maintained
in some area
Some Local Load Interrupted
End of the Cascade

15
85
The August 14th Outage
Before After
86
87
Blackout Root Cause Group 1FE Situational Awareness
● FE did not ensure a reliable system after contingencies occurred because it did not have an effective contingency analysis capability
● FE did not have effective procedures to ensure operators were aware of the status of critical monitoring tools
● FE did not have effective procedures to test monitoring tools after repairs
● FE did not have additional high level monitoring tools after alarm system failed
88
Blackout Out Root Cause Group 2Vegetation Management
● FE did not adequately manage tree growth in its transmission rights of way
89
Blackout Out Report: Vegetation Management
90
Blackout Out Report: Vegetation Management

16
91
Blackout Out Report: Vegetation Management
92
Blackout Out Report: Vegetation Management
93
Blackout Out Report: Vegetation Management
94
Blackout Out Report: Vegetation Management
95
Blackout Out Report: Vegetation Management
Some Reported Problems:
Otter Tail Power: FWS and DNR repeatedly planted trees in ROW
Pacificorp: DOT planted trees in ROW, would not allow them to be pruned
NY Environmental Dept requires filing for a “temporary revocable permit” to trim trees, requires 2 years to process application
96
Blackout Cause Group 3Reliability Coordinator Diagnostics
● MISO’s state estimator failed due to a data error.
● MISO’s flowgate monitoring tool didn’t have real-time line information to detect growing overloads
● MISO operators couldn’t easily link breaker status to line status to understand changing conditions.
● PJM and MISO ineffective procedures and wide grid visibility to coordinate problems affecting their common boundaries

17
97
North America Blackout Characteristics


