Download - REITS AND THEIR MANAGERS
REITs and Their Management:
An Analysis of Organizational Structure, Performance, and Management Compensation
Susanne Ethridge Cannon
Assistant Professor
and
Stephen C. Vogt Assistant Professor
DePaul University 1 East Jackson
Chicago, IL 60604
September, 1994
Research partially funded by grants from the Real Estate Research Institute, The DePaul University Research Council, and JMB Institutional Realty. Charles H. Wurtzebach, JMB Institutional Realty, co-authored an earlier, single period, version of this paper. The authors wish to thank Michael Torres, Wilshire Associates, Incorporated, for his help in securing necessary data and for his insight into the real world concerns of institutional investors; participants at the DePaul University Finance Department Seminar, and the Real Estate Research Institute Annual Meeting; and Lauren Rembold, Katriona Hamer and Monika Chandel for their assistance with the research.
REITS AND THEIR MANAGEMENT: AN ANALYSIS OF ORGANIZATIONAL
STRUCTURE, PERFORMANCE, AND MANAGEMENT COMPENSATION
Abstract
This study examines possible agency problems in Real Estate Investment Trusts (REITs) by
contrasting the performance, structure and compensation of the two REIT forms from 1987 through
1992. Results show that “self-administered” REITs outperformed “advisor” REITs over the sample
period even after adjusting for their greater market risk. Ownership structure significantly influences
market performance of advisor REITs; low insider owned advisor REITs both under-perform and take
on less market risk than other REITs. Ownership does not affect returns or market risk of self-
administered REITs. While advisor compensation and chief executive officer salary appear to be
strongly related to size, and chief executive officer salary is related to firm performance, there is only
limited evidence that ownership structure affects managerial compensation in either REIT type.
REITS AND THEIR MANAGEMENT: AN ANALYSIS OF ORGANIZATIONAL
STRUCTURE, PERFORMANCE, AND MANAGEMENT COMPENSATION
I. Introduction
As real estate ownership structures have arisen and evolved to facilitate both the
financing and management of large real estate portfolios, agency conflicts have become
increasingly relevant. The Real Estate Investment Trust (REIT) is one such ownership structure
that has changed dramatically in recent years. Adapted from earlier business trusts, a 1960
amendment to the Internal Revenue Code established REITs as a financial vehicle for the small
investor desiring to hold a portfolio of real estate assets in a tax advantaged form.1 A REIT must
comply with stringent rules with respect to assets, transactions, and income, and it must distribute
95% of that income as dividends. In return, it can deduct from taxable income the dividends it
distributes to its shareholders. The result is that the REIT is a conduit for shareholders to receive
income from passive investment in real estate equity and debt.
In addition to the limitations on assets and income, the law imposes organizational and
structural requirements. REITs are managed by trustees who hold legal title to the property of the
trust and who have rights and powers which meet the IRS test of centralized management.2 The
trustees must have “continuing exclusive authority over the management of the trust, the conduct
of its affairs, and the management and disposition of the trust property,”3 but in order to comply
with the requirement that the income be passive and that the REIT may not derive income from
the active operation of a business, the regulations require that the REIT hire independent
contractors to manage REIT properties. REIT trustees may “fix terms of leases, choose tenants,
enter into leases, deal with taxes and insurance and make capital expenditures,” 4 but the REIT
cannot furnish services to tenants by managing the property itself. The effect of these legal
1
requirements is to separate the fiduciary responsibilities of REIT management from the provision
of tenant services.
In the Tax Reform Act of 1986, Congress “clarif[ied] that a REIT may directly select,
hire, and compensate those independent contractors who will provide customary services that
may be provided by a REIT in connection with the rental of real property, rather than hiring an
independent contractor to hire other independent contractors.”5 Prior to 1986, the typical REIT of
the period hired an advisor who then hired managers, leasing agents, and other subcontractors.
Potential conflicts between REIT advisors and shareholders emerged when advisors hired
property management firms affiliated with the advisor. The advisors of these early REITs were
also frequently sponsors and trustees rolled into one complex and overlapping structure.6With the
1986 clarification, REIT administration could be performed internally. Beginning in 1987 many
REITs switched from their previous advisor form and hired internal professional management,
becoming self-administered. New self-administered REITs were also formed by entrepreneurs
needing access to capital to build or restructure portfolios of properties.
The decision to choose the self-administered form or the decision to go public with an
initial public offering for a new self-administered REIT was also bolstered by investment
advisors who discovered market resistance to new shares offered by advisor REITs. One
explanation for the resistance was concern that the complex inter-relationships between advisors,
trustees and property management subcontractors did not provide sufficient monitoring
mechanisms for shareholders, whereas the more standard corporate organizational form of the
self-administered REIT did.7 Real estate textbooks and the financial press reflect this concern. A
Green Street Advisors Inc. (1992) newsletter states, “Investor aversion to externally-advised
REITs is primarily based upon the poor track record of advisors with regard to closely aligning
their interests with those of shareholders.” Similarly Bruggeman and Fisher (1993, p. 702) state,
“Obviously, the close association of REITs and real estate organizations or individuals who
2
sponsor it can create potential conflicts of interest.” John Haahr, Kemper Securities, in explaining
that his firm will only look at self-administered REITs said recently, “Picking self-managed
REITs is our way of making sure that the money stays in the company.”8
Whether advisor REITs suffer greater agency problems is a matter for empirical
investigation. Since 1987 the old-style advisor REITs have continued to exist along with the
newer self-administered REITs. The co-existence of these two organizational forms provides an
ideal setting for testing the impact of potential agency problems on REIT performance and
management compensation. This study focuses attention first on performance differences and
then whether ownership structure affects performance and manager compensation in the two
REIT forms. The results of the study indicate that over the period 1987 through 1992 self-
administered REITs outperform advisor REITs and advisor REIT performance depends on
ownership structure. However, managerial compensation in both advisor and self-administered
firms does not appear to be strongly influenced by either ownership structure or stock market
performance. One exception is self-administered REIT chief executive officer compensation
which is positively influenced by REIT stock returns.
The following section provides background on agency theory and associated REIT
research for this study. Section III discusses the data and Section IV tests for performance
differences between the two REIT forms and analyzes the connections between ownership
structure, performance and management compensation.
II. Background
Agency Research
Since Berle and Means (1932) first raised concerns about the possibility of the large
corporation becoming the “captive” of its management, a number of potential agency conflicts
have been analyzed in the finance literature. Jensen and Meckling (1976) define agency
3
relationships as contracts when principals engage someone to act in their behalf. If agents are
utility maximizers they may appropriate excessive perquisites or shirk from their responsibility to
seek profit maximizing investments. In the complex organizational structure that is the advisor
REIT, there is the added possibility that the advisor can funnel the firm’s resources to another
privately held firm it owns. Jensen and Meckling suggest that the agency conflict will affect firm
performance and that increasing manager ownership or non-manager owner concentration can
help mitigate agency problems. This will align manager/shareholder interests or increase
shareholder incentives to monitor managerial activity. Consequently, agency theory suggests that
if agency conflicts arise in advisor REITs, their market performance will depend in part on the
ownership structure of the firm.
Williamson (1963) argues that agency conflicts encourage managers to indulge in what
he termed “expense preference behavior” by enriching themselves either with explicit wages or
with management “perks” or “emoluments.” His study across 26 industries indicates that
executive salaries are responsive to staff size, industry concentration, internal representation on
the board and substantial barriers to entry. 9
Extensions of Williamson’s work includes Edwards (1977) who defines expense
preference behavior as excessive consumption of administrative costs. After controlling for firm
size and the regional labor market, Edwards finds that expense preference behavior in the pre-
deregulation banking industry is affected by market concentration. Arnould (1985) builds on
Edwards’ model by introducing an explicit measure of managerial control. Drawing on Jensen
and Meckling’s results, Arnould tests whether excessive consumption of administrative costs in
the banking industry are a function of stock ownership by officers and directors. Consistent with
agency theory, Arnould finds that executive officer compensation is higher in firms when the
board controls less than 30% of the stock outstanding and the bank operates in a monopolistic
market.
4
REIT Research
The questions raised by the organizational structure research have generally not been
addressed within REITs, which have two distinct ownership/management structures. The early
research into REITs considered their performance as investment vehicles and contrasted their
performance by asset type (equity, mortgage, or hybrid) or compared the performance of the
stock market as a whole with some or all REITs. Agency problems within REITs are examined by
Solt and Miller (1985) in their study of the links between advisor compensation and several
financial variables at a time when the advisor firm was the norm. Their study documents that
advisor fees are positively influenced by accounting measures of performance, and that advisor
fee structure changed over the study period to reduce agency costs to shareholders.
Because the REIT advisors themselves differ in background and business practices,
performance by advisor type has also been analyzed. Howe and Shilling (1990) classify REIT
advisors into seven categories and test each of these categories for differences in abnormal stock
returns. They find performance varies across categories and attribute these differences, in part, to
varying degrees of agency problems between REIT advisor types.
Recently Golec (1994) examined REITs over the period 1962-1987 for differences in the
form of advisor and executive compensation contracts and their relationship to firm
characteristics. He finds that REITs with compensation packages set at the discretion of the board
of directors (often based on performance) outperform REITs whose advisor compensation is
based on a formula. He also finds that formula based compensation creates the incentive for
advisors to strip cash from the REIT, resulting in higher dividend yields and lower market to
book ratios for those firms. However, his analysis includes both equity REITs and mortgage
REITs and therefore may be more indicative of a contrast between lender and equity investor
compensation.
5
This study extends the earlier REIT empirical work by testing for agency conflicts in
REITs and explores whether ownership structure reduces such conflicts. If advisor REITs are
exposed to greater agency conflicts, the performance of advisor REITs should suffer relative to
self-administered REITs. Additionally, if ownership structure helps align manager and
stockholder interests, advisor REITs with high managerial ownership or high outside ownership
concentration should outperform those with low inside ownership. Finally, if agency problems
embody themselves in expense preference behavior, it should be most prevalent in low ownership
advisor REITs.
III. Data
The following analysis uses data from 42 REITs during the period 1987 through 1992.
These equity REITs comprised the equity REIT portion of the Wilshire Real Estate Securities
Index. The Wilshire Index consists of large, actively traded non-health care REITs and real estate
operating companies listed on the public exchanges along with a handful of limited partnerships.
The data base for this study includes only equity REITs in existence in 1987 (there were no new
additions to the Wilshire list from 1988 to 1991, and the 1992 additions to the Index are not
included). There is a close similarity between the Wilshire Index and the REITs included in our
sample. In January 1987, the Wilshire list included 51 securities with a total market capitalization
of $8.0 billion. Forty five of these securities were equity REITs and 42 are included in this study.
Three REITs were dropped due to missing Compustat data. As of December 1992, at the
conclusion of the study period, the Wilshire list had 67 securities and a market capitalization of
$8.9 billion. By comparison, the subject REITs had market capitalization of $5.76 billion in
January 1987 and grew to $6.58 billion by December 1992.
Accounting and market data were gathered from Standard and Poors’ Compustat and the
Center for Research in Security Prices (CRSP) tapes. Proxy statements filed in compliance with
the Securities Exchange Act of 1934 reveal ownership levels of officers, directors and large
6
blockholders, the extent to which board members have conducted business with the institution,
and compensation paid to advisors or top management. These were available in complete form
either from the Chicago offices of the Securities and Exchange Commission, or the firm itself.
Limited data were available from Standard and Poor’s CorpText.
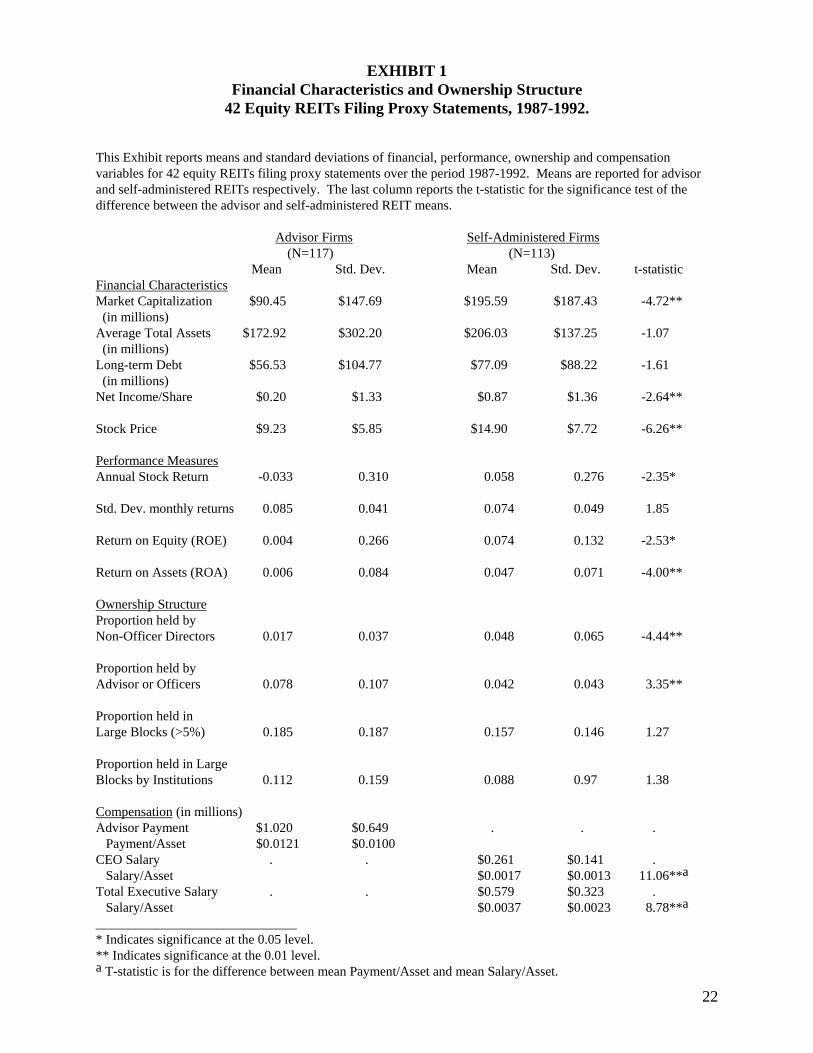
Exhibit 1 reports the means and standard deviations of financial performance, ownership
structure, and compensation for advisor and self-administered firms. Self-administered firms were
generally larger, less leveraged, and had significantly higher net income per share. On average,
they had positive stock returns (0.058) over the period while advisor firms had negative returns (-
0.033) and this difference is statistically significant. While reported ROA and ROE are positive
for both groups, those numbers are considerably larger and less volatile for self-administered
REITs.10
There are both similarities and differences in the organizational structure of the two REIT
types. The typical board of directors of either consists of six to eight members, and one or two of
those members is either a salaried officer or an advisor, depending on the REIT type. Self-
administered firms have greater ownership by non-officer board members who are outsiders with
a stake in the firm (0.017 for advisor versus 0.048 for self-administered REITs). The possibility
of monitoring managers by large blockholders (stockholders holding more than five percent of
outstanding shares) or institutions exists for both REIT types. Self-administered firms, on
average, have a slightly lower proportion of shares held in large blocks (0.157 versus 0.185) and
by institutions (0.088 versus 0.112). However, only the difference between non-officer board
member ownership is statistically significant at conventional levels.
With respect to aligning the interests of management and shareholders, there is a
statistically significant difference in managerial stock holdings between REIT types. Top
executives of self-administered firms hold about four percent of the shares outstanding, and
directors affiliated with the advisor hold nearly eight percent in the REITs they advise. The
7
greater degree of advisor ownership, however, does not necessarily translate directly into greater
manager/shareholder incentive alignment since the advisor is a company and the employees of
the advisor may or may not have an ownership share in the REIT. This is not the case for
executives of self-administered REITs who hold a direct ownership stake in the firm.
Exhibit 1 here
The last section of Exhibit 1 reports manager compensation in both levels and as a
proportion of total assets. In self-administered REITs the manager compensation follows a
cash/bonus/stock option structure very similar to those found in non-real estate corporations. In
advisor REITs there are usually no officers who are paid a salary (although there are cases where
the firm has both an internal staff and external advisor). The relevant measure of compensation
for these REITs is the cash amount paid to the advisor firm according to the terms of the advisory
agreement. Advisor fees may include brokerage and leasing commissions and other fees. In order
to make the advisor REIT compensation measure consistent within the advisor REIT group, only
the portion of the advisor payment made for administrative services is used. Payments made for
management or leasing commissions are identified and excluded whenever possible.
Executive compensation for self-administered firms is defined as cash and quantifiable
perquisites as reported on the proxy statement. Incentive compensation in the form of stock
options is common in self-administered REITs, but during the period in question it is not reported
in a consistent manner and it is therefore excluded. In a survey of REIT compensation practices in
1989, the time-series mid-point of this paper, Lucas (1989) reported that nearly two thirds of the
self-administered REITs provided stock options to their top executives, and all firms provided
them to their top acquisition officer. Lucas (1989, 1991) also found that the employment
arrangements were complex and that incentives typically were based on changes in either the
appraised value of invested assets, changes in net income or cash flow, or on distributions to
shareholders. The range of perquisites offered included automobiles, country club memberships,
8
and tax and financial counseling. About half of the executives had employment contracts and
three quarters had change of control provisions.
Even though compensation numbers differ between groups and a direct comparison of
compensation numbers across REIT types is less informative than a comparison within types, the
last section of Exhibit 1 reports the sample means for each group. Typical advisor payments are
approximately $1 million per year or 1.21 percent of total assets. Top total executive salaries as a
group average $579,380 or 0.37 percent of total assets while chief executive officer salary
average $260,920 per year or 0.13 percent of total assets.
IV. Empirical Tests and Results
Portfolio Performance Tests
In the empirical analysis that follows, the market performance of the two REIT forms is
analyzed using standard methods for comparing two or more portfolios. If indeed self-
administration helps mitigate agency problems, then self-administered REIT performance should
dominate advisor REIT performance. For comparison purposes, we group REITs into two
portfolios determined by their organizational form. Since eleven REITs changed form over the
period of this study, those eleven are grouped by the organizational form they held the longest.
Ten of the eleven REITs switched from the advisor to self-administered form in 1992 and are
classified as belonging to the advisor REIT portfolio. Though not reported here for brevity, very
similar results were obtained when these firms were excluded from the sample.
Two standard portfolio performance measures are estimated: the Jensen (1968) measure
and the Sharpe (1966) measure. Jensen’s performance measure is the estimated intercept (α)
from,
R R R Rp t f t m t f t t, , , ,( )− = + − +α β ε (1)
9
where Rp,t indicates the monthly return on a portfolio of REIT stocks, Rf,t is the monthly return
on the (risk free) three month Treasury bill, and Rm,t is the monthly return on a representative
“market” portfolio. Jensen’s alpha (α) can be interpreted as a measure of the average excess
monthly portfolio return above the monthly market excess return after adjusting for differences in
risk. If α is zero, or not significantly different from zero, then the portfolio is performing with a
mean monthly rate-of-return, adjusted for risk, that is the mean monthly rate-of-return for the
market.
Additionally, because advisor and self-administered REITs differ in size (see Exhibit 1)
the Jensen tests are performed using both a value-weighted portfolio of monthly REIT returns and
an equally-weighted portfolio. Because dividends play such a prominent role in REIT returns, all
portfolio returns are calculated including dividends. Monthly returns over the six year study
provide 72 observations.
Using all stocks on the New York Stock Exchange (NYSE) as a benchmark, Exhibit 2
compares the performance of all REITs, advisor REITs, and self-administered REITs to the
NYSE composite index, and then compares advisor and self-administered REITs to the Wilshire
Index. As Exhibit 2 suggests, advisor and self-administered REIT performance are significantly
different. The first line of the upper left corner of Panel A shows that a value-weighted index of
all REITs does not differ significantly from the value-weighted NYSE in performance, and has a
β of 0.58. But the performance of the value-weighted advisor REIT portfolio is considerably
lower than the NYSE and has a significantly lower β. The α of -0.0072 represents a negative
monthly excess return of 0.72 percent for the value-weighted advisor portfolio or -8.31 percent
annually. A value-weighted portfolio of self-administered REITs, on the other hand has a
significantly higher β than advisor firms. F-tests reject, at the 0.05 significance level, the joint
hypothesis that the parameter estimates are equal between advisor and self-administered
portfolios (i.e.,αa=αs and βa=βs). Similar results hold when equally-weighted portfolios are
10
compared. The equally-weighted index of all REITs significantly under-performs the equally-
weighted NYSE index (α=-0.0086), and the equally-weighted portfolio of advisor REITs exhibits
strong negative performance (α=-0.0125) relative to its self-administered counterparts (α=-
0.004). However, F-tests fail to reject the hypothesis that the parameter estimates are equal
between the equally-weighted advisor and self-administered REIT portfolios.
Exhibit 2 here
We also compare the performance of advisor and self-administered REIT portfolios to the
Wilshire Index as a benchmark portfolio for REITs. Since the Wilshire Index is a value-weighted
index, only the results for the value-weighted REIT portfolios are reported. Again strong
performance differences between advisor and self-administered REITs arise. In particular, the
value-weighted self-administered portfolio both out perform REITs as an asset class (α=0.0063 )
and take on more risk (β=1.13). Conversely, the advisor portfolio exhibits performance not
statistically different from the Wilshire Index and has less risk (β=0.800). Furthermore, an F-test
indicates that the differences between the parameter estimates in the advisor and self-administered
regressions are highly statistically significant.
A potential shortcoming of the Jensen performance measure is that it requires a well-
diversified portfolio to compare against the benchmark index (Levy and Sarnat, 1984).
Diversifiable industry risk associated with these REIT portfolios may bias the Jensen
performance measure. Sharpe defines an alternative performance measure that does not require a
well diversified portfolio. This measure is defined as
PIR Rp f
p=
−
σ (2)
where R Rp f− is the average excess return on the particular REIT portfolio of interest and σp is
the standard deviation of that portfolio’s returns. Panel C of Exhibit 2 presents results using the
11
Sharpe measure. The results are the same as those found using the Jensen performance measure.
In every case, the relative performance of the self-administered REITs exceeds those of advisor
REITs. Since the distribution of the difference between two Sharpe index estimates is unknown,
the significance tests of the difference in the indexes is inferred using a bootstrap technique.11
Two thousand random samples were generated by resampling the returns of the advisor and self-
administered portfolios. The difference between the self-administered portfolio and advisor
portfolio Sharpe indexes (PIs-PIa) was calculated for each of these random samples using both
the value-weighted and equally weighted indexes. The generated distribution of the Sharpe index
differences resulted in 0.45 percent and 0.90 percent of the sample falling at or below zero for the
value-weighted and equally-weighted indexes respectively. By conventional standards, these
results indicate that the better performance of self-administered REITs is statistically significant
at the 0.01 level.
These results raise the question of what factors may be driving the differences between
the market performance of these two REIT types. Agency theory suggests that the incentive
structures of advisor and self-administered REIT management may play a role in those
differences.12 If self-administered REITs outperform advisor REITs because these firms better
align manager and shareholder interests, then ownership structure should play an influential role
in both firm performance and managerial compensation in these firms. This line of inquiry is
pursued next.
Ownership Structure, Performance, and Compensation
Agency theory suggests that when corporate managers have a significant ownership
stake, managerial incentives are more closely aligned with shareholders and agency costs are
reduced (Jensen and Meckling, 1976). Moreover, when directors and outside shareholders control
a significant stake in the firm they have a greater incentive to be effective monitors of managerial
activity.
12
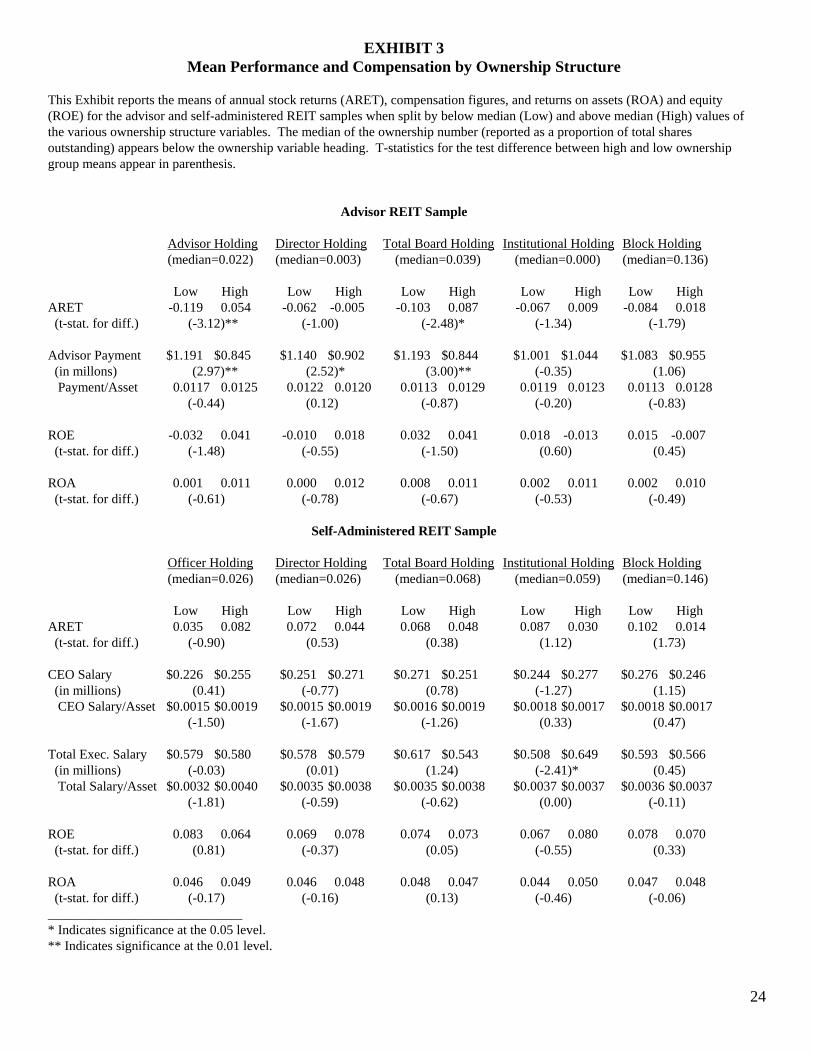
Exhibit 3 reports an initial analysis and provides some evidence that various forms of
ownership do influence both performance and compensation. Here the firms are first divided into
two groups: advisor and self-administered. Next, for each of the characteristics of ownership
structure the firms are divided into two groups, those which fall above the median and those
which fall below. Then, the annual stock returns including dividends, management compensation,
ROE, and ROA are reported for the two groups. For example, within advisor firms, those with
below average stock ownership by advisors have average annual returns of -0.119; those firms
with above average stock ownership by advisors have positive returns of 0.054 percent. Advisor
firms with above average ownership by non-advisor directors have returns of -0.005, while firms
with below average director ownership have even more negative returns of -0.062. In each case of
below average ownership, the advisor payment is also higher, and t-tests of the difference
between payment means indicate statistical significance in three of the five ownership groups.
Exhibit 3 here
By contrast, the pattern is not consistent in the self-administered REITs. Looking at the lower
panel, those self-administered firms that have below average stock holdings by management have
an average return of 0.035, while those with above average management stock holdings have
returns of 0.082. On the other hand, average annual returns are higher when non-officer directors,
institutions, or large blockholders own lower than average shares. Chief executive and total
executive salary also exhibit no consistent pattern with ownership structure. Consequently, the
importance of ownership structure is not nearly as pronounced in self-administered REITs. One
interpretation of these results is that self-administered REITs have been able to reduce agency
problems effectively by other means (for example, through more standardized financial reporting
or incentive based compensation structures) and thus rely less heavily on ownership structure to
mitigate such problems.
13
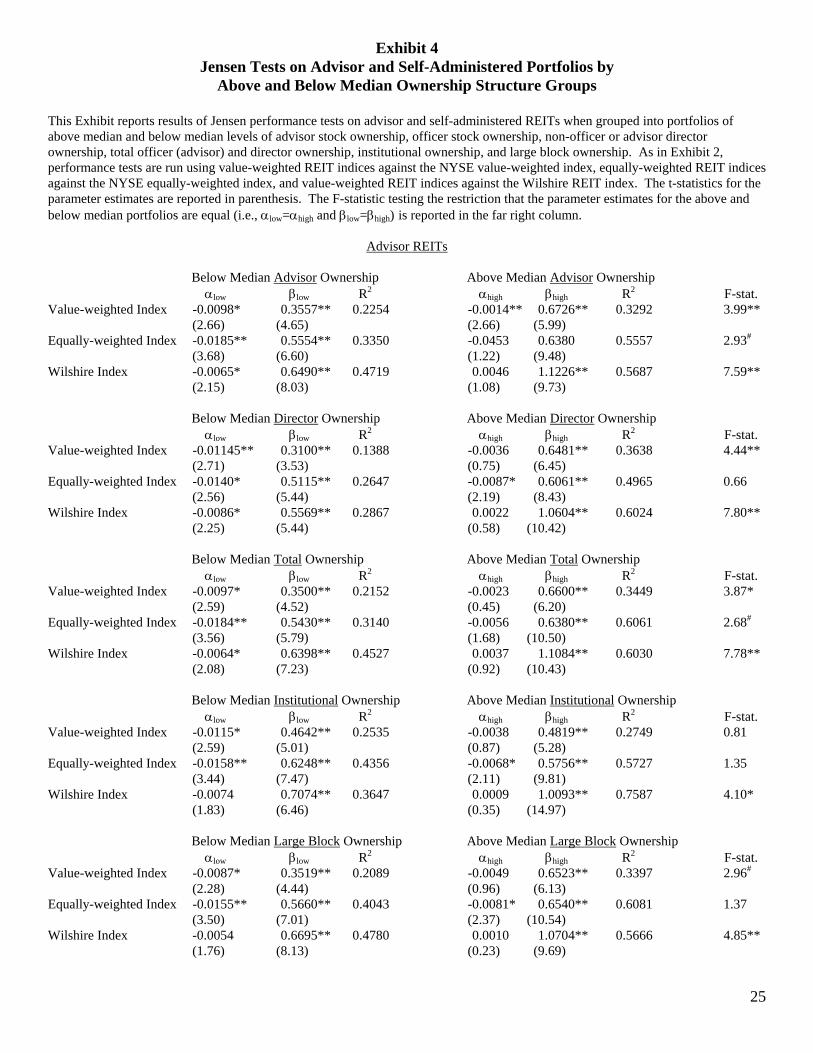
Additional information about the influence of ownership structure on REIT performance
is obtained by separating firms into portfolios by high (above median) and low (below median)
ownership structure and comparing their relative performance. Exhibit 4 reports the results of
Jensen performance tests when self-administered and advisor REITs are grouped into high and
low advisor, officer, director, total officer and director, institutional, and large block ownership
portfolios respectively. An F-test is used to test the restriction that the parameters of the high and
low ownership portfolios are equal (i.e., αlow=αhigh and βlow=βhigh). The results indicate several
interesting points. First, low ownership by advisor, non-advisor directors, and the total of advisor
and directors in advisor REITs is associated with poorer market performance (i.e., αlow < αhigh )
than their high ownership counterparts. Second, low ownership advisor REITs take on
significantly lower market risk relative to high ownership advisor REITs. The F-statistics indicate
that these differences are significant at the 0.05 level or better when both the value-weighted
NYSE and Wilshire indices are used as the market portfolio benchmark. When the equally-
weighted NYSE index is used, the statistical significance is reduced. Finally, ownership structure
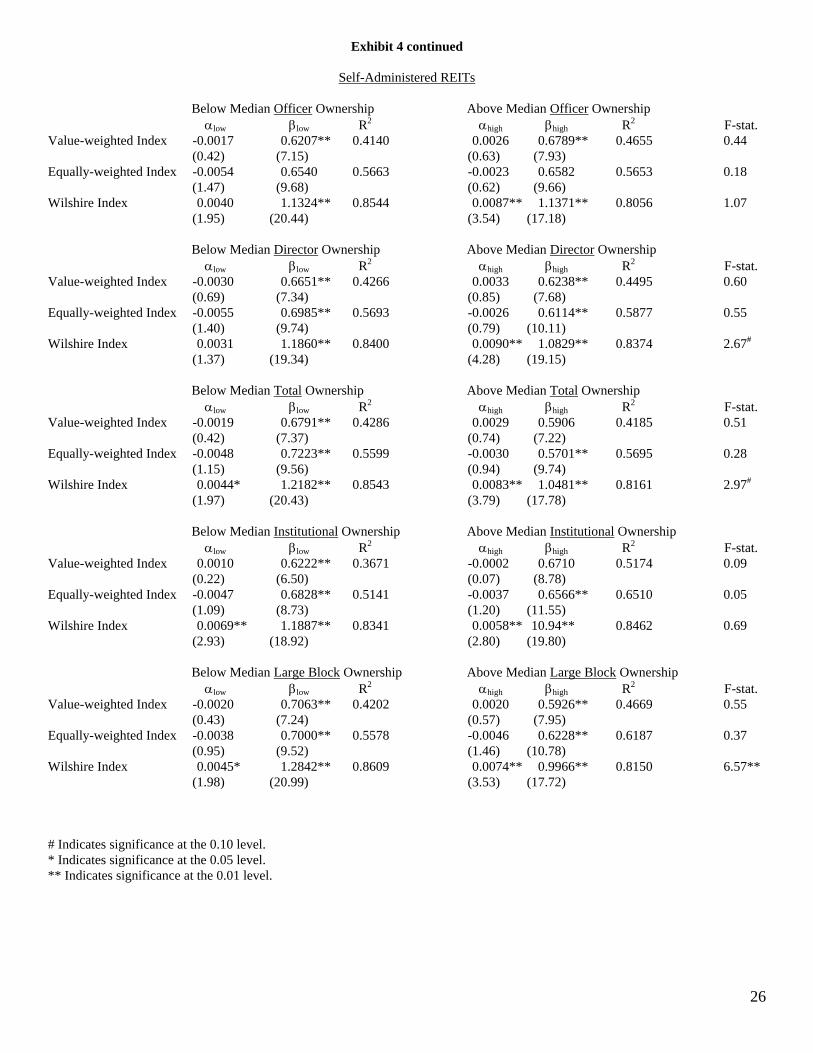
has considerably less effect on the performance of self-administered REITs. The high and low
ownership portfolios of self-administered REITs take on very similar market risk and exhibit
performance levels that generally do not significantly differ. When testing the differences in low
and high ownership portfolios, only three of fifteen portfolios exhibit parameter estimates that are
statistically different and in two of those cases the differences are significant at only the 0.10
level. For advisor REITs, eleven of fifteen portfolios have parameter estimates that are
statistically different at the 0.10 level with nine of fifteen significant at the 0.05 level.
Exhibit 4 here
An agency explanation for these results is that advisors with low ownership concentration
prefer less risk since their overall compensation is not affected by larger market returns.
Conversely, advisors with a high ownership percentage can earn the returns associated with
14
higher market risk and thus have an incentive to take on more risk. Why this agency story does
not hold for self-administered REITs seems to present a puzzle. However, as we document in the
next section, self-administered REIT chief executive officer compensation is positively related to
the REIT’s stock market performance. The existence of performance-based compensation
packages may serve to reduce the need for managerial ownership concentration or external
monitoring to align manager/shareholder interests.
Cross-sectional Time-Series Tests
This section focuses exclusively on expense preference behavior of both advisors and
executives of their respective REITs. First, advisor and executive compensation is modeled as a
function of the natural log of firm size (LNAT), annual stock returns (ARET) and the standard
deviation of monthly returns (STDRET) for each firm over the six years of the sample period. The
motivation behind this basic model is simply to test whether agency problems are mitigated by
compensating advisors and managers for improving market performance or taking risk, after
controlling for firm size. The semi-log model below was estimated using ordinary least squares
(OLS).
ln y LNAT ARET STDRETi t i i t i t i t i t= + +, , , , ,+ +α β β β ε1 2 3 (3)
where yi t, equals CEO salary (CEOSAL), total executive salary (TOTSAL) or the advisor payment
(PMT) and α i is a firm-specific dummy variable.
Due to the structural changes occurring in REITs over the 1987-1992 period, a pooled
cross-sectional time-series approach is used to model compensation. This technique has the
benefit of capturing both the cross-sectional and time-series variation in the data. Schmalensee
(1989) has criticized the use of pure cross-sectional techniques for analyzing the relationship
between conduct, structure, and performance within and among industries. In particular he
15
criticizes the implicit assumption that the industry is in equilibrium in the period the cross-
sectional analysis is performed. He suggests that employing pooling techniques, as we do here,
can control for variation associated with movements toward equilibrium.
Exhibit 5 presents the results of the pooled regressions with firm dummy variables (fixed
effects) for each firm. Once again the firms are divided into their two groups by management
form. The upper panel shows that advisor payment is strongly related to firm size but not to
returns or their riskiness. The strong impact of size is consistent with other studies of managerial
compensation. Peck (1986) and Murphy (1985), for example, find that sales (a measure of size) is
a strong determinant of managerial compensation in Fortune 500 firms.
In self-administered firms, on the other hand, chief executive salary (lower panel) is
positively related to annual stock returns, while total executive salary is not. These results provide
some evidence that the performance-based compensation plans, identified by Lucas (1989), are
used more effectively in self-administered REITs, at least for compensating the CEO. One
explanation for the smaller impact of ownership structure on self-administered REITs found in
Exhibits 3 and 4 may be that chief executive compensation contracts are more closely aligned
with the interests of shareholders, while advisor payments are not. This interpretation does not
hold, however, for total executive salary.
The results of the analysis in Exhibit 5 lead to the final question of whether compensation
is a function of ownership structure. Drawing on Arnould (1985), this effect is captured by
including other measures of ownership structure as additional explanatory variables in equation
(4).13
ln y LNAT ARET STDRET= + +, , , , , ,i t i i t i t i t i t i t+ + +α β β β β η ε1 2 3 4 (4)
16
where the yi t, variables are defined as in Equation (3), ARETi t, is the annual return for REIT i at
time t, STDRETi t, is the standard deviation of the monthly return for REIT i at time t and the ηi t,
are several ownership structure variables representing either the proportion of outstanding shares
held by officers of the firm (OFFHELD), the proportion held by non-officer (advisor) directors
(DIRHLD), the proportion held by large blockholders (LGBLK), the proportion held by officers
and directors (TOTAL), the proportion held by institutions (INST), or the proportion held by
advisors (ADVHLD).
Two measures of stock ownership by board members, DIRHLD and OFFHELD, play a
particularly important role in expense preference behavior. Previous studies analyzing the impact
of insider ownership have considered the combination of officer and director ownership of stock.
In this study the two are separated. In the advisor REIT we separate board members who are
employed by the advisor from those who are not. For consistency with earlier studies we also
include the variable TOTAL, the proportion of the combination of both insider and director
ownership.
Exhibit 5 here
The regression models the impact of ownership structure on the various forms of
compensation. Presuming that if managers have the opportunity to overpay anyone they will
select themselves, the dependent variables analyzed for the set of firms which have internal
management are LNCEOSAL (log of chief executive salary), and LNTOTSAL (log of total
executive salary); for firms with external advisors, the variable is LNPMT (log of total fees paid
advisors). The null hypothesis is that ownership structure does not affect management
compensation.
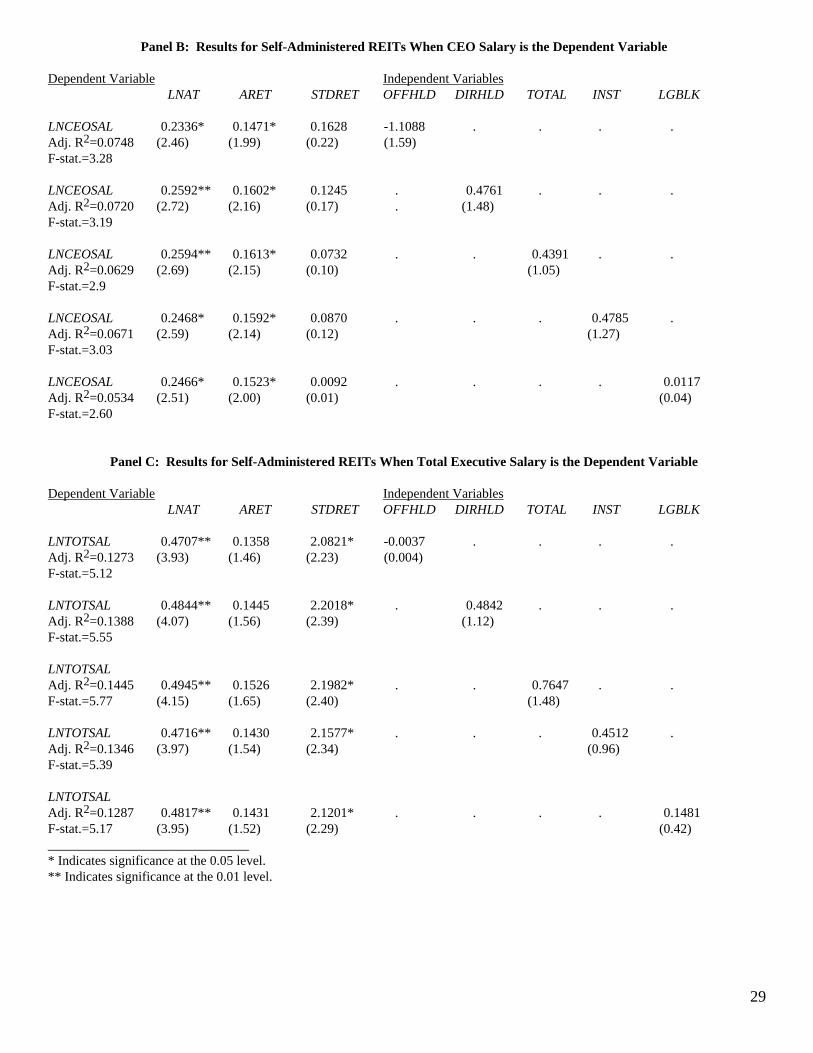
Panel A of Exhibit 6 reports the regression results for advisor firms. These results do not
indicate any relationship between ownership by the board of directors or large blockholders and
the advisor's compensation. Within the self-administered REITs (Panels B and C) the results are
17
similar when either CEO salary or total executive salary is the dependent variable. While the
signs on the parameter estimates for ownership structure are generally consistent with expense
preference behavior, no statistically significant relationship emerges.
Exhibit 6 here
After controlling for firm size, these results suggest that organizational structure does not
affect cash compensation in either advisor or self-administered REITs. Consequently, while self-
administered REITs clearly outperformed advisor REITs over the period of study, only limited
evidence exists supporting the notion that expense preference behavior associated with the
advisor form is the cause of this under-performance.
V. Summary and Conclusions
Over the past thirty years there has been an ongoing debate on the implications of
managerial discretion for the profitability of the firm. The issue has not been previously explored
within the Real Estate Investment Trust industry, except in analysis that is not relevant to the
typical current form of organization. Furthermore, the recent growth in REITs as a real asset
financing vehicle and as an investment vehicle for institutional investors has created increased
interest in agency costs within REITs and in the proper organizational form they should take to
reduce them. Since 1992, most existing REITs and nearly all new REITs have chosen a self-
administered form. One view held in the popular financial press is that greater agency conflicts in
advisor REITs have made self-administration the preferred form.
The results of this study provide support for the notion that advisor REITs may suffer
from more severe agency problems than their self-administered counterparts. Advisor REITs
significantly under-perform and take on less market risk than self-administered REITs during the
period studied. Furthermore, advisor REITs with low advisor or director ownership tend to under-
perform, take on less market risk, and make higher advisor payments than do those with high
18
ownership influence. No such relationships consistently arise for self-administered firms,
however.
Support for the expense preference hypothesis breaks down in a more detailed analysis of
advisor compensation. Neither ownership structure variables nor a market performance variable
(annual stock returns) have any impact on the size of the advisor payment in a regression model
explaining advisor compensation across firms and over time. In fact, only size as measured by the
book value of total assets has any explanatory power.
Similar results hold for self-administered REITs, with one important difference. The
compensation (salary plus bonus) of the chief executive officer is positively and significantly
influenced by the REIT’s annual market return. If self-administered REITs make better use of
market-based performance compensation than advisor REITs as found here, this may explain the
diminished use of ownership structure as a monitoring device among self-administered REITs.
That may also explain the different ownership patterns of advisor REITs and self-administered
REITs.
19
Vl. References Akella, S. R. and S. I. Greenbaum, Savings and Loan Ownership Structure and Expense-
Preference, Journal of Banking and Finance 12 (1988): 419-37. Alchian, A. and R. A. Kessel, Competition, Monopoly, and the Pursuit of Pecuniary Gain,
Aspects of Labor Economics, Princeton: Princeton UP, 1962. Allen, T. F. and F. L. Fisher, Real Estate Investment Trusts, from Tax Management Portfolios
Volume107, 5th Edition, Washington, D.C.: The Bureau of National Affairs, 1994. Arnould, R. J., Agency Costs in Banking Firms, Journal of Economics and Business 37 (1985):
103-12. Berle, A. and G. Means, The Modern Corporation and Private Property, New York: Macmillan
Publishing Company, 1932. Blair, D. W. and D. L. Placone, Expense-Preference Behavior, Agency Costs, and Firm
Organization: The Savings and Loan Industry, Journal of Economics and Business 40 (1988): 1-15.
Brueggeman, W. B., and J. D. Fisher, Real Estate Finance and Investments, 9th ed., Homewood,
IL: Irwin, 1993 Edwards, F. R., Managerial Objectives in Regulated Industries, Journal of Political Economy 85
(1977): 147-62. Efron, B. and R. Tibshirani, An Introduction to the Bootstrap, New York: Chapman Hall, 1993 Federal Tax Coordinator, 2nd, New York: Research Institute of America, 1994. Fosheim, J. and M. Kirby, REIT Pricing: An Update of our REIT Pricing Model, Research
published by Green Street Advisors, Inc., October 29, 1991. Golec, J. H., Compensation Policies and Financial Characteristics of Real Estate Investment
Trusts, Journal of Accounting and Economics 17 (1994): 177-205. Greene, W. H., Econometric Analysis, New York: MacMillan Publishing,1990. Green Street Advisors Inc., Compensation of an External REIT Advisor, October 22, 1992. Howe, J. S. and J. D. Shilling, REIT Advisor Performance, AREUEA Journal 18 (1990): 479-99. Jarchow, S. P., Institutional and Pension Fund Real Estate Investment, New York: John Wiley &
Sons, 1990.
20
Jensen, M. C. and W. H. Meckling, Theory of the Firm: Managerial Behavior, Agency Costs and Ownership Structure, Journal of Financial Economics 3 (1976): 305-60.
Jensen, M. C., The Performance of Mutual Funds in the Period 1945-1964, Journal of Finance 23
(May, 1968): 389-416. Kohers, T. and W. G. Simpson, Ownership Form, Regulatory Status, and Performance in the
Savings and Loan Industry, Review of Business and Economic Research 20 (1984): 63-75. Levy, H. and M. Sarnat, Portfolio and Investment Selection: Theory and Practice, Englewood
Cliffs: Prentice Hall, 1984. Lucas, C. R., 1990 REIT Administrative Survey, National Association of Real Estate Investment
Trusts, Inc., December 1991. __________________Compensation Study for Positions in the Real Estate Investment Trust
Industry, National Association of Real Estate Investment Trusts, Inc, November 1989. Murphy, K. J., Corporate Performance and Managerial Remuneration: An Empirical Analysis,
Journal of Accounting and Economics 7 (1985) pp. 11-42. O’Hara, M., Property Rights and the Financial Firm, Journal of Law and Economics October (1981): 317-32. Peck, C. A., Top Executive Compensation, New York: The Conference Board, 1986. Schmalensee, R., Inter-Industry Studies of Structure and Performance, Handbook of Industrial
Economics, Volume 2, ed., Richard Schmalensee and Robert Willig. New York: Elsevier Publishers, 1989.
Sharpe, W. F., Mutual Fund Performance, Journal of Business 39 (January, 1966): 119-138. Solt, M. E. and N. G. Miller, Managerial Incentives: Implications for the Financial Performance
of Real Estate Investment Trusts. AREUEA Journal 13 (1985): 404-23. Verbrugge, J. A., and J. S. Jahera, Jr., Expense-Preference Behavior in the Savings and Loan
Industry, Journal of Money, Credit and Banking 13 (1981): 465-76. Williamson, O. E., Managerial Discretion and Business Behavior, American Economic Review 53
(1963): 1033-57.
21
22
EXHIBIT 1 Financial Characteristics and Ownership Structure
42 Equity REITs Filing Proxy Statements, 1987-1992.
This Exhibit reports means and standard deviations of financial, performance, ownership and compensation variables for 42 equity REITs filing proxy statements over the period 1987-1992. Means are reported for advisor and self-administered REITs respectively. The last column reports the t-statistic for the significance test of the difference between the advisor and self-administered REIT means. Advisor Firms Self-Administered Firms (N=117) (N=113) Mean Std. Dev. Mean Std. Dev. t-statistic Financial CharacteristicsMarket Capitalization $90.45 $147.69 $195.59 $187.43 -4.72** (in millions) Average Total Assets $172.92 $302.20 $206.03 $137.25 -1.07 (in millions) Long-term Debt $56.53 $104.77 $77.09 $88.22 -1.61 (in millions) Net Income/Share $0.20 $1.33 $0.87 $1.36 -2.64** Stock Price $9.23 $5.85 $14.90 $7.72 -6.26** Performance MeasuresAnnual Stock Return -0.033 0.310 0.058 0.276 -2.35* Std. Dev. monthly returns 0.085 0.041 0.074 0.049 1.85 Return on Equity (ROE) 0.004 0.266 0.074 0.132 -2.53* Return on Assets (ROA) 0.006 0.084 0.047 0.071 -4.00** Ownership StructureProportion held by Non-Officer Directors 0.017 0.037 0.048 0.065 -4.44** Proportion held by Advisor or Officers 0.078 0.107 0.042 0.043 3.35** Proportion held in Large Blocks (>5%) 0.185 0.187 0.157 0.146 1.27 Proportion held in Large Blocks by Institutions 0.112 0.159 0.088 0.97 1.38 Compensation (in millions) Advisor Payment $1.020 $0.649 . . . Payment/Asset $0.0121 $0.0100 CEO Salary . . $0.261 $0.141 . Salary/Asset $0.0017 $0.0013 11.06**a Total Executive Salary . . $0.579 $0.323 . Salary/Asset $0.0037 $0.0023 8.78**a ______________________________ * Indicates significance at the 0.05 level. ** Indicates significance at the 0.01 level. a T-statistic is for the difference between mean Payment/Asset and mean Salary/Asset.
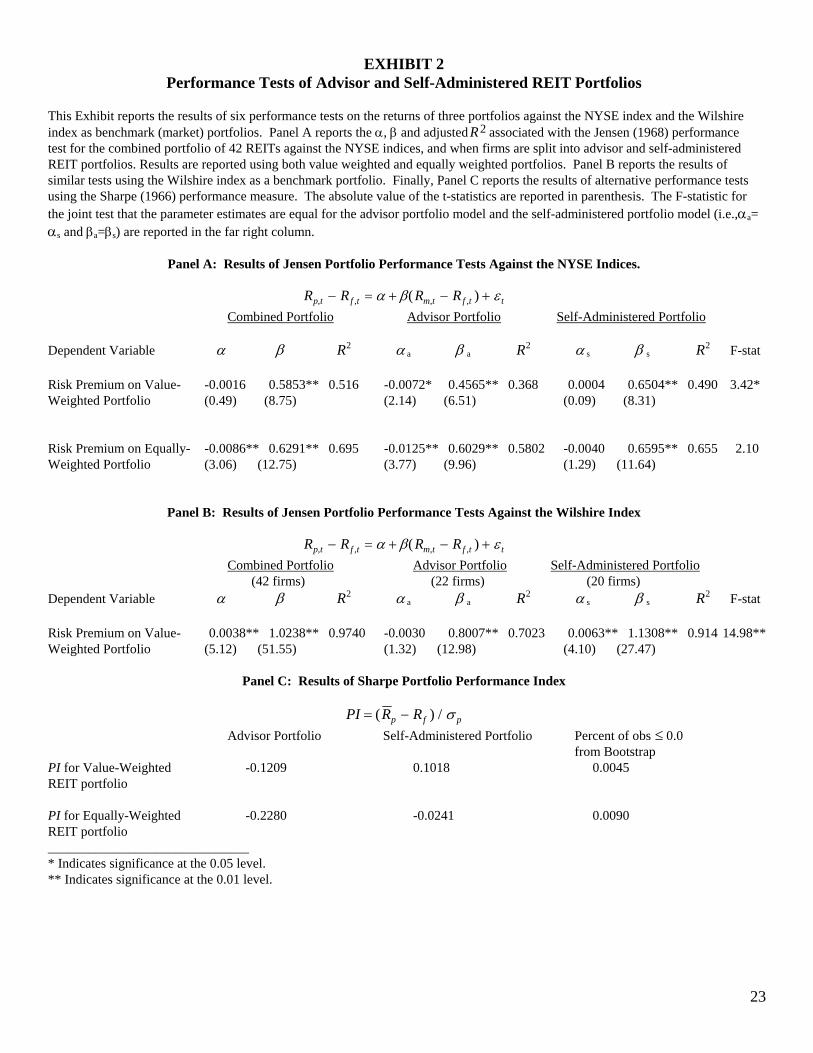
EXHIBIT 2
Performance Tests of Advisor and Self-Administered REIT Portfolios This Exhibit reports the results of six performance tests on the returns of three portfolios against the NYSE index and the Wilshire index as benchmark (market) portfolios. Panel A reports the α, β and adjusted R2 associated with the Jensen (1968) performance test for the combined portfolio of 42 REITs against the NYSE indices, and when firms are split into advisor and self-administered REIT portfolios. Results are reported using both value weighted and equally weighted portfolios. Panel B reports the results of similar tests using the Wilshire index as a benchmark portfolio. Finally, Panel C reports the results of alternative performance tests using the Sharpe (1966) performance measure. The absolute value of the t-statistics are reported in parenthesis. The F-statistic for the joint test that the parameter estimates are equal for the advisor portfolio model and the self-administered portfolio model (i.e.,αa=αs and βa=βs) are reported in the far right column.
Panel A: Results of Jensen Portfolio Performance Tests Against the NYSE Indices.
R R R Rp t f t m t f t t, , , ,( )− = + − +α β ε Combined Portfolio Advisor Portfolio Self-Administered Portfolio Dependent Variable α β R2 α a β a R2 α s β s R2 F-stat Risk Premium on Value- -0.0016 0.5853** 0.516 -0.0072* 0.4565** 0.368 0.0004 0.6504** 0.490 3.42* Weighted Portfolio (0.49) (8.75) (2.14) (6.51) (0.09) (8.31) Risk Premium on Equally- -0.0086** 0.6291** 0.695 -0.0125** 0.6029** 0.5802 -0.0040 0.6595** 0.655 2.10 Weighted Portfolio (3.06) (12.75) (3.77) (9.96) (1.29) (11.64)
Panel B: Results of Jensen Portfolio Performance Tests Against the Wilshire Index
R R R Rp t f t m t f t t, , , ,( )− = + − +α β ε Combined Portfolio Advisor Portfolio Self-Administered Portfolio (42 firms) (22 firms) (20 firms) Dependent Variable α β R2 α a β a R2 α s β s R2 F-stat Risk Premium on Value- 0.0038** 1.0238** 0.9740 -0.0030 0.8007** 0.7023 0.0063** 1.1308** 0.914 14.98** Weighted Portfolio (5.12) (51.55) (1.32) (12.98) (4.10) (27.47)
Panel C: Results of Sharpe Portfolio Performance Index
PI R Rp f p= −( ) / σ Advisor Portfolio Self-Administered Portfolio Percent of obs ≤ 0.0 from Bootstrap PI for Value-Weighted -0.1209 0.1018 0.0045 REIT portfolio PI for Equally-Weighted -0.2280 -0.0241 0.0090 REIT portfolio ______________________________ * Indicates significance at the 0.05 level. ** Indicates significance at the 0.01 level.
23
24
EXHIBIT 3 Mean Performance and Compensation by Ownership Structure
This Exhibit reports the means of annual stock returns (ARET), compensation figures, and returns on assets (ROA) and equity (ROE) for the advisor and self-administered REIT samples when split by below median (Low) and above median (High) values of the various ownership structure variables. The median of the ownership number (reported as a proportion of total shares outstanding) appears below the ownership variable heading. T-statistics for the test difference between high and low ownership group means appear in parenthesis.
Advisor REIT Sample Advisor Holding Director Holding Total Board Holding Institutional Holding Block Holding (median=0.022) (median=0.003) (median=0.039) (median=0.000) (median=0.136) Low High Low High Low High Low High Low High ARET -0.119 0.054 -0.062 -0.005 -0.103 0.087 -0.067 0.009 -0.084 0.018 (t-stat. for diff.) (-3.12)** (-1.00) (-2.48)* (-1.34) (-1.79) Advisor Payment $1.191 $0.845 $1.140 $0.902 $1.193 $0.844 $1.001 $1.044 $1.083 $0.955 (in millons) (2.97)** (2.52)* (3.00)** (-0.35) (1.06) Payment/Asset 0.0117 0.0125 0.0122 0.0120 0.0113 0.0129 0.0119 0.0123 0.0113 0.0128 (-0.44) (0.12) (-0.87) (-0.20) (-0.83) ROE -0.032 0.041 -0.010 0.018 0.032 0.041 0.018 -0.013 0.015 -0.007 (t-stat. for diff.) (-1.48) (-0.55) (-1.50) (0.60) (0.45) ROA 0.001 0.011 0.000 0.012 0.008 0.011 0.002 0.011 0.002 0.010 (t-stat. for diff.) (-0.61) (-0.78) (-0.67) (-0.53) (-0.49)
Self-Administered REIT Sample Officer Holding Director Holding Total Board Holding Institutional Holding Block Holding (median=0.026) (median=0.026) (median=0.068) (median=0.059) (median=0.146) Low High Low High Low High Low High Low High ARET 0.035 0.082 0.072 0.044 0.068 0.048 0.087 0.030 0.102 0.014 (t-stat. for diff.) (-0.90) (0.53) (0.38) (1.12) (1.73) CEO Salary $0.226 $0.255 $0.251 $0.271 $0.271 $0.251 $0.244 $0.277 $0.276 $0.246 (in millions) (0.41) (-0.77) (0.78) (-1.27) (1.15) CEO Salary/Asset $0.0015 $0.0019 $0.0015 $0.0019 $0.0016 $0.0019 $0.0018 $0.0017 $0.0018 $0.0017 (-1.50) (-1.67) (-1.26) (0.33) (0.47) Total Exec. Salary $0.579 $0.580 $0.578 $0.579 $0.617 $0.543 $0.508 $0.649 $0.593 $0.566 (in millions) (-0.03) (0.01) (1.24) (-2.41)* (0.45) Total Salary/Asset $0.0032 $0.0040 $0.0035 $0.0038 $0.0035 $0.0038 $0.0037 $0.0037 $0.0036 $0.0037 (-1.81) (-0.59) (-0.62) (0.00) (-0.11) ROE 0.083 0.064 0.069 0.078 0.074 0.073 0.067 0.080 0.078 0.070 (t-stat. for diff.) (0.81) (-0.37) (0.05) (-0.55) (0.33) ROA 0.046 0.049 0.046 0.048 0.048 0.047 0.044 0.050 0.047 0.048 (t-stat. for diff.) (-0.17) (-0.16) (0.13) (-0.46) (-0.06) _____________________________ * Indicates significance at the 0.05 level. ** Indicates significance at the 0.01 level.
25
Exhibit 4 Jensen Tests on Advisor and Self-Administered Portfolios by
Above and Below Median Ownership Structure Groups This Exhibit reports results of Jensen performance tests on advisor and self-administered REITs when grouped into portfolios of above median and below median levels of advisor stock ownership, officer stock ownership, non-officer or advisor director ownership, total officer (advisor) and director ownership, institutional ownership, and large block ownership. As in Exhibit 2, performance tests are run using value-weighted REIT indices against the NYSE value-weighted index, equally-weighted REIT indices against the NYSE equally-weighted index, and value-weighted REIT indices against the Wilshire REIT index. The t-statistics for the parameter estimates are reported in parenthesis. The F-statistic testing the restriction that the parameter estimates for the above and below median portfolios are equal (i.e., αlow=αhigh and βlow=βhigh) is reported in the far right column.
Advisor REITs Below Median Advisor Ownership Above Median Advisor Ownership αlow βlow R2 αhigh βhigh R2 F-stat. Value-weighted Index -0.0098* 0.3557** 0.2254 -0.0014** 0.6726** 0.3292 3.99** (2.66) (4.65) (2.66) (5.99) Equally-weighted Index -0.0185** 0.5554** 0.3350 -0.0453 0.6380 0.5557 2.93#
(3.68) (6.60) (1.22) (9.48) Wilshire Index -0.0065* 0.6490** 0.4719 0.0046 1.1226** 0.5687 7.59** (2.15) (8.03) (1.08) (9.73) Below Median Director Ownership Above Median Director Ownership αlow βlow R2 αhigh βhigh R2 F-stat. Value-weighted Index -0.01145** 0.3100** 0.1388 -0.0036 0.6481** 0.3638 4.44** (2.71) (3.53) (0.75) (6.45) Equally-weighted Index -0.0140* 0.5115** 0.2647 -0.0087* 0.6061** 0.4965 0.66 (2.56) (5.44) (2.19) (8.43) Wilshire Index -0.0086* 0.5569** 0.2867 0.0022 1.0604** 0.6024 7.80** (2.25) (5.44) (0.58) (10.42) Below Median Total Ownership Above Median Total Ownership αlow βlow R2 αhigh βhigh R2 F-stat. Value-weighted Index -0.0097* 0.3500** 0.2152 -0.0023 0.6600** 0.3449 3.87* (2.59) (4.52) (0.45) (6.20) Equally-weighted Index -0.0184** 0.5430** 0.3140 -0.0056 0.6380** 0.6061 2.68#
(3.56) (5.79) (1.68) (10.50) Wilshire Index -0.0064* 0.6398** 0.4527 0.0037 1.1084** 0.6030 7.78** (2.08) (7.23) (0.92) (10.43) Below Median Institutional Ownership Above Median Institutional Ownership αlow βlow R2 αhigh βhigh R2 F-stat. Value-weighted Index -0.0115* 0.4642** 0.2535 -0.0038 0.4819** 0.2749 0.81 (2.59) (5.01) (0.87) (5.28) Equally-weighted Index -0.0158** 0.6248** 0.4356 -0.0068* 0.5756** 0.5727 1.35 (3.44) (7.47) (2.11) (9.81) Wilshire Index -0.0074 0.7074** 0.3647 0.0009 1.0093** 0.7587 4.10* (1.83) (6.46) (0.35) (14.97) Below Median Large Block Ownership Above Median Large Block Ownership αlow βlow R2 αhigh βhigh R2 F-stat. Value-weighted Index -0.0087* 0.3519** 0.2089 -0.0049 0.6523** 0.3397 2.96#
(2.28) (4.44) (0.96) (6.13) Equally-weighted Index -0.0155** 0.5660** 0.4043 -0.0081* 0.6540** 0.6081 1.37 (3.50) (7.01) (2.37) (10.54) Wilshire Index -0.0054 0.6695** 0.4780 0.0010 1.0704** 0.5666 4.85** (1.76) (8.13) (0.23) (9.69)
26
Exhibit 4 continued
Self-Administered REITs Below Median Officer Ownership Above Median Officer Ownership αlow βlow R2 αhigh βhigh R2 F-stat. Value-weighted Index -0.0017 0.6207** 0.4140 0.0026 0.6789** 0.4655 0.44 (0.42) (7.15) (0.63) (7.93) Equally-weighted Index -0.0054 0.6540 0.5663 -0.0023 0.6582 0.5653 0.18 (1.47) (9.68) (0.62) (9.66) Wilshire Index 0.0040 1.1324** 0.8544 0.0087** 1.1371** 0.8056 1.07 (1.95) (20.44) (3.54) (17.18) Below Median Director Ownership Above Median Director Ownership αlow βlow R2 αhigh βhigh R2 F-stat. Value-weighted Index -0.0030 0.6651** 0.4266 0.0033 0.6238** 0.4495 0.60 (0.69) (7.34) (0.85) (7.68) Equally-weighted Index -0.0055 0.6985** 0.5693 -0.0026 0.6114** 0.5877 0.55 (1.40) (9.74) (0.79) (10.11) Wilshire Index 0.0031 1.1860** 0.8400 0.0090** 1.0829** 0.8374 2.67#
(1.37) (19.34) (4.28) (19.15) Below Median Total Ownership Above Median Total Ownership αlow βlow R2 αhigh βhigh R2 F-stat. Value-weighted Index -0.0019 0.6791** 0.4286 0.0029 0.5906 0.4185 0.51 (0.42) (7.37) (0.74) (7.22) Equally-weighted Index -0.0048 0.7223** 0.5599 -0.0030 0.5701** 0.5695 0.28 (1.15) (9.56) (0.94) (9.74) Wilshire Index 0.0044* 1.2182** 0.8543 0.0083** 1.0481** 0.8161 2.97#
(1.97) (20.43) (3.79) (17.78) Below Median Institutional Ownership Above Median Institutional Ownership αlow βlow R2 αhigh βhigh R2 F-stat. Value-weighted Index 0.0010 0.6222** 0.3671 -0.0002 0.6710 0.5174 0.09 (0.22) (6.50) (0.07) (8.78) Equally-weighted Index -0.0047 0.6828** 0.5141 -0.0037 0.6566** 0.6510 0.05 (1.09) (8.73) (1.20) (11.55) Wilshire Index 0.0069** 1.1887** 0.8341 0.0058** 10.94** 0.8462 0.69 (2.93) (18.92) (2.80) (19.80) Below Median Large Block Ownership Above Median Large Block Ownership αlow βlow R2 αhigh βhigh R2 F-stat. Value-weighted Index -0.0020 0.7063** 0.4202 0.0020 0.5926** 0.4669 0.55 (0.43) (7.24) (0.57) (7.95) Equally-weighted Index -0.0038 0.7000** 0.5578 -0.0046 0.6228** 0.6187 0.37 (0.95) (9.52) (1.46) (10.78) Wilshire Index 0.0045* 1.2842** 0.8609 0.0074** 0.9966** 0.8150 6.57** (1.98) (20.99) (3.53) (17.72) # Indicates significance at the 0.10 level. * Indicates significance at the 0.05 level. ** Indicates significance at the 0.01 level.
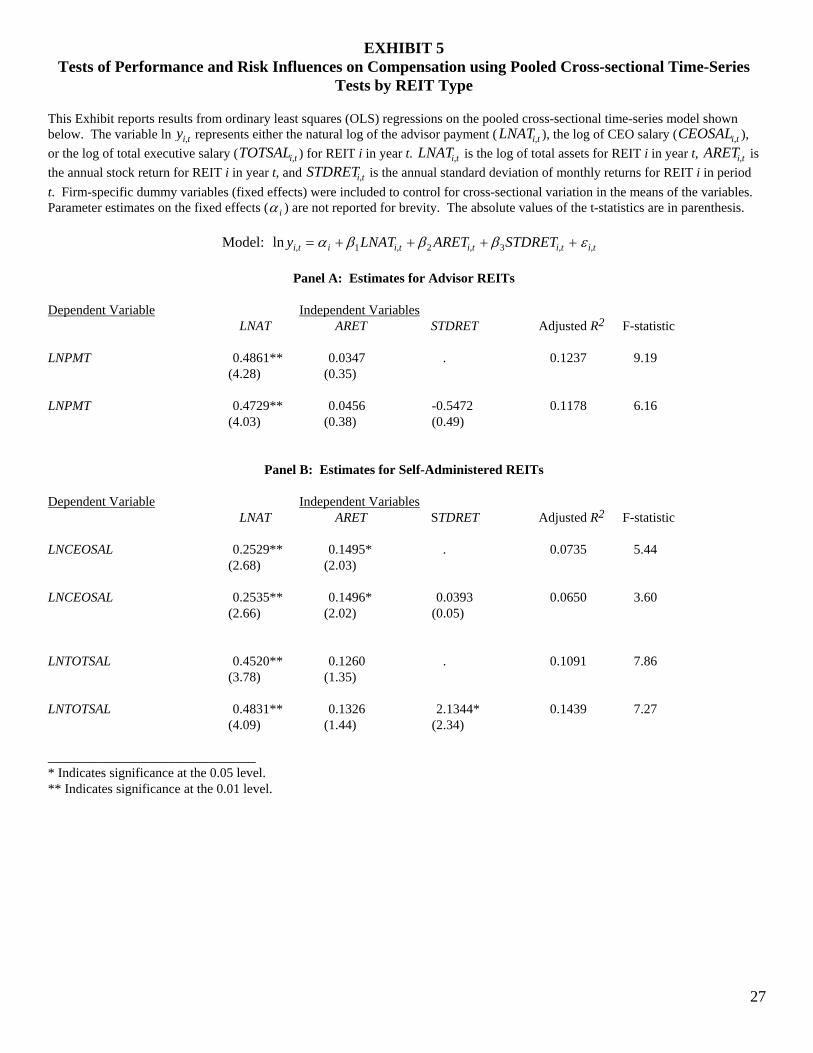
EXHIBIT 5 Tests of Performance and Risk Influences on Compensation using Pooled Cross-sectional Time-Series
Tests by REIT Type This Exhibit reports results from ordinary least squares (OLS) regressions on the pooled cross-sectional time-series model shown below. The variable ln yi t, represents either the natural log of the advisor payment ( LNATi t, ), the log of CEO salary (CEOSAL ), or the log of total executive salary (TOTSAL ) for REIT i in year t.
i t,
i t, LNATi t, is the log of total assets for REIT i in year t, ARETi t, is the annual stock return for REIT i in year t, and STDRETi t, is the annual standard deviation of monthly returns for REIT i in period t. Firm-specific dummy variables (fixed effects) were included to control for cross-sectional variation in the means of the variables. Parameter estimates on the fixed effects (α i ) are not reported for brevity. The absolute values of the t-statistics are in parenthesis.
Model: ln , , ,y LNAT ARET STDRETi t i i t i t i t i t= , ,+ + + +α β β β ε1 2 3
Panel A: Estimates for Advisor REITs Dependent Variable Independent Variables LNAT ARET STDRET Adjusted R2 F-statistic LNPMT 0.4861** 0.0347 . 0.1237 9.19 (4.28) (0.35) LNPMT 0.4729** 0.0456 -0.5472 0.1178 6.16 (4.03) (0.38) (0.49)
Panel B: Estimates for Self-Administered REITs Dependent Variable Independent Variables LNAT ARET STDRET Adjusted R2 F-statistic LNCEOSAL 0.2529** 0.1495* . 0.0735 5.44 (2.68) (2.03) LNCEOSAL 0.2535** 0.1496* 0.0393 0.0650 3.60 (2.66) (2.02) (0.05) LNTOTSAL 0.4520** 0.1260 . 0.1091 7.86 (3.78) (1.35) LNTOTSAL 0.4831** 0.1326 2.1344* 0.1439 7.27 (4.09) (1.44) (2.34) _______________________________ * Indicates significance at the 0.05 level. ** Indicates significance at the 0.01 level.
27

EXHIBIT 6 Tests of Ownership Structure on Advisor/Executive Compensation
This Exhibit reports OLS estimation results when the ownership structure variables are included in the regression. Panel A reports results for advisor REITs when the advisor payment (LNPMT) is the dependent variable. Panels B and C report results for self-administered REITs when CEO salary (LNCEOSAL) and total executive salary (LNTOTSAL) are the dependent variables respectively. The ownership structure variables DIRHLD, ADVHLD, OFFHLD, TOTAL, INST, and LGBLK represent the proportion of total shares outstanding held by non-officer/advisor directors, the advisor, officers, officers (or advisors) plus directors, institutions, and shareholders with a five percent ownership stake respectively. These ownership structure variables are indicated by the variable ηi t, in the model below. The firm dummy variables (α i ) are not reported for brevity. The absolutes value of the t-statistics are in parenthesis.
Model: ln , , , ,y LNAT ARET STDRETi t i i t i t i t i t i t= + , ,+ + + +α β β β β η ε1 2 3 4
Panel A: Results for Advisor REITs Dependent Variable Independent Variables LNAT ARET STDRET ADVHLD DIRHLD TOTAL INST LGBLK LNPMT 0.4804** 0.0455 0.5664 0.1031 . . . . Adj. R2=0.1100 (3.55) (0.39) (0.50) (0.11) F-stat.=4.59 LNPMT 0.4580** 0.0514 -0.2632 . -6.9387 . . . Adj. R2=0.1310 (3.92) (0.44) (0.23) (1.65) F-stat.=5.37 LNPMT 0.4433** 0.0422 -0.4308 . . -0.4540 . . Adj. R2=0.1130 (3.49) (0.36) (0.38) (0.62) F-stat.=4.70 LNPMT 0.4413** 0.0420 -0.3516 . . . 0.7849 . Adj. R2=0.1244 (3.70) (0.36) (0.31) (1.36) F-stat.=5.12 LNPMT 0.4763** 0.0427 -0.5099 . . . . 0.1636 Adj. R2=0.1109 (4.03) (0.36) (0.49) (0.36) F-stat.=4.62 ______________________________ * Indicates significance at the 0.05 level. ** Indicates significance at the 0.01 level.
28
29
Panel B: Results for Self-Administered REITs When CEO Salary is the Dependent Variable Dependent Variable Independent Variables LNAT ARET STDRET OFFHLD DIRHLD TOTAL INST LGBLK LNCEOSAL 0.2336* 0.1471* 0.1628 -1.1088 . . . . Adj. R2=0.0748 (2.46) (1.99) (0.22) (1.59) F-stat.=3.28 LNCEOSAL 0.2592** 0.1602* 0.1245 . 0.4761 . . . Adj. R2=0.0720 (2.72) (2.16) (0.17) . (1.48) F-stat.=3.19 LNCEOSAL 0.2594** 0.1613* 0.0732 . . 0.4391 . . Adj. R2=0.0629 (2.69) (2.15) (0.10) (1.05) F-stat.=2.9 LNCEOSAL 0.2468* 0.1592* 0.0870 . . . 0.4785 . Adj. R2=0.0671 (2.59) (2.14) (0.12) (1.27) F-stat.=3.03 LNCEOSAL 0.2466* 0.1523* 0.0092 . . . . 0.0117 Adj. R2=0.0534 (2.51) (2.00) (0.01) (0.04) F-stat.=2.60
Panel C: Results for Self-Administered REITs When Total Executive Salary is the Dependent Variable Dependent Variable Independent Variables LNAT ARET STDRET OFFHLD DIRHLD TOTAL INST LGBLK LNTOTSAL 0.4707** 0.1358 2.0821* -0.0037 . . . . Adj. R2=0.1273 (3.93) (1.46) (2.23) (0.004) F-stat.=5.12 LNTOTSAL 0.4844** 0.1445 2.2018* . 0.4842 . . . Adj. R2=0.1388 (4.07) (1.56) (2.39) (1.12) F-stat.=5.55 LNTOTSAL Adj. R2=0.1445 0.4945** 0.1526 2.1982* . . 0.7647 . . F-stat.=5.77 (4.15) (1.65) (2.40) (1.48) LNTOTSAL 0.4716** 0.1430 2.1577* . . . 0.4512 . Adj. R2=0.1346 (3.97) (1.54) (2.34) (0.96) F-stat.=5.39 LNTOTSAL Adj. R2=0.1287 0.4817** 0.1431 2.1201* . . . . 0.1481 F-stat.=5.17 (3.95) (1.52) (2.29) (0.42) ______________________________ * Indicates significance at the 0.05 level. ** Indicates significance at the 0.01 level.
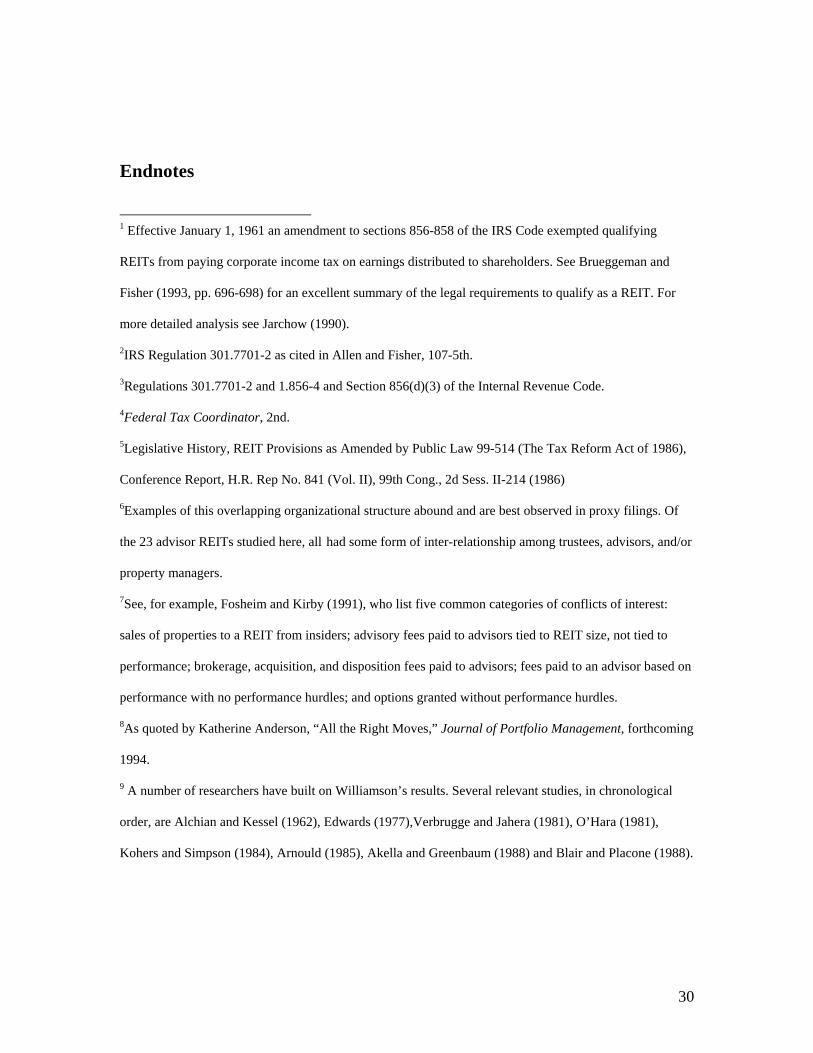
Endnotes 1 Effective January 1, 1961 an amendment to sections 856-858 of the IRS Code exempted qualifying
REITs from paying corporate income tax on earnings distributed to shareholders. See Brueggeman and
Fisher (1993, pp. 696-698) for an excellent summary of the legal requirements to qualify as a REIT. For
more detailed analysis see Jarchow (1990).
2IRS Regulation 301.7701-2 as cited in Allen and Fisher, 107-5th.
3Regulations 301.7701-2 and 1.856-4 and Section 856(d)(3) of the Internal Revenue Code.
4Federal Tax Coordinator, 2nd.
5Legislative History, REIT Provisions as Amended by Public Law 99-514 (The Tax Reform Act of 1986),
Conference Report, H.R. Rep No. 841 (Vol. II), 99th Cong., 2d Sess. II-214 (1986)
6Examples of this overlapping organizational structure abound and are best observed in proxy filings. Of
the 23 advisor REITs studied here, all had some form of inter-relationship among trustees, advisors, and/or
property managers.
7See, for example, Fosheim and Kirby (1991), who list five common categories of conflicts of interest:
sales of properties to a REIT from insiders; advisory fees paid to advisors tied to REIT size, not tied to
performance; brokerage, acquisition, and disposition fees paid to advisors; fees paid to an advisor based on
performance with no performance hurdles; and options granted without performance hurdles.
8As quoted by Katherine Anderson, “All the Right Moves,” Journal of Portfolio Management, forthcoming
1994.
9 A number of researchers have built on Williamson’s results. Several relevant studies, in chronological
order, are Alchian and Kessel (1962), Edwards (1977),Verbrugge and Jahera (1981), O’Hara (1981),
Kohers and Simpson (1984), Arnould (1985), Akella and Greenbaum (1988) and Blair and Placone (1988).
30
10 In this paper we will report Return on Assets (ROA) and Return on Equity (ROE); although the industry
standard during the period became Funds From Operation (FFO), that number was not available over the
entire period.
11 See Efron and Tibshirani (1993) for a discussion of this technique.
12 Of course, factors other than agency problems may play an important role in performance differences.
One important factor for REITs may be due to age differences in REIT assets. If the older advisor REITs
also hold a portfolio of assets that are older than self-administered REIT assets, then advisor REITs may
perform more poorly during periods of depressed real estate returns. We were unable, however, to obtain
data on the age of the assets under REIT management to test this hypothesis directly.
13In this model, β2 and β3 can be interpreted as two growth rates, for example the growth rate in
compensation with respect to returns. β1 is interpreted as the elasticity of the left hand side variable with
respect to total assets.
31


