
- 1 -
Paramaribo, May 2004Paramaribo, May 2004
Regulation of interconnection tariffs –Access charges
Mobile tariff process in Chile
by Roberto Baltra Torresby Roberto Baltra TorresHead of Economic RegulationHead of Economic Regulation
GOVERNMENT OF CHILE
Ministry of Transport andTelecommunications
Under-Secretariat of Telecommunications

- 2 -
• Tariff freedom (general rule)• Obligatory services under law (Articles 24bis and
25)– Services provided by public and intermediary
service licensees via interconnections. Metering, billing, charging and collectionservices supplied to carriers by public servicelicensees (Supreme Decree No. 95 of 1994)
– Tariffs for the services provided viainterconnections enable licensees to cover thecost of use of their networks.
TariffTariff regulationregulation: : Normative aspectsNormative aspects

- 3 -
• Principal services regulated in the context ofpublic mobile telephony service licensees are:– Interconnection at network termination points– Access to other telecommunication service
licensees– Administrative functions (metering, charging,
billing, collection, account management).
TariffTariff regulationregulation: : Normative aspectsNormative aspects
- 4 -
• Fundamental principles of tariff-setting:– Tariffs charged to users reflect costs.– Guarantees the absence of cross-subsidization between
services and tariff areas.– Use of the efficient enterprise model generates
incentives so that the real licensee introduces technological improvements in its network and regulatedservices, thereby increasing their efficiency.
– The tariff-setting process enables any efficiency gainsachieved by the company as a result of improved management and technological development to be passed on to the consumer.
TariffTariff regulationregulation: : ContentContent
- 5 -
• Efficient enterprise (Act 18.168 Articles 30A and 30F):– Provides only regulated services– Only essential service provision costs– Using available technology– Maintaining quality– Determining costs of each service: investment
and operation including capital costs– Invisibility and non-regulated services: only a
portion of the costs is used, in accordance withthe proportion of the assets used.
TariffTariff regulationregulation: : ContentContent

- 6 -
• Incremental development cost (IDC)(Article 30)– General rule: marginal cost pricing
– Expansion plans for each service by tariff area– The IDC is obtained for each expansion plan
– Exception: long-run marginal cost– In the absence of expansion plans
• Long-run total cost (LTYC) (Article 30C)– Project for replenishment of the efficient
company’s assets– Mean volume of provision of the various services.
TariffTariff regulationregulation: : ContentContent

- 7 -
• Efficient tariffs (Article 30E)– Generate revenue equivalent to IDC (marginal cost).– In case of more than one regulated service in a tariff
area, equal marginal profits.– If expansion project provides non-regulated services:
only part of IDC is used, in line with proportion of assets used.
• Final tariffs (Article 30F)– If, and only if, there are economies of scale.– Efficient tariffs are increased until the long-run total cost
(LRTC) is reached.– Minimize introduction of inefficiencies.– If efficient company provides non-regulated services:
only part of LRTC is used, in line with proportion of assets used.
TariffTariff regulationregulation: : ContentContent

- 8 -
• Rate of capital cost (Article 30B)– Risk-free rate of return– Systematic risk of company– Risk premium– Rate of capital cost = risk-free rate + systematic risk *
risk premium• Indexation
§ An index is determined for each service§ Based on published input price indices§ Representative of cost structure of efficient company.
TariffTariff regulationregulation: : ContentContent

- 9 -
Proposal forTEBs
Drawing up of techno-economic
bases(TEBs)
Drawing up of techno-economic
bases(TEBs)
Licensee
Revision and elaboration of
disputed issues
Revision and elaboration of
disputed issues
Referral of preliminary TEBs
Licensee
Revision and elaboration of
preliminary TEBs
Revision and elaboration of
preliminary TEBs
Subtel
Opinions
Registeredthird
parties
Registeredthird
parties
Notificationregistrationparticipants
Notificationregistrationparticipants
Draft TEBs
ProcedureProcedure: : TechnoTechno--economiceconomic bases (bases (TEBsTEBs))

- 10 -
Revision andelaboration of
disputed issues
Revision andelaboration of
disputed issues
Opinion
Dossier
Committeeof Experts
(CoE)
Committeeof Experts
(CoE)
Licensee
If necessary refers disputed issues to
Committee of Experts (CoE)
Analysis andresolution of final
TEBs
Analysis andresolution of final
TEBs
Subtel
Notifies finalTEBs
Initiates tariffstudy
Initiates tariffstudy
Licensee
ProcedureProcedure: : TechnoTechno--economic economic bases (bases (TEBsTEBs))

- 11 -
Tariff proposal
Revision oftariff study
Revision oftariff study
Ministries
Elaboration oftariff study
Elaboration oftariff study
Licensee
Resubmissionreport
Report on objectionsand counter-proposals
Opinion
Dossier
Committeeof
Experts
Committeeof
Experts
Finaldecision
Finaldecision
Incorporatesor resubmits
Incorporatesor resubmits
Licensee
Ministries
OpinionsRegisteredthird
parties
Registeredthird
parties
ProcedureProcedure: : TariffTariff--settingsetting

- 12 -
Endorsmentreport
FinaldecisionFinal
decision
ReviewReview
Elaboration and signature tariff decree
Elaboration and signature tariff decree
Tariff decree
Consultations
DossierOffice of the Controller General of the Republic
Publication of tariffdecree
Publication of tariffdecree
Official journal
Possibleobjections
Ministries
Ministries
Clarificationsrelating to tariff
process
Clarificationsrelating to tariff
process
Ministries
Processing oftariff decree
ProcedureProcedure: : TariffTariff--settingsetting

- 13 -
-380
(20) 20 5 5 30
(Subtel requiresTEB proposal
for newlicensees)
-360
Presentation of TEB
proposal
0 20 25 30 70
-340 -290
PreliminaryTEBs
Submission ofdisputed issues and recourse to Committee of Experts (CoE)
Subtel calls on CoE
CoE report
3 5 2
80
Request forclarifications
CoE clarification
report
Final TEBs
90
180
-180
Presentation oftariff study
120
300
-60
Report on objectionsand counter-
proposals
30
Report containing amendments and
resubmissions
-30 0
330 360
30
Endorsment report and tariff
decree
Presentation oftariff study
-180
CoE report
Registration of participants
5
-365
Comments fromparticipants
-355
15
Opinions on tariff study
10 10
30
-180
210
5
Formation of CoE
Notification of start of process
Draft TEBs
10
40
Formation and
swearing-in of CoE
-270
Notification of start oftariff study
ProcedureProcedure: : Tariff processTariff process

- 14 -
ChileanChilean marketmarket: : Previous situationPrevious situation

- 15 -
ChileanChilean marketmarket: : Mobile subscribersMobile subscribers
Evolución Telefonía Móvil: Abonados Móviles y Penetración (1990- Marzo 2003)
0,1 0,3 0,5 0,6 0,8 1,4 2,2 2,8
6,5
15,0
22,2
34,0
42,641,1
-
1.000.000
2.000.000
3.000.000
4.000.000
5.000.000
6.000.000
7.000.000
8.000.000
1990 1991 1992 1993 1994 1995 1996 1997 1998 1999 2000 2001 2002 Mar-03
-3,0
2,0
7,0
12,0
17,0
22,0
27,0
32,0
37,0
42,0
47,0
Telefonía Móvil Penetración
Trends in mobile telephony: mobile subscribers and penetration(1990 – March 2003)
Mobile telephony Penetration
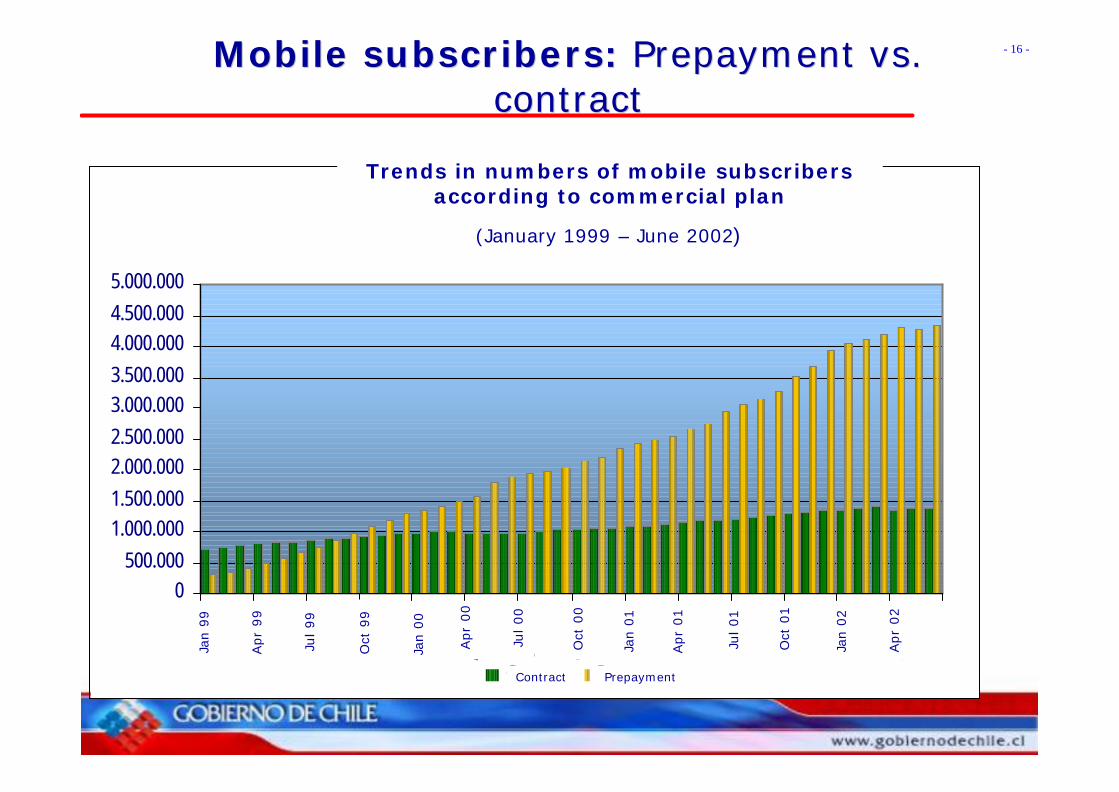
- 16 -MobileMobile subscriberssubscribers: : Prepayment Prepayment vs. vs. contractcontract
Evolución de Abonados Móviles según Plan Comercial
(Enero 1999 - Junio 2002)
0500.000
1.000.0001.500.0002.000.0002.500.0003.000.0003.500.0004.000.0004.500.0005.000.000
Ene-
99
Abr-9
9
Jul-9
9
Oct-9
9
Ene-
00
Abr-0
0
Jul-0
0
Oct-0
0
Ene-
01
Abr-0
1
Jul-0
1
Oct-0
1
Ene-
02
Abr-0
2
Contrato Prepago
Trends in numbers of mobile subscribers according to commercial plan
(January 1999 – June 2002)
Jan 9
9
Apr
99
Jul 99
Oct
99
Jan 0
0
Apr
00
Jul 00
Oct
00
Jan 0
1
Apr
01
Jul 01
Oct
01
Jan 0
2
Contract Prepayment
Apr
99
Apr
02

- 17 -
LinesLines in in service service vs. vs. mobile subscribersmobile subscribers
Lineas en Servicio vs Abonados Móviles(Enero 2000 - Junio 2002)
1.000.000
2.000.000
3.000.000
4.000.000
5.000.000
6.000.000
Ene-00 Abr-00 Jul-00 Oct-00 Ene-01 Abr-01 Jul-01 Oct-01 Ene-02 Abr-02
Líneas en ServicioAbonados Móviles
Lines in service vs. mobile subscribers
(January 2000 – June 2002
Lines in service
Mobile subscribers
Jan 00 Apr 00 Jul 00 Oct 00 Jan 01 Apr 01 Jul 01 Oct 01 Jan 02 Apr 02

- 18 -
Monthly traffic per mobile subscriberMonthly traffic per mobile subscriber
Tráfico Promedio Mensual (generado) por Abonado Móvil 1/ (Minutos Efectivos)
Tipo de Tráfico Primer Trimestre 2003 (p) Primer Trimestre 2002 Variación (%) Móvil - Móvil 43,0 44,8 -4,1% Móvil - Fijo (S) 17,3 19,8 -12,3% Móvil LDI Salida 0,2 0,2 -9,0% Móvil Internet 0,0 0,0 — Móvil SSCC Salida 1,3 1,6 -19,1% Total 62 66 -6,8%
SUBTEL, sobre la base de información proporcionada por las compañías móviles y portadores.(p) Cifras preliminares.áfico promedio por abonado al mes se elaboró como el promedio de la relación de tráfico/número de abonados mensual, loes equivalente a la división entre el tráfico anual y el número de abonados a fines de cada año.
Average monthly traffic (generated) per mobile subscriber 1/
(actual minutes)
Type of traffic First wuarter 2003 (p) First quarter 2002 Variation (%)
Mobile-mobile 43.0 44.8 –4.1%Mobile-fixed 17.3 19.8 –12.3%Mobile LDI outgoing 0.2 0.2 –9.0%Mobile Internet 0.0 0.0 –Mobile supplementaryservices outgoing 1.3 1.6 –19.1%Total 62 66 –6.8%
First quarter 2003 (p) First quarter 2002 Variation (%)
SUBTEL, based on information supplied by mobile operators and carriers. P) Preliminary figuresAverage traffic per subscriber per month was calculated as the average of the ratio of traffic subscriber numbers per month equivalent to the division between annual traffic and the number of subscribers at the end of the year.

- 19 -
Composition of traffic carriedComposition of traffic carried
Composición del Tráfico cursado a través de la Redes de Telefonía Móvil (Primer Trimestre 2003)
Remainder1.3%
Fixed-mobile24.4%
Mobile CCSS (incoming + outgoing)
1.9%
Mobile-mobile51.5%
Mobile-Fixed (outgoing)20.8%
Composition of traffic carried on mobile networks
(First quarter 2003)

- 20 -
Access Access chargescharges: : Previous situationPrevious situation
Cargo de Acceso, no incluye IVA(vigentes a Octubre de 2003)
120,9 120,9 120,9 120,9 120,9
84,6 84,6 84,6 84,6 84,6
0,0
40,0
80,0
120,0
160,0
200,0
Telefónica Móvil Bellsouth Entel PCS Móvil PCS Smartcom
($/m
inut
o)
Horario Normal Horario Reducido
Access charges (excluding VAT)(as at October 2003)
Standard charging period
Reduced-rate charging period
(USD
/min
ute)
- 21 -
Tariff modelTariff model

- 22 -
OverviewOverview
Projection ofdemand
Technicalservicecosts
(service routingfactors)
Networkdesign
Cost ofregulatedservices
Economiccost
Administrativecosts
Accesscharges
Geographicalcoverage

- 23 -
0
2.000
4.000
6.000
8.000
10.000
12.000
1985 1990 1995 2000 2005 2010
Años
Mile
s d
e A
bo
nad
os
RealProyectado
Projection of demandProjection of demand: : SS--curvescurves
Subs
crib
ers
(tho
usan
ds)
Years
Actual
Projected

- 24 -
Geographic segmentation of demandGeographic segmentation of demand
Current position
Current position
Currentposition
Networkdesign

- 25 -
Technical costsTechnical costs: : Routing factorsRouting factors
Economic costper component
NPV=0
Servicerouting factors
Cost of regulatedservices
Oth
er o
per
ato
rs->
mob
ile
etc.
Services
Assets3-sector macro
BSC
NTP interconnecion
MSC/VLR
etc.
1
Mob
ile -
> M
obile
Ow
n n
etw
ork
21
1
50
2
0
70
Accesscharges

- 26 -
• Design “inputs”: area, traffic, number of subscribers
• Only voice services (not data). Monthly traffic is calculated and peak-time traffic is projected
• The real network is not designed; on the basis of performance parameters, the requirements for each item of equipment are calculated
• GSM and possibly CDMA is used• Use of “routing factors”• Design for each year of forecast period
Network designNetwork design: : Main considerationsMain considerations

- 27 -
BTS BSC MSC
Microcell
Macrocellsite
Transmission BTS - BSC
Transmission BSC-MSC
HLR
Transmission MSC - Others
Designparameters
Coverage
Demand
Totalnetwork
Given: quality ofservice
Given: spectrum, HC traffic, bandwidths, re-use: No. of sectors
Network designNetwork design: : Coverage and capacityCoverage and capacity
Coveragenetwork
Trafficnetwork
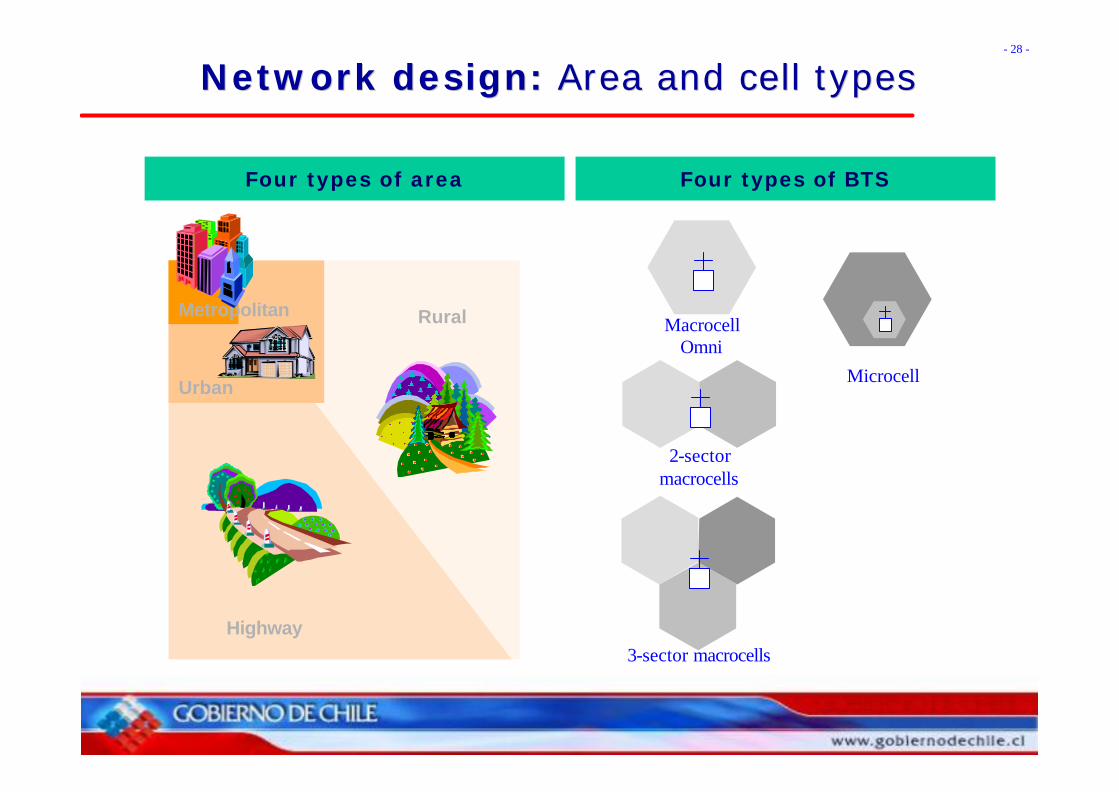
- 28 -
Four types of area
Urban
Metropolitan
Highway
Rural
Four types of BTS
MacrocellOmni
2-sectormacrocells
3-sector macrocells
Microcell
Network designNetwork design: : Area and cell typesArea and cell types

- 29 -
0%
10%
20%
30%
40%
50%
60%
70%
80%
90%
100%
0% 10% 20% 30% 40% 50% 60% 70% 80% 90% 100%
Area
Pop
ulat
ion
Met
rop
olit
an
Urb
an Rural and highways
Network designNetwork design: : Coverage requirementsCoverage requirements

- 30 -
• Many network design calculations are based on the following equation:• Number of components required = Demand/
(Capacity per component * use)• Use is a parameter for reflecting the
combination of various effects of decreasing use:• Maximum design use: this usage parameter
ensures that network equipment is not overloaded by any change in demand, e.g. some types of equipment are recommended to be used at no more than 90% of their capacity.
Network designNetwork design: : Coverage equipmentCoverage equipment

- 31 -
• Use is a parameter for reflecting the combination of various effects of decreasing use (continued):– Use as a function of reasonable growth: in a real
mobile network, development of the network is in response to expected demand (months to years), depending on the modularity of the equipment and the time taken to make all preparations for getting the new equipment online.
• Takes account of non-homogeneous features of traffic.
Network designNetwork design: : Coverage equipmentCoverage equipment
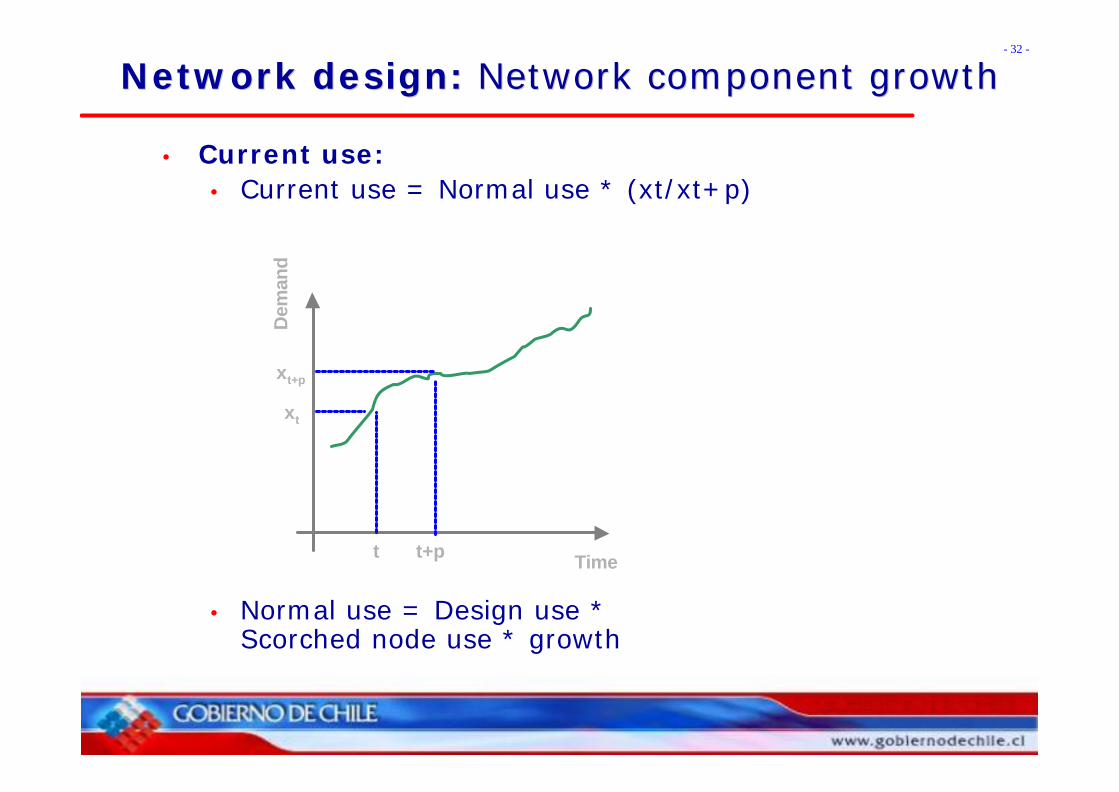
- 32 -
• Current use:• Current use = Normal use * (xt/xt+p)
• Normal use = Design use *Scorched node use * growth
t t+p Time
Dem
and
xt
xt+p
Network designNetwork design: : Network component growthNetwork component growth

- 33 -
Number of BTSNumber of BSCper primary zone
Optimizationmodel
MSC numberand location
Network designNetwork design: : Optimization modelOptimization model

- 34 -
• General layout
Input information
Demand projection
Switching costs
Link costs
Switch location model
Model Output
- Switches:
- Quantity
- Capacity
- Link capacity
Optimum design
Network designNetwork design: : Switch location modelSwitch location model

- 35 -
BTS BSC MSC
Min {Costs (Inv+Op)}
s.a.- Meeting of demand
- Conservation of flow
- Capacities
- Switches
- Links
Network designNetwork design: : Switch location modelSwitch location model

- 36 -
DatabaseCosts December
2002
Cost trendsover time
Usefullifetime
Cost ofnetwork
componentsCAPEXOPEX
Administrativecosts
Operacionalstaff costsNetwork
design
Demandprojection
Economiccost by
component
NPV=0
TariffTariff calculationcalculation: : Economic costEconomic cost

- 37 -
This is a tool for stimulating the impact of a change in access charges on the various tariffs
To do this, it finds out the new financial equilibrium of the enterprise
Demand equilibriumDemand equilibrium: : General descriptionGeneral description
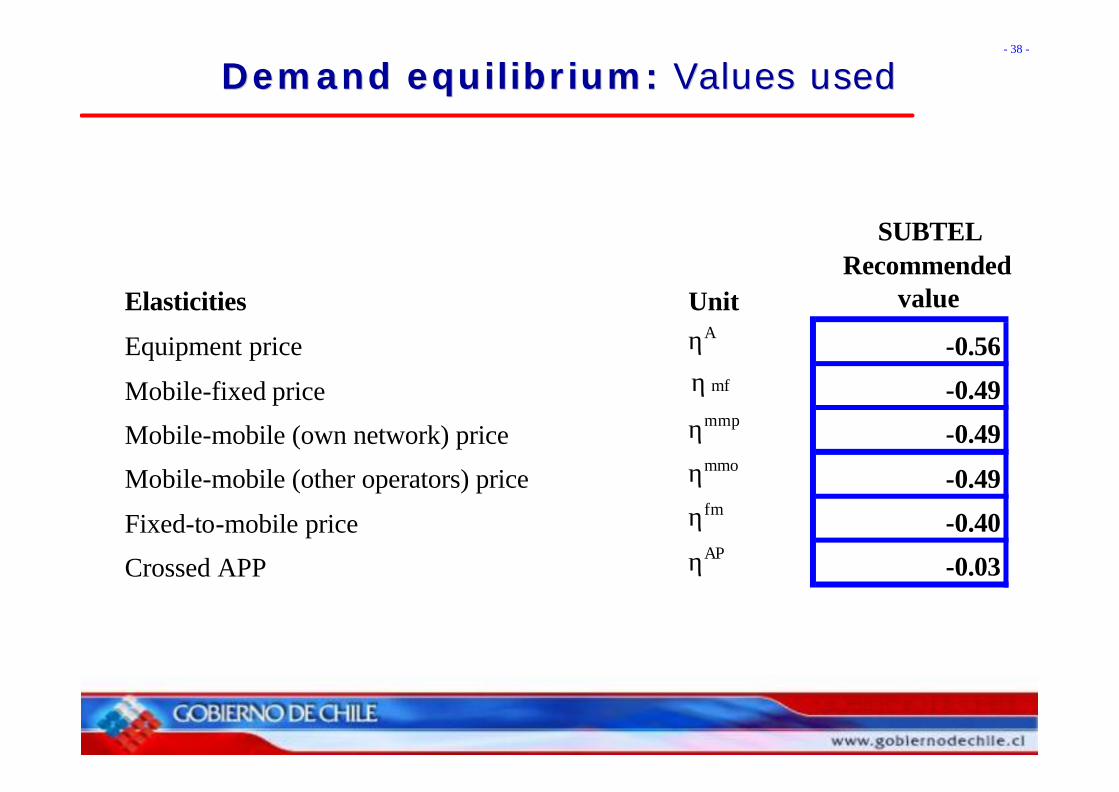
- 38 -
Elasticities Unit
SUBTELRecommended
value
Equipment price ηA-0.56
Mobile-fixed price η mf -0.49
Mobile-mobile (own network) price ηmmp-0.49
Mobile-mobile (other operators) price ηmmo-0.49
Fixed-to-mobile price ηfm-0.40
Crossed APP ηAP-0.03
Demand equilibriumDemand equilibrium: : Values usedValues used

- 39 -
Change in access charge
Change in revenue
Recover revenue to maintain financial equilibrium
Via equipment subsidies
Via new tariffsVia traffic
Change in demand
Demand equilibriumDemand equilibrium: : Functional descriptionFunctional description

- 40 -
• Delta revenue
( )0 1 0oo mIN CA CA F −∆ = − ⋅
• Recovery by flows
( )11 1 0
oo m oo mR CA F F− −∆ = ⋅ −
• Recovery by subsidies
( ) ( ) AAAAAA DSCDSCR 00112 ⋅−−⋅−=∆
• Recovery by prices
( ) ( )31 1 0 0
1 1 0 0
1 1 0 0
mf tf mf mf tf mf
mmo mmo mmo mmo
mmp mmp mmp mmp
R P C F P C F
P F P F
P F P F
∆ = − ⋅ − − ⋅
+ ⋅ − ⋅
+ ⋅ − ⋅
Demand equilibriumDemand equilibrium: : Detailed descriptionDetailed description

- 41 -
• Flows
1 01 0
0
1
mfmf mf
mf mfmf
P PF F
P
η −
= ⋅ +
0 11 0
0
1
mmommo mmo
mmo mmommo
P PF F
P
η −
= ⋅ +
0 11 0
0
1
mmpmmp mmp
mmp mmpmmp
P PF F
P
η −
= ⋅ +
DemandDemand equilibriumequilibrium: : Detailed descriptionDetailed description

- 42 -
• Subscribers
0 1 1 0 1 0 1 01 0
0 0 0 0
1 1 1 1
A Ap Ap Ap
A A mf mf mmo mmo mmp mmpA A
A A mf mmo mmp
S S P P P P P PD D
C S P P P
η η η η − − − −= ⋅ + + + + −
• Financial balance equation
321 RRRIN ∆+∆+∆=∆
Demand equilibriumDemand equilibrium: : Detailed descriptionDetailed description

- 43 -
( ) ( ) ( )( ) ( ) ( )
( )( ) Ammpmmpmmp
mmommommo
mftfmfmftf
AAAAA
FP,F
FP,F
FCP,FC
DSC,,,DCRIN
0001
001
001
0011
⋅−⋅+
⋅−⋅+
⋅−−⋅−+
⋅−−⋅−=∆−∆
A1
mmp1
mmp1
A1
mmo1
mmo1
A1
mf1
mf1
mmp1
mmo1
mf1
A1
A1
SPP
SPP
SPP
PPPSS
Demand equilibriumDemand equilibrium: : Financial balanceFinancial balance

- 44 -
( )
2 2 2 2
1 0 1 0 1 0 1 0
0 0 0 0
1
. .
0 : Ecuación de balance financiero
mf mf mmo mmo mmp mmp
mf mmo mmp
p p p p p p s sMin
p p p s
s a
F p
− − − − + + +
=r
1 1 1 1 1, , ,mf mmo mmpp p p p s = r
Initial disruption of systemPrices based on self-financing for each service
Demand equilibriumDemand equilibrium: : Financial balanceFinancial balance
Financial balance equation
r
r
- 45 -
OutputsOutputs: : Tariff decreesTariff decrees

- 46 -
Comparison of Comparison of time time bandsbands
46
Current time structure
Time band Workingdays Saturdays
Sundaysand holidays
00:00 - 08:59 Reduced rate Reduced rate Reduced rate
09:00 - 13:59 Standard rate Standard rate Reduced rate
14:00 - 19:59 Standard rate Reduced rate Reduced rate
20:00 - 23:59 Reduced rate Reduced rate Reduced rate
Proposed time structure
Time band Workingdays Saturdays
Sundaysand holidays
00:00 - 07:59 Night rate Night rate Night rate
08:00 - 13.59 standard rate Standard rate Reduced rate
14:00 - 19:59 standard rate Reduced rate Reduced rate
20:00 - 23:59 Reduced rate Reduced rate Reduced rate
Traffic distribution:
Standard rate : 61.4%
Reduced rate : 33.5%
Night rate : 5.1%
Traffic distribution:
Standard rate : 57.9%
Reduced rate : 42.1%

- 47 -
Estructura Horaria Cargo de Acceso ($/min)
120.3
87.184.2
65.3
43.5
0.0
20.0
40.0
60.0
80.0
100.0
120.0
140.0
Former scheme Tariff decrees 2004-2009
Standard rate
Reduced rate
Night rate
Access Access chargescharges: : New pricesNew prices
Access charge by time band (USD/min)

- 48 -
Access Access chargescharges: : Falling pricesFalling prices
Cargo de Acceso 2004-2008 ($/min)
72,70
105,10105,10
76,4678,8080,0080,40
50,00
60,00
70,00
80,00
90,00
100,00
110,00
0 1 2 3 4 5 6
Access charges 2004-2008 (USD/min)

- 49 -
Paramaribo, May 2004Paramaribo, May 2004
ENDRegulation of interconnection tariffs –
Access charges for mobile tariffs in Chile
by Roberto Baltra Torresby Roberto Baltra TorresHead of Economic RegulationHead of Economic Regulation
GOVERNMENT OF CHILEMINISTRY OF TRANSPORT AND TELECOMMUNICATIONS
UNDER-SECRETARIAT OF TELECOMMUNICATIONS


