
November 2007
Research Report: UCPRC-RR-2007-08
RRReeefffllleeeccctttiiivvveee CCCrrraaaccckkkiiinnnggg SSStttuuudddyyy:::
BBBaaaccckkkcccaaalllcccuuulllaaatttiiiooonnn ooofff HHHVVVSSS TTTeeesssttt SSSeeeccctttiiiooonnn
DDDeeefffllleeeccctttiiiooonnn MMMeeeaaasssuuurrreeemmmeeennntttsss
Authors:
Q. Lu, D. Jones, and J. Harvey
Partnered Pavement Research Program (PPRC) Contract Strategic Plan Element 4.10:
Development of Improved Rehabilitation Designs for Reflective Cracking
PREPARED FOR:
California Department of Transportation
Division of Research and Innovation
Office of Roadway Research
PREPARED BY:
University of California
Pavement Research Center
UC Davis, UC Berkeley

i
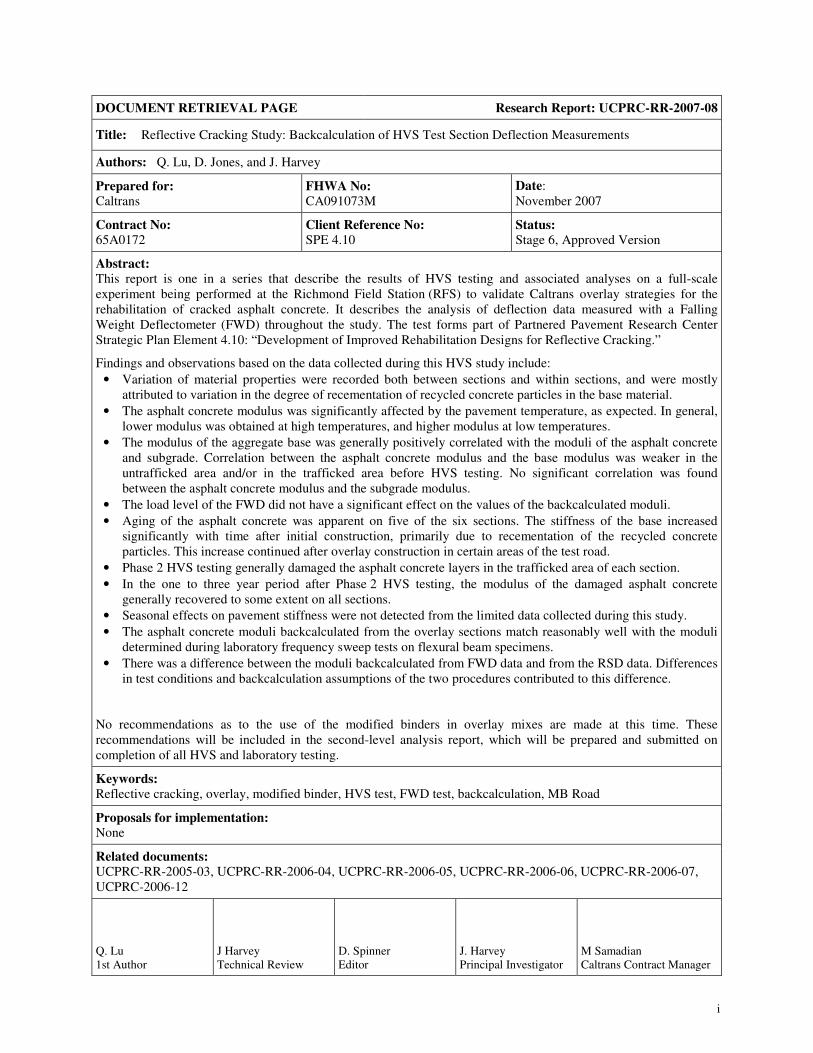
DOCUMENT RETRIEVAL PAGE Research Report: UCPRC-RR-2007-08
Title: Reflective Cracking Study: Backcalculation of HVS Test Section Deflection Measurements
Authors: Q. Lu, D. Jones, and J. Harvey
Prepared for:
Caltrans
FHWA No:
CA091073M
Date:
November 2007
Contract No:
65A0172
Client Reference No:
SPE 4.10
Status:
Stage 6, Approved Version
Abstract:
This report is one in a series that describe the results of HVS testing and associated analyses on a full-scale
experiment being performed at the Richmond Field Station (RFS) to validate Caltrans overlay strategies for the
rehabilitation of cracked asphalt concrete. It describes the analysis of deflection data measured with a Falling
Weight Deflectometer (FWD) throughout the study. The test forms part of Partnered Pavement Research Center
Strategic Plan Element 4.10: “Development of Improved Rehabilitation Designs for Reflective Cracking.”
Findings and observations based on the data collected during this HVS study include:
• Variation of material properties were recorded both between sections and within sections, and were mostly
attributed to variation in the degree of recementation of recycled concrete particles in the base material.
• The asphalt concrete modulus was significantly affected by the pavement temperature, as expected. In general,
lower modulus was obtained at high temperatures, and higher modulus at low temperatures.
• The modulus of the aggregate base was generally positively correlated with the moduli of the asphalt concrete
and subgrade. Correlation between the asphalt concrete modulus and the base modulus was weaker in the
untrafficked area and/or in the trafficked area before HVS testing. No significant correlation was found
between the asphalt concrete modulus and the subgrade modulus.
• The load level of the FWD did not have a significant effect on the values of the backcalculated moduli.
• Aging of the asphalt concrete was apparent on five of the six sections. The stiffness of the base increased
significantly with time after initial construction, primarily due to recementation of the recycled concrete
particles. This increase continued after overlay construction in certain areas of the test road.
• Phase 2 HVS testing generally damaged the asphalt concrete layers in the trafficked area of each section.
• In the one to three year period after Phase 2 HVS testing, the modulus of the damaged asphalt concrete
generally recovered to some extent on all sections.
• Seasonal effects on pavement stiffness were not detected from the limited data collected during this study.
• The asphalt concrete moduli backcalculated from the overlay sections match reasonably well with the moduli
determined during laboratory frequency sweep tests on flexural beam specimens.
• There was a difference between the moduli backcalculated from FWD data and from the RSD data. Differences
in test conditions and backcalculation assumptions of the two procedures contributed to this difference.
No recommendations as to the use of the modified binders in overlay mixes are made at this time. These
recommendations will be included in the second-level analysis report, which will be prepared and submitted on
completion of all HVS and laboratory testing.
Keywords:
Reflective cracking, overlay, modified binder, HVS test, FWD test, backcalculation, MB Road
Proposals for implementation: None
Related documents:
UCPRC-RR-2005-03, UCPRC-RR-2006-04, UCPRC-RR-2006-05, UCPRC-RR-2006-06, UCPRC-RR-2006-07,
UCPRC-2006-12
Q. Lu
1st Author
J Harvey
Technical Review
D. Spinner
Editor
J. Harvey
Principal Investigator
M Samadian
Caltrans Contract Manager

ii
DISCLAIMER
The contents of this report reflect the views of the authors who are responsible for the facts and accuracy
of the data presented herein. The contents do not necessarily reflect the official views or policies of the
State of California or the Federal Highway Administration. This report does not constitute a standard,
specification, or regulation.
PROJECT OBJECTIVES
The objective of this project is to develop improved rehabilitation designs for reflective cracking for
California.
This objective will be met after completion of four tasks identified by the Caltrans/Industry Rubber
Asphalt Concrete Task Group (RACTG):
1. Develop improved mechanistic models of reflective cracking in California
2. Calibrate and verify these models using laboratory and HVS testing
3. Evaluate the most effective strategies for reflective cracking
4. Provide recommendations for reflective cracking strategies
This document is one of a series addressing Tasks 2 and 3.
ACKNOWLEDGEMENTS
The University of California Pavement Research Center acknowledges the assistance of the Rubber
Pavements Association, Valero Energy Corporation, and Paramount Petroleum which contributed funds
and asphalt binders for the construction of the Heavy Vehicle Simulator test track discussed in this study.

iii
REFLECTIVE CRACKING STUDY REPORTS
The reports prepared during the reflective cracking study document data from construction, Heavy
Vehicle Simulator (HVS) tests, laboratory tests, and subsequent analyses. These include a series of first-
and second-level analysis reports and two summary reports. On completion of the study this suite of
documents will include:
1. Reflective Cracking Study: Summary of Construction Activities, Phase 1 HVS testing and Overlay
Construction (UCPRC-RR-2005-03).
2. Reflective Cracking Study: First-level Report on the HVS Rutting Experiment (UCPRC-RR-
2007-06).
3. Reflective Cracking Study: First-level Report on HVS Testing on Section 590RF — 90 mm
MB4-G Overlay (UCPRC-RR-2006-04).
4. Reflective Cracking Study: First-level Report on HVS Testing on Section 589RF — 45 mm
MB4-G Overlay (UCPRC-RR-2006-05).
5. Reflective Cracking Study: First-level Report on HVS Testing on Section 587RF — 45 mm
RAC-G Overlay (UCPRC-RR-2006-06).
6. Reflective Cracking Study: First-level Report on HVS Testing on Section 588RF — 90 mm
AR4000-D Overlay (UCPRC-RR-2006-07).
7. Reflective Cracking Study: First-level Report on HVS Testing on Section 586RF — 45 mm
MB15-G Overlay (UCPRC-RR-2006-12).
8. Reflective Cracking Study: First-level Report on HVS Testing on Section 591RF — 45 mm
MAC15TR-G Overlay (UCPRC-RR-2007-04).
9. Reflective Cracking Study: HVS Test Section Forensic Report (UCPRC-RR-2007-05).
10. Reflective Cracking Study: First-Level Report on Laboratory Fatigue Testing (UCPRC-RR-
2006-08).
11. Reflective Cracking Study: First-Level Report on Laboratory Shear Testing (UCPRC-RR-2006-
11).
12. Reflective Cracking Study: Backcalculation of HVS test section deflection measurements
(UCPRC-RR-2007-08).
13. Reflective Cracking Study: Second-level Analysis Report (UCPRC-RR-2007-09).
14. Reflective Cracking Study: Summary Report (UCPRC-SR-2007-01). Detailed summary report.
15. Reflective Cracking Study: Summary Report (UCPRC-SR-2007-03). Four page summary report.

iv
CONVERSION FACTORS
SI* (MODERN METRIC) CONVERSION FACTORS
APPROXIMATE CONVERSIONS TO SI UNITS
Symbol Convert From Multiply By Convert To Symbol
LENGTH
in inches 25.4 millimeters mm
ft feet 0.305 meters m
AREA
in2 square inches 645.2 square millimeters mm2
ft2 square feet 0.093 square meters m2
VOLUME
ft3 cubic feet 0.028 cubic meters m3
MASS
lb pounds 0.454 kilograms kg
TEMPERATURE (exact degrees)
°F Fahrenheit 5 (F-32)/9 Celsius C
or (F-32)/1.8
FORCE and PRESSURE or STRESS
lbf poundforce 4.45 newtons N
lbf/in2 poundforce/square inch 6.89 kilopascals kPa
APPROXIMATE CONVERSIONS FROM SI UNITS
Symbol Convert From Multiply By Convert To Symbol
LENGTH
mm millimeters 0.039 inches in
m meters 3.28 feet ft
AREA
mm2 square millimeters 0.0016 square inches in2
m2 square meters 10.764 square feet ft2
VOLUME
m3 cubic meters 35.314 cubic feet ft3
MASS
kg kilograms 2.202 pounds lb
TEMPERATURE (exact degrees)
C Celsius 1.8C+32 Fahrenheit F
FORCE and PRESSURE or STRESS
N newtons 0.225 poundforce lbf
kPa kilopascals 0.145 poundforce/square inch lbf/in2
*SI is the symbol for the International System of Units. Appropriate rounding should be made to comply with Section 4 of ASTM E380.
(Revised March 2003)
v
EXECUTIVE SUMMARY
This report is one in a series that describe the results of HVS testing and associated analyses on a full-
scale experiment being performed at the Richmond Field Station (RFS) to validate Caltrans overlay
strategies for the rehabilitation of cracked asphalt concrete. It describes the analysis of deflection data
measured with a Falling Weight Deflectometer (FWD) after initial construction, before and after each
HVS test in the first phase of testing on the original DGAC surface, before and after construction of the
overlays, and before and after each HVS test on each overlay. FWD results are compared with Road
Surface Deflectometer (RSD) measurements taken during each HVS test. The testing forms part of
Partnered Pavement Research Center Strategic Plan Element 4.10: “Development of Improved
Rehabilitation Designs for Reflective Cracking.”
The objective of this project is to develop improved rehabilitation designs for reflective cracking for
California. This objective will be met after completion of the following four tasks:
1. Develop improved mechanistic models of reflective cracking in California
2. Calibrate and verify these models using laboratory and HVS testing
3. Evaluate the most effective strategies for reflective cracking
4. Provide recommendations for reflective cracking strategies
This report is one of a series addressing Tasks 2 and 3. It consists of six main chapters. Chapter 2 provides
an overview of the HVS the test program including experiment layout, loading sequence, instrumentation,
and data collection. Chapter 3 summarizes backcalculation and analysis of the FWD data. Chapter 4
discusses aging, seasonal effects and stiffness recovery, and Chapter 5 provides a comparison of
backcalculated and laboratory results. Chapter 6 contains a summary of the results together with
conclusions and observations.
The underlying pavement was designed following standard Caltrans procedures and it incorporates a
410-mm (16 in) Class 2 aggregate base on subgrade with a 90-mm dense-graded asphalt concrete (DGAC)
surface. Design thickness was based on a subgrade R-value of 5 and a Traffic Index of 7
(~121,000 equivalent standard axles, or ESALs). This structure was trafficked with the HVS in 2003 to
induce fatigue cracking, then overlaid with six different treatments to assess their ability to limit reflective
cracking. The treatments included:
• Half-thickness (45 mm [1.7 in]) MB4 gap-graded (MB4-G) overlay;
• Full-thickness (90 mm [3.5 in]) MB4 gap-graded (MB4-G) overlay;

vi
• Half-thickness MB4 gap-graded overlay with minimum 15 percent recycled tire rubber
(MB15-G);
• Half-thickness MAC15TR gap-graded overlay with minimum 15 percent recycled tire rubber
(MAC15-G);
• Half-thickness rubberized asphalt concrete gap-graded overlay (RAC-G), included as a control for
performance comparison purposes, and
• Full-thickness (90 mm) AR4000 dense-graded overlay (AR4000-D), included as a control for
performance comparison purposes.
The thickness for the AR4000-D overlay was determined according to Caltrans Test Method 356. The
other overlay thicknesses were either the same or half of the AR4000-D overlay thickness. Details on
construction, the first phase of HVS trafficking, and second phase HVS trafficking on the overlays are
provided in earlier reports. Laboratory fatigue and shear studies were conducted in parallel with HVS
testing and are also discussed in separate first-level reports. Comparison of the laboratory and test section
performance will be discussed in a second-level report once all the data from all of the studies has been
collected and analyzed.
Findings and observations based on the data collected during this analysis include:
• Variation of material properties were recorded both between sections and within sections, which
was mostly attributed to variation in the degree of recementation of recycled concrete particles in
the aggregate base material. Base and subgrade were stiffest on Sections 567RF/586RF
(MB15-G), and weakest on Sections 572RF/590RF (90 mm MB4-G).
• The asphalt concrete modulus was significantly affected by the pavement temperature, as
expected. In general, lower modulus was obtained at high temperatures, and higher modulus at
low temperatures.
• The modulus of the aggregate base was generally positively correlated with the moduli of the
asphalt concrete and subgrade. Correlation between the asphalt concrete modulus and the base
modulus was weaker in the untrafficked area and/or in the trafficked area before HVS testing,
probably because of recementation of particles in the base after construction and subsequent
destruction of the bonds during HVS trafficking. No significant correlation was found between
the asphalt concrete modulus and the subgrade modulus.
• The load level of the FWD did not have a significant effect on the values of the backcalculated
moduli.
• Aging of the asphalt concrete was apparent on all sections except Section 591RF (MAC15-G). A
logarithm function appeared to fit the data well. The stiffness of the base increased significantly

vii
with time after initial construction, primarily due to recementation of the recycled concrete
particles. This increase continued after overlay construction in certain areas of the test road (e.g.
in the vicinity of Sections 586RF [MB15-G] and 588RF [AR4000-D]), but not in other areas.
• Phase 2 HVS testing generally damaged the asphalt concrete layers in the trafficked area of each
section. Minimal damage was measured on Section 586RF (MB15-G).
• In the one to three year period after Phase 2 HVS testing, the modulus of the damaged asphalt
concrete generally recovered to some extent except for part of the control section overlaid with
AR4000-D, where the asphalt concrete layer was severely cracked. Little change in the moduli of
the base and subgrade was recorded on this subsection. The recovery rates of sections overlaid
with RAC-G and MB4-G (45 mm) were similar, while that of the MB4-G (90 mm) overlay
section was slightly higher.
• Seasonal effects on pavement stiffness were not detected from the limited data collected during
this study.
• The asphalt concrete moduli backcalculated from the overlay sections match reasonably well with
the moduli determined during laboratory frequency sweep tests on flexural beam specimens.
However, the asphalt concrete moduli backcalculated from the underlying DGAC were
significantly lower than those measured by the frequency sweep test in the laboratory.
• There was a difference between the moduli backcalculated from FWD data and from the RSD
data. Differences in test conditions (temperature, load, and load frequency) and backcalculation
assumptions of the two procedures contributed to this difference.
The following recommendations for using backcalculated data in other reflective cracking study analyses
are suggested:
• All sections except Sections 573RF/591RF should be subdivided into two equal-length
subsections (i.e. Stations 2 to 8, and Stations 8 to 14) to account for non-uniformity of material
properties within test sections in pavement modeling and simulation. Sections 573RF/591RF can
be treated as one uniform section.
• For pavement modeling and simulations of actual HVS test conditions, the asphalt concrete
modulus backcalculated from both FWD and RSD testing should be used. The asphalt concrete
modulus determined from laboratory frequency sweep test on flexural beams should be used for
modeling and simulation of uniform sections.
No recommendations as to the use of modified binder mixes are made at this time. These
recommendations will be included in the second-level analysis report, which will be prepared and
submitted on completion of all HVS and laboratory testing and analysis.

viii

ix
TABLE OF CONTENTS
EXECUTIVE SUMMARY......................................................................................................................... v
LIST OF TABLES ..................................................................................................................................... xi
LIST OF FIGURES .................................................................................................................................. xii
1. INTRODUCTION.......................................................................................................................... 1
1.1. Objectives ............................................................................................................................ 1
1.2. Overall Project Organization ............................................................................................... 1
1.3. Structure and Content of This Report .................................................................................. 4
1.4. Measurement Units.............................................................................................................. 5
2. HEAVY VEHICLE SIMULATOR TEST DETAILS ................................................................ 7
2.1. Phase 2 Experiment Layout ................................................................................................. 7
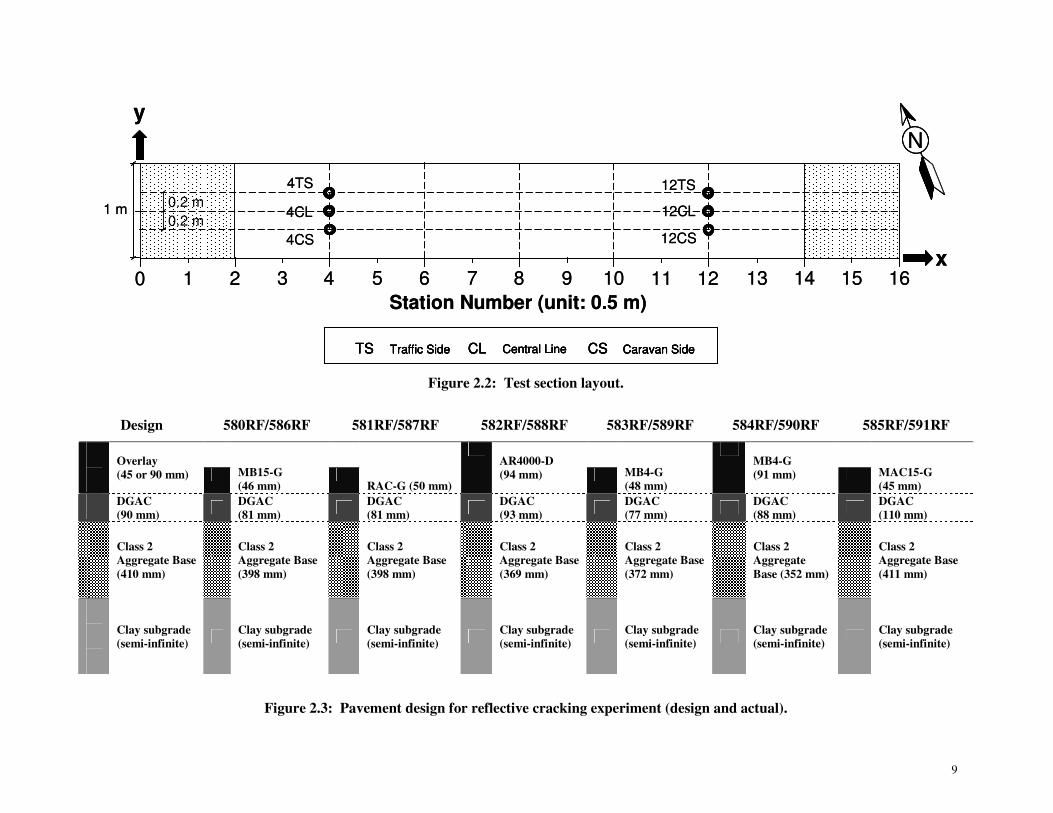
2.2. Test Section Layout ............................................................................................................. 7
2.3. Underlying Pavement Design .............................................................................................. 7
2.4. Summary of HVS Testing on the Underlying Layer ......................................................... 10
2.5. Overlay Design .................................................................................................................. 12
2.6. Summary of Phase 2 HVS Testing .................................................................................... 14
2.6.1 Test Section Failure Criteria.................................................................................. 14
2.6.2 Environmental Conditions..................................................................................... 14
2.6.3 Test Duration......................................................................................................... 15
2.6.4 Loading Program................................................................................................... 15
2.7. Phase 2 Test Results .......................................................................................................... 16
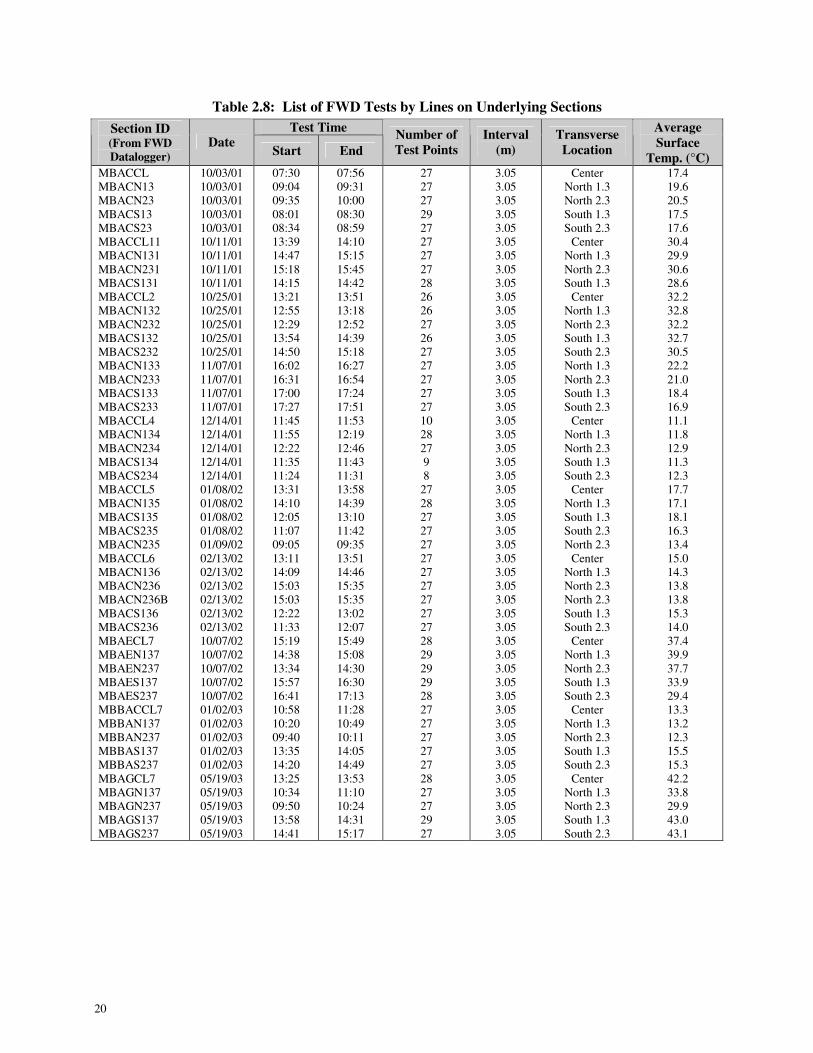
2.8. Summary of FWD Testing................................................................................................. 18
3. DEFLECTION ANALYSIS........................................................................................................ 25
3.1. Backcalculation Methods Used ......................................................................................... 25
3.2. Section Characterization.................................................................................................... 25
3.2.1 Sections 567RF and 586RF: MB15-G ................................................................. 26
3.2.2 Sections 568RF and 587RF: RAC-G ................................................................... 32
3.2.3 Sections 569RF and 588RF: AR4000-D .............................................................. 33
3.2.4 Sections 571RF and 589RF: 45 mm MB4-G ....................................................... 34
3.2.5 Sections 572RF and 590RF: 90 mm MB4-G ....................................................... 35
3.2.6 Sections 573RF and 591RF: MAC15-G .............................................................. 36
3.3. Comparison between HVS Sections.................................................................................. 52
3.4. Correlation of Moduli of Different Layers ........................................................................ 55
3.5. Load Effect on Backcalculated Stiffness........................................................................... 55

x
4. AGING, SEASONAL EFFECTS, AND STIFFNESS RECOVERY....................................... 61
4.1. Temperature Adjustment ................................................................................................... 61
4.1.1 Original (Underlying) Sections ............................................................................. 62
4.1.2 Overlay Sections ................................................................................................... 62
4.2. Aging Analysis of Untrafficked Areas .............................................................................. 64
4.2.1 Original (Underlying) Sections ............................................................................. 66
4.2.2 Overlay Sections ................................................................................................... 68
4.3. Seasonal Effects on Untrafficked Areas ............................................................................ 71
4.3.1 Original (Underlying) Sections ............................................................................. 72
4.3.2 Overlay Sections ................................................................................................... 72
4.4. Stiffness Recovery after HVS testing ................................................................................ 75
5. COMPARISON OF BACKCALUCLATED AND LABORATORY RESULTS .................. 79
5.1. Comparison of Predicted and Measured Composite Asphalt Layer Stiffness................... 79
5.2. Comparison of Backcalculated and Laboratory Stiffness of the Base Layer .................... 80
5.3. Comparison of Stiffness Backcalculated from FWD and RSD......................................... 84
6. CONCLUSIONS .......................................................................................................................... 87
7. REFERENCES............................................................................................................................. 89
xi
LIST OF TABLES
Table 2.1: Summary of HVS Testing on the Underlying DGAC Layer .................................................... 10
Table 2.2: Design versus Actual Binder Contents...................................................................................... 12
Table 2.3: Air-Void Contents..................................................................................................................... 14
Table 2.4: Test Duration for Phase 2 HVS Testing.................................................................................... 15
Table 2.5: Summary of HVS Loading Program......................................................................................... 15
Table 2.6: Summary of Phase 2 HVS Test Results .................................................................................... 16
Table 2.7: FWD Sensor Locations ............................................................................................................. 18
Table 2.8: List of FWD Tests by Lines on Underlying Sections ............................................................... 20
Table 2.9: FWD Tests on Sections 567RF and 586RF (MB15-G) ............................................................ 21
Table 2.10: FWD Tests on Sections 568RF and 587RF (RAC-G) ............................................................ 21
Table 2.11: FWD Tests on Sections 569RF and 588RF (AR4000-D) ....................................................... 22
Table 2.12: FWD Tests on Sections 571RF and 589RF (45 mm MB4-G) ................................................ 22
Table 2.13: FWD Tests on Sections 572RF and 590RF (90 mm MB4-G) ................................................ 23
Table 2.14: FWD Tests on Sections 573RF and 591RF (MAC15-G)........................................................ 23
Table 3.1: Average Thickness of Pavement Layers Used in Backcalculation ........................................... 25
Table 3.2: Summary of Moduli Before and After Phase 2 HVS Test ........................................................ 53
Table 4.1: Parameters of Master Curves of Intact Composite AC Layers:Absolute Difference................ 63
Table 4.2: Parameters of Master Curves of Intact Composite AC Layers: Relative Difference................ 64
Table 4.3: Summary of Parameters of Master Curves of Damaged Composite AC Layers ...................... 75
Table 5.1: Parameters Estimated from Laboratory Test Results ................................................................ 83
Table 5.2: Comparison of Composite AC Moduli from FWD and RSD Data........................................... 85
xii
LIST OF FIGURES
Figure 1.1: Timeline for the Reflective Cracking Study. ............................................................................. 3
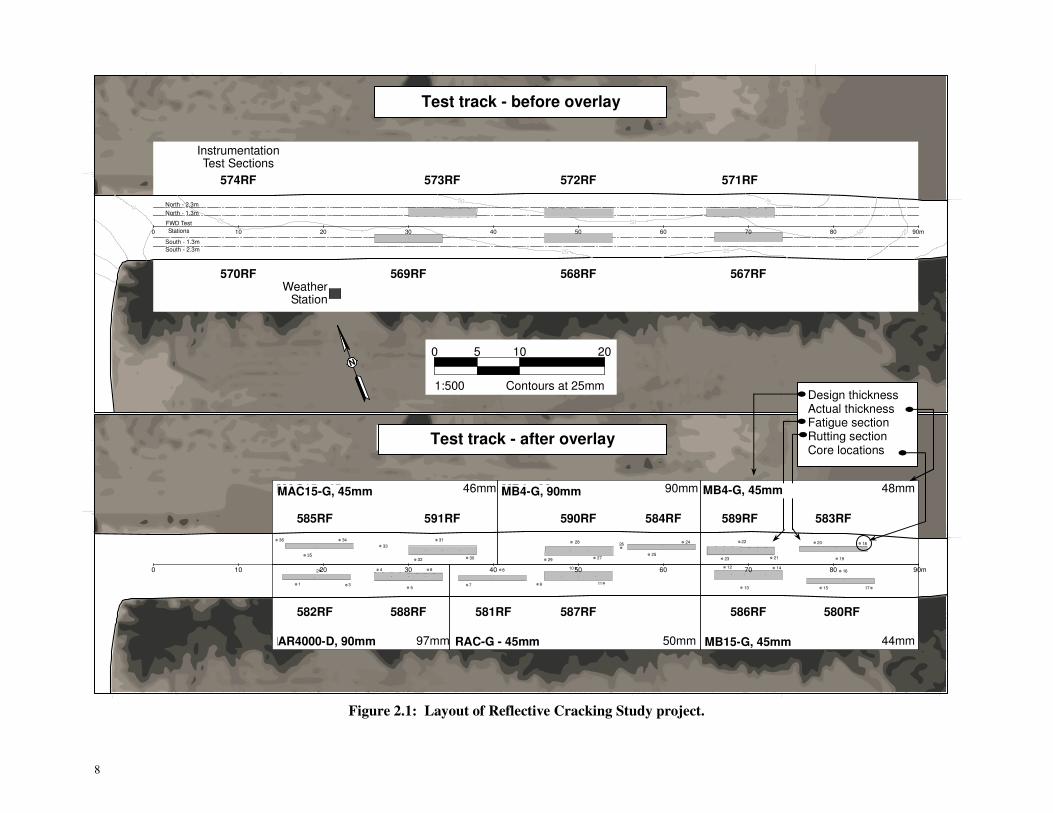
Figure 2.1: Layout of Reflective Cracking Study project. ........................................................................... 8
Figure 2.2: Test section layout. .................................................................................................................... 9
Figure 2.3: Pavement design for reflective cracking experiment (design and actual).................................. 9
Figure 2.4: Cracking patterns and rut depths on Sections 567RF through 573RF after Phase 1. .............. 11
Figure 2.5: Gradation for AR4000-D overlay. ........................................................................................... 13
Figure 2.6: Gradation for modified binder overlays................................................................................... 13
Figure 2.7: Cracking patterns and rut depths on Sections 586RF through 591RF after Phase 2 testing.... 17
Figure 2.8: FWD test plans (test track and HVS trafficked section). ......................................................... 19
Figure 3.1: Modulus of asphalt concrete from FWD on Section 567RF/586RF (MB15-G)(center). ........ 27
Figure 3.2: Modulus of asphalt concrete from FWD on Section 567RF/586RF (side).............................. 28
Figure 3.3: Modulus of asphalt concrete from FWD versus time on Section 567RF/586RF. ................... 28
Figure 3.4: Modulus of aggregate base from FWD on Section 567RF/586RF (center)............................. 29
Figure 3.5: Modulus of aggregate base from FWD on Section 567RF/586RF (side)................................ 29
Figure 3.6: Modulus of aggregate base from FWD versus time on Section 567RF/586RF....................... 30
Figure 3.7: Modulus of subgrade from FWD on Section 567RF/586RF (center)...................................... 30
Figure 3.8: Modulus of subgrade from FWD on Section 567RF/586RF (side). ........................................ 31
Figure 3.9: Modulus of subgrade from FWD versus time on Section 567RF/586RF................................ 31
Figure 3.10: Modulus of asphalt concrete from FWD on Section 568RF/587RF (RAC-G)(center). ........ 37
Figure 3.11: Modulus of asphalt concrete from FWD on Section 568RF/587RF (side)............................ 37
Figure 3.12: Modulus of asphalt concrete from FWD versus time on Section 568RF/587RF. ................. 37
Figure 3.13: Modulus of aggregate base from FWD on Section 568RF/587RF (center)........................... 38
Figure 3.14: Modulus of aggregate base from FWD on Section 568RF/587RF (side).............................. 38
Figure 3.15: Modulus of aggregate base from FWD versus time on Section 568RF/587RF..................... 38
Figure 3.16: Modulus of subgrade from FWD on Section 568RF/587RF (center).................................... 39
Figure 3.17: Modulus of subgrade from FWD on Section 568RF/587RF (side). ...................................... 39
Figure 3.18: Modulus of subgrade from FWD versus time on Section 568RF/587RF.............................. 39
Figure 3.19: Modulus of asphalt concrete from FWD on Section 569RF/588RF (AR4000-D)(center). ... 40
Figure 3.20: Modulus of asphalt concrete from FWD on Section 569RF/588RF (side)............................ 40
Figure 3.21: Modulus of asphalt concrete from FWD versus time on Section 569RF/588RF. ................. 40
Figure 3.22: Modulus of aggregate base from FWD on Section 569RF/588RF (center)........................... 41
Figure 3.23: Modulus of aggregate base from FWD on Section 569RF/588RF (side).............................. 41
Figure 3.24: Modulus of aggregate base from FWD versus time on Section 569RF/588RF..................... 41

xiii
Figure 3.25: Modulus of subgrade from FWD on Section 569RF/588RF (center).................................... 42
Figure 3.26: Modulus of subgrade from FWD on Section 569RF/588RF (side). ...................................... 42
Figure 3.27: Modulus of subgrade from FWD versus time on Section 569RF/588RF.............................. 42
Figure 3.28: Modulus of asphalt concrete from FWD on Section 571RF/589RF (MB4-G-45)(center). ... 43
Figure 3.29: Modulus of asphalt concrete from FWD on Section 571RF/589RF (side)............................ 43
Figure 3.30: Modulus of asphalt concrete from FWD versus time on Section 571RF/589RF. ................. 43
Figure 3.31: Modulus of aggregate base from FWD on Section 571RF589RF (center)............................ 44
Figure 3.32: Modulus of aggregate base from FWD on Section 571RF/589RF (side).............................. 44
Figure 3.33: Modulus of aggregate base from FWD versus time on Section 571RF/589RF..................... 44
Figure 3.34: Modulus of subgrade from FWD on Section 571RF/589RF (center).................................... 45
Figure 3.35: Modulus of subgrade from FWD on Section 571RF/and 589RF (side). ............................... 45
Figure 3.36: Modulus of subgrade from FWD versus time on Section 571RF/589RF.............................. 45
Figure 3.37: Modulus of asphalt concrete from FWD on Section 572RF/590RF (MB4-G-90)(center). ... 46
Figure 3.38: Modulus of asphalt concrete from FWD on Section 572RF590RF (side)............................. 46
Figure 3.39: Modulus of asphalt concrete from FWD versus time on Section 572RF/590RF. ................. 46
Figure 3.40: Modulus of aggregate base from FWD on Sections 572RF/590RF (center). ........................ 47
Figure 3.41: Modulus of aggregate base from FWD on Section 572RF/590RF (side).............................. 47
Figure 3.42: Modulus of aggregate base from FWD versus time on Section 572RF/590RF..................... 47
Figure 3.43: Modulus of subgrade from FWD on Section 572RF/590RF (center).................................... 48
Figure 3.44: Modulus of subgrade from FWD on Section 572RF/590RF (side). ...................................... 48
Figure 3.45: Modulus of subgrade from FWD versus time on Section 572RF/590RF.............................. 48
Figure 3.46: Modulus of asphalt concrete from FWD on Section 573RF/591RF (MAC15-G)(center). ... 49
Figure 3.47: Modulus of asphalt concrete from FWD on Section 573RF/591RF (side)............................ 49
Figure 3.48 Modulus of asphalt concrete from FWD versus time on Section 573RF/591RF..................... 49
Figure 3.49: Modulus of aggregate base from FWD on Section 573RF/591RF (center)........................... 50
Figure 3.50: Modulus of aggregate base from FWD on Section 573RF/591RF (side).............................. 50
Figure 3.51: Modulus of aggregate base from FWD versus time on Section 573RF/591RF..................... 50
Figure 3.52: Modulus of subgrade from FWD on Section 573RF/591RF (center).................................... 51
Figure 3.53: Modulus of subgrade from FWD on Section 573RF/591RF (side). ...................................... 51
Figure 3.54: Modulus of subgrade from FWD versus time on Section 573RF/591RF.............................. 51
Figure 3.55: Modulus of asphalt concrete before and after Phase 2 HVS testing. ..................................... 54
Figure 3.56: Modulus of aggregate base before and after Phase 2 HVS testing. ....................................... 54
Figure 3.57: Modulus of subgrade before and after Phase 2 HVS testing. ................................................ 54
Figure 3.58: Variation of AC and base and modulus in the trafficked area before HVS testing. .............. 56
Figure 3.59: Variation of AC and base modulus in the trafficked area after HVS testing. ........................ 56
xiv
Figure 3.60: Variation of AC and base modulus in the untrafficked area.................................................. 56
Figure 3.61: Variation of base and subgrade modulus in the trafficked area before HVS test. ................. 57
Figure 3.62: Variation of base and subgrade modulus in the trafficked area after HVS test. .................... 57
Figure 3.63: Variation of base and subgrade modulus in the untrafficked area. ........................................ 57
Figure 3.64: Variation of AC modulus with subgrade modulus................................................................. 57
Figure 3.65: Average backcalculated modulus vs drop number on Section 567RF/586RF (MB15-G)..... 58
Figure 3.66: Average backcalculated modulus vs drop number on Section 568RF/587RF (RAC-G)....... 58
Figure 3.67: Average backcalculated modulus vs drop number on Section 569RF/588RF (AR4000-D). 59
Figure 3.68: Average backcalculated modulus vs drop number on Section 571RF/589RF (MB4-G-45). 59
Figure 3.69: Average backcalculated modulus vs drop number on Section 572RF/590RF (MB4-G-90). 60
Figure 3.70: Average backcalculated modulus vs drop number on Section 573RF/591RF (MAC15-G).. 60
Figure 4.1: Master curves of DGAC estimated from laboratory and FWD data........................................ 62
Figure 4.2: Master curves of AC layers estimated from FWD data based on absolute difference............. 65
Figure 4.3: Master curves of AC layers estimated from FWD data based on relative difference.............. 65
Figure 4.4: Master curves of DGAC estimated from laboratory and different FWD data. ........................ 65
Figure 4.5: Temperature adjusted moduli of original sections versus age. ................................................ 66
Figure 4.6: Temperature adjusted modulus of aggregate base for each section......................................... 67
Figure 4.7: Modulus of the subgrade as a function of the stiffness of the pavement layers....................... 68
Figure 4.8: Temperature adjusted moduli of Section 586RF (MB15-G) versus age.................................. 69
Figure 4.9: Temperature adjusted moduli of Section 587RF (RAC-G) versus age.................................... 69
Figure 4.10: Temperature adjusted moduli of Section 588RF (AR4000-D) versus age. ........................... 69
Figure 4.11: Temperature adjusted moduli of Section 589RF (MB4-G-45) versus age. ........................... 69
Figure 4.12: Temperature adjusted moduli of Section 590RF (MB4-G-90) versus age. ........................... 70
Figure 4.13: Temperature adjusted moduli of Section 591RF (MAC15-G) versus age............................. 70
Figure 4.14: Time variation of moisture content with precipitation before June 2003. ............................. 71
Figure 4.15: Time variation of moisture content with precipitation after June 2003. ................................ 72
Figure 4.16: Time variation of residual moduli of original sections. ......................................................... 73
Figure 4.17: Time variation of residual moduli of Section 586RF (MB15-G). ......................................... 73
Figure 4.18: Time variation of residual moduli of Section 587RF (RAC-G). ........................................... 73
Figure 4.19: Time variation of residual moduli of Section 588RF (AR4000-D). ...................................... 73
Figure 4.20: Time variation of residual moduli of Section 589RF (MB4-G-45). ...................................... 74
Figure 4.21: Time variation of residual moduli of Section 590RF (MB4-G-90). ...................................... 74
Figure 4.22: Time variation of residual moduli of Section 591RF (MAC15-G)........................................ 74
Figure 4.23: Moduli versus age after HVS testing for Section 587RF (RAG-G). .................................... 77
Figure 4.24: Moduli versus age after HVS testing for Section 588RF (AR4000-D). ................................ 77

xv
Figure 4.25: Moduli versus age after HVS testing for Section 589RF (MB4-G-45). ................................ 77
Figure 4.26: Moduli versus age after HVS testing for Section 590RF (MB4-G-90). ................................ 77
Figure 4.27: Normalized moduli versus age after HVS test....................................................................... 78
Figure 5.1: Composite AC moduli from laboratory and FWD tests for Section 586RF (MB15-G). ......... 81
Figure 5.2: Composite AC moduli from laboratory and FWD tests for Section 587RF (RAC-G). ........... 81
Figure 5.3: Composite AC moduli from laboratory and FWD tests for Section 588RF (AR4000-D)....... 81
Figure 5.4: Composite AC moduli from laboratory and FWD tests for Section 589RF (MB4-G-45)....... 81
Figure 5.5: Composite AC moduli from laboratory and FWD tests for Section 590RF (MB4-G-90)....... 82
Figure 5.6: Composite AC moduli from laboratory and FWD tests for Section 591RF (MAC15-G). ...... 82
Figure 5.7: Resilient modulus of aggregate base measured in the laboratory. ........................................... 84

1
1. INTRODUCTION
1.1. Objectives
The analysis presented in this report is part of Partnered Pavement Research Center Strategic Plan
Element 4.10 (PPRC SPE 4.10) being undertaken for the California Department of Transportation
(Caltrans) by the University of California Pavement Research Center (UCPRC). The objective of the study
is to evaluate the reflective cracking performance of asphalt binder mixes used in overlays for
rehabilitating cracked asphalt concrete pavements in California. The study includes mixes modified with
rubber and polymers, and it will develop tests, analysis methods, and design procedures for mitigating
reflective cracking in overlays. This work is part of a larger study on modified binder (MB) mixes being
carried out under the guidance of the Caltrans Pavement Standards Team (PST) (1), which includes
laboratory and accelerated pavement testing using the Heavy Vehicle Simulator (carried out by the
UCPRC), and the construction and monitoring of field test sections (carried out by Caltrans).
1.2. Overall Project Organization
This UCPRC project is a comprehensive study, carried out in three phases, involving the following
primary elements (2):
• Phase 1
- The construction of a test pavement and subsequent overlays;
- Six separate Heavy Vehicle Simulator (HVS) tests to crack the pavement structure;
- Placing of six different overlays on the cracked pavement;
• Phase 2
- Six HVS tests to assess the susceptibility of the overlays to high-temperature rutting
(Phase 2a);
- Six HVS tests to determine the low-temperature reflective cracking performance of the
overlays (Phase 2b);
- Laboratory shear and fatigue testing of the various hot-mix asphalts (Phase 2c);
- Falling Weight Deflectometer (FWD) testing of the test pavement before and after
construction and before and after each HVS test;
- Forensic evaluation of each HVS test section;
• Phase 3
- Performance modeling and simulation of the various mixes using models calibrated with data
from the primary elements listed above.

2
Phase 1
In this phase, a conventional dense-graded asphalt concrete (DGAC) test pavement was constructed at the
Richmond Field Station (RFS) in the summer of 2001. The pavement was divided into six cells, and
within each cell a section of the pavement was trafficked with the HVS until the pavement failed by either
fatigue (2.5 m/m2 [0.76 ft/ft
2]) or rutting (12.5 mm [0.5 in], to limit the effects of excessive deformation in
the overlay performance). This period of testing began in the fall of 2002 and was concluded in the spring
of 2003. In June 2003 each test cell was overlaid with either conventional DGAC or asphalt concrete with
modified binders as follows:
• Full-thickness (90 mm) AR4000 dense-graded (AR4000-D) overlay, included as a control for
performance comparison purposes;
• Full-thickness (90 mm) MB4 gap-graded (MB4-G) overlay;
• Half-thickness (45 mm) rubberized asphalt concrete gap-graded overlay (RAC-G), included as a
control for performance comparison purposes;
• Half-thickness (45 mm) MB4 gap-graded (MB4-G) overlay;
• Half-thickness (45 mm) MB4 gap-graded overlay with minimum 15 percent recycled tire rubber
(MB15-G), and
• Half-thickness (45 mm) MAC15TR gap-graded overlay with minimum 15 percent recycled tire
rubber.
The conventional overlay was designed using the current (2003) Caltrans overlay design process. The
various modified overlays were either full (90 mm) or half thickness (45 mm). Mixes were designed by
Caltrans. The overlays were constructed in one day.
Phase 2
Phase 2 included high-temperature rutting and low-temperature reflective cracking testing with the HVS
as well as laboratory shear and fatigue testing. The rutting tests were started and completed in the fall of
2003. For these tests, the HVS was placed above a section of the underlying pavement that had not been
trafficked during Phase 1. A reflective cracking test was conducted next on each overlay from the winter
of 2003-2004 to the summer of 2007. For these tests, the HVS was positioned precisely on top of the
sections of failed pavement from the Phase 1 HVS tests to investigate the extent and rate of crack
propagation through the overlay.
In conjunction with Phase 2 HVS testing, a full suite of laboratory testing, including shear and fatigue
testing, was carried out on field-mixed, field-compacted, field-mixed, laboratory-compacted, and
laboratory-mixed, laboratory-compacted specimens.

3
Phase 3
Phase 3 entailed a second-level analysis carried out on completion of HVS and laboratory testing. This
included extensive analysis and characterization of the mix fatigue and mix shear data, backcalculation of
the FWD data, performance modeling of each HVS test, and a detailed series of pavement simulations
carried out using the combined data.
An overview of the project timeline is shown in Figure 1.1.
Pavement Construction
Phase 1 HVS Testing
Overlay Construction
Phase 2 HVS Rutting Tests
Phase 2 HVS Fatigue Tests
Laboratory Testing
2nd Level Analysis
Q1 Q2 Q3 Q4 Q1 Q2 Q3 Q4 Q1 Q2 Q3 Q4 Q1 Q2 Q3 Q4 Q1 Q2 Q3 Q4 Q1 Q2 Q3 Q4 Q1 Q2 Q3 Q42001 2002 2003 2004 2005 2006 2007
Figure 1.1: Timeline for the Reflective Cracking Study.
Reports
The reports prepared during the reflective cracking study document data from construction, HVS tests,
laboratory tests, and subsequent analyses. These include a series of first- and second-level analysis reports
and two summary reports. On completion of the study this suite of documents will include:
• One first-level report covering the initial pavement construction, the six initial HVS tests, and the
overlay construction (Phase 1);
• One first-level report covering the six Phase 2 rutting tests (but offering no detailed explanations
or conclusions on the performance of the pavements);
• Six first-level reports, each of which covers a single Phase 2 reflective cracking test (containing
summaries and trends of the measured environmental conditions, pavement responses, and
pavement performance but offering no detailed explanations or conclusions on the performance of
the pavement);
• One first-level report covering laboratory shear testing;
• One first-level report covering laboratory fatigue testing;
• One report summarizing the HVS test section forensic investigation;
• One report summarizing Falling Weight Deflectometer (FWD) results and analysis;
4
• One second-level analysis report detailing characterization of shear and fatigue data, pavement
modeling analysis, comparisons of the various overlays, and simulations using various scenarios
(Phase 3), and
• One four-page summary report capturing the conclusions and one longer, more detailed summary
report that covers the findings and conclusions from the research conducted by the UCPRC.
Reports are prepared as soon as a specific HVS or laboratory test is complete. Additional findings from
forensic investigations and later analysis are covered in the forensic, second-level analysis, and summary
reports.
1.3. Structure and Content of This Report
This report summarizes analysis of the Falling Weight Deflectometer (FWD) measurements taken over the
course of the study and is organized as follows:
• Chapter 2 contains a description of the HVS test program including experiment layout, loading
sequence, instrumentation, and data collection;
• Chapter 3 presents a summary and discussion of the FWD backcalculation analysis;
• Chapter 4 discusses aging, seasonal effects, and stiffness recovery;
• Chapter 5 provides a comparison of backcalculated and laboratory results, and
• Chapter 6 contains a summary of the results together with conclusions and observations.
The purpose of the report covers several aspects, including:
• Characterization of the HVS sections with Falling Weight Deflectometer (FWD). Although the
test sections were designed and built to be homogeneous, some variations in material properties
and layer thickness were measured. With the actual layer thickness (measured by Dynamic Cone
Penetrometer [DCP], coring, or trenching) as input, moduli backcalculated from FWD data
provided accurate characterization of material properties at selected points on the sections, and
therefore, reduced errors in performance comparison of the different overlay materials.
• Comparison of trafficked and untrafficked stiffness change. In analyzing stiffness change of the
trafficked areas, FWD testing was used to detect the potential trend of stiffness recovery due to
healing and other factors. In analyzing stiffness change of the untrafficked areas, FWD testing
was used to characterize effects due to binder aging, recementation of aggregate particles,
consolidation of subgrade, and other potential influences.

5
• Accounting for seasonal changes. The Richmond Field Station experiences seasonal variation in
climate. Changes in precipitation and water table depth affect the moisture content of pavement
layers and therefore the material properties.
• Providing inputs for simulations. Material properties characterized by FWD tests are closer to
actual field conditions than those measured with laboratory tests. With these material properties as
inputs, the simulation of pavement damage process in pavement design software (e.g., CalME) is
more rational and accurate.
1.4. Measurement Units
Metric units have always been used in the design and layout of HVS test tracks, and for all the
measurements, data storage, analysis, and reporting at the eight HVS facilities worldwide (as well as all
other international accelerated pavement testing facilities). Continued use of the metric system facilitates
consistency in analysis, reporting, and data sharing.
In this report, metric and English units are provided in the Executive Summary, Chapters 1 and 2, and the
Conclusion. In keeping with convention, only metric units are used in Chapters 3, 4 and 5. A conversion
table is provided on Page iv at the beginning of this report.

6

7
2. HEAVY VEHICLE SIMULATOR TEST DETAILS
2.1. Phase 2 Experiment Layout
Twelve test sections (six rutting and six reflective cracking) were constructed as part of the second phase
of the study, as follows (Figure 2.1):
1. Sections 580RF and 586RF: Half-thickness (45 mm) MB4 gap-graded overlay with minimum 15
percent recycled tire rubber (referred to as “MB15-G” in this report);
2. Sections 581RF and 587RF: Half-thickness (45 mm) rubberized asphalt concrete gap-graded
(RAC-G) overlay;
3. Sections 582RF and 588RF: Full-thickness (90 mm) AR4000 dense-graded asphalt concrete
overlay (designed using CTM356 and referred to as “AR4000-D”AR4000-D"-D in this report);
4. Sections 583RF and 589RF: Half-thickness (45 mm) MB4 gap-graded overlay (referred to as
“45 mm MB4-G” in this report);
5. Sections 584RF and 590RF: Full-thickness (90 mm) MB4 gap-graded overlay (referred to as
“90 mm MB4-G” in this report), and
6. Sections 585RF and 591RF: Half-thickness (45 mm) MAC15TR gap-graded overlay with
minimum 15 percent recycled tire rubber (referred to as “MAC15-G” in this report).
2.2. Test Section Layout
The general test section layout for each section is shown in Figure 2.2. Station numbers refer to fixed
points on the test section and are used for measurements and as a reference for discussing performance.
2.3. Underlying Pavement Design
The pavement for the first phase of HVS trafficking was designed according to the Caltrans Highway
Design Manual Chapter 600 using the computer program NEWCON90. Design thickness was based on a
tested subgrade R-value of 5 and a Traffic Index of 7 (~121,000 ESALs) (3).
The pavement design for the test road and the as-built pavement structure for each section (580RF through
591RF) are illustrated in Figure 2.2. As built thicknesses were determined from cores removed from the
edge of the sections.
8
Figure 2.1: Layout of Reflective Cracking Study project.
580RF581RF582RF
583RF584RF585RF 591RF 590RF 589RF
586RF587RF588RF
MAC15 - 45mm MB4 - 90mm MB4 - 45mm
DGAC - 90mm RAC-G - 45mm MB15 - 45mm
1
2
3
4
5
6
7
8
9
10
11
12
13
14
15
16
17
18
19
20
21
22
23
24
25
26
27
28
2930
31
32
33
34
35
36
Modified Binder Road - After Overlay
97mm 50mm 44mm
48mm90mm46mm
90m80706050403020100
0
25
2525
25
50
50
50 75North - 2.3m
North - 1.3m
South - 1.3m
South - 2.3m
FWD Test
Stations
N
569RF 568RF 567RF
571RF572RF573RF574RF
570RF
InstrumentationTest Sections
Modified Binder Road - Before Overlay
0 5 10 20
1:500 Contours at 25mm
StationWeather
0 10 20 30 40 50 60 70 80 90m
Design thickness Actual thickness Fatigue section Rutting section Core locations
MAC15-G, 45mm MB4-G, 90mm MB4-G, 45mm
MB15-G, 45mm AR4000-D, 90mm
Test track - after overlay
Test track - before overlay
9
0 1 2 3 4 5 6 7 8 9 10 11 12 13 14 15 16
y
x
Station Number (unit: 0.5 m)
4TS
4CL
4CS
12TS
12CL
12CS
0.2 m
0.2 m1 m
N
TS Traffic Side CL Central Line CS Caravan Side
0 1 2 3 4 5 6 7 8 9 10 11 12 13 14 15 16
y
x
Station Number (unit: 0.5 m)
4TS
4CL
4CS
12TS
12CL
12CS
0.2 m
0.2 m1 m
N
TS Traffic Side CL Central Line CS Caravan SideTS Traffic SideTS Traffic Side CL Central LineCL Central Line CS Caravan SideCS Caravan Side
Figure 2.2: Test section layout.
Design 580RF/586RF 581RF/587RF 582RF/588RF 583RF/589RF 584RF/590RF 585RF/591RF
Overlay
(45 or 90 mm) MB15-G
(46 mm)
RAC-G (50 mm)
AR4000-D
(94 mm) MB4-G
(48 mm)
MB4-G
(91 mm) MAC15-G
(45 mm)
DGAC
(90 mm)
DGAC
(81 mm)
DGAC
(81 mm)
DGAC
(93 mm)
DGAC
(77 mm)
DGAC
(88 mm)
DGAC
(110 mm)
Class 2
Aggregate Base
(410 mm)
Class 2
Aggregate Base
(398 mm)
Class 2
Aggregate Base
(398 mm)
Class 2
Aggregate Base
(369 mm)
Class 2
Aggregate Base
(372 mm)
Class 2
Aggregate
Base (352 mm)
Class 2
Aggregate Base
(411 mm)
Clay subgrade
(semi-infinite)
Clay subgrade
(semi-infinite)
Clay subgrade
(semi-infinite)
Clay subgrade
(semi-infinite)
Clay subgrade
(semi-infinite)
Clay subgrade
(semi-infinite)
Clay subgrade
(semi-infinite)
Figure 2.3: Pavement design for reflective cracking experiment (design and actual).

10
The existing subgrade was ripped and reworked to a depth of 200 mm (8 in) so that the optimum moisture
content and the maximum wet density met the specification per Caltrans Test Method CTM 216. The
average maximum wet density of the subgrade was 2,180 kg/m3 (136 pcf). The average relative
compaction of the subgrade was 97 percent (3).
The aggregate base was constructed to meet the Caltrans compaction requirements for aggregate base
Class 2 using CTM 231 nuclear density testing. The maximum wet density of the base determined
according to CTM 216 was 2,200 kg/m3 (137 pcf). The average relative compaction was 98 percent.
The DGAC layer consisted of a dense-graded asphalt concrete (DGAC) with AR-4000 binder and
aggregate gradation limits following Caltrans 19-mm (0.75 in) maximum size coarse gradation (3). The
target asphalt content was 5.0 percent by mass of aggregate, while actual contents varied between 4.34 and
5.69 percent. Nuclear density measurements and extracted cores were used to determine a preliminary as-
built mean air-void content of 9.1 percent with a standard deviation of 1.8 percent. The air-void content
after traffic compaction and additional air-void contents from cores taken outside the trafficked area will
be determined on completion of trafficking of all sections and will be reported in the second-level analysis
report.
2.4. Summary of HVS Testing on the Underlying Layer
Phase 1 HVS trafficking took place between December 21, 2001, and March 25, 2003, and is summarized
in Table 2.1.
Table 2.1: Summary of HVS Testing on the Underlying DGAC Layer
Section Start Date End Date Repetitions Wheel
Load
(kN)
Wheel Tire
Pressure
(kPa)
Direction
567RF 12/21/01 01/07/02 78,500
568RF 01/14/02 02/12/02 377,556
569RF 03/25/03 04/11/03 217,116
571RF 07/12/02 10/02/02 1,101,553
572RF 01/23/03 03/12/03 537,074
573RF 03/19/02 07/08/02 983,982
60 (13,500 lb)
Dual
720
(104 psi)
Bi
Figure 2.4 presents the final cracking patterns and average maximum rut depth for the middle six meters
of each trafficked section after Phase 1 HVS testing. Cracking on all of the sections exceeded the
2.5 m/m2 failure criteria, while all but one of the sections (569RF) exceeded the 12.5 mm rutting criteria.
Analysis of the Phase 1 HVS testing is discussed in detail in a separate report (3) and is not covered in this
report.

11
567RF
78,500 repetitions
568RF
377,556 repetitions
569RF
217,116 repetitions
571RF
1,101,553 repetitions
572RF
537,074 repetitions
573RF
983,982RF
0
100
200
300
400
500
600
0 50 100
cm across section
cm
alo
ng
secti
on
0
100
200
300
400
500
600
0 50 100
0
100
200
300
400
500
600
0 50 100
0
100
200
300
400
500
600
0 50 100
0
100
200
300
400
500
600
0 50 100
0
100
200
300
400
500
600
0 50 100
Average Maximum Rut Depths
15.7 mm (0.62 in) 13.9 mm (0.55 in) 6.3 mm (0.25 in) 14.3 mm (0.56 in) 16.4 mm (0.65 in) 14.6 mm (0.57 in)
Figure 2.4: Cracking patterns and rut depths on Sections 567RF through 573RF after Phase 1.

12
2.5. Overlay Design
The overlay thickness for the experiment was determined according to Caltrans Test Method CTM 356
using Falling Weight Deflectometer data from the Phase 1 experiment.
Laboratory testing was carried out by Caltrans and UCPRC on samples collected during construction to
determine actual binder properties, binder content, aggregate gradation, and air-void content (4,5). The
binders met requirements, based on testing performed by Caltrans. The average ignition-extracted binder
contents of the various layers, corrected for aggregate ignition and compared to the design binder content,
are listed in Table 2.2. For each section, actual binder contents were higher than design contents. It is not
clear whether this is a function of the test or contractor error.
Table 2.2: Design versus Actual Binder Contents
Binder Content (%) Section Mix
Design Actual
580RF and 586RF
581RF and 587RF
582RF and 588RF
583RF and 589RF
584RF and 590RF
585RF and 591RF
MB15-G
RAC-G
AR4000-D
MB4-G (45 mm)
MB4-G (90 mm)
MAC15-G
7.1
8.0
5.0
7.2
7.2
7.4
7.52
8.49
6.13
7.77
7.77
7.55
The aggregate gradations for the dense- and gap-graded mixes generally met Caltrans specifications for
19.0 mm (0.75 in.) maximum size coarse and gap gradations respectively, with specifics for each section
detailed below. Gradations are illustrated in Figure 2.5 (AR4000-D) and Figure 2.6 (modified binders).
• 580RF and 586RF: Material passing the 6.35 mm (1/4 in), 9.5 mm (3/8 mm), 12.5 mm (1/2 in),
and 19.0 mm (3/4 in) sieves was on the lower envelope limit (Figure 2.6).
• 581RF and 587RF: Material passing the 0.3 mm (#50), 0.6 mm (#30), and 2.36 mm (#8) sieves
was on the lower envelope limit (Figure 2.6).
• 582RF and 588RF: Material passing the 0.6 mm (#30), 2.36 mm (#8), and 4.75 mm (#4) sieves
was on the upper envelope limit (Figure 2.5).
• 583RF and 589RF: Material passing the 6.35 mm (1/4 in) and 9.5 mm (3/8 in) sieves was on the
lower envelope limit (Figure 2.6).
• 584RF and 590RF: Material passing the 6.35 mm (1/4 in) and 9.5 mm (3/8 in) sieves was on the
lower envelope limit (Figure 2.6).
• 585RF and 591RF: Material passing the 0.6 mm (#30), 9.5 mm (3/8 in), 12.5 mm (1/2 in), and
19.0 mm (3/4 in) sieves was on the upper envelope limit, while material passing the 2.36 mm (#8),
4.75 mm (#4), and 6.35 mm (1/4 in) sieves was outside the upper limit (Figure 2.6).

13
0
10
20
30
40
50
60
70
80
90
100
0.075 0.6 2.36 4.75 9.5 19 25
Sieve size (mm)
Percen
t p
ass
ing
588RF
Lower limit
Upper limit
Figure 2.5: Gradation for AR4000-D overlay.
0
10
20
30
40
50
60
70
80
90
100
0.075 0.15 0.3 0.6 2.36 4.75 6.35 9.5 12.5 19 25
Sieve size (mm)
Per
cen
t p
ass
ing
Lower limit
Upper limit
586RF
587RF
589RF & 590RF
591RF
Figure 2.6: Gradation for modified binder overlays.
The preliminary as-built air-void contents for each section, based on cores taken outside of the HVS
sections prior to HVS testing are listed in Table 2.3.

14
Table 2.3: Air-Void Contents
Air-Void Content (%) Section Mix
Average for Section Standard Deviation
580RF and 586RF
581RF and 587RF
582RF and 588RF
583RF and 589RF
584RF and 590RF
585RF and 591RF
MB15-G
RAC-G
AR4000-D
MB4-G (45 mm)
MB4-G (90 mm)
MAC15-G
5.1
8.8
7.1
6.5
6.5
4.9
1.7
1.3
1.5
0.6
0.6
1.0
2.6. Summary of Phase 2 HVS Testing
Phase 2 HVS testing is discussed in a series of first-level analysis reports (6-11) and a forensic
investigation report (12).
2.6.1 Test Section Failure Criteria
Failure criteria for HVS testing were set as follows:
• Rutting study:
- Maximum surface rut depth of 12.5 mm (0.5 in) or more
• Reflective Cracking study:
- Cracking density of 2.5 m/m2 (0.76 ft/ft
2) or more, and/or
- Average maximum surface rut depth of 12.5 mm (0.5 in) or more.
2.6.2 Environmental Conditions
In the rutting study, the pavement surface temperature was maintained at 50°C±4°C (122°F±7°F) in order
to assess the susceptibility of the mixes to early rutting under typical pavement temperatures. In the
reflective cracking study, the pavement surface temperature was maintained at 20°C±4°C (68°F±7°F) for
the first one million repetitions to minimize rutting in the asphalt concrete and to accelerate fatigue
damage. Thereafter, the pavement surface temperature was reduced to 15°C±4°C (59°F±7°F) to further
accelerate fatigue damage. A temperature control chamber (13) was used to maintain the test
temperatures.
The pavement surface of a test section received no direct rainfall during the actual HVS test as it was
protected by the temperature control chamber. The sections were tested during both wet and dry seasons
and hence water infiltration into the pavement from the side drains and through the raised groundwater
table was possible at certain stages of the testing.

15
2.6.3 Test Duration
HVS trafficking on each section was initiated and completed as shown in Table 2.4.
Table 2.4: Test Duration for Phase 2 HVS Testing
Phase Section Mix Start Date Finish Date Repetitions
Rutting
580RF
581RF
582RF
583RF
584RF
585RF
MB15-G
RAC-G
AR4000-D
MB4-G (45 mm)
MB4-G (90 mm)
MAC15-G
09/29/03
09/15/03
09/04/03
12/08/03
11/13/03
10/10/03
10/01/03
09/19/03
09/09/03
12/16/03
11/26/03
10/20/03
2,000
7,600
18,564
15,000
34,800
3,000
Reflective
cracking
586RF
587RF
588RF
589RF
590RF
591RF
MB15-G
RAC-G
AR4000-D
MB4-G (45 mm)
MB4-G (90 mm)
MAC15-G
05/25/06
03/15/05
11/02/05
06/23/04
01/13/04
01/10/07
11/21/06
10/10/05
04/11/06
02/08/05
06/16/04
06/25/07
2,492,387
2,024,793
1,410,000
2,086,004
1,981,365
2,554,335
2.6.4 Loading Program
The HVS loading program for each section is summarized in Table 2.5. Test configurations were as
follows:
• In the rutting tests, all trafficking was carried out with a dual-wheel configuration, using radial
truck tires (Goodyear G159 - 11R22.5- steel belt radial) inflated to a pressure of 720 kPa
(104 psi), in a channelized, unidirectional loading mode.
• In the reflective cracking tests, all trafficking was carried out with a dual-wheel configuration,
using radial truck tires (Goodyear G159 - 11R22.5- steel belt radial) inflated to a pressure of
720 kPa, in a bidirectional loading mode. Lateral wander over the one-meter width of the test
section was programmed to simulate traffic wander on a typical highway lane.
Table 2.5: Summary of HVS Loading Program
Wheel load (kN [lb]) Phase Section
Start
Repetition
Total
Repetitions Planned Actual* ESALs
Traffic
Index
Rutting
580RF
581RF
582RF
583RF
584RF
585RF
Full test
2,000
7,600
18,564
15,000
34,800
3,000
40
(8,000)
60
(13,500)
11,000
42,000
102,000
83,000
191,000
17,000
N/A
N/A
N/A
N/A
N/A
N/A
* The loading program differs from the original test plan due to an incorrect hydraulic control system setup on loads less than
65 kN in the Phase 1 experiment. The loading pattern from the Phase 1 experiment was thus retained to facilitate comparisons
of performance between all tests in the Reflective Cracking Study.

16
Table 2.5: Summary of Load History (cont.)
Wheel Load (kN) Phase Section
Start
Repetition
Total
Repetitions Planned Actual* ESALs
Traffic
Index
586RF
(MB15-G)
0
215,000
410,000
1,000,001
2,492,387
40
60
80
100
60
90
80
100
88 million 15
587RF
(RAC-G)
0
215,000
410,000
1,000,001
2,024,793
40
60
80
100
60
90
80
100
66 million 15
588RF
(AR4000-D)
0
215,000
410,000
1,000,001
1,410,000
40
60
80
100
60
90
80
100
37 million 14
589RF
(45 mm
MB4-G)
0
215,000
407,197
1,002,000
2,086,004
40
60
80
100
60
90
80
100
69 million 15
590RF**
(90 mm
MB4-G)
0
1,071,004
1,439,898
1,629,058
1,981,365
40
60
80
100
60
90
80
100
37 million 14
Reflective
cracking
591RF
(MAC15-G)
0
215,000
410,000
1,000,001
2,554,335
40
60
80
100
60
90
80
100
91 million 15
*
**
The loading program differs from the original test plan due to an incorrect hydraulic control system setup on loads less
than 65 kN in the Phase 1 experiment. The loading pattern from the Phase 1 experiment was thus retained to facilitate
comparisons of performance between all tests in the Reflective Cracking Study.
590RF was the first HVS test on the overlays, and the 60 kN loading pattern was retained for an extended period to
prevent excessive initial deformation (rutting) of the newly constructed overlay.
40 kN = 8,000 lb 60 kN = 13,500 lb 80 kN = 18,000 lb 90 kN = 20,200 lb 100 kN = 22,500 lb
2.7. Phase 2 Test Results
The final crack densities and average maximum rut depths for each section on completion of Phase 2 HVS
testing are listed in Table 2.6. The final cracking patterns are presented in Figure 2.7.
Table 2.6: Summary of Phase 2 HVS Test Results
Section Overlay Crack Density
(m/m2 [ft/ft
2])
Average Maximum Rut
(mm [in])
586RF
587RF
588RF
589RF
590RF
591RF
MB15-G
RAC-G
AR4000-D
45 mm MB4-G
90 mm MB4-G
MAC15-G
No cracking
3.6 (1.10)
9.1 (2.77)
1.5 (0.47)
No cracking
No cracking
4.6 (0.18)
18.2 (0.72)
15.9 (0.63)
37.2 (1.46)
12.7 (0.50)
1.7 (0.07)

17
586RF
2,492,387 repetitions
587RF
2,024,793 repetitions
588RF
1,410,000 repetitions
589RF
2,086,004 repetitions
590RF
1,981,365 repetitions
591RF
2,554,335 repetitions
0
100
200
300
400
500
600
0 50 100
cm across section
cm
alo
ng
secti
on
0
100
200
300
400
500
600
0 50 100
0
100
200
300
400
500
600
0 50 100
0
100
200
300
400
500
600
0 50 100
0
100
200
300
400
500
600
0 50 100
0
100
200
300
400
500
600
0 50 100
Average Maximum Rut Depths
4.6 mm (0.18 in) 18.2 mm (0.72 in) 15.9 mm (0.63 in) 37.2 mm (1.46 in) 12.7 mm (0.5 in) 1.7 mm (0.07 in)
Figure 2.7: Cracking patterns and rut depths on Sections 586RF through 591RF after Phase 2 testing.
No
cracking
measured
No
cracking
measured
No
cracking
measured

18
2.8. Summary of FWD Testing
The University of California Pavement Research Center’s Heavy Weight Deflectometer (Dynatest Model
8082 HWD), referred to as FWD in this report, was used to measure deflection at regular intervals
throughout the experiment. Measurements were taken over the entire test track, in both trafficked and
untrafficked areas, and before and after HVS testing, to monitor changes in stiffness of the asphalt
concrete, aggregate base, and subgrade over time.
The FWD generates a transient, impulse-type load of 25–30 milliseconds duration, at any desired (peak)
load level between 27 kN and 245 kN (6,000 and 55,000 lbf.), thereby approximating the effect of a 50 to
80 km/h (30 to 50 mph) moving wheel load. Three load levels were applied on the various sections and
each load level was applied once. Target loads for the pavement sections were 30 kN, 40 kN, and 50 kN.
The UCPRC FWD is configured with a segmented 300-mm diameter load plate and eight deflection
sensors. The sensor locations are shown in Table 2.7.
Table 2.7: FWD Sensor Locations
Sensor Number Distance from center of load plate
(mm)
1
2
3
4
5
6
7
8
0
210
315
475
630
925
1,535
1,985
Deflection measurements on the original test track were carried out along the centerline and at
1.3 m (4.3 ft) and 2.3 m (8.3 ft) offsets either side of the centerline (Figures 2.1 and 2.8). After the
overlays were placed, deflections were measured on the offsets only. Centerline measurements were not
possible due to unevenness of the surface resulting from the differences in thickness of the overlays.
Deflections were not measured on the Phase 2 rutting experiments due to the unevenness caused by
deformation.
A summary of the FWD measurement schedule over the duration of the study is provided in Table 2.8
through Table 2.14.

19
Figure 2.8: FWD test plans (test track and HVS trafficked section).
20
Table 2.8: List of FWD Tests by Lines on Underlying Sections
Test Time Section ID (From FWD
Datalogger)
Date Start End
Number of
Test Points
Interval
(m)
Transverse
Location
Average
Surface
Temp. (°C) MBACCL
MBACN13
MBACN23
MBACS13
MBACS23
MBACCL11
MBACN131
MBACN231
MBACS131
MBACCL2
MBACN132
MBACN232
MBACS132
MBACS232
MBACN133
MBACN233
MBACS133
MBACS233
MBACCL4
MBACN134
MBACN234
MBACS134
MBACS234
MBACCL5
MBACN135
MBACS135
MBACS235
MBACN235
MBACCL6
MBACN136
MBACN236
MBACN236B
MBACS136
MBACS236
MBAECL7
MBAEN137
MBAEN237
MBAES137
MBAES237
MBBACCL7
MBBAN137
MBBAN237
MBBAS137
MBBAS237
MBAGCL7
MBAGN137
MBAGN237
MBAGS137
MBAGS237
10/03/01
10/03/01
10/03/01
10/03/01
10/03/01
10/11/01
10/11/01
10/11/01
10/11/01
10/25/01
10/25/01
10/25/01
10/25/01
10/25/01
11/07/01
11/07/01
11/07/01
11/07/01
12/14/01
12/14/01
12/14/01
12/14/01
12/14/01
01/08/02
01/08/02
01/08/02
01/08/02
01/09/02
02/13/02
02/13/02
02/13/02
02/13/02
02/13/02
02/13/02
10/07/02
10/07/02
10/07/02
10/07/02
10/07/02
01/02/03
01/02/03
01/02/03
01/02/03
01/02/03
05/19/03
05/19/03
05/19/03
05/19/03
05/19/03
07:30
09:04
09:35
08:01
08:34
13:39
14:47
15:18
14:15
13:21
12:55
12:29
13:54
14:50
16:02
16:31
17:00
17:27
11:45
11:55
12:22
11:35
11:24
13:31
14:10
12:05
11:07
09:05
13:11
14:09
15:03
15:03
12:22
11:33
15:19
14:38
13:34
15:57
16:41
10:58
10:20
09:40
13:35
14:20
13:25
10:34
09:50
13:58
14:41
07:56
09:31
10:00
08:30
08:59
14:10
15:15
15:45
14:42
13:51
13:18
12:52
14:39
15:18
16:27
16:54
17:24
17:51
11:53
12:19
12:46
11:43
11:31
13:58
14:39
13:10
11:42
09:35
13:51
14:46
15:35
15:35
13:02
12:07
15:49
15:08
14:30
16:30
17:13
11:28
10:49
10:11
14:05
14:49
13:53
11:10
10:24
14:31
15:17
27
27
27
29
27
27
27
27
28
26
26
27
26
27
27
27
27
27
10
28
27
9
8
27
28
27
27
27
27
27
27
27
27
27
28
29
29
29
28
27
27
27
27
27
28
27
27
29
27
3.05
3.05
3.05
3.05
3.05
3.05
3.05
3.05
3.05
3.05
3.05
3.05
3.05
3.05
3.05
3.05
3.05
3.05
3.05
3.05
3.05
3.05
3.05
3.05
3.05
3.05
3.05
3.05
3.05
3.05
3.05
3.05
3.05
3.05
3.05
3.05
3.05
3.05
3.05
3.05
3.05
3.05
3.05
3.05
3.05
3.05
3.05
3.05
3.05
Center
North 1.3
North 2.3
South 1.3
South 2.3
Center
North 1.3
North 2.3
South 1.3
Center
North 1.3
North 2.3
South 1.3
South 2.3
North 1.3
North 2.3
South 1.3
South 2.3
Center
North 1.3
North 2.3
South 1.3
South 2.3
Center
North 1.3
South 1.3
South 2.3
North 2.3
Center
North 1.3
North 2.3
North 2.3
South 1.3
South 2.3
Center
North 1.3
North 2.3
South 1.3
South 2.3
Center
North 1.3
North 2.3
South 1.3
South 2.3
Center
North 1.3
North 2.3
South 1.3
South 2.3
17.4
19.6
20.5
17.5
17.6
30.4
29.9
30.6
28.6
32.2
32.8
32.2
32.7
30.5
22.2
21.0
18.4
16.9
11.1
11.8
12.9
11.3
12.3
17.7
17.1
18.1
16.3
13.4
15.0
14.3
13.8
13.8
15.3
14.0
37.4
39.9
37.7
33.9
29.4
13.3
13.2
12.3
15.5
15.3
42.2
33.8
29.9
43.0
43.1

21
Table 2.9: FWD Tests on Sections 567RF and 586RF (MB15-G)
Test Time Section ID Test Date
Start End
Number of
Test Points
Interval
(m)
Transverse
Location
Surface
Temp. (ºC)
567RF
01/10/2002
02/14/2002
10/10/2002
01/08/2003
05/19/2003
06/10/2003
06/10/2003
12:10
11:46
15:06
14:04
09:09
11:07
16:29
12:37
12:14
15:33
14:29
09:41
11:20
16:45
28
27
28
29
29
15
15
0.3
0.3
0.3
0.3
0.3
0.9
0.9
Center
Center
Center
Center
Center
Side
Side
19
16
21
18
23
25
29
586RF
MB15-G
06/24/2003
06/25/2003
12/23/2003
12/30/2003
03/23/2004
04/28/2006
04/28/2006
04/28/2006
04/28/2006
04/28/2006
12/40/2006
12/13/2006
12/15/2006
12/17/2006
15:58
07:40
10:24
10:47
10:12
15:00
15:35
16:45
17:19
17:32
09:25
15:32
12:37
09:56
16:40
8:14
10:50
11:07
10:35
15:32
15:43
17:10
17:28
17:45
10:10
17:00
12:49
10:09
27
29
28
26
29
25
9
18
10
10
27
28
10
10
0.3
0.3
0.3
0.3
0.3
0.3
0.9
0.3
0.9
0.9
0.3
0.3
0.9
0.9
Center
Center
Center
Center
Center
Center
Side
Center
Center
Side
Center
Center
Side
Side
40
22
13
13
19
28
25
23
23
22
7
15
13
7
Table 2.10: FWD Tests on Sections 568RF and 587RF (RAC-G)
Test Time Section ID Test Date
Start End
Number of
Test Points
Interval
(m)
Transverse
Location
Surface
Temp. (ºC)
568RF
01/10/2002
02/14/2002
10/10/2002
01/08/2003
05/16/2003
06/10/2003
06/10/2003
11:17
11:19
14:34
10:37
09:06
10:50
16:12
11:42
11:42
15:02
11:13
09:33
11:03
16:26
28
28
28
29
26
15
15
0.3
0.3
0.3
0.3
0.3
0.9
0.9
Center
Center
Center
Center
Center
Side
Side
18
18
21
18
22
31
26
587RF
RAC-G
06/24/2003
06/25/2003
12/23/2003
12/30/2003
03/23/2004
02/18/2005
02/18/2005
02/24/2005
02/24/2005
10/19/2005
10/19/2005
10/19/2005
10/19/2005
12/04/2006
12/12/2006
12/15/2006
12/17/2006
15:19
07:10
09:30
10:18
09:46
10:53
11:24
05:30
05:43
07:30
08:35
15:14
16:04
08:40
16:00
12:16
09:43
15:54
07:37
10:11
10:40
10:09
11:15
11:32
05:38
06:09
07:53
08:55
15:36
16:22
09:23
16:29
12:28
09:55
27
28
24
26
28
27
10
10
30
27
27
31
27
27
27
10
10
0.3
0.3
0.3
0.3
0.3
0.3
0.9
0.9
0.3
0.3
0.3
0.3
0.3
0.3
0.3
0.9
0.9
Center
Center
Center
Center
Center
Center
Side
Side
Center
Center
Side
Center
Side
Center
Center
Side
Side
42
21
12
12
22
19
17
13
14
17
17
23
20
6
14
14
15

22
Table 2.11: FWD Tests on Sections 569RF and 588RF (AR4000-D)
Test Time Section ID Test Date
Start End
Number of
Test Points
Interval
(m)
Transverse
Location
Surface
Temp. (ºC)
569RF
01/10/2002
02/14/2002
10/10/2002
01/08/2003
03/28/2003
04/04/2003
04/11/2003
05/16/2003
06/10/2003
06/10/2003
10:03
10:48
13:59
13:20
13:18
10:51
11:10
08:29
10:23
15:52
10:31
11:11
14:26
14:01
14:06
11:50
12:02
09:03
10:43
16:09
28
28
28
30
36
39
35
28
15
15
0.3
0.3
0.3
0.3
0.3
0.3
0.3
0.3
0.9
0.9
Center
Center
Center
Center
Center
Center
Center
Center
Side
Side
13
14
23
18
32
20
22
20
24
30
588RF
AR4000-D
06/24/2003
06/25/2003
12/19/2003
12/30/2003
03/23/2004
10/19/2005
10/19/2005
10/19/2005
10/19/2005
04/28/2006
04/28/2006
04/28/2006
04/28/2006
12/04/2006
12/12/2006
12/14/2006
12/16/2006
14:41
06:38
11:10
09:38
09:15
06:55
14:38
08:04
15:41
12:50
15:47
13:23
16:28
07:55
15:30
14:48
14:38
15:12
07:06
11:56
10:05
09:41
07:20
15:09
08:27
16:01
13:20
16:26
13:33
16:38
08:38
15:58
15:20
14:52
28
28
23
30
29
28
31
27
27
23
25
10
9
27
27
10
10
0.3
0.3
0.3
0.3
0.3
0.3
0.3
0.3
0.3
0.3
0.3
0.9
0.9
0.3
0.3
0.9
0.9
Center
Center
Center
Center
Center
Center
Center
Side
Side
Center
Center
Side
Side
Center
Center
Side
Side
41
19
15
10
18
16
27
17
21
25
28
28
28
5
15
17
12
Table 2.12: FWD Tests on Sections 571RF and 589RF (45 mm MB4-G)
Test Time Section ID Test Date
Start End
Number of
Test Points
Interval
(m)
Transverse
Location
Surface
Temp. (ºC)
571RF
01/10/2002
02/14/2002
10/10/2002
01/08/2003
05/16/2003
06/10/2003
06/10/2003
15:11
15:38
11:25
09:57
11:30
11:57
17:41
15:37
16:02
11:52
10:21
11:57
12:11
18:00
28
27
28
28
28
15
15
0.3
0.3
0.3
0.3
0.3
0.9
0.9
Center
Center
Center
Center
Center
Side
Side
19
18
20
15
30
27
28
589RF
45 mm MB4-G
06/24/2003
06/25/2003
12/19/2003
12/22/2003
12/30/2003
03/22/2004
06/17/2004
06/17/2004
06/21/2004
06/21/2004
02/18/2005
02/18/2005
02/23/2005
02/24/2005
12/15/2006
12/15/2006
12/17/2006
12/17/2006
17:49
09:51
16:40
15:18
14:11
08:42
11:01
13:08
10:10
10:54
11:41
12:31
07:53
05:05
10:51
11:17
08:42
08:28
18:20
10:20
17:12
15:50
14:36
09:05
11:31
13:19
10:35
11:02
11:52
12:42
08:18
05:30
11:11
11:57
09:37
08:40
29
28
12
22
28
27
32
11
30
10
11
11
30
23
10
25
30
10
0.3
0.3
0.3
0.3
0.3
0.3
0.3
0.9
0.3
0.9
0.9
0.9
0.3
0.3
0.9
0.3
0.3
0.9
Center
Center
Center
Center
Center
Center
Center
Side
Center
Side
Side
Center
Side
Center
Side
Center
Center
Side
36
32
14
19
15
17
27
34
28
31
18
20
11
13
13
13
6
4

23
Table 2.13: FWD Tests on Sections 572RF and 590RF (90 mm MB4-G)
Test Time Section ID Test Date
Start End
Number of
Test Points
Interval
(m)
Transverse
Location
Surface
Temp. (ºC)
572RF
01/10/2002
02/14/2002
10/10/2002
01/08/2003
02/04/2003
02/04/2003
02/21/2003
02/28/2003
03/12/2003
05/16/2003
06/10/2003
06/10/2003
14:32
15:10
10:22
09:21
09:28
13:22
10:56
11:23
13:11
10:59
11:42
17:14
15:00
15:36
10:49
09:49
10:16
14:04
11:37
12:27
13:40
11:27
11:55
17:31
28
26
28
29
31
35
35
39
26
28
15
15
0.3
0.3
0.3
0.3
0.3
0.3
0.3
0.3
0.3
0.3
0.9
0.9
Center
Center
Center
Center
Center
Center
Center
Center
Center
Center
Side
Side
21
18
20
12
10
23
23
22
29
30
28
29
590RF
90 mm MB4-G
06/24/2003
06/25/2003
01/05/2004
03/22/2004
03/22/2004
03/22/2004
06/16/2004
06/16/2004
06/21/2004
06/21/2004
12/13/2006
12/15/2006
12/16/2006
12/17/2006
17:20
09:10
08:54
10:54
11:17
13:14
16:27
17:00
09:36
10:42
10:17
10:05
13:48
08:05
17:45
09:42
09:21
11:00
11:38
13:37
16:54
17:09
10:08
10:51
11:34
10:32
14:23
08:19
26
29
29
4
30
14
30
10
30
10
28
10
28
10
0.3
0.3
0.3
0.3
0.3
0.9
0.3
0.9
0.3
0.9
0.3
0.9
0.3
0.9
Center
Center
Center
Center
Center
Side
Center
Side
Center
Side
Center
Side
Center
Side
38
30
6
22
23
23
27
27
24
32
16
13
14
2
Table 2.14: FWD Tests on Sections 573RF and 591RF (MAC15-G)
Test Time Section ID Test Date
Start End
Number of
Test Points
Interval
(m)
Transverse
Location
Surface
Temp. (ºC)
573RF
01/10/2002
02/14/2002
07/19/2002
10/10/2002
01/08/2003
05/16/2003
06/10/2003
06/10/2003
13:57
14:41
11:00
09:25
08:50
10:24
11:24
16:51
14:26
15:07
11:22
09:53
09:17
10:56
11:37
17:05
28
27
28
28
28
30
15
15
0.3
0.3
0.3
0.3
0.3
0.3
0.9
0.9
Center
Center
Center
Center
Center
Center
Side
Side
21
22
27
20
10
26
28
30
591RF
MAC15-G
06/24/2003
06/25/2003
12/22/2003
12/30/2003
12/13/2006
12/15/2006
12/16/2006
12/17/2006
06/27/2007
06/27/2007
06/28/2007
06/28/2007
06/29/2007
06/29/2007
16:46
08:25
13:53
14:44
09:39
09:43
13:11
07:47
15:24
16:16
10:39
11:30
07:23
09:58
17:15
09:06
14:54
15:13
10:15
10:04
13:44
08:05
16:04
16:40
11:10
11:42
08:16
10:11
27
30
27
30
28
10
27
10
35
12
35
12
36
12
0.3
0.3
0.3
0.3
0.3
0.9
0.3
0.9
0.3
0.9
0.3
0.9
0.3
0.9
Center
Center
Center
Center
Center
Side
Center
Side
Center
Side
Center
Side
Center
Side
39
26
17
16
15
11
15
1
31
31
26
28
19
25

24

25
3. DEFLECTION ANALYSIS
3.1. Backcalculation Methods Used
The backcalculation program Calback (April 2007 version) was used to calculate the modulus of the
pavement layers from Falling Weight Deflectometer measurements. A choice of layered linear elastic
analysis and Odemark-Boussinesq methods is included in the program to calculate pavement responses. In
this report, the Odemark-Boussinesq method was used for all backcalculation. Parameter estimation was
based on the minimization of the relative difference between the observed deflection and the calculated
deflection. A Kalman filter was used in all calculations, and in some cases a genetic algorithm was used to
search for the optimal values.
Pavement temperatures were calculated at one third depth of the asphalt concrete layer, using BELLS
equation with the surface temperature and the average air temperature of the previous day as inputs. The
surface temperature was measured by the FWD during the test, and the average air temperature was
obtained from a nearby weather station.
Pavement layer thicknesses were measured using several methods, including the Dynamic Cone
Penetrometer (DCP), coring, and trenching. The average of measurements from these methods was used in
the backcalculation, as summarized in Table 3.1.
Table 3.1: Average Thickness of Pavement Layers Used in Backcalculation
Section Overlay Overlay
(mm)
Underlying DGAC
(mm)
Aggregate Base
(mm)
586RF over 567RF
587RF over 568RF
588RF over 569RF
589RF over 571RF
590RF over 572RF
591RF over 573RF
MB15-G
RAC-G
AR4000-D
MB4-G (45 mm)
MB4-G (45 mm)
MAC15-G
46
48
95
49
86
46
83
82
88
79
83
77
352
349
337
352
349
337
3.2. Section Characterization
Each underlying section and corresponding overlay is discussed in Sections 3.2.1 through 3.2.6. Each
data point discussed or illustrated is an average of the three FWD drops on each point. In all sections, it
was noted that the asphalt concrete modulus was generally higher at both ends of the HVS test section.
This was attributed to load reduction during the direction change of the test wheel carriage. Data from
Stations 0 through 1 and Stations 14 through 16 were therefore excluded from the analysis.

26
On all sections excluding Section 591, the back-calculated moduli of the asphalt concrete and the
aggregate base varied considerably along the section. To account for this variation in the analysis and to
simplify reporting, the other five test sections were subdivided into two subsections as follows.
Subdivision based purely on variation was not considered necessary.
• Subsection A: Stations 2 through 8
• Subsection B: Stations 8 through 14.
In this study the underlying layer and overlay were considered as a single layer in all analyses to account
for the similarity in stiffnesses and to account for the depth of measurement of the FWD sensors in the
backcalculation process.
3.2.1 Sections 567RF and 586RF: MB15-G
The backcalculated moduli for the three pavement layers on Sections 567RF and 586RF are presented in
Figure 3.1 through Figure 3.9.
Asphalt Concrete
The asphalt concrete modulus of Section 586RF was generally higher than that of Section 567RF
(Figure 3.1 and Figure 3.2). This was expected because the overlay modulus is a composite of the overlay
and underlying DGAC layer, which was extensively cracked during Phase 1 HVS loading. Variation of
the overlay modulus in Figure 3.1 and Figure 3.2 was attributed to temperature change, binder aging, and
HVS loading. Temperature had a significant effect on the asphalt concrete modulus, which complicates
the analysis of time and seasonal effects (Figure 3.3). Based on the data measured in the trafficked area
after overlay construction (June 25, 2003) and before HVS testing on the section started (April 28, 2006)
modulus increased from 2,282 MPa to 2,572 MPa on Subsection A, and from 2,516 MPa to 4,135 MPa on
Subsection B, indicating an aging effect during the first 30 months after overlay construction. Modulus of
the composite asphalt concrete layer in the trafficked area showed little difference from that in the
untrafficked area before the HVS testing, but dropped significantly (approximately 50 percent) after HVS
testing, illustrating the damage caused to the asphalt concrete layer by HVS loading.
Aggregate Base
The backcalculated modulus of the base changed between 1,000 and 4,000 MPa during the course of the
study (Figure 3.4 through Figure 3.6). Much of the strength is attributed to recementation of the recycled
concrete aggregate particles used in the base material (12). Temperature also affected the base modulus
(Figure 3.6) but to a lesser extent compared to the asphalt concrete layers, with trends indicating that
lower temperatures corresponded to higher base modulus. This could be due to the change of confinement

27
provided to the base by the asphalt concrete layer. A simple comparison of the aggregate base modulus
before and after construction of the overlay illustrates the confinement effect. The base modulus after
overlay construction (i.e., additional confinement) was generally higher than that before the overlay was
placed. Apart from the temperature and overlay effects, the base modulus also tended to increase with
time, particularly in the first two years after construction when recementation of the particles occurred.
The base modulus in the trafficked area showed significant reduction (around 60 percent) after HVS
loading, while the modulus in the untrafficked area showed little change.
Subgrade
The backcalculated modulus of the subgrade was relatively stable along the section (Figure 3.7 and
Figure 3.8) and varied between 150 MPa and 350 MPa during the course of the study. Some temperature
effects on the subgrade modulus were observed (Figure 3.9). Lower temperatures corresponded to higher
subgrade modulus, which was attributed to the stiffening of the asphalt concrete and base layers at lower
temperatures, which in turn reduced the level of stress on the subgrade (the modulus of cohesive subgrade
typically increases with the reduction of stress level). The subgrade modulus increased with time in the
first two years after construction and then stabilized, following a similar trend to the base modulus.
Recementation of the base materials probably influenced the subgrade modulus in terms of increased
confinement. The subgrade modulus in both the trafficked and untrafficked areas showed little change
after HVS loading.
0
5000
10000
15000
20000
25000
30000
0 1 2 3 4 5 6 7 8 9
Distance (m)
E1
(M
Pa
)
MBAC567A 1/10/02 12:10 Center 19CMBAC567B 2/14/02 11:46 Center 16C567AE 10/10/02 15:06 Center 21C567AF 1/8/03 14:04 Center 18C567AH 5/19/03 09:09 Center 23C586BC 6/24/03 15:58 Center 40C586BD 6/25/03 07:40 Center 22C586AF 12/30/03 10:47 Center 13C586VF 3/23/04 10:12 Center 19C586 Center 4/28/06 15:00 Center 28C586 Center 4/28/06 16:45 Center 23C586 CL 12/04/06 9:25 Center 7C586 CL 12/13/06 15:32 Center 15C
Figure 3.1: Modulus of asphalt concrete from FWD on Section 567RF/586RF (MB15-G)(center).

28
0
5000
10000
15000
20000
25000
30000
0 1 2 3 4 5 6 7 8 9
Distance (m)
E1
(M
Pa
)
567BA 6/10/03 11:07 Side 25C
567BB 6/10/03 16:29 Side 29C
586_offside 4/28/06 15:35 Side 25C
586_offside 4/28/06 17:32 Side 22C
586 CL 12/17/06 9:56 Side 7C
586 CL 12/15/06 12:37 Side 13C
Figure 3.2: Modulus of asphalt concrete from FWD on Section 567RF/586RF (side).
0
3000
6000
9000
12000
15000
4/19/2001 9/1/2002 1/14/2004 5/28/2005 10/10/2006 2/22/2008
Date
E1
(M
Pa
)
-50
-40
-30
-20
-10
0
10
20
30
40
50
Pa
ve
men
t T
em
pe
ratu
re (
C)
Station 2 to 8 Center Station 8 to 14 Center Station 2 to 8 Side
Station 8 to 14 Side Bells Temperature
Overlay
ConstructionHVS Start HVS EndConstruction
HVS Start
HVS End
Figure 3.3: Modulus of asphalt concrete from FWD versus time on Section 567RF/586RF.
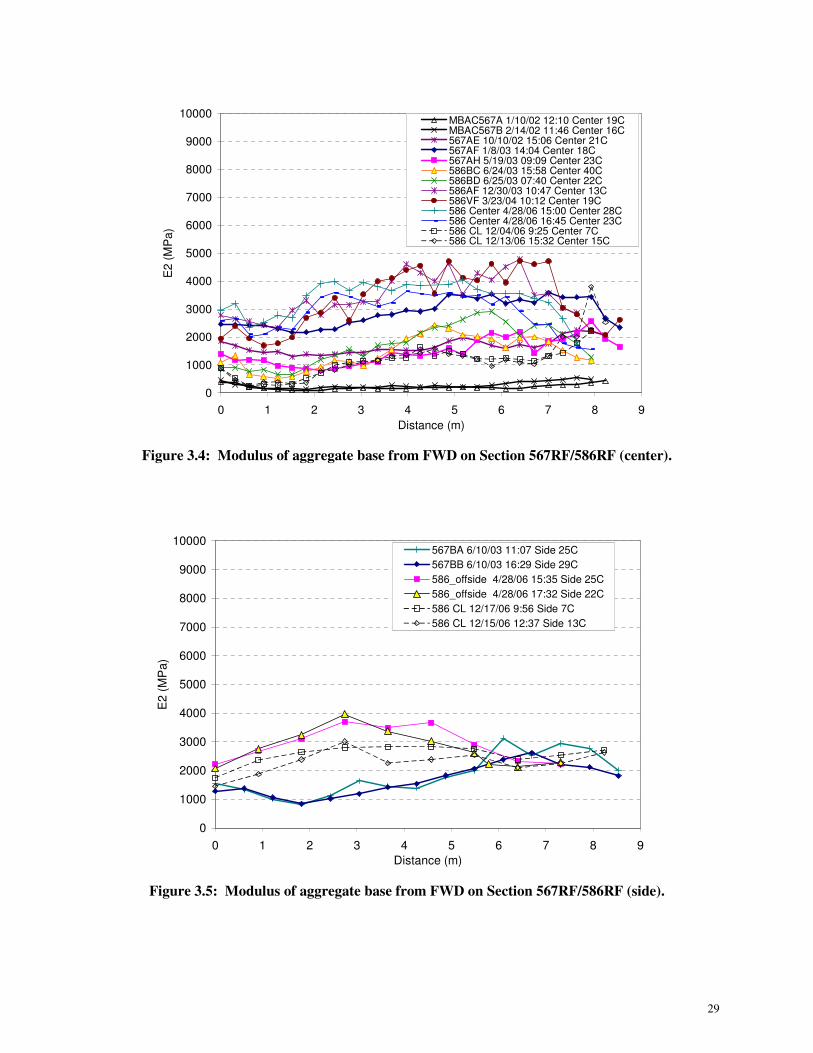
29
0
1000
2000
3000
4000
5000
6000
7000
8000
9000
10000
0 1 2 3 4 5 6 7 8 9
Distance (m)
E2
(M
Pa
)
MBAC567A 1/10/02 12:10 Center 19CMBAC567B 2/14/02 11:46 Center 16C567AE 10/10/02 15:06 Center 21C567AF 1/8/03 14:04 Center 18C567AH 5/19/03 09:09 Center 23C586BC 6/24/03 15:58 Center 40C586BD 6/25/03 07:40 Center 22C586AF 12/30/03 10:47 Center 13C586VF 3/23/04 10:12 Center 19C586 Center 4/28/06 15:00 Center 28C586 Center 4/28/06 16:45 Center 23C586 CL 12/04/06 9:25 Center 7C586 CL 12/13/06 15:32 Center 15C
Figure 3.4: Modulus of aggregate base from FWD on Section 567RF/586RF (center).
0
1000
2000
3000
4000
5000
6000
7000
8000
9000
10000
0 1 2 3 4 5 6 7 8 9
Distance (m)
E2
(M
Pa
)
567BA 6/10/03 11:07 Side 25C
567BB 6/10/03 16:29 Side 29C
586_offside 4/28/06 15:35 Side 25C
586_offside 4/28/06 17:32 Side 22C
586 CL 12/17/06 9:56 Side 7C
586 CL 12/15/06 12:37 Side 13C
Figure 3.5: Modulus of aggregate base from FWD on Section 567RF/586RF (side).
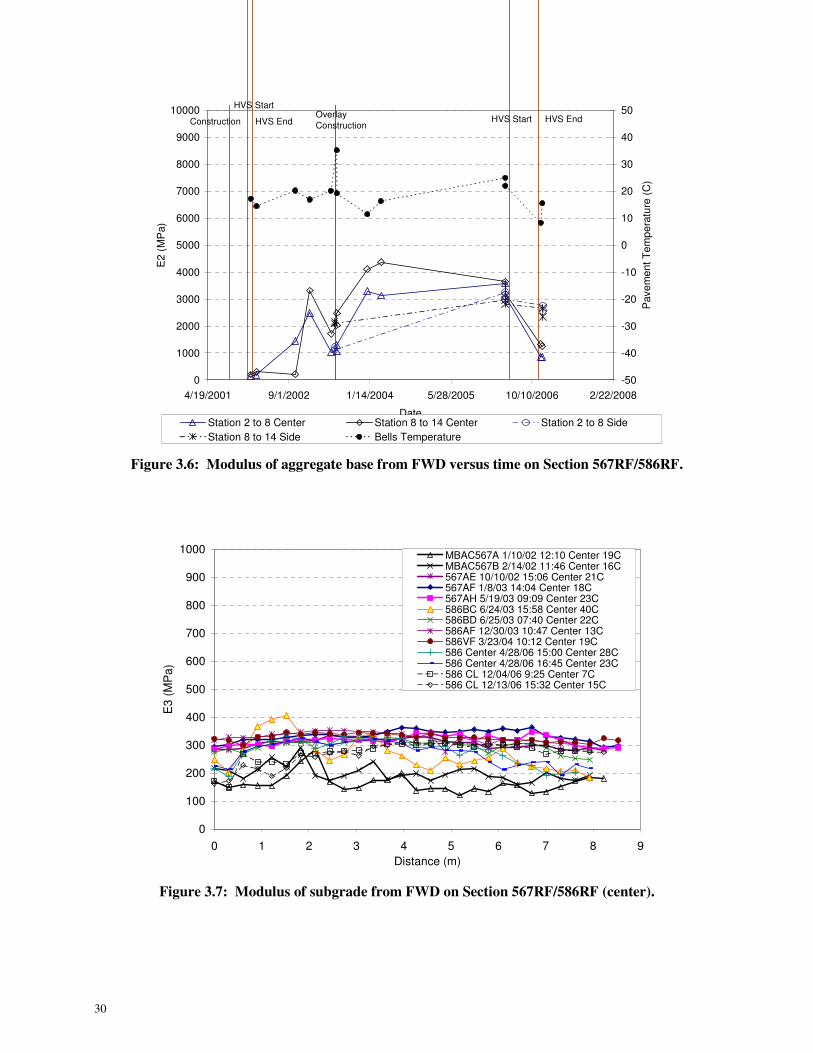
30
0
1000
2000
3000
4000
5000
6000
7000
8000
9000
10000
4/19/2001 9/1/2002 1/14/2004 5/28/2005 10/10/2006 2/22/2008
Date
E2
(M
Pa)
-50
-40
-30
-20
-10
0
10
20
30
40
50
Pave
me
nt
Te
mp
era
ture
(C
)
Station 2 to 8 Center Station 8 to 14 Center Station 2 to 8 Side
Station 8 to 14 Side Bells Temperature
Overlay
ConstructionHVS Start HVS EndConstruction
HVS Start
HVS End
Figure 3.6: Modulus of aggregate base from FWD versus time on Section 567RF/586RF.
0
100
200
300
400
500
600
700
800
900
1000
0 1 2 3 4 5 6 7 8 9
Distance (m)
E3
(M
Pa
)
MBAC567A 1/10/02 12:10 Center 19CMBAC567B 2/14/02 11:46 Center 16C567AE 10/10/02 15:06 Center 21C567AF 1/8/03 14:04 Center 18C567AH 5/19/03 09:09 Center 23C586BC 6/24/03 15:58 Center 40C586BD 6/25/03 07:40 Center 22C586AF 12/30/03 10:47 Center 13C586VF 3/23/04 10:12 Center 19C586 Center 4/28/06 15:00 Center 28C586 Center 4/28/06 16:45 Center 23C586 CL 12/04/06 9:25 Center 7C586 CL 12/13/06 15:32 Center 15C
Figure 3.7: Modulus of subgrade from FWD on Section 567RF/586RF (center).
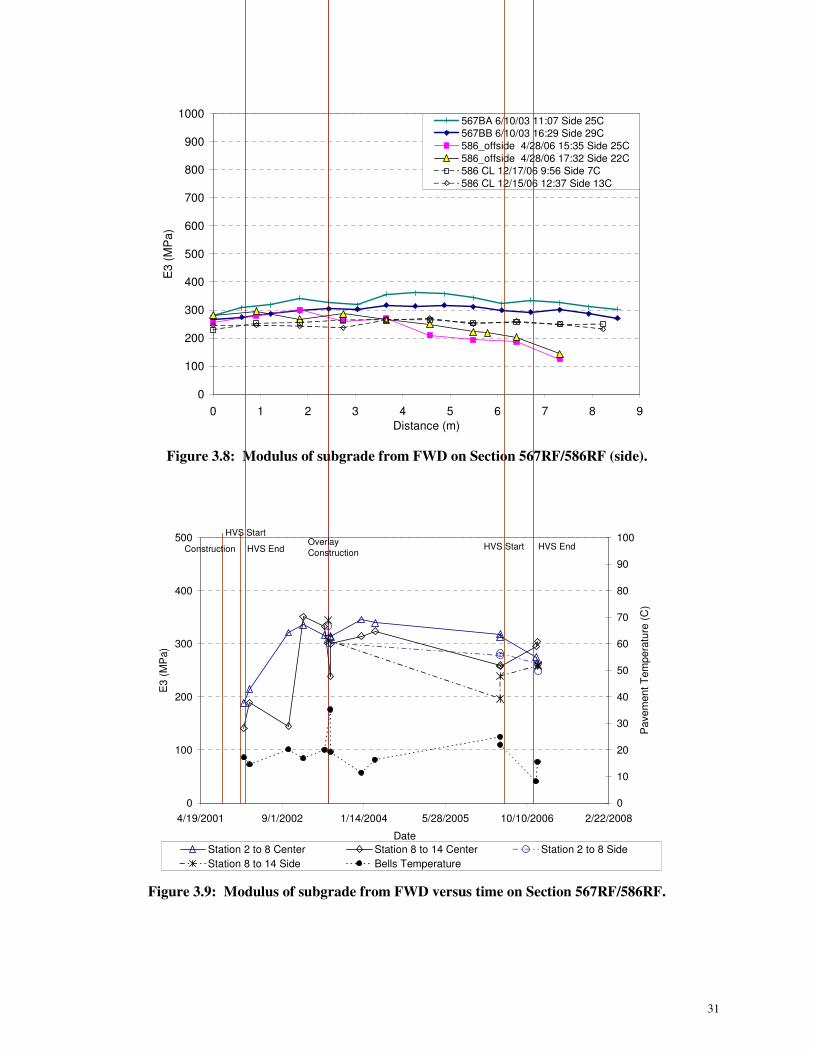
31
0
100
200
300
400
500
600
700
800
900
1000
0 1 2 3 4 5 6 7 8 9
Distance (m)
E3
(M
Pa
)
567BA 6/10/03 11:07 Side 25C
567BB 6/10/03 16:29 Side 29C
586_offside 4/28/06 15:35 Side 25C
586_offside 4/28/06 17:32 Side 22C
586 CL 12/17/06 9:56 Side 7C
586 CL 12/15/06 12:37 Side 13C
Figure 3.8: Modulus of subgrade from FWD on Section 567RF/586RF (side).
0
100
200
300
400
500
4/19/2001 9/1/2002 1/14/2004 5/28/2005 10/10/2006 2/22/2008
Date
E3
(M
Pa)
0
10
20
30
40
50
60
70
80
90
100
Pa
ve
men
t T
em
pe
ratu
re (
C)
Station 2 to 8 Center Station 8 to 14 Center Station 2 to 8 Side
Station 8 to 14 Side Bells Temperature
Overlay
ConstructionHVS Start HVS EndConstruction
HVS Start
HVS End
Figure 3.9: Modulus of subgrade from FWD versus time on Section 567RF/586RF.

32
3.2.2 Sections 568RF and 587RF: RAC-G
The backcalculated moduli for the three pavement layers on Sections 568RF and 587RF are presented in
Figure 3.10 through Figure 3.18.
Asphalt Concrete
The asphalt concrete modulus varied significantly with time, generally in a range of 1,000 MPa to
10,000 MPa in the trafficked area and 1,000 MPa to 14,000 MPa in the untrafficked area (Figure 3.10 and
Figure 3.11). Temperature had a significant effect on the asphalt concrete modulus (Figure 3.12). Based
on the data measured in the trafficked area after overlay construction (June 25, 2003) and before HVS
testing on the section started (February 18, 2005), modulus increased from 3,696 MPa to 7,310 MPa on
Subsection A, and from 3,807 MPa to 8,171 MPa on Subsection B), indicating the effect of aging during
the first 20 months after overlay construction. Modulus of the composite asphalt concrete layer in the
trafficked area showed little difference from that in the untrafficked area before the HVS test, but dropped
significantly (approximately 70 percent) after the HVS test.
Aggregate Base
The backcalculated modulus of the base changed significantly with time (Figure 3.13 and Figure 3.14) and
was generally lower between Stations 2 and 8 than between Stations 8 and 14. In the untrafficked areas,
the base on Sections 568RF/587RF (500 MPa to 2,000 MPa) was generally weaker than the base in the
corresponding area on Sections 567RF/586RF (1,000 MPa to 4,000 MPa). The trend of variation with
time of the base modulus (Figure 3.15) was similar to that observed on Sections 567RF/586RF. Modulus
increases were again attributed to recementation of the base material. Modulus increased in the trafficked
area from about 100 MPa after Phase 1 HVS testing to about 1,700 MPa before Phase 2 HVS testing, a
period of about three years. At the end of Phase 2 HVS loading, the base modulus in the trafficked area
had dropped to about 300 MPa. Reduced confinement from the damaged asphalt concrete layer and
destruction of the cemented bonds between aggregate particles were identified as the probable causes of
this modulus reduction. This observation was supported by little change in the base modulus in the
untrafficked area. Temperature had a slight affect, with lower temperatures corresponding to higher
modulus. This was consistent with the findings from Sections 567RF/586RF.
Subgrade
The backcalculated modulus of the subgrade under the trafficked test section varied in a similar pattern to
that observed on the base (Figure 3.16 and Figure 3.17). Modulus ranged between 50 MPa and 330 MPa
in the untrafficked area, which was generally lower than the subgrade modulus in the corresponding area
on Sections 567RF/586RF (200 MPa to 350 MPa). Modulus appeared to be affected by HVS loading

33
(Figure 3.18), with modulus in the trafficked area of Subsection A dropping from 170 MPa to 140 MPa
during Phase 1 HVS testing, then increasing to about 250 MPa between tests, before finally dropping to
about 100 MPa after Phase 2 testing. The subgrade modulus of Subsection B followed a similar trend but
with higher values. Changes were attributed to changes in the overlying base. The subgrade modulus in
the untrafficked area was relatively stable over time, with generally lower values than the modulus in the
trafficked area.
3.2.3 Sections 569RF and 588RF: AR4000-D
The backcalculated moduli for the three pavement layers on Sections 569RF and 588RF are presented in
Figure 3.19 through Figure 3.27.
Asphalt Concrete
The asphalt concrete modulus varied significantly with time, generally in a range of 700 MPa to
13,000 MPa in the trafficked area and 500 MPa to 15,000 MPa in the untrafficked area. As with the other
sections, temperature had a significant effect on the asphalt concrete modulus (Figure 3.21). Based on the
data measured in the trafficked area after overlay construction (June 25, 2003) and before HVS testing on
the section started (October 19, 2005), modulus increased from 5,000 MPa to 8,400 MPa on Subsection A,
and from 4,000 MPa to 6,900 MPa on Subsection B. Modulus of the composite asphalt concrete layer in
the trafficked area showed little difference from that in the untrafficked area before the HVS test, but
showed a significant reduction (approximately 80 percent) after the HVS test.
Aggregate Base
A clear trend in the backcalculated base modulus was observed along the section with higher values
between Stations 2 and 8 than between Stations 8 and 14 (Figure 3.22 and Figure 3.23). This is consistent
with the measurements after construction (3). The untrafficked base was generally weaker (100 to
1,400 MPa) compared to that on Sections 567RF/586RF (1,000 to 4,000 MPa). Trends in the base
modulus over time (Figure 3.24) were similar to those observed on Sections 567RF/ 586RF and
Sections 568RF/ 587RF. After Phase 1 HVS testing, the base modulus increased significantly over time to
about 1,200 MPa, but had dropped to 200 MPa after Phase 2 testing. Modulus showed little change in the
untrafficked area. Temperature had minimal affect on the base modulus.
Subgrade
The backcalculated modulus of the subgrade also varied along the section in a similar pattern to the base
(Figure 3.25 and Figure 3.26). Moduli in the untrafficked area ranged between 50 MPa and 180 MPa,
which was generally lower than that recorded on Sections 567RF/586RF (200 MPa to 350 MPa). The

34
modulus mirrored trends in the base (Figure 3.27) but with smaller variation (100 MPa and 200 MPa at
20°C). Temperature and HVS loading had a minor effect on the subgrade modulus.
3.2.4 Sections 571RF and 589RF: 45 mm MB4-G
The backcalculated moduli for the three pavement layers on Sections 571RF and 589RF are presented in
Figure 3.28 through Figure 3.36.
Asphalt Concrete
The asphalt concrete modulus varied significantly with time, generally in a range of 800 MPa to
9,000 MPa in the trafficked area and 1,000 MPa to 12,000 MPa in the untrafficked area. Variance of the
backcalculated asphalt concrete modulus before overlay construction (Section 571RF) was significantly
larger than that after overlay construction (Section 589RF), probably due the thickness of the underlying
DGAC layer (about 80 mm) being close to the recommended minimum value for appropriate
backcalculation of 75 mm (half the radius of the FWD loading plate). Phase 1 HVS testing did not appear
to have a significant affect on the underlying DGAC modulus (Figure 3.30), but reduced the moduli of the
aggregate base and the subgrade (Figure 3.33 and Figure 3.36). Phase 2 HVS testing started approximately
one year after overlay construction, and FWD testing did not indicate any significant aging effect on the
asphalt concrete modulus during this period. Measurements at similar temperatures after Phase 2 testing,
however, showed an increase in composite asphalt concrete modulus. Modulus in the trafficked area
showed small differences from that in the untrafficked area before the HVS test, but showed a significant
reduction (around 70 percent) after the HVS test.
Aggregate Base
The aggregate base modulus was relatively uniform along the section (Figure 3.31 and Figure 3.32) and
varied between 100 MPa and 800 MPa in the trafficked area, and between 300 MPa and 800 MPa in the
untrafficked area over the course of the study. There are two outliers in Figure 3.31, which were
backcalculated from FWD tests performed in December 2003. The test data was considered suspect and
was excluded from any further analyses. The modulus in the untrafficked area was generally weaker than
that in the corresponding area on Sections 567RF/586RF, Sections 568RF/587RF, and
Sections 569RF/588RF. The trend of variation with time of the base modulus (Figure 3.33) was similar to
that on other sections, dropping from 600 MPa to 300 MPa during Phase 1 testing, then increased
continuously over a period of 20 months to about 700 MPa. This value was less than that on
Sections 586RF, 587RF, and 588RF. During Phase 2 loading, the aggregate base modulus in the trafficked
area dropped back to about 250 MPa, but showed little change in the untrafficked area. After Phase 2

35
testing, the base modulus increased by about 150 MPa over a two-year period. Some temperature affect
was noted, with lower temperatures corresponding to higher modulus.
Subgrade
The backcalculated modulus of the subgrade was lower in Subsection A compared to Subsection B
(Figure 3.34 and Figure 3.35). It ranged between and 80 MPa and 260 MPa in the untrafficked area and
was generally lower than that on Sections 567RF/586RF, Sections 568RF/587RF, but higher than that on
Sections 569RF/588RF. The subgrade modulus followed similar trends to that of the base modulus
(Figure 3.36), but with smaller variation (200 MPa and 300 MPa at 20°C). Phase 2 HVS loading appeared
to have an effect on the modulus, which was reduced from 220 MPa to 130 MPa during the test.
3.2.5 Sections 572RF and 590RF: 90 mm MB4-G
The backcalculated moduli for the three pavement layers on Sections 572RF and 590RF are presented in
Figure 3.37 through Figure 3.45.
Asphalt Concrete
Modulus varied in a range of 500 MPa to 13,000 MPa in the trafficked area and 1,000 MPa to 13,000 MPa
in the untrafficked area. Variance of the backcalculated modulus of the underlying DGAC was
significantly larger than that after overlay construction, which was again related to the relationship
between layer thickness and FWD configuration. Based on the FWD data measured at a pavement
temperature of about 18°C, the modulus dropped from about 4,000 MPa to about 3,000 MPa during
Phase 1 testing (Figure 3.39), and from about 4,000 MPa to about 2,200 MPa during Phase 2 testing. An
aging effect was apparent after Phase 2 testing.
Aggregate Base
Base modulus was consistent along the section (Figure 3.40 and Figure 3.41), but varied from 50 MPa to
1,000 MPa in the trafficked area, and from 80 MPa to 800 MPa in the untrafficked area over the duration
of the study. Base modulus in the untrafficked area was comparable to that on Sections 571RF/589RF, and
generally weaker than that on Sections 567RF/586RF, Sections 568RF/587RF, and
Sections 569RF/588RF. The trend of variation with time of the base modulus (Figure 3.42) was similar to
that of the asphalt concrete modulus, increasing from about 600 MPa to 1,100 MPa (measured at 18°C
pavement temperature) in the eight months before Phase 1 testing. It dropped to about 100 MPa (measured
at 26°C pavement temperature) after Phase 1 testing, increased to about 770 MPa (measured at 5°C
pavement temperature) in the nine months between HVS testing, and then dropped again to 270 MPa
(measured at 19°C pavement temperature) after Phase 2 testing. The effects of recementation on the
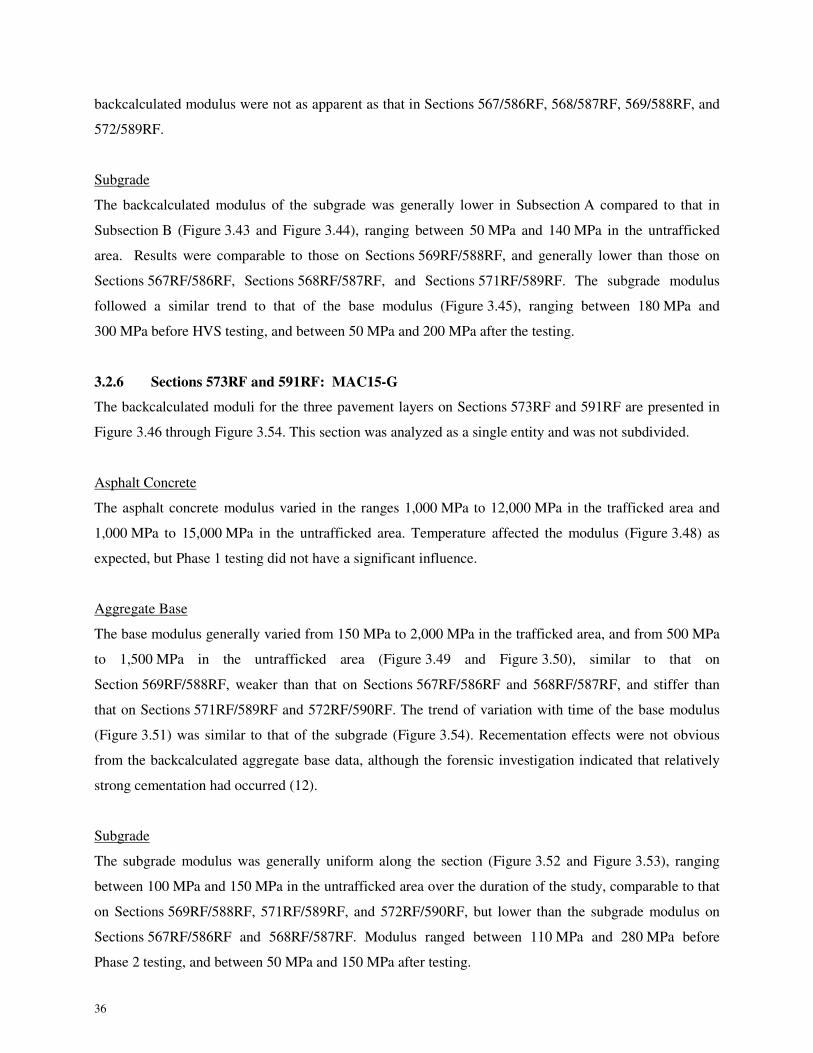
36
backcalculated modulus were not as apparent as that in Sections 567/586RF, 568/587RF, 569/588RF, and
572/589RF.
Subgrade
The backcalculated modulus of the subgrade was generally lower in Subsection A compared to that in
Subsection B (Figure 3.43 and Figure 3.44), ranging between 50 MPa and 140 MPa in the untrafficked
area. Results were comparable to those on Sections 569RF/588RF, and generally lower than those on
Sections 567RF/586RF, Sections 568RF/587RF, and Sections 571RF/589RF. The subgrade modulus
followed a similar trend to that of the base modulus (Figure 3.45), ranging between 180 MPa and
300 MPa before HVS testing, and between 50 MPa and 200 MPa after the testing.
3.2.6 Sections 573RF and 591RF: MAC15-G
The backcalculated moduli for the three pavement layers on Sections 573RF and 591RF are presented in
Figure 3.46 through Figure 3.54. This section was analyzed as a single entity and was not subdivided.
Asphalt Concrete
The asphalt concrete modulus varied in the ranges 1,000 MPa to 12,000 MPa in the trafficked area and
1,000 MPa to 15,000 MPa in the untrafficked area. Temperature affected the modulus (Figure 3.48) as
expected, but Phase 1 testing did not have a significant influence.
Aggregate Base
The base modulus generally varied from 150 MPa to 2,000 MPa in the trafficked area, and from 500 MPa
to 1,500 MPa in the untrafficked area (Figure 3.49 and Figure 3.50), similar to that on
Section 569RF/588RF, weaker than that on Sections 567RF/586RF and 568RF/587RF, and stiffer than
that on Sections 571RF/589RF and 572RF/590RF. The trend of variation with time of the base modulus
(Figure 3.51) was similar to that of the subgrade (Figure 3.54). Recementation effects were not obvious
from the backcalculated aggregate base data, although the forensic investigation indicated that relatively
strong cementation had occurred (12).
Subgrade
The subgrade modulus was generally uniform along the section (Figure 3.52 and Figure 3.53), ranging
between 100 MPa and 150 MPa in the untrafficked area over the duration of the study, comparable to that
on Sections 569RF/588RF, 571RF/589RF, and 572RF/590RF, but lower than the subgrade modulus on
Sections 567RF/586RF and 568RF/587RF. Modulus ranged between 110 MPa and 280 MPa before
Phase 2 testing, and between 50 MPa and 150 MPa after testing.

37
0
2000
4000
6000
8000
10000
12000
14000
16000
18000
20000
0 2 4 6 8 10
Distance (m)
E1
(M
Pa
)
MBAC568A 1/10/02 11:17 Center 18C MBAC568B 2/14/02 11:19 Center 18C
568AE 10/10/02 14:34 Center 21C 568AF 1/8/03 10:37 Center 18C
568AG 5/16/03 09:06 Center 22C 587BC-02 6/24/03 15:19 Center 42C
587BD 6/25/03 07:10 Center 21C 587AF-02 12/30/03 10:18 Center 12C
587VF 3/23/04 09:46 Center 22C 587RF BT Af 2/18/05 10:53 Center 19C
587RF BT Mor 2/24/05 5:43 Center 14C 587 AT Mor 10/19/05 7:30 Center 17C
587 AT Af 10/19/05 15:14 Center 23C 587CL 12/04/06 AM 6C
587CL 12/12/06 PM 14C
0
2000
4000
6000
8000
10000
12000
14000
16000
18000
20000
0 1 2 3 4 5 6 7 8 9
Distance (m)
E1
(M
Pa)
568BA 6/10/03 10:50 Side 31C
568BB 6/10/03 16:12 Side 26C
587RF_offside BT PM 2/18/05 11:24 Side 17C
587RF_offside BT AM 2/24/05 5:30 Side 13C
587RF_offside AT AM 10/19/05 8:35 Side 17C
587RF_offside AT PM 10/19/05 16:04 Side 20C
587 Side 12/17/06 AM 5C
587 Side 12/15/06 PM 14C
Figure 3.10: Modulus of asphalt concrete from FWD on
Section 568RF/587RF (RAC-G)(center).
Figure 3.11: Modulus of asphalt concrete from FWD on
Section 568RF/587RF (side).
0
1000
2000
3000
4000
5000
6000
7000
8000
9000
10000
04/19/01 09/01/02 01/14/04 05/28/05 10/10/06 02/22/08
Date
E1
(M
Pa)
0.0
10.0
20.0
30.0
40.0
50.0
60.0
70.0
80.0
90.0
100.0
Pa
ve
me
nt
Tem
pe
ratu
re (
C)
Station 3 to 8 Center Station 8 to 14 Center Station 3 to 8 Side
Station 8 to 14 Side Bells temp (C)
Overlay
Construction HVS Start HVS EndConstruction
HVS Start
HVS End
Figure 3.12: Modulus of asphalt concrete from FWD versus time on Section 568RF/587RF.
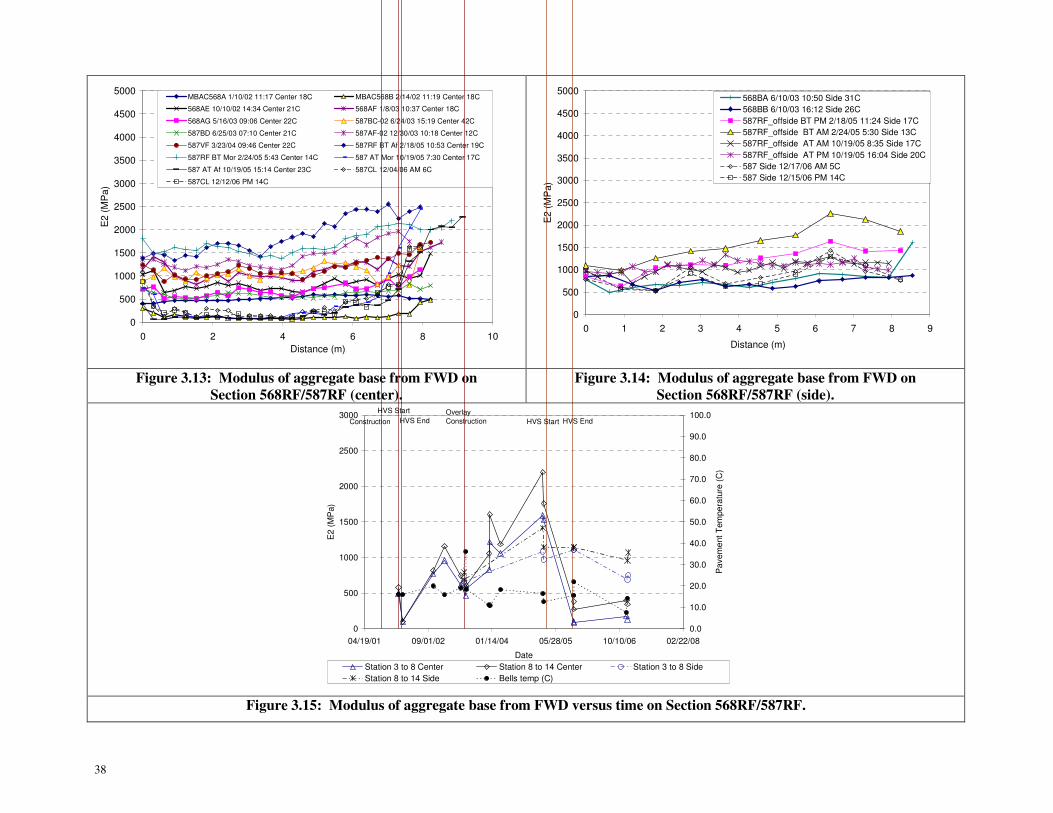
38
0
500
1000
1500
2000
2500
3000
3500
4000
4500
5000
0 2 4 6 8 10
Distance (m)
E2
(M
Pa
)MBAC568A 1/10/02 11:17 Center 18C MBAC568B 2/14/02 11:19 Center 18C
568AE 10/10/02 14:34 Center 21C 568AF 1/8/03 10:37 Center 18C
568AG 5/16/03 09:06 Center 22C 587BC-02 6/24/03 15:19 Center 42C
587BD 6/25/03 07:10 Center 21C 587AF-02 12/30/03 10:18 Center 12C
587VF 3/23/04 09:46 Center 22C 587RF BT Af 2/18/05 10:53 Center 19C
587RF BT Mor 2/24/05 5:43 Center 14C 587 AT Mor 10/19/05 7:30 Center 17C
587 AT Af 10/19/05 15:14 Center 23C 587CL 12/04/06 AM 6C
587CL 12/12/06 PM 14C
0
500
1000
1500
2000
2500
3000
3500
4000
4500
5000
0 1 2 3 4 5 6 7 8 9
Distance (m)
E2
(M
Pa)
568BA 6/10/03 10:50 Side 31C
568BB 6/10/03 16:12 Side 26C
587RF_offside BT PM 2/18/05 11:24 Side 17C
587RF_offside BT AM 2/24/05 5:30 Side 13C
587RF_offside AT AM 10/19/05 8:35 Side 17C
587RF_offside AT PM 10/19/05 16:04 Side 20C
587 Side 12/17/06 AM 5C
587 Side 12/15/06 PM 14C
Figure 3.13: Modulus of aggregate base from FWD on
Section 568RF/587RF (center).
Figure 3.14: Modulus of aggregate base from FWD on
Section 568RF/587RF (side).
0
500
1000
1500
2000
2500
3000
04/19/01 09/01/02 01/14/04 05/28/05 10/10/06 02/22/08
Date
E2
(M
Pa)
0.0
10.0
20.0
30.0
40.0
50.0
60.0
70.0
80.0
90.0
100.0
Pa
ve
me
nt
Tem
pe
ratu
re (
C)
Station 3 to 8 Center Station 8 to 14 Center Station 3 to 8 Side
Station 8 to 14 Side Bells temp (C)
Overlay
Construction HVS Start HVS EndConstruction
HVS Start
HVS End
Figure 3.15: Modulus of aggregate base from FWD versus time on Section 568RF/587RF.

39
0
100
200
300
400
500
600
700
800
900
1000
0 2 4 6 8 10
Distance (m)
E3
(M
Pa
)MBAC568A 1/10/02 11:17 Center 18C MBAC568B 2/14/02 11:19 Center 18C
568AE 10/10/02 14:34 Center 21C 568AF 1/8/03 10:37 Center 18C
568AG 5/16/03 09:06 Center 22C 587BC-02 6/24/03 15:19 Center 42C
587BD 6/25/03 07:10 Center 21C 587AF-02 12/30/03 10:18 Center 12C
587VF 3/23/04 09:46 Center 22C 587RF BT Af 2/18/05 10:53 Center 19C
587RF BT Mor 2/24/05 5:43 Center 14C 587 AT Mor 10/19/05 7:30 Center 17C
587 AT Af 10/19/05 15:14 Center 23C 587CL 12/04/06 AM 6C
587CL 12/12/06 PM 14C
0
100
200
300
400
500
600
700
800
900
1000
0 1 2 3 4 5 6 7 8 9
Distance (m)
E3
(M
Pa)
568BA 6/10/03 10:50 Side 31C
568BB 6/10/03 16:12 Side 26C
587RF_offside BT PM 2/18/05 11:24 Side 17C
587RF_offside BT AM 2/24/05 5:30 Side 13C
587RF_offside AT AM 10/19/05 8:35 Side 17C
587RF_offside AT PM 10/19/05 16:04 Side 20C
587 Side 12/17/06 AM 5C
587 Side 12/15/06 PM 14C
Figure 3.16: Modulus of subgrade from FWD on
Section 568RF/587RF (center).
Figure 3.17: Modulus of subgrade from FWD on
Section 568RF/587RF (side).
0
50
100
150
200
250
300
350
400
450
500
04/19/01 09/01/02 01/14/04 05/28/05 10/10/06 02/22/08
Date
E3
(M
Pa)
0.0
10.0
20.0
30.0
40.0
50.0
60.0
70.0
80.0
90.0
100.0
Pa
ve
me
nt
Tem
pe
ratu
re (
C)
Station 3 to 8 Center Station 8 to 14 Center Station 3 to 8 Side
Station 8 to 14 Side Bells temp (C)
Overlay
Construction HVS Start HVS EndConstruction
HVS Start
HVS End
Figure 3.18: Modulus of subgrade from FWD versus time on Section 568RF/587RF.

40
0
5000
10000
15000
20000
25000
0 1 2 3 4 5 6 7 8 9 10
Distance (m)
E1 (
MP
a)
569AI 4/11/03 11:10 Center 22C 569AJ 5/16/03 8:29 Center 20C
MBAC569A 1/10/02 10:03 Center 13C MBAC569B 2/14/02 10:48 Center 14C
569AE 10/10/02 13:59 Center 23C 569AF 1/8/03 13:20 Center 18C
569AG 3/28/03 13:18 Center 32C 569AH 4/4/03 10:51 Center 20C
588BC 6/24/03 14:41 Center 41C 588BD 6/25/03 06:38 Center 19C
588BE 12/19/03 11:10 Center 15C 588AF 12/30/03 9:38 Center 10C
588VF 3/23/03 9:15 Center 18C 588 BT AM 10/19/05 6:55 Center 16C
588 BT PM 10/19/05 14:38 Center 27C 588 AT AM 4/28/06 12:50 Center 25C
588 AT PM 4/28/06 15:47 Center 28C 588 CL 12/04/06 5C
588 CL 12/12/06 15C
0
2000
4000
6000
8000
10000
12000
14000
16000
18000
20000
0 1 2 3 4 5 6 7 8 9
Distance (m)
E1
(M
Pa
)
569BA 6/10/03 10:23 Side 24C
569BB 6/10/03 15:52 Side 30C
588 BT AM 10/19/05 8:04 Side 17C
588 BT PM 10/19/05 15:41 Side 21C
588 AT AM 4/28/05 13:23 Side 28C
588 AT PM 4/28/6 16:28 Side 28C
588 Side 12/14/06 17C
588 Side 12/16/06 12C
Figure 3.19: Modulus of asphalt concrete from FWD on
Section 569RF/588RF (AR4000-D)(center).
Figure 3.20: Modulus of asphalt concrete from FWD on
Section 569RF/588RF (side).
0
3000
6000
9000
12000
15000
4/19/01 9/1/02 1/14/04 5/28/05 10/10/06 2/22/08
Date
E1
(M
Pa
)
0.0
10.0
20.0
30.0
40.0
50.0
60.0
70.0
80.0
90.0
100.0
Pa
ve
me
nt
Te
mp
era
ture
(C
)
Station 3 to 8 Center Station 8 to 14 Center Station 3 to 8 Side
Station 8 to 14 Side Bells Temp (C)
Overlay
Construction
HVS StartHVS EndConstruction
HVS Start
HVS End
Figure 3.21: Modulus of asphalt concrete from FWD versus time on Section 569RF/588RF.
41
0
500
1000
1500
2000
2500
3000
0 1 2 3 4 5 6 7 8 9 10
Distance (m)
E2 (
MP
a)
569AI 4/11/03 11:10 Center 22C 569AJ 5/16/03 8:29 Center 20C
MBAC569A 1/10/02 10:03 Center 13C MBAC569B 2/14/02 10:48 Center 14C
569AE 10/10/02 13:59 Center 23C 569AF 1/8/03 13:20 Center 18C
569AG 3/28/03 13:18 Center 32C 569AH 4/4/03 10:51 Center 20C
588BC 6/24/03 14:41 Center 41C 588BD 6/25/03 06:38 Center 19C
588BE 12/19/03 11:10 Center 15C 588AF 12/30/03 9:38 Center 10C
588VF 3/23/03 9:15 Center 18C 588 BT AM 10/19/05 6:55 Center 16C
588 BT PM 10/19/05 14:38 Center 27C 588 AT AM 4/28/06 12:50 Center 25C
588 AT PM 4/28/06 15:47 Center 28C 588 CL 12/04/06 5C
588 CL 12/12/06 15C
0
1000
2000
3000
0 1 2 3 4 5 6 7 8 9
Distance (m)
E2
(M
Pa
)
569BA 6/10/03 10:23 Side 24C569BB 6/10/03 15:52 Side 30C588 BT AM 10/19/05 8:04 Side 17C588 BT PM 10/19/05 15:41 Side 21C588 AT AM 4/28/05 13:23 Side 28C588 AT PM 4/28/6 16:28 Side 28C588 Side 12/14/06 17C588 Side 12/16/06 12C
Figure 3.22: Modulus of aggregate base from FWD on
Section 569RF/588RF (center).
Figure 3.23: Modulus of aggregate base from FWD on
Section 569RF/588RF (side).
0
1000
2000
3000
4/19/01 9/1/02 1/14/04 5/28/05 10/10/06 2/22/08
Date
E2
(M
Pa
)
0.0
5.0
10.0
15.0
20.0
25.0
30.0
35.0
40.0
45.0
Pa
ve
me
nt
Te
mp
era
ture
(C
)
Station 3 to 8 Center Station 8 to 14 Center Station 3 to 8 Side
Station 8 to 14 Side Bells Temp (C)
Overlay
Construction
HVS StartHVS EndConstruction
HVS Start
HVS End
Figure 3.24: Modulus of aggregate base from FWD versus time on Section 569RF/588RF.

42
0
50
100
150
200
250
300
350
400
450
500
0 1 2 3 4 5 6 7 8 9 10
Distance (m)
E3 (
MP
a)
569AI 4/11/03 11:10 Center 22C 569AJ 5/16/03 8:29 Center 20CMBAC569A 1/10/02 10:03 Center 13C MBAC569B 2/14/02 10:48 Center 14C569AE 10/10/02 13:59 Center 23C 569AF 1/8/03 13:20 Center 18C569AG 3/28/03 13:18 Center 32C 569AH 4/4/03 10:51 Center 20C588BC 6/24/03 14:41 Center 41C 588BD 6/25/03 06:38 Center 19C588BE 12/19/03 11:10 Center 15C 588AF 12/30/03 9:38 Center 10C588VF 3/23/03 9:15 Center 18C 588 BT AM 10/19/05 6:55 Center 16C588 BT PM 10/19/05 14:38 Center 27C 588 AT AM 4/28/06 12:50 Center 25C588 AT PM 4/28/06 15:47 Center 28C 588 CL 12/04/06 5C588 CL 12/12/06 15C
0
100
200
300
400
500
0 1 2 3 4 5 6 7 8 9
Distance (m)
E3
(M
Pa
)
569BA 6/10/03 10:23 Side 24C569BB 6/10/03 15:52 Side 30C588 BT AM 10/19/05 8:04 Side 17C588 BT PM 10/19/05 15:41 Side 21C588 AT AM 4/28/05 13:23 Side 28C588 AT PM 4/28/6 16:28 Side 28C588 Side 12/14/06 17C588 Side 12/16/06 12C
Figure 3.25: Modulus of subgrade from FWD on
Section 569RF/588RF (center).
Figure 3.26: Modulus of subgrade from FWD on
Section 569RF/588RF (side).
0
100
200
300
400
500
4/19/01 9/1/02 1/14/04 5/28/05 10/10/06 2/22/08
Date
E3
(M
Pa
)
0
5
10
15
20
25
30
35
40
45
Pa
ve
me
nt
Te
mp
era
ture
(C
)
Station 3 to 8 Center Station 8 to 14 Center Station 3 to 8 Side
Station 8 to 14 Side Bells Temp (C)
Overlay
Construction
HVS StartHVS EndConstruction
HVS Start
HVS End
Figure 3.27: Modulus of subgrade from FWD versus time on Section 569RF/588RF.

43
0
5000
10000
15000
20000
25000
0 1 2 3 4 5 6 7 8 9 10
Distance (m)
E1
(M
Pa)
571AE 10/10/02 11:25 Center 20C 571AF 1/8/03 9:57 Center 15C571AG 5/16/03 11:30 Center 30C MBAC571A 1/10/02 15:11 Center 19CMBAC571B 2/14/02 15:38 Center 18C 589BC 6/24/03 17:49 Center 36C589BD-02 6/25/03 9:51 Center 32C 589BE 12/19/03 16:40 Center 14C589BE-02 12/22/03 15:18 Center 19C 589AF 12/30/03 14:11 Center 15C589BF 3/22/04 8:42 Center 17C 589BI 6/17/04 11:01 Center 27C589BJ 6/21/04 10:10 Center 28C 589Center AT PM 2/18/05 12:31 Center 20C589Center AT AM 2/24/05 5:05 Center 13C 589 CL 12/15/06 13C589 CL 12/17/06 6C
0
2000
4000
6000
8000
10000
12000
14000
16000
18000
20000
0 1 2 3 4 5 6 7 8 9 10
Distance (m)
E1
(M
Pa
)
571BA 6/10/03 11:57 Side 27C 571BB 6/10/03 17:41 Side 28C
589BI2 6/17/04 13:08 Side 34C 589BJ2 6/21/04 10:54 Side 31C
589 AT PM 2/18/05 11:41 Side 18C 589 AT AM 2/23/05 7:53 Side 11C
589 Side 12/15/06 13C 589 Side 12/17/06 4C
Figure 3.28: Modulus of asphalt concrete from FWD on
Section 571RF/589RF (MB4-G-45)(center).
Figure 3.29: Modulus of asphalt concrete from FWD on
Section 571RF/589RF (side).
0
3000
6000
9000
12000
15000
4/19/01 9/1/02 1/14/04 5/28/05 10/10/06 2/22/08
Date
E1
(M
Pa)
-50
-40
-30
-20
-10
0
10
20
30
40
50
Pa
ve
me
nt
Te
mp
era
ture
(C
)
Station 3 to 8 Center Station 8 to 14 Center Station 3 to 8 Side
Station 8 to 14 Side Bells Temp (C)
Overlay
ConstructionHVS Start
HVS End Construction
HVS Start
HVS End
Figure 3.30: Modulus of asphalt concrete from FWD versus time on Section 571RF/589RF.

44
0
500
1000
1500
2000
2500
3000
3500
4000
4500
5000
0 1 2 3 4 5 6 7 8 9 10
Distance (m)
E2
(M
Pa
)
571AE 10/10/02 11:25 Center 20C 571AF 1/8/03 9:57 Center 15C571AG 5/16/03 11:30 Center 30C MBAC571A 1/10/02 15:11 Center 19CMBAC571B 2/14/02 15:38 Center 18C 589BC 6/24/03 17:49 Center 36C589BD-02 6/25/03 9:51 Center 32C 589BE 12/19/03 16:40 Center 14C589BE-02 12/22/03 15:18 Center 19C 589AF 12/30/03 14:11 Center 15C589BF 3/22/04 8:42 Center 17C 589BI 6/17/04 11:01 Center 27C589BJ 6/21/04 10:10 Center 28C 589Center AT PM 2/18/05 12:31 Center 20C589Center AT AM 2/24/05 5:05 Center 13C 589 CL 12/15/06 13C589CL 12/17/06 6C
0
1000
2000
3000
0 1 2 3 4 5 6 7 8 9 10
Distance (m)
E2
(M
Pa
)
571BA 6/10/03 11:57 Side 27C 571BB 6/10/03 17:41 Side 28C
589BI2 6/17/04 13:08 Side 34C 589BJ2 6/21/04 10:54 Side 31C
589 AT PM 2/18/05 11:41 Side 18C 589 AT AM 2/23/05 7:53 Side 11C
589 Side 12/15/06 13C 589 Side 12/17/06 4C
Figure 3.31: Modulus of aggregate base from FWD on
Section 571RF589RF (center).
Figure 3.32: Modulus of aggregate base from FWD on
Section 571RF/589RF (side).
0
1000
2000
3000
4/19/01 9/1/02 1/14/04 5/28/05 10/10/06 2/22/08
Date
E2
(M
Pa)
-50
-40
-30
-20
-10
0
10
20
30
40
50
Pa
ve
me
nt
Te
mp
era
ture
(C
)
Station 3 to 8 Center Station 8 to 14 Center Station 3 to 8 Side
Station 8 to 14 Side Bells Temp (C)
Overlay
ConstructionHVS Start
HVS End Construction
HVS Start
HVS End
Figure 3.33: Modulus of aggregate base from FWD versus time on Section 571RF/589RF.

45
0
50
100
150
200
250
300
350
400
450
500
0 1 2 3 4 5 6 7 8 9 10
Distance (m)
E3
(M
Pa)
571AE 10/10/02 11:25 Center 20C 571AF 1/8/03 9:57 Center 15C571AG 5/16/03 11:30 Center 30C MBAC571A 1/10/02 15:11 Center 19CMBAC571B 2/14/02 15:38 Center 18C 589BC 6/24/03 17:49 Center 36C589BD-02 6/25/03 9:51 Center 32C 589BE 12/19/03 16:40 Center 14C589BE-02 12/22/03 15:18 Center 19C 589AF 12/30/03 14:11 Center 15C589BF 3/22/04 8:42 Center 17C 589BI 6/17/04 11:01 Center 27C589BJ 6/21/04 10:10 Center 28C 589Center AT PM 2/18/05 12:31 Center 20C589Center AT AM 2/24/05 5:05 Center 13C 589 CL 12/15/06 13C589 CL 12/17/06 6C
0
100
200
300
400
500
0 1 2 3 4 5 6 7 8 9 10
Distance (m)
E3
(M
Pa
)
571BA 6/10/03 11:57 Side 27C 571BB 6/10/03 17:41 Side 28C
589BI2 6/17/04 13:08 Side 34C 589BJ2 6/21/04 10:54 Side 31C
589 AT PM 2/18/05 11:41 Side 18C 589 AT AM 2/23/05 7:53 Side 11C
589 Side 12/15/06 13C 589 Side 12/17/06 4C
Figure 3.34: Modulus of subgrade from FWD on
Section 571RF/589RF (center).
Figure 3.35: Modulus of subgrade from FWD on
Section 571RF/and 589RF (side).
0
100
200
300
400
500
4/19/01 9/1/02 1/14/04 5/28/05 10/10/06 2/22/08
Date
E3
(M
Pa)
-50
-40
-30
-20
-10
0
10
20
30
40
50
Pa
ve
me
nt
Te
mp
era
ture
(C
)
Station 3 to 8 Center Station 8 to 14 Center Station 3 to 8 Side
Station 8 to 14 Side Bells Temp (C)
Overlay
ConstructionHVS Start
HVS End Construction
HVS Start
HVS End
Figure 3.36: Modulus of subgrade from FWD versus time on Section 571RF/589RF.

46
0
2000
4000
6000
8000
10000
12000
14000
16000
18000
20000
0 1 2 3 4 5 6 7 8 9 10
Distance (m)
E1
(M
Pa)
572AM 5/16/03 10:59 Center 30C 572AK 3/12/03 13:11 Center 29C572AJ 2/28/03 11:23 Center 22C 572AI 2/21/03 10:56 Center 23C572AH 2/4/03 13:22 Center 23C 572AG 2/4/03 9:28 Center 10C572AF 1/8/03 9:21 Center 12C 572AE 10/10/02 10:22 Center 20CMBAC572B 2/14/02 15:10 Center 18C MBAC572A 1/10/02 14:32 Center 21C590AF 1/05/04 08:54 Center 06C 590BG 3/22/04 11:17 Center 23C590BI 6/16/04 16:27 Center 26C 590BJ 6/21/04 09:36 Center 23C590 CL 12/13/06 16C 590 CL 12/16/06 14C590BC 6/24/03 17:20 38C 590BD 6/25/03 9:10 30C
0
2000
4000
6000
8000
10000
12000
14000
16000
18000
20000
0 1 2 3 4 5 6 7 8 9
Distance (m)
E1
(M
Pa
)
572BB 6/10/03 17:14 29C 572BA 6/10/03 11:42 28C
590BGS 3/22/04 13:14 Side 22C 590BI2 6/16/04 17:00 Side 27C
590BJ2 6/21/04 10:42 Side 32C 590 Side 12/17/06 2C
590 Side 12/15/06 13C
Figure 3.37: Modulus of asphalt concrete from FWD on
Section 572RF/590RF (MB4-G-90)(center).
Figure 3.38: Modulus of asphalt concrete from FWD on
Section 572RF590RF (side).
0
3000
6000
9000
12000
15000
04/19/01 09/01/02 01/14/04 05/28/05 10/10/06 02/22/08
Date
E1 (
MP
a)
-50
-40
-30
-20
-10
0
10
20
30
40
50
Pavem
ent
Tem
pera
ture
(C
)
Station 2 to 8 Center Station 8 to 14 Center Station 2 to 8 Side
Station 8 to 14 Side Bells Temp (C)
Ove
rlay
Co
nstr
uctio
n
HV
S S
tart
HV
S E
nd
Co
nstr
uctio
n
HV
S S
tart
HV
S E
nd
Figure 3.39: Modulus of asphalt concrete from FWD versus time on Section 572RF/590RF.

47
0
500
1000
1500
2000
2500
3000
0 1 2 3 4 5 6 7 8 9 10
Distance (m)
E2
(M
Pa)
572AM 5/16/03 10:59 Center 30C 572AK 3/12/03 13:11 Center 29C572AJ 2/28/03 11:23 Center 22C 572AI 2/21/03 10:56 Center 23C572AH 2/4/03 13:22 Center 23C 572AG 2/4/03 9:28 Center 10C572AF 1/8/03 9:21 Center 12C 572AE 10/10/02 10:22 Center 20CMBAC572B 2/14/02 15:10 Center 18C MBAC572A 1/10/02 14:32 Center 21C590AF 1/05/04 08:54 Center 06C 590BG 3/22/04 11:17 Center 23C590BI 6/16/04 16:27 Center 26C 590BJ 6/21/04 09:36 Center 23C590 CL 12/13/06 16C 590 CL 12/16/06 14C590BC 6/24/03 17:20 38C 590BD 6/25/03 9:10 30C
0
200
400
600
800
1000
1200
1400
1600
1800
2000
0 1 2 3 4 5 6 7 8 9
Distance (m)
E2
(M
Pa
)
572BB 6/10/03 17:14 29C 572BA 6/10/03 11:42 28C
590BGS 3/22/04 13:14 Side 22C 590BI2 6/16/04 17:00 Side 27C
590BJ2 6/21/04 10:42 Side 32C 590 Side 12/17/06 2C
590 Side 12/15/06 13C
Figure 3.40: Modulus of aggregate base from FWD on
Sections 572RF/590RF (center).
Figure 3.41: Modulus of aggregate base from FWD on
Section 572RF/590RF (side).
0
500
1000
1500
2000
04/19/01 09/01/02 01/14/04 05/28/05 10/10/06 02/22/08
Date
E2 (
MP
a)
-50
-40
-30
-20
-10
0
10
20
30
40
50
Pavem
ent T
em
pera
ture
(C
)
Station 2 to 8 Center Station 8 to 14 Center Station 2 to 8 Side
Station 8 to 14 Side Bells Temp (C)
Ove
rla
y
Co
nstr
uctio
n
HV
S S
tart
HV
S E
nd
Co
nstr
uctio
n
HV
S S
tart
HV
S E
nd
Figure 3.42: Modulus of aggregate base from FWD versus time on Section 572RF/590RF.

48
0
50
100
150
200
250
300
350
400
450
500
0 1 2 3 4 5 6 7 8 9 10
Distance (m)
E3
(M
Pa)
572AM 5/16/03 10:59 Center 30C 572AK 3/12/03 13:11 Center 29C572AJ 2/28/03 11:23 Center 22C 572AI 2/21/03 10:56 Center 23C572AH 2/4/03 13:22 Center 23C 572AG 2/4/03 9:28 Center 10C572AF 1/8/03 9:21 Center 12C 572AE 10/10/02 10:22 Center 20CMBAC572B 2/14/02 15:10 Center 18C MBAC572A 1/10/02 14:32 Center 21C590AF 1/05/04 08:54 Center 06C 590BG 3/22/04 11:17 Center 23C590BI 6/16/04 16:27 Center 26C 590BJ 6/21/04 09:36 Center 23C590 CL 12/13/06 16C 590 CL 12/16/06 14C590BC 6/24/03 17:20 38C 590BD 6/25/03 9:10 30C
0
50
100
150
200
250
300
350
400
450
500
0 1 2 3 4 5 6 7 8 9
Distance (m)
E3
(M
Pa
)
572BB 6/10/03 17:14 29C 572BA 6/10/03 11:42 28C
590BGS 3/22/04 13:14 Side 22C 590BI2 6/16/04 17:00 Side 27C
590BJ2 6/21/04 10:42 Side 32C 590 Side 12/17/06 2C
590 Side 12/15/06 13C
Figure 3.43: Modulus of subgrade from FWD on
Section 572RF/590RF (center).
Figure 3.44: Modulus of subgrade from FWD on
Section 572RF/590RF (side).
0
100
200
300
400
500
04/19/01 09/01/02 01/14/04 05/28/05 10/10/06 02/22/08
Date
E3 (
MP
a)
-50
-40
-30
-20
-10
0
10
20
30
40
50
Pavem
ent T
em
pera
ture
(C
)
Station 2 to 8 Center Station 8 to 14 Center Station 2 to 8 Side
Station 8 to 14 Side Bells Temp (C)
Ove
rlay
Con
str
uctio
n
HV
S S
tart
HV
S E
nd
Con
str
uctio
n
HV
S S
tart
HV
S E
nd
Figure 3.45: Modulus of subgrade from FWD versus time on Section 572RF/590RF.
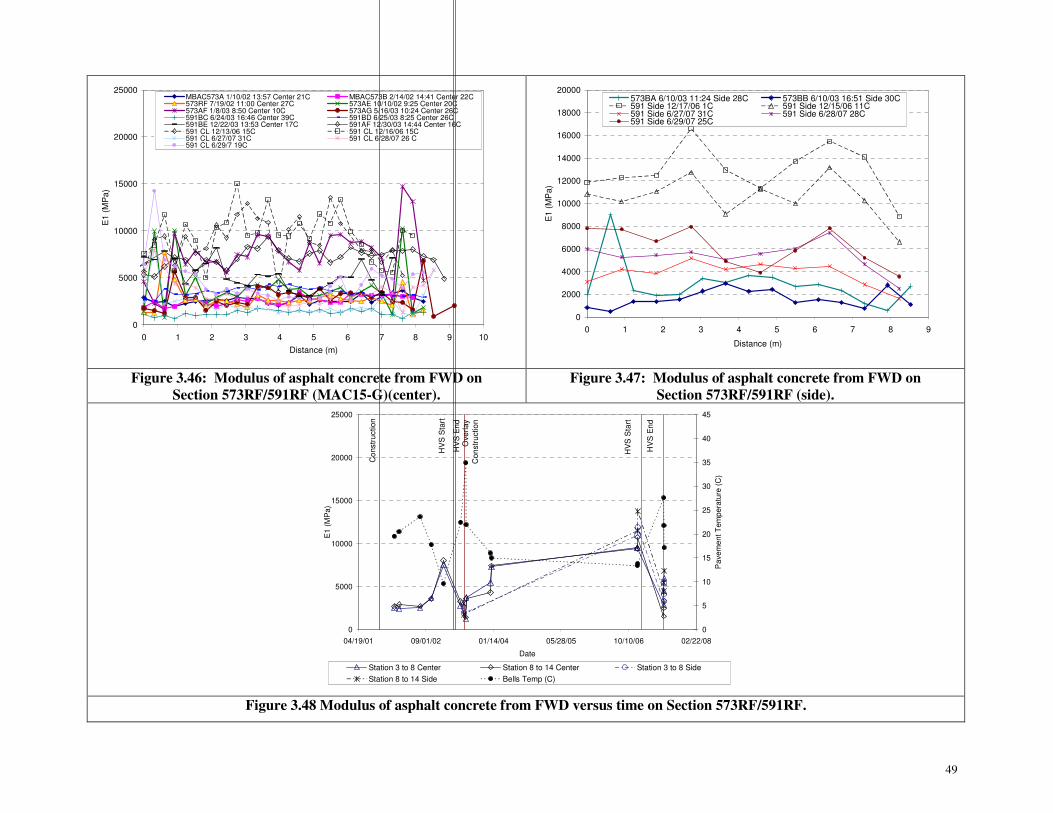
49
0
5000
10000
15000
20000
25000
0 1 2 3 4 5 6 7 8 9 10
Distance (m)
E1 (
MP
a)
MBAC573A 1/10/02 13:57 Center 21C MBAC573B 2/14/02 14:41 Center 22C573RF 7/19/02 11:00 Center 27C 573AE 10/10/02 9:25 Center 20C573AF 1/8/03 8:50 Center 10C 573AG 5/16/03 10:24 Center 26C591BC 6/24/03 16:46 Center 39C 591BD 6/25/03 8:25 Center 26C591BE 12/22/03 13:53 Center 17C 591AF 12/30/03 14:44 Center 16C591 CL 12/13/06 15C 591 CL 12/16/06 15C591 CL 6/27/07 31C 591 CL 6/28/07 26 C591 CL 6/29/7 19C
0
2000
4000
6000
8000
10000
12000
14000
16000
18000
20000
0 1 2 3 4 5 6 7 8 9
Distance (m)
E1
(M
Pa
)
573BA 6/10/03 11:24 Side 28C 573BB 6/10/03 16:51 Side 30C591 Side 12/17/06 1C 591 Side 12/15/06 11C591 Side 6/27/07 31C 591 Side 6/28/07 28C591 Side 6/29/07 25C
Figure 3.46: Modulus of asphalt concrete from FWD on
Section 573RF/591RF (MAC15-G)(center).
Figure 3.47: Modulus of asphalt concrete from FWD on
Section 573RF/591RF (side).
0
5000
10000
15000
20000
25000
04/19/01 09/01/02 01/14/04 05/28/05 10/10/06 02/22/08
Date
E1
(M
Pa
)
0
5
10
15
20
25
30
35
40
45
Pa
ve
me
nt T
em
pe
ratu
re (
C)
Station 3 to 8 Center Station 8 to 14 Center Station 3 to 8 Side
Station 8 to 14 Side Bells Temp (C)
Ove
rlay
Con
str
uctio
n
Co
nstr
uction
HV
S S
tart
HV
S E
nd
HV
S S
tart
HV
S E
nd
Figure 3.48 Modulus of asphalt concrete from FWD versus time on Section 573RF/591RF.

50
0
500
1000
1500
2000
2500
3000
3500
4000
4500
5000
0 1 2 3 4 5 6 7 8 9 10
Distance (m)
E2 (
MP
a)
MBAC573A 1/10/02 13:57 Center 21C MBAC573B 2/14/02 14:41 Center 22C573RF 7/19/02 11:00 Center 27C 573AE 10/10/02 9:25 Center 20C573AF 1/8/03 8:50 Center 10C 573AG 5/16/03 10:24 Center 26C591BC 6/24/03 16:46 Center 39C 591BD 6/25/03 8:25 Center 26C591BE 12/22/03 13:53 Center 17C 591AF 12/30/03 14:44 Center 16C591 CL 12/13/06 15C 591 CL 12/16/06 15C591 CL 6/27/07 31C 591 CL 6/28/07 26C591 CL 6/29/07 19C
0
500
1000
1500
2000
2500
3000
3500
4000
4500
5000
0 1 2 3 4 5 6 7 8 9
Distance (m)
E2
(M
Pa
)
573BA 6/10/03 11:24 Side 28C 573BB 6/10/03 16:51 Side 30C
591 Side 12/17/06 1C 591 Side 12/15/06 11C
591 Side 6/27/07 31C 591 Side 6/28/07 28C
591 Side 6/29/07 25C
Figure 3.49: Modulus of aggregate base from FWD on
Section 573RF/591RF (center).
Figure 3.50: Modulus of aggregate base from FWD on
Section 573RF/591RF (side).
0
500
1000
1500
2000
2500
3000
3500
4000
4500
5000
04/19/01 09/01/02 01/14/04 05/28/05 10/10/06 02/22/08
Date
E2
(M
Pa
)
0
5
10
15
20
25
30
35
40
45
Pa
ve
me
nt T
em
pe
ratu
re (
C)
Station 3 to 8 Center Station 8 to 14 Center Station 3 to 8 Side
Station 8 to 14 Side Bells Temp (C)
Overl
ay
Con
str
uctio
n
Co
nstr
uction
HV
S S
tart
HV
S E
nd
HV
S S
tart
HV
S E
nd
Figure 3.51: Modulus of aggregate base from FWD versus time on Section 573RF/591RF.
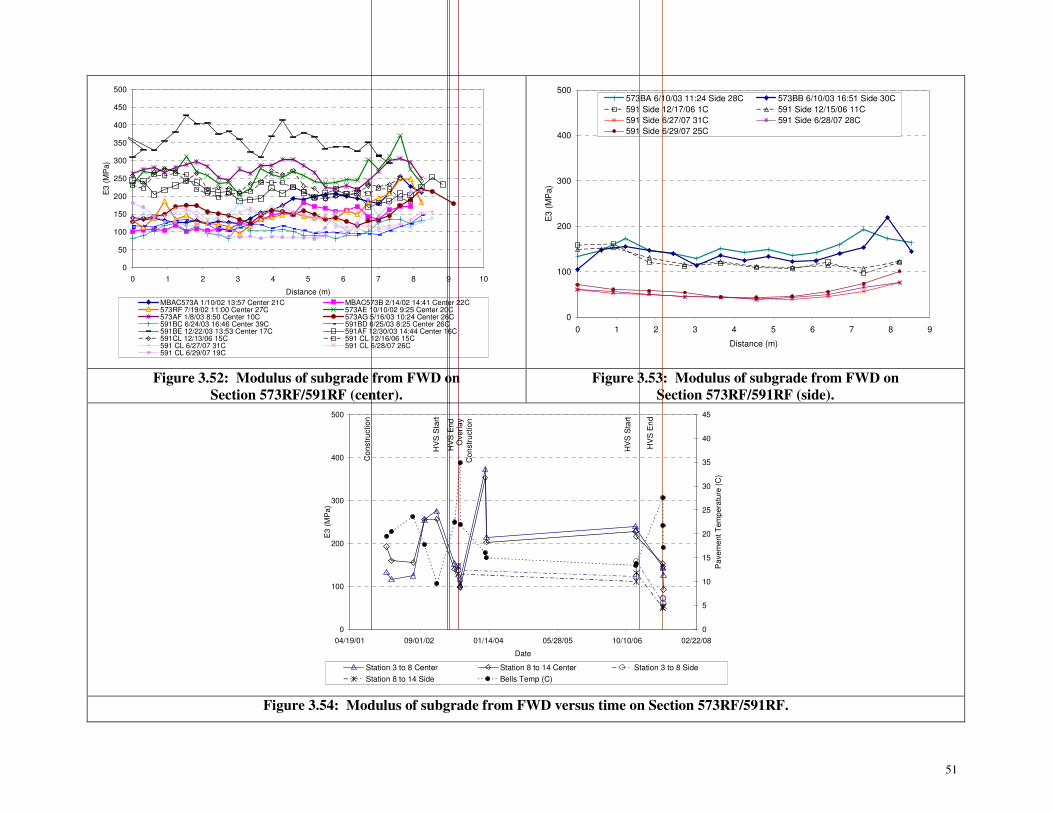
51
0
50
100
150
200
250
300
350
400
450
500
0 1 2 3 4 5 6 7 8 9 10
Distance (m)
E3
(M
Pa)
MBAC573A 1/10/02 13:57 Center 21C MBAC573B 2/14/02 14:41 Center 22C573RF 7/19/02 11:00 Center 27C 573AE 10/10/02 9:25 Center 20C573AF 1/8/03 8:50 Center 10C 573AG 5/16/03 10:24 Center 26C591BC 6/24/03 16:46 Center 39C 591BD 6/25/03 8:25 Center 26C591BE 12/22/03 13:53 Center 17C 591AF 12/30/03 14:44 Center 16C591CL 12/13/06 15C 591 CL 12/16/06 15C591 CL 6/27/07 31C 591 CL 6/28/07 26C591 CL 6/29/07 19C
0
100
200
300
400
500
0 1 2 3 4 5 6 7 8 9
Distance (m)
E3
(M
Pa
)
573BA 6/10/03 11:24 Side 28C 573BB 6/10/03 16:51 Side 30C
591 Side 12/17/06 1C 591 Side 12/15/06 11C
591 Side 6/27/07 31C 591 Side 6/28/07 28C
591 Side 6/29/07 25C
Figure 3.52: Modulus of subgrade from FWD on
Section 573RF/591RF (center).
Figure 3.53: Modulus of subgrade from FWD on
Section 573RF/591RF (side).
0
100
200
300
400
500
04/19/01 09/01/02 01/14/04 05/28/05 10/10/06 02/22/08
Date
E3
(M
Pa
)
0
5
10
15
20
25
30
35
40
45
Pa
ve
me
nt T
em
pe
ratu
re (
C)
Station 3 to 8 Center Station 8 to 14 Center Station 3 to 8 Side
Station 8 to 14 Side Bells Temp (C)
Overl
ay
Co
nstr
uction
Co
nstr
uction
HV
S S
tart
HV
S E
nd
HV
S S
tart
HV
S E
nd
Figure 3.54: Modulus of subgrade from FWD versus time on Section 573RF/591RF.

52
3.3. Comparison between HVS Sections
Comparison of the pavement structure after Phase 1 HVS testing was discussed in the Phase 1 report (3)
and is not discussed further.
The moduli of the three pavement layers before and after Phase 2 HVS testing are summarized in
Table 3.2, and plotted in Figure 3.55 through Figure 3.57. For simplicity, subsectioning was omitted in
this discussion.
Asphalt Concrete
When considering the temperature effect before Phase 2 HVS testing, Figure 3.55 shows that the
composite asphalt concrete layers on the sections overlaid with RAC-G, AR4000-D, and MAC15-G had
comparable moduli. The modulus of Section 586RF (MB15-G) was similar to that of Sections 589RF
(45 mm MB4-G) and 590RF (90 mm MB4-G), but was lower than the moduli of other sections. After
Phase 2 HVS testing, the moduli of the RAC-G, AR4000-D, both MB4-G, and the MAC15-G overlays
had all dropped, with the reduction of the RAC-G most significant. The modulus of the MB15-G overlay
was not affected by HVS loading.
Aggregate Base
The base in the vicinity of the section overlaid with the MB15-G mix was very stiff (3,500 MPa) before
Phase 2 testing (Figure 3.56), attributed to recementation of the particles. At comparable temperatures, the
base in the vicinity of the sections overlaid with RAC-G, AR4000-D, or MAC15-G mixes was also
relatively stiff, also attributed to recementation, with an average modulus of more than 1,000 MPa before
the Phase 2 HVS test. The base in the vicinity of the two sections overlaid with the MB4-G mix had the
lowest measured aggregate base modulus. HVS loading resulted in damage to the base under all the
sections. The modulus of the base under the sections overlaid with RAC-G, AR4000-D, MB4-G (45 mm),
MB4-G (90 mm), and MAC15-G dropped to similar levels (about 250 MPa) after Phase 2 testing, while
the MB15-G section retained the highest aggregate base modulus (around 1,000 MPa).
Subgrade
Subgrade modulus was highest (about 340 MPa) in the vicinity of Section 586RF before Phase 2 testing
(Figure 3.57) and was similar (about 270 MPa) under the sections overlaid with RAC-G and MB4-G
(45 mm). Slightly lower moduli were recorded on the remainder of the sections. This is consistent with
the analysis after Phase 1 testing (3), which attributed weaker sections of the subgrade to significantly
higher moisture contents in some areas during compaction. After HVS testing the subgrade modulus was

53
approximately 50 percent lower on the sections overlaid with RAC-G, MB4-G (45 mm), and MAC15-G,
and relatively unchanged on the remainder of the sections. It is not clear whether this was attributed to
loading or to the effects of moisture.
Table 3.2: Summary of Moduli Before and After Phase 2 HVS Test
Before HVS Test After HVS Test
Layer Section Mean
(MPa)
Standard
Deviation
(MPa)
BELLS
Temp.
(°°°°C)
RSD*
Peak
(µmm)
Mean
(MPa)
Standard
Deviation
(MPa)
BELLS
Temp.
(°°°°C)
RSD*
Peak
(µmm)
AC
586RF
587RF
588RF
589RF
590RF
591RF
4,239
7,740
5,991
5,157
1,977
9,460
1,211
1,004
463
1,131
302
2,391
16.3
16.5
24.1
14.9
24.0
13.4
174
368
257
562
493
280
5,193
1,445
1,747
2,406
1,483
4,621
1,162
469
1,069
902
210
1,979
15.5
15.6
24.7
17.7
25.5
17.1
279
1,718
2,099
1,375
1,228
1,058
AB
586RF
587RF
588RF
589RF
590RF
591RF
3,746
1,894
977
760
250
1,649
654
197
109
121
18
244
16.3
16.5
24.1
14.9
24.0
13.4
Not
measured
1,057
243
263
222
199
193
294
147
255
145
31
111
15.5
15.6
24.7
17.7
25.5
17.1
Not
measured
SG
586RF
587RF
588RF
589RF
590RF
591RF
332
270
148
271
94
234
7
37
13
18
11
23
16.3
16.5
24.1
14.9
24.0
13.4
Not
measured
284
123
179
148
81
110
21
40
45
44
8
26
15.5
15.6
24.7
17.7
25.5
17.1
Not
measured
* Road Surface Deflectometer - average of RSD deflection measurements on AC only at 5 stations
586RF - MB15-G
589RF - MB4-G (45mm)
587RF - RAC-G
590RF - MB4-G (90mm)
588RF - AR4000-D
591RF - MAC15-G
The above discussion indicates considerable variation in the modulus measured over the length of the test
road. The calculated moduli also do not relate to the average of the peak deflections measured on each
section with the RSD. The subgrade, base and asphalt layers were each constructed in a single day.
Although there was some variation in the aggregate used in the base (recycled portland cement concrete)
and some variation in the thickness of the base and asphalt layers, aggregate compaction, asphalt paving,
and asphalt compaction were all carried out as a continuous process. Therefore, there should not have
been a significant variation in the modulus of the subgrade, base and underlying DGAC along the length
of the section. Anomalies and discrepancies in the measurements are instead attributed to:
• Limitations of FWD measurements on cracked surfaces (587RF and 588RF) and on uneven
surfaces (589RF)
• Limitations of the backcalculation procedure in terms of layer differentiation, temperature
correction, and seed and baseline value inputs
• Variation in the degree of recementation of the recycled aggregate particles and subgrade moisture
content along the length of the section

54
0
1000
2000
3000
4000
5000
6000
7000
8000
9000
10000
MB-15 RAC-G DGAC MB-4 (45mm)MB-4 (90mm) MAC-15
Section
Ba
ck
-ca
lcu
late
d A
C M
od
ulu
s (
MP
a)
0
5
10
15
20
25
30
Bell
s T
em
pe
ratu
re (
C)
Modulus Before HVS Testing Modulus After HVS Testing
Temperature Before HVS Testing Temperature After HVS Testing
0
500
1000
1500
2000
2500
3000
3500
4000
4500
5000
MB-15 RAC-G DGAC MB-4 (45mm)MB-4 (90mm) MAC-15
Section
Ba
ck
-calc
ula
ted
AB
Mo
du
lus (
MP
a)
0
5
10
15
20
25
30
Bell
s T
em
pe
ratu
re (
C)
Modulus Before HVS Testing Modulus After HVS Testing
Temperature Before HVS Testing Temperature After HVS Testing
Figure 3.55: Modulus of asphalt concrete before and after Phase 2
HVS testing.
Figure 3.56: Modulus of aggregate base before and after Phase 2
HVS testing.
0
50
100
150
200
250
300
350
400
450
500
MB-15 RAC-G DGAC MB-4 (45mm) MB-4 (90mm) MAC-15
Section
Back-c
alc
ula
ted
SG
Mo
du
lus (
MP
a)
0
5
10
15
20
25
30
Bells T
em
pera
ture
(C
)
Modulus Before HVS Testing Modulus After HVS Testing
Temperature Before HVS Testing Temperature After HVS Testing
Figure 3.57: Modulus of subgrade before and after Phase 2 HVS testing.
55
3.4. Correlation of Moduli of Different Layers
The modulus of the aggregate base was generally positively correlated with the moduli of the asphalt
concrete and the subgrade. Figure 3.58 through Figure 3.64 show the relationship between the asphalt
concrete, base and subgrade moduli in the trafficked area before and after HVS testing, and in the
untrafficked area. Observations from the figures show that:
• The correlation between the asphalt concrete layers and the base in the trafficked area after Phase 1
(Figure 3.58) was poor. This was attributed to the very cracked nature of the asphalt concrete
which impacts on the accuracy of FWD testing, variability in cracking between the sections, and
possibly also to partial destruction of cemented bonds between the aggregate particles (formed by
recementation of the recycled concrete particles) during HVS trafficking.
• The correlation improved in the period between tests and after the construction of the overlay. This
is attributed to the rest period from HVS loading, and to the confinement provided by the overlays.
Recementation of the aggregate particles probably also continued.
• The correlation between the asphalt concrete and base in the trafficked area was relatively good
after HVS testing. This was attributed to there being no cracking on four of the six sections, and a
systematic breakdown of the cemented bonds under trafficking on all the sections (Figure 3.59).
• The correlation in the untrafficked area was poor, particularly for those sections with a high
modulus aggregate base (Figure 3.60). This is probably due to variance in the degree of
recementation of the material, and consequent differences in confining pressure.
• The effect of the subgrade on the behavior of the base follows similar trends to that of the asphalt
concrete. The weaker subgrade areas provided less confining pressure to the base, resulting in lower
base moduli.
• No significant correlation was found between the asphalt concrete modulus and the subgrade
modulus.
3.5. Load Effect on Backcalculated Stiffness
Each FWD test consisted of three drops at each test spot beginning with the lightest load. The relationship
between the load level and the backcalculated pavement stiffnesses is shown in Figure 3.65 through
Figure 3.70 for each HVS section. The drop load level had little effect on the backcalculated pavement
stiffnesses.

56
R2 = 0.0809R2 = 0.0713
R2 = 0.0098R2 = 0.6205
R2 = 0.4405
R2 = 0.7435
R2 = 0.6869
R2 = 0.0701
R2 = 0.881
R2 = 0.4568
0
500
1000
1500
2000
2500
3000
3500
4000
4500
5000
0 2000 4000 6000 8000 10000 12000
Asphalt Concrete Modulus, MPa
Ag
gre
gate
Base
Mo
du
lus,
MP
a568 569 571 572 573 586 587 588 589 590 591
R2 = 0.3563
R2 = 0.3406
R2 = 0.4482R
2 = 0.0156
R2 = 0.7276
R2 = 0.4738
R2 = 0.4043
R2 = 0.6868
R2 = 0.854
R2 = 0.7427
R2 = 0.0927
0
500
1000
1500
2000
2500
3000
0 2000 4000 6000 8000 10000 12000
Asphalt Concrete Modulus, MPa
Aggre
gate
Base M
odulu
s, M
Pa
567 568 569 571 572 573
586 587 588 589 590 591
Figure 3.58: Variation of AC and base and modulus in the
trafficked area before HVS testing.
Figure 3.59: Variation of AC and base modulus in the trafficked
area after HVS testing.
R2 = 0.1682
R2 = 0.1065
R2 = 0.5421R
2 = 0.6245
R2 = 0.896
R2 = 0.1594
R2 = 0.7424
R2 = 0.1865
R2 = 0.0156R
2 = 0.1385
R2 = 0.8406
R2 = 0.0058
0
500
1000
1500
2000
2500
3000
3500
4000
0 2000 4000 6000 8000 10000 12000 14000 16000
Asphalt Concrete Modulus, MPa
Aggre
gate
Base M
odulu
s, M
Pa
567 568 569 571 572 573
586 587 588 589 590 591
Figure 3.60: Variation of AC and base modulus in the untrafficked area.

57
R2 = 1
R2 = 0.9642
R2 = 0.8612
R2 = 0.2677
R2 = 0.8697
R2 = 0.0202
R2 = 0.4501
R2 = 0.2072
R2 = 0.8522
0
500
1000
1500
2000
2500
3000
3500
4000
4500
5000
0 100 200 300 400 500
Subgrade Modulus, MPa
Ag
gre
gate
Base
Mo
du
lus,
MP
a
568 569 571 572 573 586
587 588 589 590 591
R2 = 0.7487
R2 = 0.8728
R2 = 0.4134
R2 = 0.5845
R2 = 0.6832
R2 = 0.8704
R2 = 0.8019 R
2 = 0.001
R2 = 0.9538
R2 = 0.04420
500
1000
1500
2000
2500
3000
3500
4000
4500
5000
0 50 100 150 200 250 300 350 400 450 500
Subgrade Modulus, MPa
Aggre
gate
Base M
odulu
s, M
Pa
567 568 569 571 572 573
586 587 588 589 590 591
Figure 3.61: Variation of base and subgrade modulus in the
trafficked area before HVS test.
Figure 3.62: Variation of base and subgrade modulus in the
trafficked area after HVS test.
R2 = 0.0992
R2 = 0.8492
R2 = 0.6842 R
2 = 0.3542
R2 = 0.8723
R2 = 0.0112
R2 = 0.0075
R2 = 0.4016
R2 = 0.1715
R2 = 0.3139
R2 = 0.6526
R2 = 0.7442
0
500
1000
1500
2000
2500
3000
3500
4000
4500
5000
0 50 100 150 200 250 300 350 400 450 500
Subgrade Modulus, MPa
Aggre
gate
Base M
odulu
s, M
Pa
567 568 569 571 572 573
586 587 588 589 590 591
0
50
100
150
200
250
300
350
400
450
500
0 2000 4000 6000 8000 10000 12000 14000 16000
Asphalt Concrete Modulus, MPa
Subgra
de M
odu
lus, M
Pa
567 568 569 571 572 573
586 587 588 589 590 591
Figure 3.63: Variation of base and subgrade modulus in the
untrafficked area.
Figure 3.64: Variation of AC modulus with subgrade modulus.

58
567
1
10
100
1000
10000
1 2 3Drop Number
Ba
ck-C
alc
ula
ted M
od
ulu
s (
MP
a)
E1
E2
E3
586
1
10
100
1000
10000
1 2 3Drop Number
Ba
ck-C
alc
ula
ted M
od
ulu
s (
MP
a)
E1
E2
E3
Figure 3.65: Average backcalculated modulus vs drop number on Section 567RF/586RF (MB15-G).
568
1
10
100
1000
10000
1 2 3Drop Number
Ba
ck-C
alc
ula
ted M
od
ulu
s (
MP
a)
E1
E2
E3
587
1
10
100
1000
10000
1 2 3Drop Number
Ba
ck-C
alc
ula
ted M
od
ulu
s (
MP
a)
E1
E2
E3
Figure 3.66: Average backcalculated modulus vs drop number on Section 568RF/587RF (RAC-G).
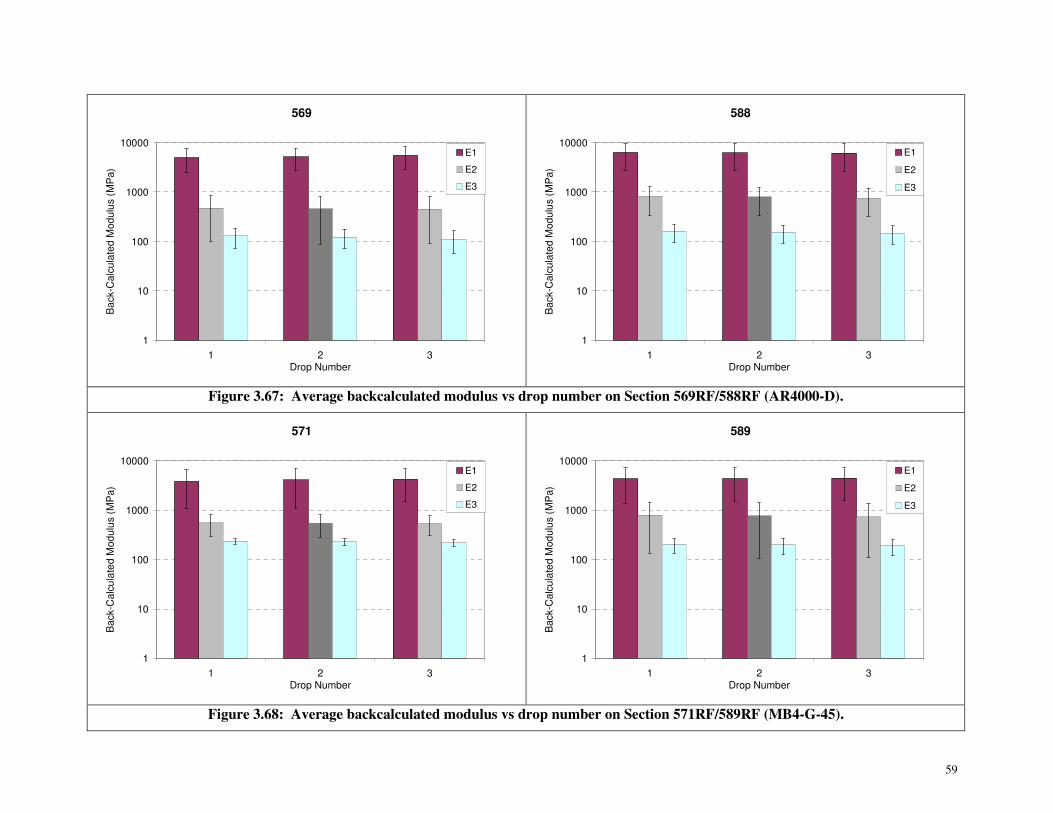
59
569
1
10
100
1000
10000
1 2 3Drop Number
Ba
ck-C
alc
ula
ted M
od
ulu
s (
MP
a)
E1
E2
E3
588
1
10
100
1000
10000
1 2 3Drop Number
Ba
ck-C
alc
ula
ted M
od
ulu
s (
MP
a)
E1
E2
E3
Figure 3.67: Average backcalculated modulus vs drop number on Section 569RF/588RF (AR4000-D).
571
1
10
100
1000
10000
1 2 3Drop Number
Ba
ck-C
alc
ula
ted M
od
ulu
s (
MP
a)
E1
E2
E3
589
1
10
100
1000
10000
1 2 3Drop Number
Ba
ck-C
alc
ula
ted M
od
ulu
s (
MP
a)
E1
E2
E3
Figure 3.68: Average backcalculated modulus vs drop number on Section 571RF/589RF (MB4-G-45).
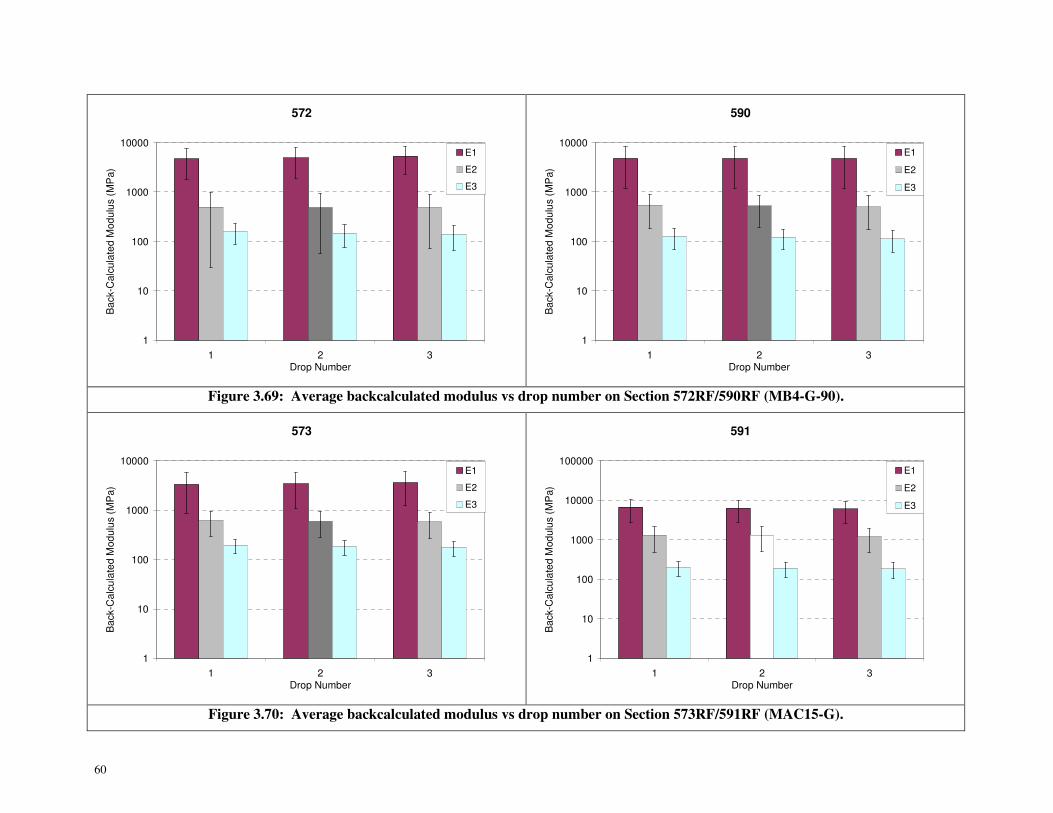
60
572
1
10
100
1000
10000
1 2 3Drop Number
Ba
ck-C
alc
ula
ted M
od
ulu
s (
MP
a)
E1
E2
E3
590
1
10
100
1000
10000
1 2 3Drop Number
Ba
ck-C
alc
ula
ted M
od
ulu
s (
MP
a)
E1
E2
E3
Figure 3.69: Average backcalculated modulus vs drop number on Section 572RF/590RF (MB4-G-90).
573
1
10
100
1000
10000
1 2 3Drop Number
Ba
ck-C
alc
ula
ted M
od
ulu
s (
MP
a)
E1
E2
E3
591
1
10
100
1000
10000
100000
1 2 3Drop Number
Ba
ck-C
alc
ula
ted M
od
ulu
s (
MP
a)
E1
E2
E3
Figure 3.70: Average backcalculated modulus vs drop number on Section 573RF/591RF (MAC15-G).

61
4. AGING, SEASONAL EFFECTS, AND STIFFNESS RECOVERY
4.1. Temperature Adjustment
Temperature had a significant effect on the backcalculated modulus of the asphalt concrete, which in turn
affected the aggregate base modulus. In order to analyze the aging and seasonal effects on material
moduli, the temperature effect has to be removed.
The M-E PDG master curve formula (Equation 4.1) was used to develop the modulus master curve for
each asphalt mix:
( ) ( )( )( )
( )( ) ( )KTVTSAcPoisev
v
vltt
t
EE
EE
aT
ref
r
r
°×+=
×=
×++
+=
logloglog
,
,logexp1
log
loglogmin
max
minγβ
(4.1)
Where: E is the modulus at a specific loading time tr and temperature T
Emin is the minimum modulus
Emax is the maximum modulus
tr is reduced time
lt is loading time (for creep test loading)
v is viscosity of the binder at the actual temperature
vref is viscosity of the binder at the reference temperature
T is the temperature in degrees Kelvin
β, γ, aT, A and VTS are constants, and log is to base 10.
The binder parameters A and VTS do not significantly affect the fitted curve. Good fit-to-measured
moduli can be obtained with parameters from a number of different binders. Values of A = 9.6307 and
VTS = -3.5047.
Other curve parameters were determined by minimizing the Root Mean Square (RMS) difference between
the measured values and the values calculated using Solver in Excel.

62
4.1.1 Original (Underlying) Sections
The backcalcuated moduli of the underlying DGAC layer (all locations) were used to develop the master
curve of the intact DGAC layer. Only the FWD data measured in the first 12 months after original
construction were used in order to minimize the effect of aging.
The estimated master curve is shown in Figure 4.1. The following parameters were used:
Emin = 100 MPa,
Emax = 17909 MPa,
β = 0.136, γ = 0.439, and aT = 1.9406.
The master curve developed from laboratory flexural beam frequency sweep testing is also shown in the
figure for comparison. The laboratory determined modulus was generally higher (7,300 MPa at 20 C) than
the modulus backcalculated from the test road (3,077 MPa at 20 C). The difference was attributed to
uncertainties associated with backcalculating the modulus of thin layers as well as differences in other
factors such as test configuration, air-void content, and strain level. This is discussed in more detail in
Section 4.1.2.
100
1000
10000
100000
0 10 20 30 40 50 60 70 80
Temperature, C
Modulu
s,
MP
a
Frequency Sweep
Alternative from FWD Test
Center Line
Sections
Figure 4.1: Master curves of DGAC estimated from laboratory and FWD data.
4.1.2 Overlay Sections
For analysis purposes, the underlying DGAC and the overlay were considered as one composite layer,
since the individual layers were too thin to model separately. A master curve was developed for each
intact composite asphalt concrete layer from FWD data. Since the dataset from the untrafficked areas of

63
each test section was limited, the FWD data measured in the trafficked areas of the test sections before
Phase 2 testing were also used to develop the master curves. Although the underlying DGAC in the
trafficked areas was damaged during Phase 1 testing, the modulus of the composite asphalt concrete layer
did not appear to be significantly affected, as discussed in Chapter 3, and the data was therefore
considered appropriate for master curve development.
Master curves were estimated by minimizing the root mean square (RMS) of the differences between
observed and predicted values. Both absolute and relative differences were considered for the analysis.
Use of the absolute difference applies less weight to the moduli measured at high temperatures. The
estimated master curves for all test sections are shown in Figure 4.2 and Figure 4.3 for the two types of
differences, respectively, with the corresponding parameters listed in Tables 4.1 and 4.2. The minimum
modulus for all materials was fixed at 100 MPa during estimation.
The figures show that:
• The master curves, based on absolute difference, of Sections 586RF (MB15-G+DGAC) and 591RF
(MAC15-G+DGAC) were similar (Figure 4.2).
• The composite asphalt concrete layers on Sections 586RF, 587RF, 590RF, and 591RF were more
temperature sensitive than those on Sections 588RF and 589RF.
• The master curves, based on relative difference, of Sections 586RF (MB15-G+DGAC), 587RF
(RAC-G+DGAC), and 591RF (MAC15-G+DGAC) were similar to each other (Figure 4.3).
The two asphalt concrete layers on Section 588RF consisted of similar AR4000-D mixes. A comparison
of the master curve developed from the composite layer with those developed from the original layer and
the laboratory test reveals that the former is similar to that developed from the laboratory frequency sweep
test data (Figure 4.4). The significantly lower modulus master curve from the original layer illustrates the
uncertainty associated with backcalculation of thin layers.
Table 4.1: Parameters of Master Curves of Intact Composite AC Layers:Absolute Difference
Section Overlay β γ aT A VTS Emin
(MPa)
Emax
(MPa)
Underlying - 0.1317 0.4375 1.9498 9.6307 -3.5047 100 17,887
586RF/567RF MB15-G 0.3236 0.7560 1.7491 9.6307 -3.5047 100 15,000
587RF/568RF RAC-G -0.1370 0.8633 3.2237 9.6307 -3.5047 100 7,744
588RF/569RF AR4000-D -0.7635 0.5971 1.5310 9.6307 -3.5047 100 13,275
589RF/571RF 45 mm MB4-G -0.3311 0.3814 1.7319 9.6307 -3.5047 100 15,000
590RF/572RF 90 mm MB4-G -0.7619 0.4866 2.7905 9.6307 -3.5047 100 10,846
591RF/573RF MAC15-G -0.1620 0.4725 3.0239 9.6307 -3.5047 100 15,061
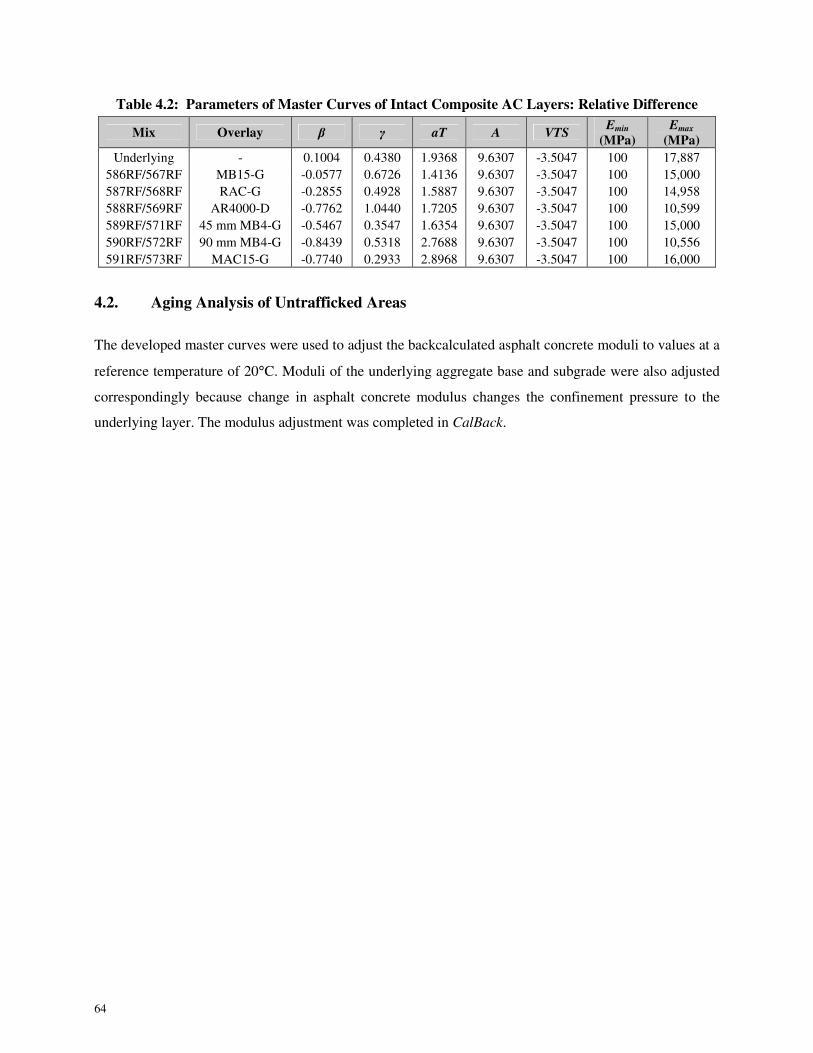
64
Table 4.2: Parameters of Master Curves of Intact Composite AC Layers: Relative Difference
Mix Overlay β γ aT A VTS Emin
(MPa)
Emax
(MPa)
Underlying - 0.1004 0.4380 1.9368 9.6307 -3.5047 100 17,887
586RF/567RF MB15-G -0.0577 0.6726 1.4136 9.6307 -3.5047 100 15,000
587RF/568RF RAC-G -0.2855 0.4928 1.5887 9.6307 -3.5047 100 14,958
588RF/569RF AR4000-D -0.7762 1.0440 1.7205 9.6307 -3.5047 100 10,599
589RF/571RF 45 mm MB4-G -0.5467 0.3547 1.6354 9.6307 -3.5047 100 15,000
590RF/572RF 90 mm MB4-G -0.8439 0.5318 2.7688 9.6307 -3.5047 100 10,556
591RF/573RF MAC15-G -0.7740 0.2933 2.8968 9.6307 -3.5047 100 16,000
4.2. Aging Analysis of Untrafficked Areas
The developed master curves were used to adjust the backcalculated asphalt concrete moduli to values at a
reference temperature of 20°C. Moduli of the underlying aggregate base and subgrade were also adjusted
correspondingly because change in asphalt concrete modulus changes the confinement pressure to the
underlying layer. The modulus adjustment was completed in CalBack.

65
100
1000
10000
100000
0 10 20 30 40 50 60 70 80
Temperature, C
Modulu
s, M
Pa
MB-15+DGAC
586 Master Curve from FWD Data
RAC-G+DGAC
587 Master Curve from FWD Data
DGAC+DGAC
588 Master Curve from FWD Data
MB4(45 mm)+DGAC
589 Master Curve from FWD Data
MB4 (90 mm) +DGAC
590 Master Curve from FWD Data
MAC-15+DGAC
591 Master Curve from FWD Data
100
1000
10000
100000
0 10 20 30 40 50 60 70 80
Temperature, C
Modulu
s, M
Pa
MB-15+DGAC
586 Master Curve from FWD Data
RAC-G+DGAC
587 Master Curve from FWD DataDGAC+DGAC
588 Master Curve from FWD Data
MB4(45 mm)+DGAC
589 Master Curve from FWD Data
MB4 (90 mm) +DGAC
590 Master Curve from FWD Data
MAC-15+DGAC591 Master Curve from FWD Data
Figure 4.2: Master curves of AC layers estimated from FWD data
based on absolute difference.
Figure 4.3: Master curves of AC layers estimated from FWD data
based on relative difference.
100
1000
10000
100000
0 10 20 30 40 50 60 70 80
Temperature, C
Mo
du
lus,
MP
a
Frequency Sweep
DGAC Master Curve from FWD Data on Original Sections
DGAC Master Curve from FWD Data on Section 588
Center Line
Sections
DGAC+DGAC
Figure 4.4: Master curves of DGAC estimated from laboratory and different FWD data.

66
4.2.1 Original (Underlying) Sections
The adjusted moduli of the intact original section layers are presented in Figure 4.5. A logarithm function
was used to fit the time series data. The estimated parameters shown in the figure indicate that an aging
effect was evident. The moduli of the asphalt concrete, aggregate base, and subgrade generally increased
with time. The low R-square values, however, indicate that age alone cannot sufficiently describe the
variation in observed data. Changes in material properties thus also need to be considered, specifically
those in the aggregate base. Figure 3.56 shows non-uniformity in this layer. To minimize this variation,
the age effect on the base was analyzed for each section (Figure 4.6). Age effect on the base modulus was
most significant on Section 567RF, followed by Section 568RF. The goodness-of-fit (R-square) of the
corresponding logarithm functions was considered acceptable.
y = 311.95Ln(x) + 1562.3
R2 = 0.124
y = 215.09Ln(x) - 407.72
R2 = 0.2153
y = 28.445Ln(x) + 28.971
R2 = 0.2606
10
100
1000
10000
0 100 200 300 400 500 600 700
Age, days
Modu
lus a
t 2
0C
, M
Pa
DGAC AB SG
Figure 4.5: Temperature adjusted moduli of original sections versus age.

67
567
y = 406.94Ln(x) - 875.03
R2 = 0.758
568
y = 307.65Ln(x) - 607.03
R2 = 0.5857
569
y = 213.02Ln(x) - 447.97
R2 = 0.3208
571
y = 241.6Ln(x) - 360.06
R2 = 0.3635
572
y = 236.57Ln(x) - 352.87
R2 = 0.3348
573
y = 227.34Ln(x) - 474.18
R2 = 0.4264
0
500
1000
1500
2000
2500
0 100 200 300 400 500 600 700
Age, days
AB
Mo
du
lus,
MP
a
567
568
569
571
572
573
Log. (567)
Log. (568)
Log. (569)
Log. (571)
Log. (572)
Log. (573)
Figure 4.6: Temperature adjusted modulus of aggregate base for each section.
Changes in the subgrade modulus over time were mostly attributed to changes in confinement from the
base (and asphalt concrete) layers and the seasonal moisture content variation. Although the material was
consistent, some non-linearity may have also existed. The effects of this were treated as a function of the
load level in the simulations with CalME, in order to separate them from the confinement effects.
The modulus of the subgrade was calculated from:
31
1
3
×=
×+=
∑−
=
n
i
ii EhS
SBAE
(4.2)
Where: A and B are parameters
Ei and hi are the modulus and thickness of layer i above subgrade.
Figure 4.7 presents the estimated function for each section.

68
567
y = 0.699x - 49.694
R2 = 0.818
568
y = 0.3782x + 23.554
R2 = 0.2744
569
y = 0.6643x + 9.8453
R2 = 0.3124
571
y = 0.7014x - 60.112
R2 = 0.5863
572
y = 0.419x + 15.031
R2 = 0.2967
573
y = 0.1464x + 56.416
R2 = 0.0627
0
20
40
60
80
100
120
140
160
180
200
0 50 100 150 200 250 300 350
S, N*m
SG
Mo
du
lus,
MP
a
567
568
569
571
572
573
567
568
569
571
572
573
Figure 4.7: Modulus of the subgrade as a function of the stiffness of the pavement layers.
4.2.2 Overlay Sections
The adjusted moduli of the three layers in the overlay sections are presented in Figure 4.8 through
Figure 4.13. The age was determined from the time of overlay construction (June 14, 2003). A logarithm
function was used to fit the time series data. Aging of the asphalt concrete was apparent in all sections
except Section 591RF (MAC15-G), and the logarithm function appears to fit the data well. Base modulus
increased with time on Sections 586RF and 588RF, but did not change significantly on the other sections.
This is attributed to differences in the degree of recementation and seasonal changes in moisture content.
The correlation between subgrade modulus and age was considered poor.
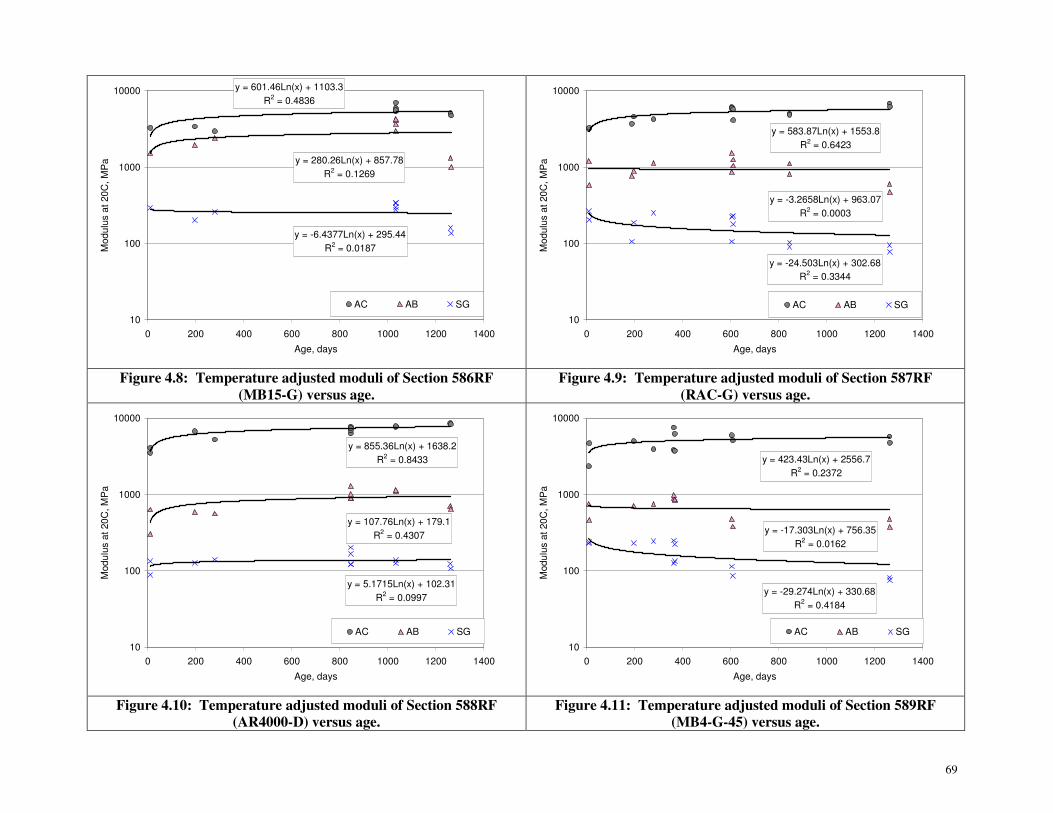
69
y = 601.46Ln(x) + 1103.3
R2 = 0.4836
y = 280.26Ln(x) + 857.78
R2 = 0.1269
y = -6.4377Ln(x) + 295.44
R2 = 0.0187
10
100
1000
10000
0 200 400 600 800 1000 1200 1400
Age, days
Mod
ulu
s a
t 20
C,
MP
a
AC AB SG
y = 583.87Ln(x) + 1553.8
R2 = 0.6423
y = -3.2658Ln(x) + 963.07
R2 = 0.0003
y = -24.503Ln(x) + 302.68
R2 = 0.3344
10
100
1000
10000
0 200 400 600 800 1000 1200 1400
Age, days
Mod
ulu
s a
t 20
C,
MP
a
AC AB SG
Figure 4.8: Temperature adjusted moduli of Section 586RF
(MB15-G) versus age.
Figure 4.9: Temperature adjusted moduli of Section 587RF
(RAC-G) versus age.
y = 855.36Ln(x) + 1638.2
R2 = 0.8433
y = 107.76Ln(x) + 179.1
R2 = 0.4307
y = 5.1715Ln(x) + 102.31
R2 = 0.0997
10
100
1000
10000
0 200 400 600 800 1000 1200 1400
Age, days
Mod
ulu
s a
t 20
C,
MP
a
AC AB SG
y = 423.43Ln(x) + 2556.7
R2 = 0.2372
y = -17.303Ln(x) + 756.35
R2 = 0.0162
y = -29.274Ln(x) + 330.68
R2 = 0.4184
10
100
1000
10000
0 200 400 600 800 1000 1200 1400
Age, days
Mod
ulu
s a
t 20
C,
MP
a
AC AB SG
Figure 4.10: Temperature adjusted moduli of Section 588RF
(AR4000-D) versus age.
Figure 4.11: Temperature adjusted moduli of Section 589RF
(MB4-G-45) versus age.

70
y = 496.66Ln(x) + 2807.2
R2 = 0.6313
y = -129.81Ln(x) + 1311.7
R2 = 0.3161
y = -13.752Ln(x) + 172.8
R2 = 0.5964
10
100
1000
10000
0 200 400 600 800 1000 1200 1400
Age, days
Mod
ulu
s a
t 20
C,
MP
a
AC AB SG
y = -53.539Ln(x) + 4282
R2 = 0.0181
y = -5.0456Ln(x) + 896.44
R2 = 0.0003
y = -5.8013Ln(x) + 182.12
R2 = 0.0275
10
100
1000
10000
0 200 400 600 800 1000 1200 1400
Age, days
Mod
ulu
s a
t 20
C,
MP
a
AC AB SG
Figure 4.12: Temperature adjusted moduli of Section 590RF
(MB4-G-90) versus age.
Figure 4.13: Temperature adjusted moduli of Section 591RF
(MAC15-G) versus age.

71
4.3. Seasonal Effects on Untrafficked Areas
In-service pavements are affected by seasonal variations of several important factors, including traffic
volume and load, temperature, precipitation, freeze-thaw cycles, and other potential environmental
variables. In this experiment, traffic load was controlled and was not considered in the analysis of seasonal
effects. Temperature effect was adjusted from the master curves, and there were no freeze-thaw cycles.
The potential seasonal effects, therefore, were mainly attributed to changes in moisture content in the
pavement layers resulting from precipitation and underground water table.
The water table fluctuates between 3.0 and 5.0 m below the surface of the pavement (3). Figure 4.14 and
Figure 4.15 show the monthly precipitation and moisture content in the aggregate base and subgrade for
the duration of the study. Water content is shown as a relative number. After June 2003 the base moisture
content was not measured. The peak monthly precipitation occurred in December through February, with
little rain between May and September. Moisture content in the base fluctuated with precipitation, but with
rates of moisture content decrease lower than rates of moisture content increase. The subgrade moisture
content was lower in July through October (dry season), and remained relatively constant during other
months. Moisture content increases in the subgrade closely followed increases in monthly precipitation,
but the decrease of moisture content in the subgrade was significantly slower than the corresponding
decrease in monthly precipitation. This reflects the slow drainage rate of the subgrade.
50
60
70
80
90
100
110
120
Au
g-0
1
Se
p-0
1
Oct-
01
No
v-0
1
De
c-0
1
Ja
n-0
2
Fe
b-0
2
Mar-
02
Ap
r-0
2
Ma
y-0
2
Ju
n-0
2
Jul-
02
Au
g-0
2
Se
p-0
2
Oct-
02
No
v-0
2
De
c-0
2
Ja
n-0
3
Fe
b-0
3
Mar-
03
Ap
r-0
3
Ma
y-0
3
Ju
n-0
3
Date
Re
lati
ve
Wa
ter
Co
nte
nt
(%)
0
5
10
15
20
25
30
35
Pre
cip
itatio
n, c
m
AB1
AB5
SG2200
SG2B
SG6B
Precipitation
Figure 4.14: Time variation of moisture content with precipitation before June 2003.

72
0
10
20
30
40
50
60
70
80
90
10/0
2
12/0
2
2/0
3
4/0
3
6/0
3
8/0
3
10/0
3
12/0
3
2/0
4
4/0
4
6/0
4
8/0
4
10/0
4
12/0
4
2/0
5
4/0
5
6/0
5
8/0
5
10/0
5
12/0
5
2/0
6
4/0
6
6/0
6
8/0
6
10/0
6
12/0
6
2/0
7
4/0
7
6/0
7
Date
Rela
tive
Wate
r C
on
tent,
%
0
5
10
15
20
25
30
Pre
cip
itation,
cm
Average of VWC_SG152 Average of VWC_SG76 Monthly Rainfall (cm)
Figure 4.15: Time variation of moisture content with precipitation after June 2003.
4.3.1 Original (Underlying) Sections
The residual data after subtracting the aging functions fitted in Section 4.2 from the temperature adjusted
moduli were used to study seasonal effects. The residual moduli of the three layers in the original sections
are presented in Figure 4.16. The residual asphalt concrete modulus generally appeared higher in July
through September (dry season), and lower in October through January (wet season), however, no
significant seasonal patterns in the residual moduli of the three pavement layers were observed.
4.3.2 Overlay Sections
The residual moduli of the three layers in the overlay sections, after subtracting the aging functions from
corresponding temperature adjusted moduli are shown in Figure 4.17 through Figure 4.22. The detection
of any seasonal effects is difficult due to the scatter and limited amount of data points in each plot.

73
-20
00
-15
00
-10
00
-500 0
500
10
00
15
00
Aug-01
Sep-01
Nov-01
Dec-01
Jan-02
Mar-02
Apr-02
May-02
Jul-02
Aug-02
Sep-02
Oct-02
Dec-02
Jan-03
Feb-03
Apr-03
May-03
Jun-03
Aug-03
Da
te
Residual Modulus, MPaA
CA
BS
G
-200
0
-100
0 0
100
0
200
0
300
0
400
0
500
0
600
0
700
0
Feb-03
Apr-03
Jun-03
Aug-03
Oct-03
Dec-03
Feb-04
Apr-04
Jun-04
Aug-04
Oct-04
Dec-04
Feb-05
Apr-05
Jun-05
Aug-05
Oct-05
Dec-05
Feb-06
Apr-06
Jun-06
Aug-06
Oct-06
Dec-06
Feb-07
Apr-07
Da
te
Residual Modulus at 20C, MPa
AC
AB
SG
Fig
ure 4
.16: T
ime v
aria
tion
of resid
ua
l mod
uli o
f orig
inal sectio
ns.
Fig
ure 4
.17: T
ime v
aria
tion
of resid
ua
l mo
du
li of S
ection
58
6R
F
(MB
15-G
).
-150
0
-100
0
-50
0 0
50
0
100
0
150
0
200
0
Feb-03
Apr-03
Jun-03
Aug-03
Oct-03
Dec-03
Feb-04
Apr-04
Jun-04
Aug-04
Oct-04
Dec-04
Feb-05
Apr-05
Jun-05
Aug-05
Oct-05
Dec-05
Feb-06
Apr-06
Jun-06
Aug-06
Oct-06
Dec-06
Feb-07
Apr-07
Da
te
Residual Modulus at 20C, MPa
AC
AB
SG
-150
0
-100
0
-50
0 0
50
0
100
0
150
0
200
0
Feb-03
Apr-03
Jun-03
Aug-03
Oct-03
Dec-03
Feb-04
Apr-04
Jun-04
Aug-04
Oct-04
Dec-04
Feb-05
Apr-05
Jun-05
Aug-05
Oct-05
Dec-05
Feb-06
Apr-06
Jun-06
Aug-06
Oct-06
Dec-06
Feb-07
Apr-07
Da
te
Residual Modulus at 20C, MPa
AC
AB
SG
Fig
ure 4
.18: T
ime v
aria
tion
of resid
ual m
od
uli o
f Sectio
n 5
87R
F
(RA
C-G
).
Fig
ure 4
.19: T
ime v
aria
tion
of resid
ua
l mo
du
li of S
ection
58
8R
F
(AR
40
00
-D).

74
-200
0
-150
0
-100
0
-50
0 0
50
0
100
0
150
0
200
0
Feb-03
Apr-03
Jun-03
Aug-03
Oct-03
Dec-03
Feb-04
Apr-04
Jun-04
Aug-04
Oct-04
Dec-04
Feb-05
Apr-05
Jun-05
Aug-05
Oct-05
Dec-05
Feb-06
Apr-06
Jun-06
Aug-06
Oct-06
Dec-06
Feb-07
Apr-07
Da
te
Residual Modulus at 20C, MPaA
CA
BS
G
-100
0
-50
0 0
50
0
100
0
150
0
200
0
Feb-03
Apr-03
Jun-03
Aug-03
Oct-03
Dec-03
Feb-04
Apr-04
Jun-04
Aug-04
Oct-04
Dec-04
Feb-05
Apr-05
Jun-05
Aug-05
Oct-05
Dec-05
Feb-06
Apr-06
Jun-06
Aug-06
Oct-06
Dec-06
Feb-07
Apr-07
Da
te
Residual Modulus at 20C, MPa
AC
AB
SG
Fig
ure 4
.20: T
ime v
aria
tion
of resid
ual m
od
uli o
f Sectio
n 5
89R
F
(MB
4-G
-45
).
Fig
ure 4
.21: T
ime v
aria
tion
of resid
ua
l mo
du
li of S
ection
59
0R
F
(MB
4-G
-90
).
-200
0
-150
0
-100
0
-50
0 0
50
0
100
0
150
0
200
0
Feb-03
Apr-03
Jun-03
Aug-03
Oct-03
Dec-03
Feb-04
Apr-04
Jun-04
Aug-04
Oct-04
Dec-04
Feb-05
Apr-05
Jun-05
Aug-05
Oct-05
Dec-05
Feb-06
Apr-06
Jun-06
Aug-06
Oct-06
Dec-06
Feb-07
Apr-07
Da
te
Residual Modulus at 20C, MPa
AC
AB
SG
Fig
ure 4
.22: T
ime v
aria
tion
of resid
ual m
od
uli o
f Sectio
n 5
91R
F (M
AC
15-G
).

75
4.4. Stiffness Recovery after HVS testing
The modulus plots in Section 3.2 show that the modulus of the asphalt concrete tended to recover with
time after HVS testing. These moduli can be adjusted to values at a reference temperature to better detect
this trend using the master curves developed in Section 4.1. However, these curves are only applicable for
undamaged mixes and a different master curve, modeled by the following equation (Equation 4.3), was
used for fatigue-damaged asphalt mixes.
( ) ( )( )( )
rt
EE
EElogexp1
)1(log
loglogmin
max
min×++
−×
+=γβ
ω
(4.3)
Where: ω is a damage parameter and the remaining parameters are the same as those defined in
Equation 4.1.
Shortly after each HVS test, FWD measurements were taken at two different temperatures on the same
day on each section. These data were used to develop the master curves of damaged mixes. Table 4.3
presents the estimated damage parameter (ω) for each composite mix. Higher values of ω represent more
fatigue damage. The section overlaid with the MB15-G mix had minimal fatigue damage in the asphalt
concrete mix, while the section overlaid with the RAC-G mix had the most fatigue damage.
Table 4.3: Summary of Parameters of Master Curves of Damaged Composite AC Layers
Section Mix ω Emax
(MPa)
586RF
587RF
588RF
589RF
590RF
591RF
MB15-G + DGAC
RAC-G +DGAC
AR4000-D + DGAC
MB4-G (45 mm) + DGAC
MB4-G (90 mm) + DGAC
MAC15-G + DGAC
0.006
0.337
0.275
0.246
0.205
NA
14,664
2,762
3,469
4,368
4,159
NA
Calback was re-run with the inputs of the damaged master curves, to adjust the backcalculated modui to
the reference temperature (20°C). The results are presented in Figure 4.23 through Figure 4.26. The
results are grouped into subsections to account for the within-section variation.
The modulus of the fatigue-damaged asphalt concrete generally recovered to some extent after between
one and three years, depending on the section. There was little change in the moduli of the base and
subgrade. Section 588RF (AR4000-D overlay) showed distinctly different modulus recovery for the two
subsections. A lower modulus was measured immediately after the HVS test on Subsection A compared to
Subsection B, and it recovered very little modulus over time. The first-level analysis report for this
section (9) revealed that this subsection had severe interconnected cracking after both Phase 1 and Phase 2
HVS tests, while Subsection B had very few cracks. The other overlay sections had predominantly
76
transverse cracks that were far less interconnected after Phase 2 testing. Modulus recovery therefore
appeared to only occur in asphalt concrete with few interconnected cracks.
The moduli of the asphalt concrete were normalized for each section by the corresponding values right
after HVS testing to compare the recovery rate of the different mixes (Figure 4.27). The recovery rates of
the sections overlaid with RAC-G and MB4-G (45 mm) were similar, while that of the MB4-G (90 mm)
overlay section was slightly higher. If the severely cracked subsection is excluded, the AR4000-D overlay
section had the highest recovery rate.

77
y = 0.9991x + 832.38
R2 = 0.863
y = 0.3125x + 1775.3
R2 = 0.2184
0
500
1000
1500
2000
2500
0 50 100 150 200 250 300 350 400 450
Age After HVS Test, days
Mo
dulu
s a
t 20
C,
MP
aAC (1-4) AB (1-4) SG (1-4)
AC (4-7) AB (4-7) SG (4-7)
y = 11.364x + 2126.7
R2 = 0.8973
y = 0.772x + 1351.7
R2 = 0.3387
0
1000
2000
3000
4000
5000
6000
0 50 100 150 200 250 300
Age After HVS Test, days
Mo
du
lus a
t 2
0C
, M
Pa
AC (1-4) AB (1-4) SG (1-4)
AC (4-7) AB (4-7) SG (4-7)
Figure 4.23: Moduli versus age after HVS testing for
Section 587RF (RAG-G).
Figure 4.24: Moduli versus age after HVS testing for
Section 588RF (AR4000-D).
y = 1.242x + 1262.4
R2 = 0.8515
y = 1.5485x + 2500.1
R2 = 0.708
0
500
1000
1500
2000
2500
3000
3500
4000
0 100 200 300 400 500 600 700 800
Age After HVS Test, days
Mo
du
lus a
t 2
0C
, M
Pa
AC (1-4) AB (1-4) SG (1-4)
AC (4-7) AB (4-7) SG (4-7)
y = 3.4232x + 1980.6
R2 = 0.9852
y = 2.9664x + 2420.8
R2 = 0.9737
0
1000
2000
3000
4000
5000
6000
0 100 200 300 400 500 600 700 800 900 1000
Age After HVS Test, days
Mo
du
lus a
t 2
0C
, M
Pa
AC (1-4) AB (1-4) SG (1-4)
AC (4-7) AB (4-7) SG (4-7)
Figure 4.25: Moduli versus age after HVS testing for
Section 589RF (MB4-G-45).
Figure 4.26: Moduli versus age after HVS testing for
Section 590RF (MB4-G-90).

78
0
0.5
1
1.5
2
2.5
3
0 100 200 300 400 500 600 700 800 900 1000
Age After HVS Test, days
AC
Mo
dulu
s I
ncre
ase
Ra
tio
587 (RAC-G) 588 (DGAC)
589 (MB-4, 45 mm) 590 (MB-4, 90 mm)
Figure 4.27: Normalized moduli versus age after HVS test.

79
5. COMPARISON OF BACKCALUCLATED AND LABORATORY
RESULTS
This chapter compares the moduli backcalculated from FWD data to those measured in the laboratory, and
to those backcalculated from Road Surface Deflectometer (RSD) data.
5.1. Comparison of Predicted and Measured Composite Asphalt Layer Stiffness
In backcalculation, it is generally not recommended to backcalculate the modulus of an asphalt layer if the
thickness is less than half the radius of the loading plate (75 mm in this study). Because the thicknesses of
the overlays were generally less than the minimum allowable thickness for reliable backcalculation, both
the overlay and the underlying DGAC layer were treated as one composite layer in all FWD deflection
analyses. However, in the laboratory the modulus of each mix was measured separately from flexural
beam specimens. To compare the moduli backcalculated from field data to those measured in the
laboratory, the moduli of individual mixes need to be converted into composite moduli. The Odemark’s
method was used for this conversion (Equation 5.1). The overlay was first converted into an equivalent
layer with a different thickness (he) and the same modulus as the underlying layer. This equivalent layer,
along with the underlying layer, was then converted into a composite layer with the thickness equal to the
sum of the overlay thickness (h1) and the existing layer thickness (h2).
23
21
3
2
23
2111
)(E
hh
hfE
hEEhfh
e
c
e
+=
+=
(5.1)
Where: Ec is the calculated composite modulus
E1 is the overlay modulus obtained from a frequency sweep test
E2 is the modulus of existing layer obtained from the frequency sweep test
f1 and f2 are correction factors (f1=0.9, f2=1.0).
The backcalculated composite moduli of each test section are shown in Figure 4.2.
Figure 5.1 through Figure 5.6 show the master curves, estimated from laboratory and FWD tests, of the
composite asphalt concrete layer for each test section. The data points (composite asphalt concrete moduli
backcalculated from FWD measurements) used to fit the master curve from the FWD test are also shown.
The following was observed:

80
• The data points generally fall around the master curve obtained from the laboratory frequency
sweep test.
• The data from Section 587RF (RAC-G) fall slightly below the laboratory master curve at 10°C to
20°C, while the data from Section 590RF (90 mm MB4-G) are slightly above. The master curves
estimated from these FWD data points are generally in good agreement with the corresponding
laboratory master curves.
• The FWD master curves based on relative difference for Sections 586RF (MB15-G), 587RF
(RAC-G), and 591RF (MAC15-G) fit the laboratory master curves better than the FWD master
curves based on the absolute difference. For Section 588RF (AR4000-D), the opposite is apparent,
while there is no significant difference for Sections 589RF (45 mm MB4-G) and 590RF (90 mm
MB4-G).
• If the number of data points for minimization is large enough, the difference between master curves
based on the absolute difference and relative difference should be small.
5.2. Comparison of Backcalculated and Laboratory Stiffness of the Base Layer
Samples of the base were taken during construction of the test road and tested in the laboratory for
resilient modulus (Mr), following the LTPP P46 Test Protocol (“Resilient Modulus of Unbound Granular
Base/Subbase Materials and Subgrade Soils”). In this test, a repeated axial cyclic stress is applied to a
cylindrical test specimen, 152 mm in diameter and 300 mm high. The specimen is also subjected to a
static confining stress provided by a triaxial pressure chamber.
The tests were conducted with different combinations of confining pressure, axial pressure, and water
content. The results are presented in Figure 5.7, and the parameters estimated for the generalized model of
aggregate base used in the M-E PDG design procedure (Equation 5.1) are shown in Table 5.1.

81
100
1000
10000
100000
0 10 20 30 40 50 60 70 80
Temperature, C
Modulu
s,
MP
aEc_lab Ec_FWD (Abs. Diff.)
MB-15+DGAC Ec_FWD (Rel. Diff.)
100
1000
10000
100000
0 10 20 30 40 50 60 70 80
Temperature, C
Modulu
s,
MP
a
Ec_lab Ec_FWD (Abs. Diff.)
RAC-G+DGAC Ec_FWD (Rel. Diff.)
Figure 5.1: Composite AC moduli from laboratory and FWD tests
for Section 586RF (MB15-G).
Figure 5.2: Composite AC moduli from laboratory and FWD tests
for Section 587RF (RAC-G).
100
1000
10000
100000
0 10 20 30 40 50 60 70 80
Temperature, C
Modulu
s,
MP
a
Ec_lab Ec_FWD (Abs. Diff.)
DGAC+DGAC Ec_FWD (Rel. Diff.)
100
1000
10000
100000
0 10 20 30 40 50 60 70 80
Temperature, C
Modulu
s,
MP
a
Ec_lab Ec_FWD (Abs. Diff.)
MB4(45 mm)+DGAC Ec_FWD (Rel. Diff.)
Figure 5.3: Composite AC moduli from laboratory and FWD tests
for Section 588RF (AR4000-D).
Figure 5.4: Composite AC moduli from laboratory and FWD tests
for Section 589RF (MB4-G-45).

82
100
1000
10000
100000
0 10 20 30 40 50 60 70 80
Temperature, C
Modulu
s,
MP
aEc_lab Ec_FWD (Abs. Diff.)
MB4 (90 mm) +DGAC Ec_FWD (Rel. Diff.)
100
1000
10000
100000
0 10 20 30 40 50 60 70 80
Temperature, C
Modulu
s,
MP
a
Ec_lab Ec_FWD (Abs. Diff.)
MAC-15+DGAC Ec_FWD (Rel. Diff.)
Figure 5.5: Composite AC moduli from laboratory and FWD tests
for Section 590RF (MB4-G-90).
Figure 5.6: Composite AC moduli from laboratory and FWD tests
for Section 591RF (MAC15-G).

83
32
11
k
a
oct
k
a
arpp
pkM
+
=
τθ
(5.2)
Where: Mr is resilient modulus (MPa)
θ is bulk stress = σ1 + σ2+ σ3
σ1 is major principal stress
σ2 is intermediate principal stress
σ3 is minor principal stress (confining pressure);
τoct is octahedral shear stress = ( ) ( ) ( )2
32
2
31
2
2131 σσσσσσ −+−+−
pa is atmospheric pressure (0.101 MPa)
k1, k2, k3 are parameters to be estimated.
Table 5.1: Parameters Estimated from Laboratory Test Results
Moisture Content (%) Parameter
5.5 6.5 5.9 8.5 8.6 8.1 9.5
k1
k2
k3
470.5077
0.3127
-0.0490
81.7698
0.5441
-0.0642
72.9065
0.5488
-0.0547
51.3602
0.5598
-0.0578
41.1698
0.5752
-0.0620
90.8122
0.4909
-0.0363
43.5573
0.4744
0.0272
The resilient modulus of the base material changed with water content and confining pressure, but was
less affected by the peak deviatorial stress (Figure 5.7). The resilient modulus of the base material was in a
range of 100 MPa and 600 MPa for a water content between 5.5 percent and 9.5 percent, and a confining
pressure between 21 kPa and 138 kPa,
As discussed in previous sections, the effect of water content was not detected in the backcalculated
modulus of the base, primarily due to the limited number of data points and conflicting effects of other
factors such as aging and recementation. However, the effect of confining pressure was detected from the
FWD data, which indicated that the base modulus dropped when the pavement temperatures increased.
Higher temperatures resulted in softer asphalt concrete, and therefore, less confining pressure to the
underlying aggregate base. Before Phase 2 HVS testing, the values of the backcalculated moduli of the
base were significantly higher than the values measured in the laboratory on most sections except
Section 590RF, with the highest value reaching 3,700 MPa on Section 586RF. This difference was
attributed to anomalies associated with backcalculation of FWD deflection measurements on relatively
thin asphalt layers, and to differences in the degree of recementation of the base material after
construction. Laboratory specimens were tested shortly after fabrication, with no curing, and therefore
recementation was unlikely to have occurred. The base modulus in the trafficked area dropped to between

84
200 MPa and 300 MPa on most sections after Phase 2 testing, which is in the range of the laboratory
measured values, indicating that cemented bonds were broken down during HVS trafficking.
100
200
300
400
500
600
700
800
5 6 7 8 9 10
Water Content (%)
Resili
ent
Modulu
s (
MP
a)
PD25.9 kPa PD47.2 kPa PD67.5 kPa
PD40.0 kPa PD74.6 kPa PD103.8 kPa
PD74.7 kPa PD133.1 kPa PD184.8 kPa
PD74.7 kPa PD109.4 kPa PD210.5 kPa
PD109.1 kPa PD142.6 kPa PD279.9 kPa
Confining Pressure=20.7 kPa
Confining Pressure=34.1 kPa
Confining Pressure=68.8 kPa
Confining Pressure=103.5 kPa
Confining Pressure=138.2 kPa
Figure 5.7: Resilient modulus of aggregate base measured in the laboratory. (PD represents peak deviatory stress)
5.3. Comparison of Stiffness Backcalculated from FWD and RSD
The Road surface deflectometer (RSD) is similar to the Benkelman Beam and is used to measure the
surface deflection bowl under HVS loading, with the measuring point positioned between the two tires of
a dual tire configuration. Measurement accuracy is approximately 10 microns. In this study, the RSD
measurements were taken before, during, and after the HVS testing. Testing was carried out at creep
speed, which corresponds to an equivalent loading frequency of about 0.2 Hz. Pavement temperature at
50 mm depth was maintained at either 20°C ± 4°C or at 15°C ± 4°C, depending on the stage of testing (see
Chapter 2). The peak deflection results discussed in the first-level reports were very consistent across the
various tests, and provided a reliable indication of relative damage over the course of an HVS test.
A Matlab® program, based on layer elastic theory, was developed by UCPRC to backcalculate pavement
layer moduli from RSD data. The overlay and underlying asphalt concrete layers were treated as separate
layers in this backcalculation. On Sections 589RF and 591RF, it was necessary to fix the overlay modulus
at the value from the laboratory frequency sweep test, and to subdivide the underlying DGAC layer into
two sub-layers, treated as different materials, in order to obtain rational results. Comparison between the
FWD moduli and RSD moduli was therefore not performed on these sections.

85
The moduli of the overlay and underlying layers from RSD data were converted into the composite
modulus using the Odemark method. The composite modulus master curves developed from the FWD
data were used to calculate the FWD moduli at 20°C and 0.2 Hz loading frequency. Table 5.2 summarizes
the results.
Table 5.2: Comparison of Composite AC Moduli from FWD and RSD Data
Section Time
Composite AC
Modulus Based on
RSD
(MPa)
Composite AC Modulus
Based on FWD
(absolute difference)
(MPa)
Composite AC Modulus
Based on FWD
(relative difference)
(MPa)
586RF
586RF
587RF
587RF
588RF
588RF
590RF
590RF
Before HVS
After HVS
Before HVS
After HVS
Before HVS
After HVS
Before HVS
After HVS
2,759
1,215
689
88
1,181
111
1,427
73
898
887
1,120
754
2,986
1,175
2,563
1,320
1,431
871
1,852
768
2,700
1,175
2,737
1,369
There was a significant difference between the moduli from the two measuring methods. For
Section 586RF, the moduli from the FWD data are smaller than those from the RSD data for both before
and after the HVS test. For Sections 587RF, 588RF, and 590RF, the moduli from the FWD data are all
larger than those from the RSD data. The reasons for this difference include the different data sets used for
backcalculation, and different procedures and assumptions in the two methods of backcalculation,
especially with regard to accounting for layer thickness. The RSD data were measured at constant
pavement temperatures and an equivalent loading frequency of 0.2 Hz, while the FWD data were
measured at varying temperatures and at about a 10 Hz loading frequency. Extrapolating the FWD data to
high temperatures or low loading frequencies increases the chance of errors. The development of master
curves from FWD backcalculation also requires that the minimum modulus be fixed at 100 MPa, while
there is no such constraint in the RSD backcalculation. This requirement could also have influenced the
validity of the results.

86

87
6. CONCLUSIONS
This report is one in a series of studies detailing the results of HVS testing and associated analyses being
performed to validate Caltrans overlay strategies for the rehabilitation of cracked asphalt concrete. It
describes the analysis of deflection data measured with a Falling Weight Deflectometer (FWD) after
initial construction, before and after each HVS test in the first phase of testing on the original DGAC
surface, before and after construction of the overlays, and before and after each HVS test on each overlay.
FWD results are compared with Road Surface Deflectometer (RSD) measurements taken during each
HVS test.
Findings and observations based on this analysis include:
• Variation of material properties were recorded both between sections and within sections, which
was mostly attributed to variation in the degree of recementation of recycled concrete particles in
the aggregate base material. Base and subgrade were stiffest on Sections 567RF/586RF (MB15-
G), and weakest on Sections 572RF/590RF (90 mm MB4-G).
• The asphalt concrete modulus was significantly affected by the pavement temperature, as
expected. In general, lower modulus was obtained at high temperatures, and higher modulus at
low temperatures.
• The modulus of the aggregate base was generally positively correlated with the moduli of the
asphalt concrete and subgrade. Correlation between the asphalt concrete modulus and the base
modulus was weaker in the untrafficked area and/or in the trafficked area before HVS testing,
probably because of recementation of particles in the base after construction and subsequent
destruction of the bonds during HVS trafficking. No significant correlation was found between the
asphalt concrete modulus and the subgrade modulus.
• The load level of the FWD did not have a significant effect on the values of the backcalculated
moduli.
• Aging of the asphalt concrete was apparent on all sections except Section 591RF (MAC15-G). A
logarithm function appeared to fit the data well.
• The stiffness of the base increased significantly with time after initial construction, primarily due
to recementation of the recycled concrete particles. This increase continued after overlay
construction in certain areas of the test road (e.g. in the vicinity of Sections 586RF [MB15-G] and
588RF [AR4000-D]), but not in other areas.
• Phase 2 HVS testing generally damaged the asphalt concrete layers in the trafficked area of each
section. Minimal damage was measured on Section 586RF (MB15-G).
88
• In the one to three year period after Phase 2 HVS testing, the modulus of the damaged asphalt
concrete generally recovered to some extent except for part of the control section overlaid with
AR4000-D, where the asphalt concrete layer was severely cracked. Little change in the moduli of
the base and subgrade was recorded on this subsection. The recovery rates of sections overlaid
with RAC-G and MB4-G (45 mm) were similar, while that of the MB4-G (90 mm) overlay
section was slightly higher.
• Seasonal effects on pavement stiffness were not detected from the limited data collected during
this study.
• The asphalt concrete moduli backcalculated from the overlay sections match reasonably well with
the moduli determined during laboratory frequency sweep tests on flexural beam specimens.
However, the asphalt concrete moduli backcalculated from the underlying DGAC were
significantly lower than those measured by the frequency sweep test in the laboratory.
• There was a difference between the moduli backcalculated from FWD data and from the RSD
data. Differences in test conditions (temperature, load, and load frequency) and backcalculation
assumptions of the two procedures contributed to this difference.
The following recommendations for using backcalculated data in other reflective cracking study analyses
are suggested:
• All sections except Sections 573RF/591RF should be subdivided into two equal-length
subsections (i.e. Stations 2 to 8, and Stations 8 to 14) to account for non-uniformity of material
properties within test sections in pavement modeling and simulation. Sections 573RF/591RF can
be treated as one uniform section.
• For pavement modeling and simulations of actual HVS test conditions, the asphalt concrete
modulus backcalculated from both FWD and RSD testing should be used. The asphalt concrete
modulus determined from laboratory frequency sweep test on flexural beams should be used for
modeling and simulation of uniform sections.
No recommendations as to the use of modified binder mixes are made at this time. These
recommendations will be included in the second-level analysis report, which will be prepared and
submitted on completion of all HVS and laboratory testing and analysis.
89
7. REFERENCES
1. Generic experimental design for product/strategy evaluation — crumb rubber modified
materials. 2005. Sacramento, CA: Caltrans.
2. Reflective Cracking Study: Workplan for the Comparison of MB, RAC-G, and DGAC
Mixes Under HVS and Laboratory Testing. 2003. Davis and Berkeley, CA: University of
California Pavement Research Center. (UCPRC-WP-2003-01).
3. BEJARANO, M., Jones, D., Morton, B., and Scheffy, C. 2005. Reflective Cracking Study:
Summary of Construction Activities, Phase 1 HVS Testing, and Overlay Construction.
Davis and Berkeley, CA: University of California Pavement Research Center. (UCPRC-RR-2005-
03).
4. TSAI, B.-W., Jones, D., Harvey, J., and Monismith, C. 2006. Reflective Cracking Study:
First-level Report on Laboratory Fatigue Testing. Davis and Berkeley, CA: University of
California Pavement Research Center. (UCPRC-RR-2006-08)
5. GUADA, I., Signore, J., Tsai, B.-W., Jones, D., Harvey, J., and Monismith, C. 2006. Reflective
Cracking Study: First-level Report on Laboratory Shear Testing. Davis and Berkeley, CA:
University of California Pavement Research Center. (UCPRC-RR-2006-11)
6. JONES, D. Tsai, B.W. and Harvey, J. 2006. Reflective Cracking Study: First-level Report on
HVS Testing on Section 590RF — 90 mm MB4-G Overlay. Davis and Berkeley, CA:
University of California Pavement Research Center. (UCPRC-RR-2006-04).
7. JONES, D., Wu, R., Lea, J. and Harvey, J. 2006. Reflective Cracking Study: First-level
Report on HVS Testing on Section 589RF — 45 mm MB4-G Overlay. Davis and Berkeley,
CA: University of California Pavement Research Center. (UCPRC-RR-2006-05).
8. WU, R., Jones, D. and Harvey, J. 2006. Reflective Cracking Study: First-level Report on HVS
Testing on Section 587RF — 45 mm RAC-G Overlay. Davis and Berkeley, CA: University of
California Pavement Research Center. (UCPRC-RR-2006-06).
9. JONES, D., WU, R. and Harvey, J. 2006. Reflective Cracking Study: First-level Report on
HVS Testing on Section 588RF — 90 mm DGAC Overlay. Davis and Berkeley, CA:
University of California Pavement Research Center. (UCPRC-RR-2006-07).
10. JONES, D., WU, R. and Harvey, J. 2006. Reflective Cracking Study: First-level Report on
HVS Testing on Section 586RF — 45 mm MB15-G Overlay. Davis and Berkeley, CA:
University of California Pavement Research Center. (UCPRC-RR-2006-12).
90
11. JONES, D., WU, R. and Harvey, J. 2007. Reflective Cracking Study: First-level Report on
HVS Testing on Section 591RF — 45 mm MAC15-G Overlay. Davis and Berkeley, CA:
University of California Pavement Research Center. (UCPRC-RR-2007-04).
12. JONES, D., Harvey, J. and Steven, B. 2007. Reflective Cracking Study: HVS Test Section
Forensic Report. Davis and Berkeley, CA: University of California Pavement Research Center.
(UCPRC-RR-2007-05).
13. HARVEY, J., Du Plessis, L., Long, F., Deacon, J., Guada, I., Hung, D. and Scheffy, C. 1997.
CAL/APT Program: Test Results from Accelerated Pavement Test on Pavement Structure
Containing Asphalt Treated Permeable Base (ATPB) – Section 500RF. Davis and Berkeley,
CA: University of California Pavement Research Center. (Report Numbers UCPRC-RR-1999-02
and RTA-65W4845-3).

91


