
VCE Maths Methods - Unit 2 - Rates of change
Rates of change
• Rates of change• Average rate of change• Instantaneous rates of change• Rates of change from graphs• Graphs of motion
1

VCE Maths Methods - Unit 2 - Rates of change
Rates of change
• The rate of change measures how a variable changes with another.
Examples of rates include:
• A speed of 60 km/h
• A$1.05 per $USD
• 4.9 litres of fuel per 100 km travelled
• 5.2 births per thousand people per year
• Rates be found from measuring the gradient of the graph.
• Average rates of change can be calculated from an average between two points.
• Instantaneous rates of change can be calculated from the gradient of the tangent to a curve.
2

VCE Maths Methods - Unit 2 - Rates of change
Average rate of change
• Approximating the curve with a straight line.
• The average rate of change is the gradient of the chord (straight line) between two points.
3
y = x2
2
(0,0)
(10,50) m =
y2 − y1
x2 − y1
m =
50−010−0
m =5
Average rate = 5
Rise =50
Run =10

VCE Maths Methods - Unit 2 - Rates of change
Instantaneous rates of change
4
• To find the instantaneous gradient at a point, a tangent line is drawn.
• The tangent line touches the curve at one point.
• It has the same gradient as the curve at the point of contact.
rise = - 2.2
run = 4
x = 2, tangent touches the curvewith the same gradient.
gradient = −2.2
4=−0.55

VCE Maths Methods - Unit 2 - Rates of change
Rates of change from graphs
5
• The rate of change can be interpreted from the gradient of a graph.
y
x
Constant positive rate of change

VCE Maths Methods - Unit 2 - Rates of change
Rates of change from graphs
6
y
x
Constant negative rate of change

VCE Maths Methods - Unit 2 - Rates of change
Rates of change from graphs
7
y
x
Increasing positive rate of change

VCE Maths Methods - Unit 2 - Rates of change
Rates of change from graphs
8
y
x
Increasing negative rate of change

VCE Maths Methods - Unit 2 - Rates of change
Rates of change from graphs
9
y
x
Decreasing positive rate of change

VCE Maths Methods - Unit 2 - Rates of change
Rates of change from graphs
10
y
x
Decreasing negative rate of change

VCE Maths Methods - Unit 2 - Rates of change
Graphs of motion
11
• The rate of change of position with respect to time is the velocity.
• The rate of change of velocity with respect to time is the acceleration.
• Constant velocity in the positive direction.position (m)
time (s)
velocity (m/s)
time (s)
VCE Maths Methods - Unit 2 - Rates of change
Graphs of motion
12
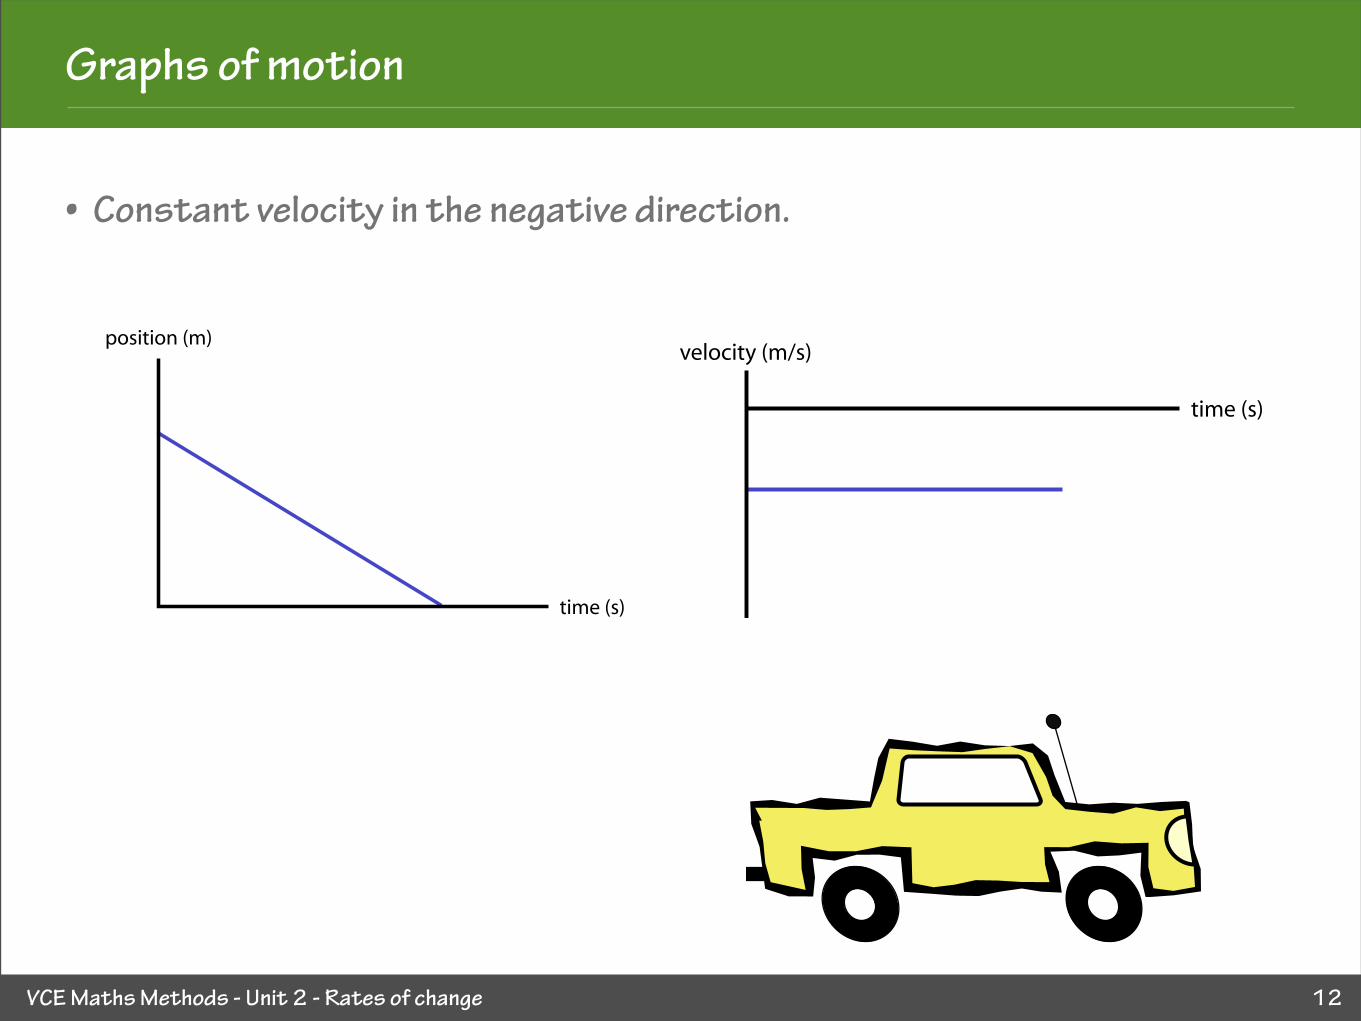
• Constant velocity in the negative direction.
position (m)
time (s)
velocity (m/s)
time (s)
VCE Maths Methods - Unit 2 - Rates of change
Graphs of motion
13
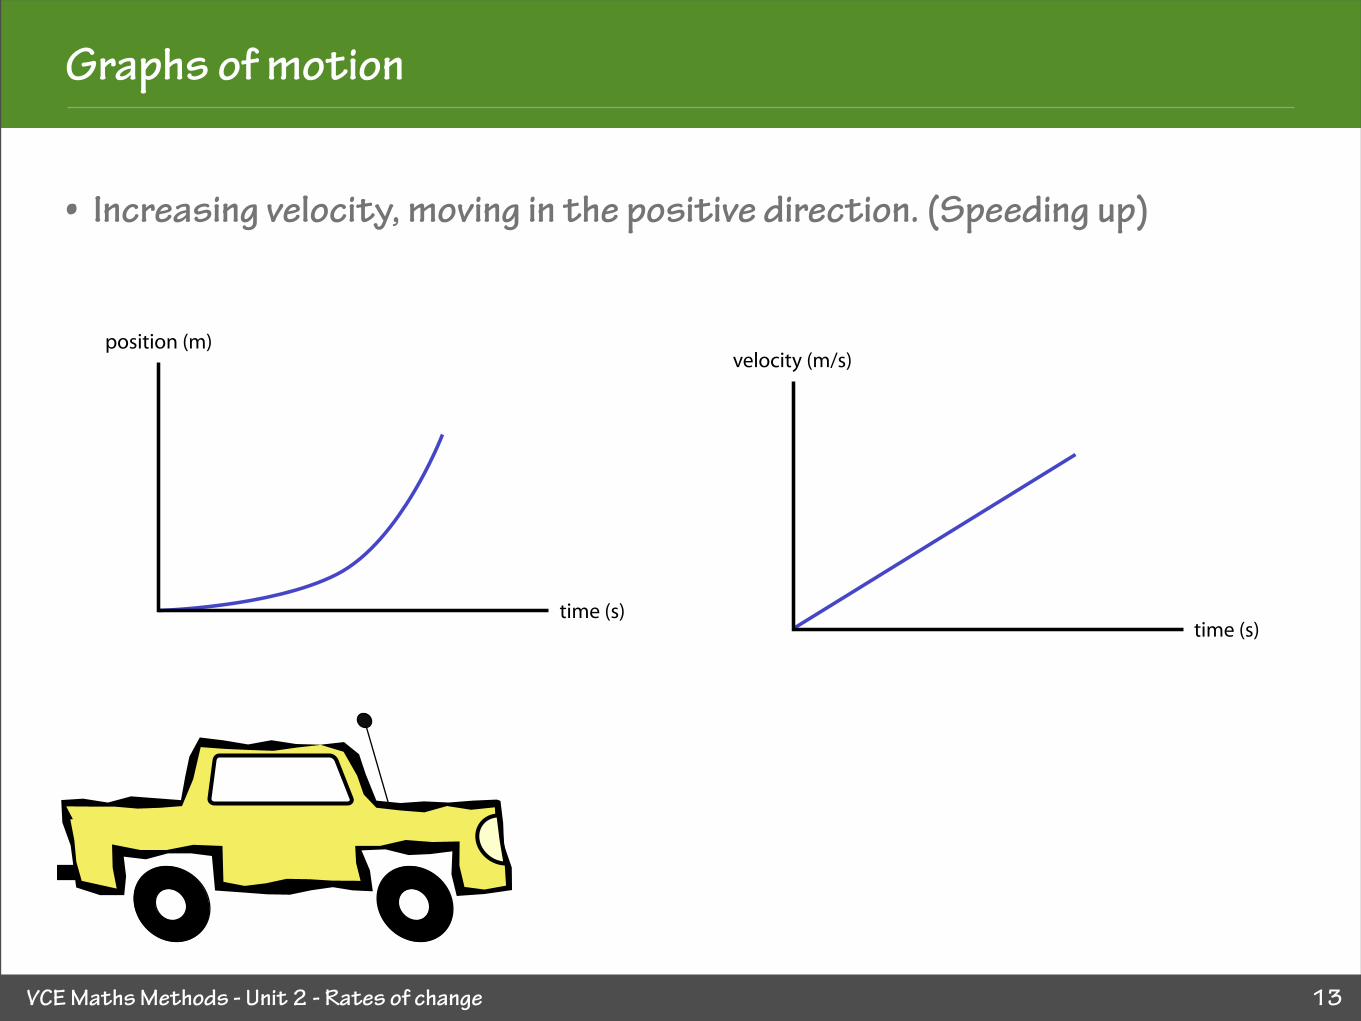
• Increasing velocity, moving in the positive direction. (Speeding up)
position (m)
time (s)
velocity (m/s)
time (s)

VCE Maths Methods - Unit 2 - Rates of change
Graphs of motion
14
• Decreasing velocity, moving in the positive direction. (Slowing down)
position (m)
time (s)
velocity (m/s)
time (s)

VCE Maths Methods - Unit 2 - Rates of change
Graphs of motion
15
• Walking in front of a motion detector (at position 0 m).
-5
-4
-3
-2
-1
0
1
2
3
4
5
0 1 2 3 4 5 6 7 8 9 10
Time (s)
Position (m/s) Velocity (m/s)
-5
-4
-3
-2
-1
0
1
2
3
4
5
0 1 2 3 4 5 6 7 8 9 10
Time (s)
Position (m/s)
Stationary
Moving closer
Negative velocity
Stationary
Moving away
Positive ve
locity
Zero velocity
Stationary
Negative velocity
Negative velocity
Positive velocityZero velocity
Zero velocity


