1/27 CERTS R&M Review Aug 4-5, 2015
Random Topology Power Grid Modeling and the Simulation Platform
Zhifang Wang Seyyed Hamid Elyas
Virginia Commonwealth University Richmond, VA, USA
{zfwang, elyassh}@vcu.edu
Robert J. Thomas Cornell University
Ithaca, NY, USA [email protected]
2/27 CERTS R&M Review Aug 4-5, 2015
Motivation
u Appropriate randomly generated grid network topologies necessary to test new concepts and methods. Ø If the random networks are truly representative and if the
concepts or methods test well in this environment they would test well on any instance of such a network.
u Current situation difficult to obtain realistic grid data
limited reference test cases existing models with shortcomings

3/27 CERTS R&M Review Aug 4-5, 2015
Critical Applications for the Grid
u Renewable generation interconnection
u PMU placements to facilitate fast state estimation and real-time state awareness
u Transmission expansion planning
u Grid vulnerability and security analysis u Transient stability controls
u Electricity market strategy experiments u Smart grid communication infrastructure

4/27 CERTS R&M Review Aug 4-5, 2015
Electric Power Grid Network
♦ 3 sections in transmission – High, Medium and Low
voltage sections
Transmission
Distribu.on
5/27 CERTS R&M Review Aug 4-5, 2015
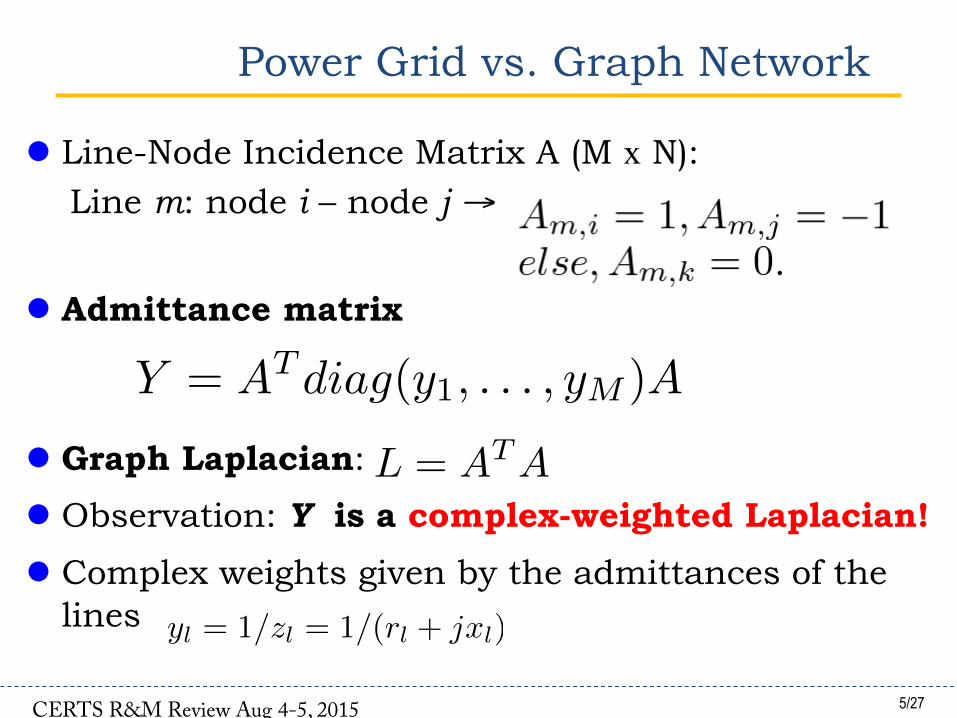
Power Grid vs. Graph Network
l Line-Node Incidence Matrix A (M x N):
Line m: node i – node j →
l Admittance matrix
l Graph Laplacian:
l Observation: Y is a complex-weighted Laplacian!
l Complex weights given by the admittances of the lines
Y = AT diag(y1, . . . , yM )A
L = ATA
yl = 1/zl = 1/(rl + jxl)

6/27 CERTS R&M Review Aug 4-5, 2015
Statistical Modeling of Power Grid
Topology Electrical
Parameters
Rand-topo Power Grid Model
7/27 CERTS R&M Review Aug 4-5, 2015
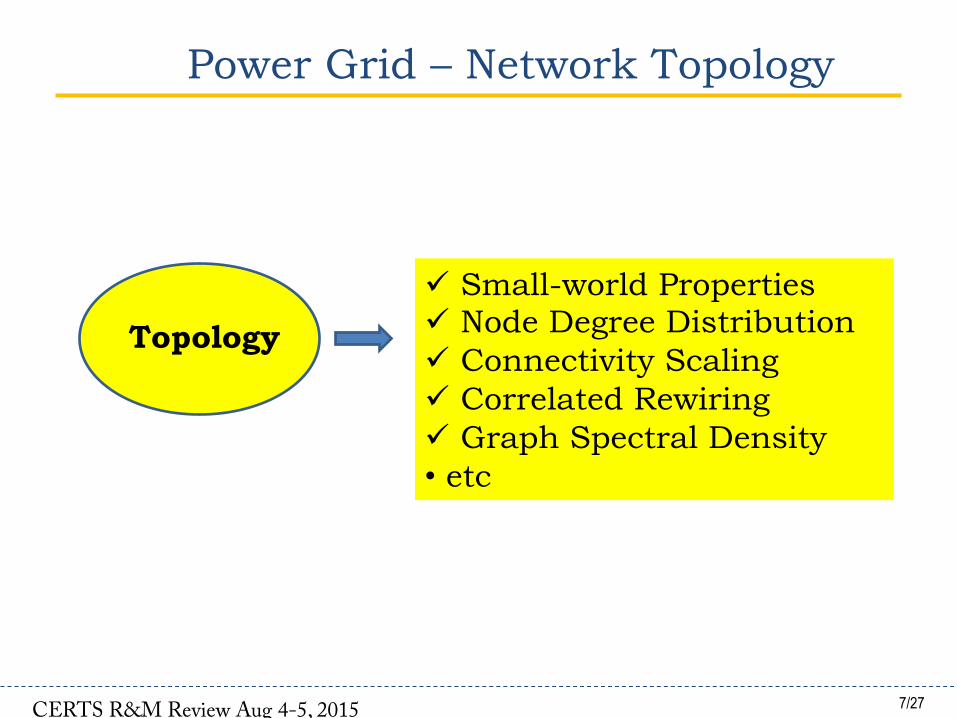
Power Grid – Network Topology
Topology
ü Small-world Properties ü Node Degree Distribution ü Connectivity Scaling ü Correlated Rewiring ü Graph Spectral Density • etc
8/27 CERTS R&M Review Aug 4-5, 2015
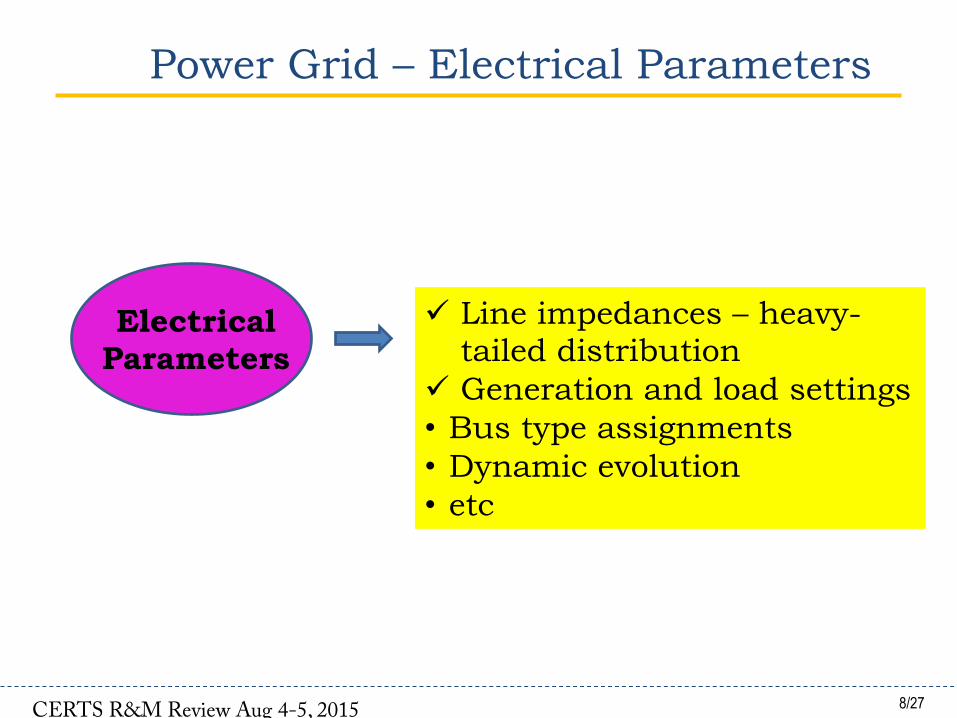
Power Grid – Electrical Parameters
ü Line impedances – heavy-tailed distribution
ü Generation and load settings • Bus type assignments • Dynamic evolution • etc
Electrical Parameters

9/27
Plausible Electrical Topology
– The proposed model that matches observed properties is what we call RT-nested-Small-world.
– IEEE à SW subnet 30; NYISO & WECC à SW sub-net 300

10/27
Bus Type Assignment T
Ø Three bus types in a grid:
Ø Generation bus Ø Load bus
Ø Connection bus Ø RT-nestedSmallWorld: Random or Correlated T ?

11/27
Bus Type vs. Node degree
l Correlation between bus types and node degree
12/27
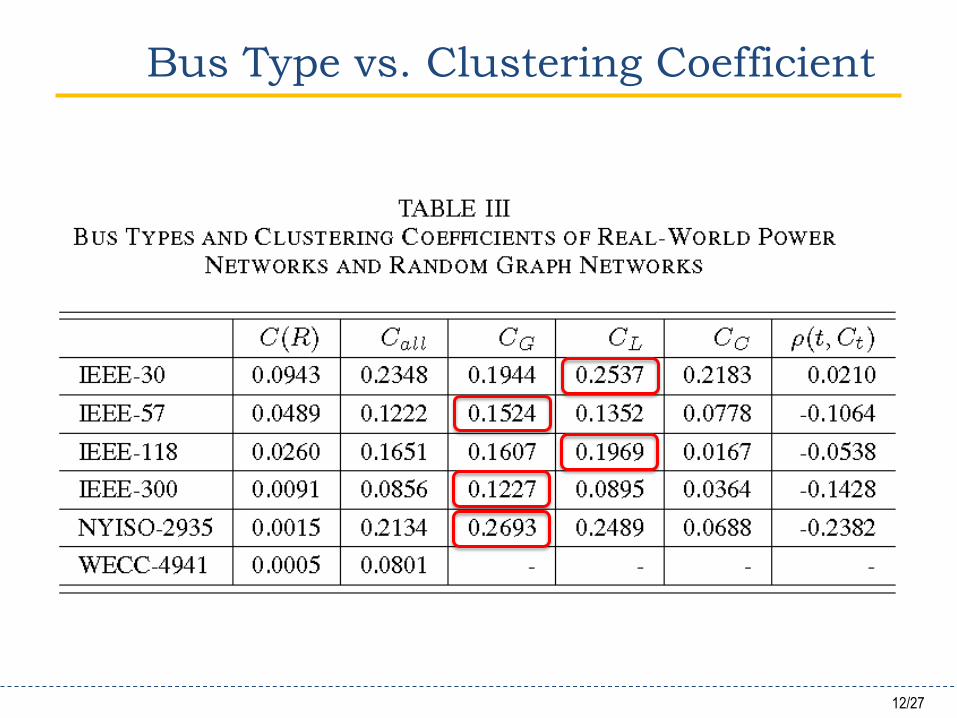
Bus Type vs. Clustering Coefficient

13/27
Bus Type vs. Degree Distribution

14/27
Bus Type Assignment vs. Grid Vulnerability
IEEE-300 bus system,
given the same topology, G/L/C ratios, and generation and load statistical settings, the test cases with random bus type assignments tend to have larger expected safety time than that of the realistic grid settings.

15/27
Bus Type Entropy
Total number of G/L/C buses
Bus type ra6os G/L/C
Total number of each type links i.e. {GG, GL, GC, LL, LC, CC}
Link type ra6os

16/27
Two Variations
17/27
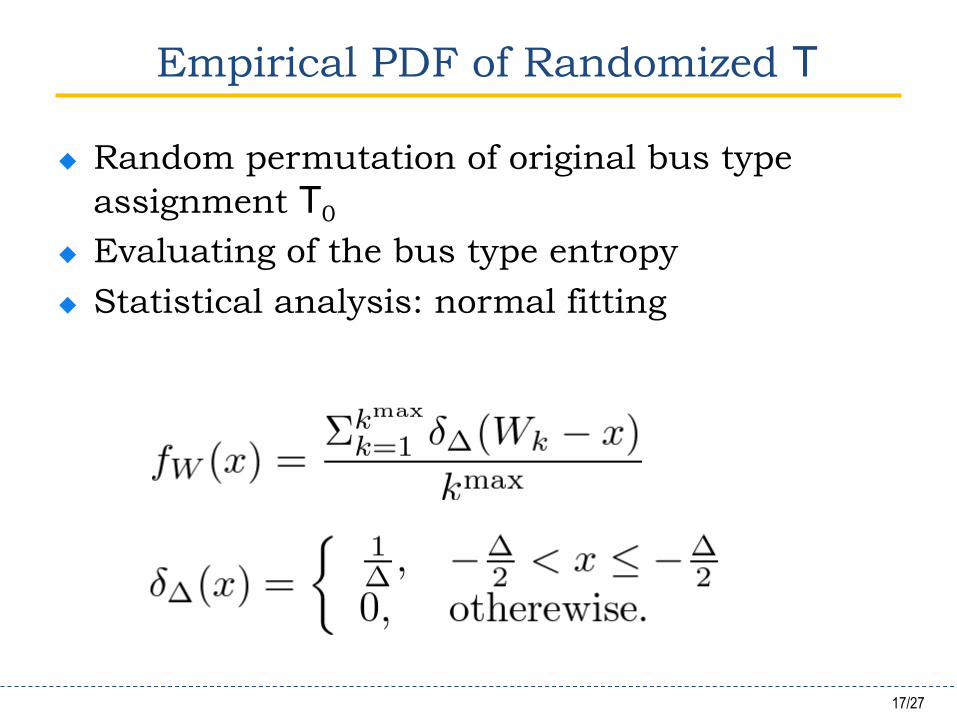
Empirical PDF of Randomized T
u Random permutation of original bus type assignment T0
u Evaluating of the bus type entropy
u Statistical analysis: normal fitting

18/27
Empirical and Fitting PDF of W(T) NYISO-2935 IEEE-300
W1(T )
W2(T )
W3(T )

19/27
Empirical and Fitting PDF of W(T) NYISO-2935
W1(T )
W2(T )
W3(T )
MPC -5633
20/27 CERTS R&M Review Aug 4-5, 2015
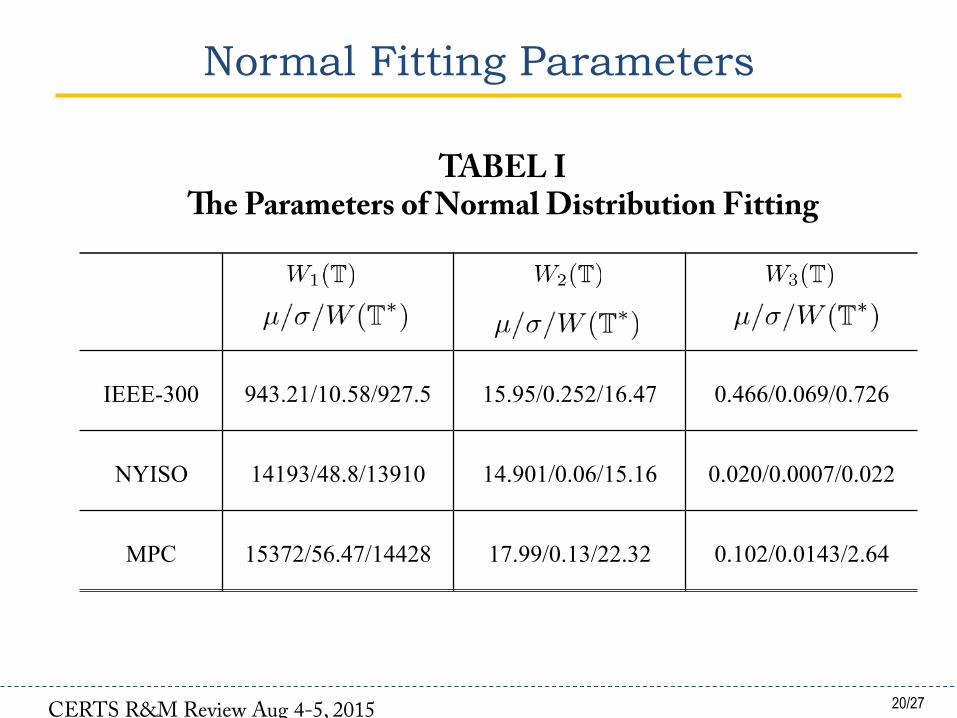
Normal Fitting Parameters
IEEE-300 943.21/10.58/927.5 15.95/0.252/16.47 0.466/0.069/0.726
NYISO 14193/48.8/13910 14.901/0.06/15.16 0.020/0.0007/0.022
MPC 15372/56.47/14428 17.99/0.13/22.32 0.102/0.0143/2.64
TABEL I !e Parameters of Normal Distribution Fitting

21/27 CERTS R&M Review Aug 4-5, 2015
Normalized Distance of W(T*)
IEEE-300 (300,409) 1.48 1.96 3.76
NYISO (2935,6567) 5.78 28.72 2.42
MPC (5633,7053) 16.71 33.30 177.48
TABEL II !e Normalized Distance of Realistic Bus Type Entropy

22/27
Multi-objective Optimization Algorithm
23/27
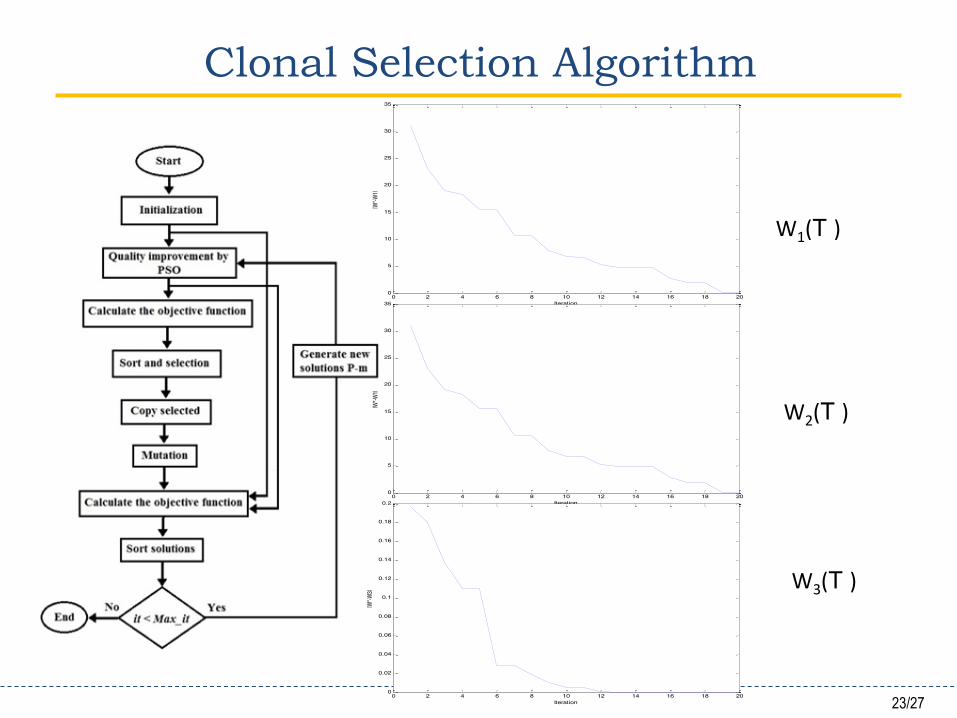
Clonal Selection Algorithm
0 2 4 6 8 10 12 14 16 18 200
5
10
15
20
25
30
35
Iteration
|W*-W
1|
0 2 4 6 8 10 12 14 16 18 200
5
10
15
20
25
30
35
Iteration
|W*-W
1|
0 2 4 6 8 10 12 14 16 18 200
0.02
0.04
0.06
0.08
0.1
0.12
0.14
0.16
0.18
0.2
Iteration
|W*-W
3|
W1(T )
W2(T )
W3(T )

24/27
Numerical Results
The best set of bus type assignments in for a 300 bus system - W2(T )
25/27
Conclusions & Future Works
l The bus type (G/L/C) assignment of a realistic power system is not random but correlated.
l A novel measure W(T), called the Bus Type Entropy, is defined to characterize the correlated bus type assignment in a grid.
l Statistical analysis on the three realistic and synthetic grids verify the effectiveness of W(T):
– W(T*) of a realistic power grid always stands out from those of random bus type assignments.
– Consistent trend of the W(T*) is observed in all the test cases.
– which is even more obvious for a large grid.
26/27
Conclusions & Future Works
l A multi-objective optimization algorithm is formulated to assign the bus types (G/L/C) that have the entropy values close to that of a realistic grid.
l The scaling property of W(T) the proposed entropy measure will be further studied versus the grid size and other electrical or topological metrics.
l Numerical simulation will be done to verify the effectiveness of W(T) in electrical aspects:
– System vulnerability to cascading failures,
– Other options?

27/27
Questions? J
Thank You!
![Beyond Node Degree: Evaluating AS Topology Models · erated using pure-random, Waxman [32], exponential and several locality based models of topology such as Transit-Stub. They use](https://cdn.vdocuments.us/doc/165x107/5f03fe937e708231d40bcb2a/beyond-node-degree-evaluating-as-topology-models-erated-using-pure-random-waxman.jpg)


