
Random phase noise effect on the contrastof an ultra-high intensity laser
Y.Mashiba1, 2, H.Sasao3, H.Kiriyama1,M.R.Asakawa2, K.Kondo1, and P. R. Bolton1
1Kansai photon Science Institute, Japan Atomic Energy Agency, 8-1-7 Umemidai, Kizugawa, Kyoto 619-0216, Japan
2Faculty of Science and Engineering, Kansai University, 3-3-35 Yamate-cho, Suita, Osaka 564-8680, Japan
3Naka Fusion Institute, Japan Atomic Energy Agency, 801-1 Mukoyama, Naka, Ibaraki 311-0193, Japan
Poster Session II Ultra-intense Laser Design And PerformanceThe International Committee on Ultra-High Intensity Lasers (ICUIL 2014)
October 14, 2014Hotel Cidade De Goa, Goa, India

Outline
• Objective
• Origin of spectral random phase noise (SRPN)
• Numerical analysis
• Calculation results on temporal contrast with SRPN
• Conclusion

In the application of a high-intensity laser to solid-target experiments, a pedestal can generate unwanted plasmas before the main pulse arrive on the target.
Solid-target
Main pulse
Pedestal
The unwanted plasmas modify the experimental condition.
A part of pedestal goes ahead of main pulse
The pedestal intensities have reached up to W/cm .1110 2

Limiting factors in temporal contrast
We have evaluated the spectral random phase noise (SRPN).
High order spectral phase dispersion
1
-500 -400 -300 -200 -100 0 10010-12
10-10
10-8
10-6
10-4
10-2
Amplified spontaneous emission
Spectral random phase noise
Ref. H.Kiriyama et al.Opt. Lett. 37, 3363-3365 (2012)
Nor
mal
ized
inte
nsity
Time [ps]

Origin of spectral random phase noise (SRPN)
Noise of the surface flatness is directly converted tospectral random phase noise (SRPN).
Chirped-pulse from the amplifier
Grating 2
Grating 1
Grating 3
Grating 4
Large gratings “2,3” have the surface roughness.
Compressor
Compressed pulse

Our large grating (W:420 mm, H:210 mm) have the surface roughness of 9-12 nm (peak to valley; P-V) along the center.
50 10 15 20 25Distance [cm]
0
4
8
12
Hei
ght [
nm] 12 nm
Photo of our large grating
420 mm
210 mm 25.9 cm
Measured surface roughness
The roughness is measured to be 9-12 nm (P-V).
0
3
6
9
9 nm
Laser beam
Grating 2
Grating 3

md )sin(sin
1.0
1.2
1.4
1.6
1.8
750 790770 810 830 850Wave length ( ) [nm]
Spec
trum
rand
om
phas
e no
ise
(δ) [
rad]
2
)21( ZZ
Spectrum random phase noise
d: lattice constantα: angle of incidence at grating 1β: angle of emergence at grating 1m: degree
Numerical analysis (1/2)
Spectral random phase noiseLaser having wavelength
ΔZ1 ΔZ2
Grating 2 Grating 3
Dispersed laser from the grating 1 to grating “2,3”
Optical path difference due to the roughnessΔZ1 and ΔZ2 are from the measured surface roughness.

dkekItf ckti )()()(
I(k): Spectral intensityc: speed of lightk: wave number
0
0.4
0.8
1.2
1.6
0.0750 790770 810 830 850
Wave length ( ) [nm]Sp
ectr
al in
tens
ity( I
(k) )
[arb
.u.]
Contrast analysis based on Fourier inverse transformation
Equation
• We have taken account of grating “2,3” for calculation of the spectral random phase noise (Grating “1,4” have flat surface) .
• We have considered the temporal contrast in one dimensional analysis.
Assumption
Numerical analysis (2/2)
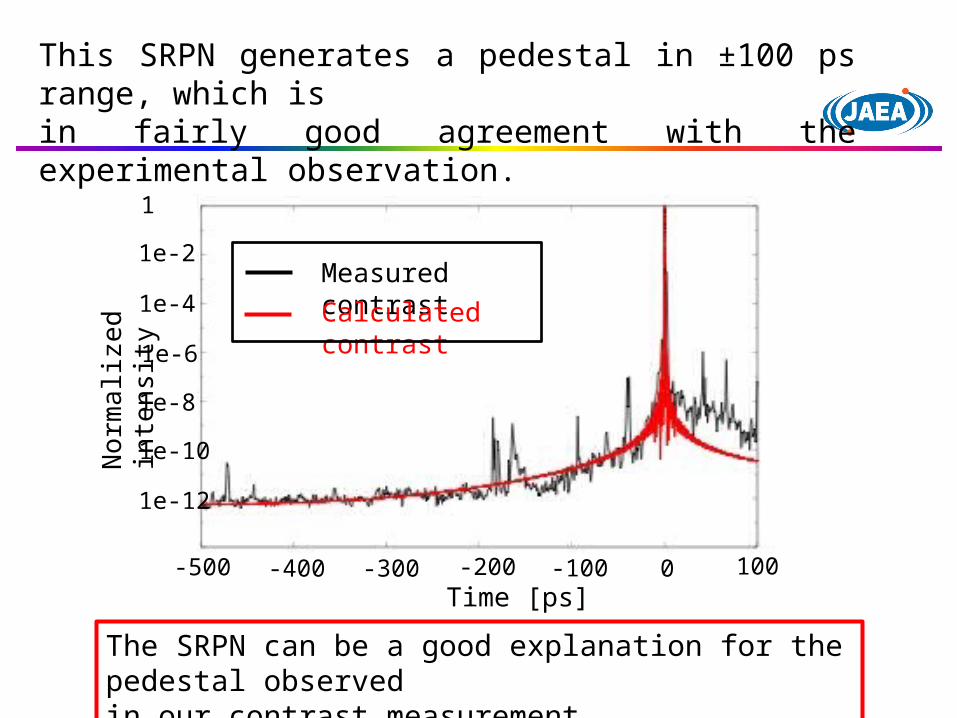
This SRPN generates a pedestal in ±100 ps range, which is in fairly good agreement with the experimental observation.
The SRPN can be a good explanation for the pedestal observed in our contrast measurement.
0-500 -400 -300 -200 -100 100
1e-12
1e-10
1e-8
1e-6
1e-4
1e-2
1
Nor
mal
ized
inte
nsity
Time [ps]
Measured contrastCalculated contrast

Conclusion
• Our large gratings (W:420 mm, H:210 mm) have the
surface roughness of 9-12 nm (P-V) along the center.
• The spectral random phase noise generated
in the grating in a compressor is the most probable
factor causing the pedestal.
• Two dimensional analysis
• Larger gratings (W:565 mm, H:360 mm) evaluation……
Next step


![LED MEASUREMENT INSTRUMENTATION › wp-content › uploads › 2013 › ... · Luminous intensity Ö Candela [cd = lm sr-1] Radiometric intensity Ö W sr-1 Spectroradiometric intensity](https://cdn.vdocuments.us/doc/165x107/5f1cd8a1b4d63e04092d4d11/led-measurement-instrumentation-a-wp-content-a-uploads-a-2013-a-luminous.jpg)


