
REVIEW STATEMENT
DECEMBER 2014
QUARTERLY BUDGET
Bega Valley Shire Council
Zingel Place
PO Box 492
Bega NSW 2550
Phone (02) 6499 2222
Fax (02) 6499 2200
[email protected] www.begavalley.nsw.gov.au

Table of Content
Page
Definitions 1
Responsible Accounting Officer Statement 3
Contracts 4
Consultancy & Legal Expenses 4
Reserves 5
Budget Review
Consolidated 7
By Fund
General 9
Plant 11
Waste 13
Water 15
Sewer 17
By Directorate
Community Relations and Leisure 19
Children Services 21
Community and Community Information 23
Community and Culture 25
Community Relations and Leisure 27
Leisure 29
Organisation Development and Governance 31
Organisation Development and Governance 33
Planning and Environment 35
Building and Health 37
Environmental 39
Planning and Environment 41
Planning 43
Strategy and Business Services 45
Business Growth 47
Business Services 49
Strategy 51
Strategy and Business 53
Transport and Utilities 55
Civil Assets 57
Emergency Services 59
Sewer Services 61
Transport and Utility Group 63
Transport Services 65
Waste Services 67
Water Services 69
Works 71
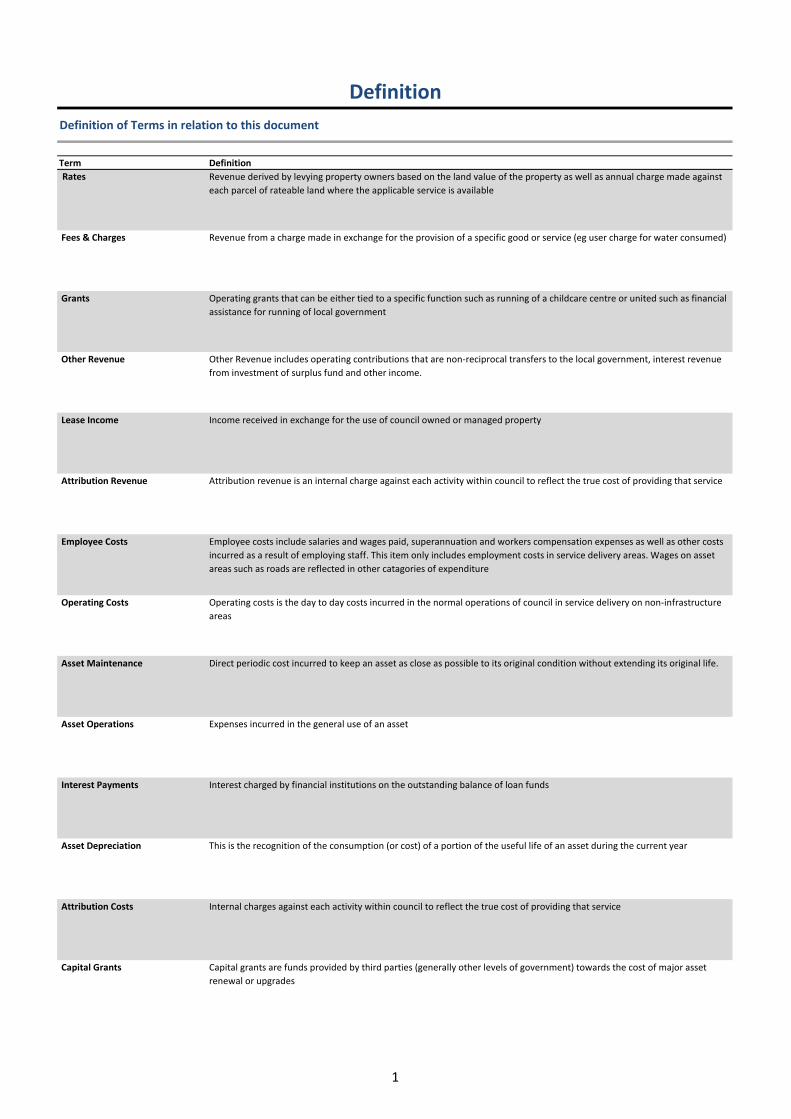
Definition
Definition of Terms in relation to this document
Term Definition
Rates Revenue derived by levying property owners based on the land value of the property as well as annual charge made against
each parcel of rateable land where the applicable service is available
Fees & Charges Revenue from a charge made in exchange for the provision of a specific good or service (eg user charge for water consumed)
Grants Operating grants that can be either tied to a specific function such as running of a childcare centre or united such as financial
assistance for running of local government
Other Revenue Other Revenue includes operating contributions that are non-reciprocal transfers to the local government, interest revenue
from investment of surplus fund and other income.
Lease Income Income received in exchange for the use of council owned or managed property
Attribution Revenue Attribution revenue is an internal charge against each activity within council to reflect the true cost of providing that service
Employee Costs Employee costs include salaries and wages paid, superannuation and workers compensation expenses as well as other costs
incurred as a result of employing staff. This item only includes employment costs in service delivery areas. Wages on asset
areas such as roads are reflected in other catagories of expenditure
Operating Costs Operating costs is the day to day costs incurred in the normal operations of council in service delivery on non-infrastructure
areas
Asset Maintenance Direct periodic cost incurred to keep an asset as close as possible to its original condition without extending its original life.
Asset Operations Expenses incurred in the general use of an asset
Interest Payments Interest charged by financial institutions on the outstanding balance of loan funds
Asset Depreciation This is the recognition of the consumption (or cost) of a portion of the useful life of an asset during the current year
Attribution Costs Internal charges against each activity within council to reflect the true cost of providing that service
Capital Grants Capital grants are funds provided by third parties (generally other levels of government) towards the cost of major asset
renewal or upgrades
1

Definition
Definition of Terms in relation to this document
Term Definition
Developer Conts Developer contributions are payments (in kind or cash) provided by developers to help defray the additional infrastructure
costs being incurred by council as the result of land development
Other Capital Conts Capital contributions are funds provided by third parties towards the cost of major asset renewal or upgrades
Asset Sales The sale of council assets no longer required for the operations of council.
Land Sales The sale of land owned by council but surplus to its needs.
Reserves Tfr From A transfer from reserves is utilising funds quarantined during prior periods to be used in the current budget period
Loan Proceeds Loan proceeds are the initial borrowings from a financial institution to assist in funding particular planned projects within the
current budget period
Depreciation Cashflow This is the reversal of the depreciation expensed in the operating budget (not a cash item)
Asset Renewals Expenditure on an existing asset which returns the service potential of the life of the asset to its original state.
Asset Upgrade/New Infrastructure upgrade/new is expenditure used to create new assets or to increase the capacity of existing assets beyond
their original service potential and/or life of the asset
Asset Purchases The purchase of a resource to be used for the operations of council, and expected to provide a benefit for a period greater
than one year.
Principal Repayments This is the amount being repaid to the lender to reduce the amount owing for funds borrowed
Reserves Tfr To This is placing current year funds aside for use in future financial years
2

Summary
Statement of Responsible Accounting Officer
Lucas Scarpin
Responsible Accounting Officer
Date : 25-03-2015
The following statement is made in accordance with clause 203(2) of the Local Government (General) Regulations 2005
It is my opinion that the Quarterly Budget Review Statement for Bega Valley Shire Council for the quarter ended December indicates that Council's
projected financial position at 30th June 2015 will be satisfactory, having regard to the projected estimates of income and expenditure and the
original budgeted income and expenditure.
3

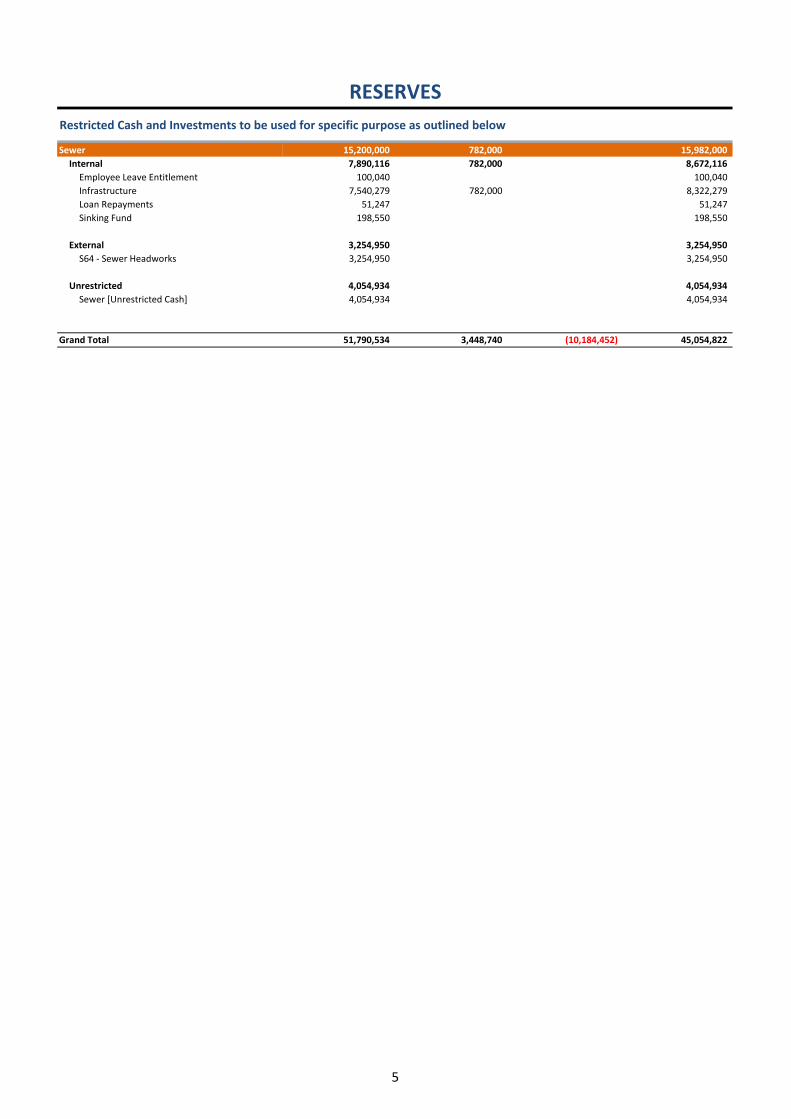
RESERVES
Restricted Cash and Investments to be used for specific purpose as outlined below
Opening Balance Transfer To Transfer From Closing Balance
General 14,127,958 2,235,840 (7,697,452) 8,666,346
Internal 9,625,913 1,594,840 (5,379,970) 5,707,345
Airport 10,003 159,520 169,523
Animal Control 32,106 32,106
Children Services 926,864 (73,585) 853,279
Committee Funds 614,845 614,845
Community Projects 387,866 (50,000) 337,866
Election 92,890 55,000 147,890
Employee Leave Entitlement 1,928,429 (250,000) 1,678,429
Environmental 452,569 170,000 (601,070) 21,499
Information Technology 377,000 377,000
Infrastructure 474,546 268,320 742,866
Operational Examination Contigency 130,500 130,500
Property Development 2,818,355 756,000 (3,500,000) 74,355
Recreation 952,614 (611,425) 341,189
Stormwater Management [Annual Charge]
Tourism 345,258 186,000 (345,260) 185,998
Unspent Grant [Council Contribution] 82,069 (82,069)
External 4,502,044 641,000 (2,317,482) 2,959,003
Other Contribution - Tathra Estate 41,000 41,000
S94 - Carparking 938,606 938,606
S94 - Community Facilities 57,700 (57,700)
S94 - Land Acquisitions 12,820 (12,820)
S94 - Open Space and Recreation 372,346 89,740 (89,740) 372,346
S94 - Plan Administration 6,400 (6,400)
S94 - Roads 300,664 448,700 (448,700) 300,664
S94 - Streetscapes 25,640 (25,640)
Unspent Grants 797,669 (797,669)
Unspent Loans 2,051,760 (745,373) 1,306,387
Plant 555,226 65,900 621,126
Internal 555,226 65,900 621,126
Plant Replacement 555,226 65,900 621,126
Waste 5,111,351 365,000 (515,000) 4,961,351
Internal 342,762 365,000 707,762
Waste [Other] 342,762 365,000 707,762
External 4,768,589 (515,000) 4,253,589
Waste [Domestic] 4,768,589 (515,000) 4,253,589
Water 16,796,000 (1,972,000) 14,824,000
Internal 8,947,863 (1,972,000) 6,975,863
Employee Leave Entitlement 100,000 100,000
Infrastructure 8,847,863 (1,972,000) 6,875,863
External 5,099,274 5,099,274
S64 - Water Headworks 5,099,274 5,099,274
Unrestricted 2,748,863 2,748,863
Water [Unrestricted Cash] 2,748,863 2,748,863
4
RESERVES
Restricted Cash and Investments to be used for specific purpose as outlined below
Sewer 15,200,000 782,000 15,982,000
Internal 7,890,116 782,000 8,672,116
Employee Leave Entitlement 100,040 100,040
Infrastructure 7,540,279 782,000 8,322,279
Loan Repayments 51,247 51,247
Sinking Fund 198,550 198,550
External 3,254,950 3,254,950
S64 - Sewer Headworks 3,254,950 3,254,950
Unrestricted 4,054,934 4,054,934
Sewer [Unrestricted Cash] 4,054,934 4,054,934
Grand Total 51,790,534 3,448,740 (10,184,452) 45,054,822
5
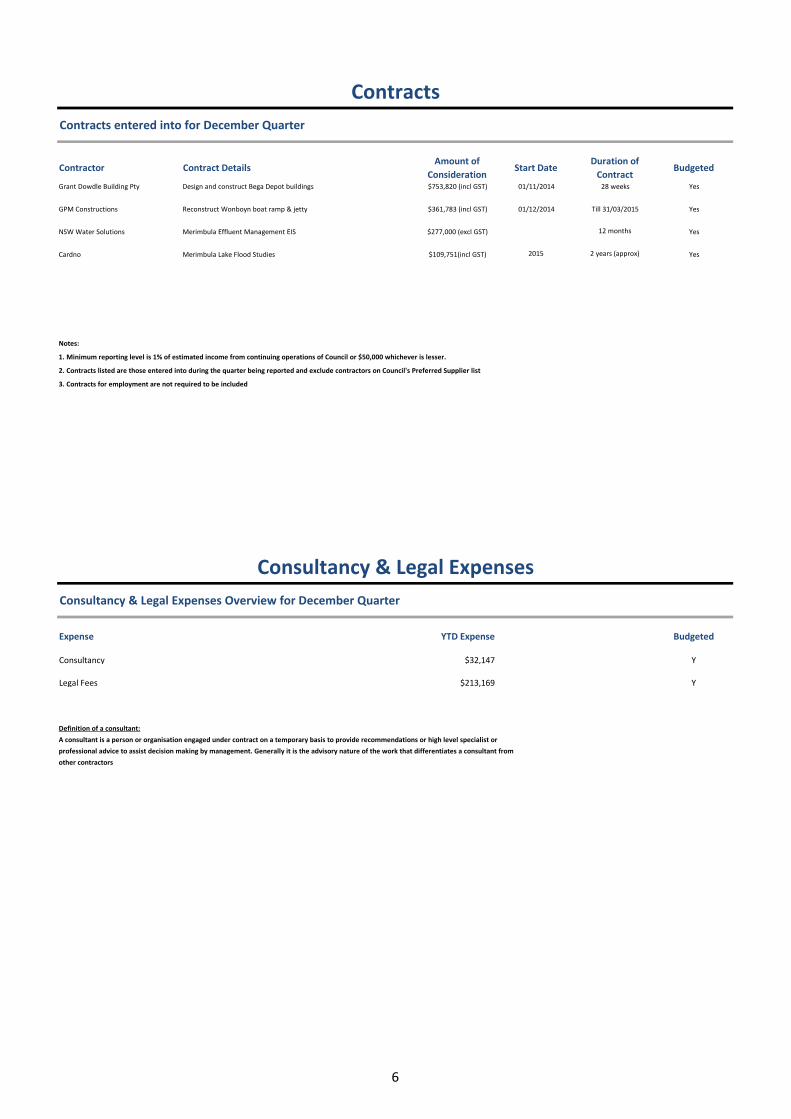
Contracts
Contracts entered into for December Quarter
Contractor Contract DetailsAmount of
ConsiderationStart Date
Duration of
ContractBudgeted
Grant Dowdle Building Pty Design and construct Bega Depot buildings $753,820 (incl GST) 01/11/2014 28 weeks Yes
GPM Constructions Reconstruct Wonboyn boat ramp & jetty $361,783 (incl GST) 01/12/2014 Till 31/03/2015 Yes
NSW Water Solutions Merimbula Effluent Management EIS $277,000 (excl GST) 12 months Yes
Cardno Merimbula Lake Flood Studies $109,751(incl GST) 2015 2 years (approx) Yes
Notes:
1. Minimum reporting level is 1% of estimated income from continuing operations of Council or $50,000 whichever is lesser.
2. Contracts listed are those entered into during the quarter being reported and exclude contractors on Council's Preferred Supplier list
3. Contracts for employment are not required to be included
Consultancy & Legal Expenses
Consultancy & Legal Expenses Overview for December Quarter
Expense YTD Expense Budgeted
Consultancy $32,147 Y
Legal Fees $213,169 Y
Definition of a consultant:
A consultant is a person or organisation engaged under contract on a temporary basis to provide recommendations or high level specialist or
professional advice to assist decision making by management. Generally it is the advisory nature of the work that differentiates a consultant from
other contractors
6

Bega Valley Shire Council [All Funds]
45% 5%
2015 Budget Revision 2015 2015 2015 Actuals as %
Original September December March June Revised YTD YTD of Revised
Budget Quarter Quarter Quarter Quarter Budget Budget Actuals Budget
Operating Budget
Rates 44,770,000 44,770,000 44,770,000 44,777,907 100%
Fees & Charges 21,665,260 (107,840) 383,600 21,941,020 10,135,730 9,633,304 44%
Grants 13,776,615 45,280 (91,020) 13,730,875 6,865,434 7,439,036 54%
Other Revenues 2,899,040 24,100 148,200 3,071,340 1,535,670 1,335,989 43%
Lease Income 256,000 510 114,920 371,430 185,712 224,062 60%
Attribution Revenue 16,550,000 16,550,000 8,274,990 8,339,483 50%
Total Revenue 99,916,915 (37,950) 555,700 100,434,665 71,767,536 71,749,781 71%
Employment Costs 21,795,910 (142,520) 270,000 21,923,390 10,961,712 10,926,994 50%
Operating Costs 15,345,985 672,055 465,407 16,483,447 8,695,228 7,655,898 46%
Asset Maintenance 11,507,850 (76,781) (19,000) 11,412,069 5,706,048 5,358,920 47%
Asset Operations 14,599,800 14,275 19,000 14,633,075 7,316,538 6,354,820 43%
Interest Payments 2,178,000 2,178,000 1,089,000 818,143 38%
Asset Depreciation
Attribution Costs 12,400,000 12,400,000 6,199,962 6,200,000 50%
Total Expenses 77,827,545 467,029 735,407 79,029,981 39,968,488 37,314,776 47%
Operating Surplus/ (Deficit) 22,089,370 (504,979) (179,707) 21,404,684 31,799,048 34,435,006 161%
Capital Budget
Capital Grants 1,893,000 1,419,782 249,000 3,561,782 1,780,890 1,775,526 50%
Developer Conts 3,215,000 3,215,000 1,607,496 645,513 20%
Other Capital Conts 18,000 18,000 8,994 140,564 781%
Asset Sales 1,770,000 292,000 2,062,000 1,030,998 1,208,107 59%
Land Sales 264,000 264,000 132,000 100,000 38%
Reserves Tfr From 3,628,650 1,977,364 4,578,438 10,184,452 5,092,290 0%
Loan Proceeds 3,170,000 3,170,000 1,585,002 0%
Depreciation Cashflow
Total Receipts 13,940,650 3,689,146 4,845,438 22,475,234 11,237,670 3,869,709 17%
Asset Renewals 16,157,000 2,095,065 (542,362) 17,709,703 8,854,890 5,102,170 29%
Asset Upgrade/New 10,681,000 797,102 4,525,373 16,003,475 8,001,738 4,360,556 27%
Asset Purchases 3,782,000 3,782,000 1,891,002 2,307,654 61%
Principal Repayments 2,868,000 2,868,000 1,433,988 1,590,008 55%
Reserves Tfr To 2,542,020 292,000 682,720 3,516,740 1,758,252 0%
Total Payments 36,030,020 3,184,167 4,665,731 43,879,918 21,939,870 13,360,388 30%
Capital Surplus/ (Deficit) (22,089,370) 504,979 179,707 (21,404,684) (10,702,200) (9,490,679) 44%
SURPLUS/(DEFICIT) 21,096,848 24,944,327
General Revenue Funding
Overall Surplus/(Deficit) 21,096,848 24,944,327
Note1 Internal transactions have not been eliminated from this report
COMMENTARYCouncil is in sound financial position and tracking well compared to estimates. There are few budget revisions made in this quarter that are detailed in Function
level of this budget review document
Rates Coverage Ratio Debt Service Ratio
7

Bega Valley Shire Council [All Funds]
11%
Directorate Grants $ Fees $ Gen Rev $ Health
Community, Relations and Leisure 1,680,094 1,061,534 4,009,086
Organisation Development and Governance 1,969,513
Planning and Environment 240,697 1,099,720 1,415,424
Strategy and Business Services 2,860,808 76,692
Transport and Utilities 4,432,963 7,395,358 3,173,674
Funding
% Funded by Grants
-
20,000,000
40,000,000
60,000,000
80,000,000
100,000,000
120,000,000
Overall Expense Progress
Employment Cost Operating Cost Capital Cost Actual
-
2,000,000
4,000,000
6,000,000
8,000,000
10,000,000
Monthly Expense Progress
Employment Cost Operating Cost Capital Cost Actual
-
20,000,000
40,000,000
60,000,000
80,000,000
100,000,000
120,000,000
Overall Income Progress
Rates Income Operating Income Capital Income Actual
-
10,000,000
20,000,000
30,000,000
40,000,000
50,000,000
60,000,000
Monthly Income Progress
Rates Income Operating Income Capital Income Actual
8

Bega Valley Shire Council [General Fund]
36% 4%
2015 Budget Revision 2015 2015 2015 Actuals as %
Original September December March June Revised YTD YTD of Revised
Budget Quarter Quarter Quarter Quarter Budget Budget Actuals Budget
Operating Budget
Rates 20,615,000 20,615,000 20,615,000 20,574,562 100%
Fees & Charges 5,578,260 (107,840) 18,600 5,489,020 2,744,538 2,568,442 47%
Grants 13,332,615 45,280 (91,020) 13,286,875 6,643,434 7,009,283 53%
Other Revenues 1,477,040 24,100 148,200 1,649,340 824,664 1,010,391 61%
Lease Income 255,000 510 114,920 370,430 185,214 207,720 56%
Attribution Revenue 16,550,000 16,550,000 8,274,990 8,339,483 50%
Total Revenue 57,807,915 (37,950) 190,700 57,960,665 39,287,840 39,709,881 69%
Employment Costs 19,640,810 (142,520) 270,000 19,768,290 9,884,166 10,025,349 51%
Operating Costs 9,675,985 672,055 463,407 10,811,447 5,719,726 5,491,433 51%
Asset Maintenance 6,318,850 (76,781) (17,000) 6,225,069 3,112,548 3,083,001 50%
Asset Operations 4,178,800 14,275 19,000 4,212,075 2,106,042 1,900,388 45%
Interest Payments 742,000 742,000 371,004 338,729 46%
Asset Depreciation
Attribution Costs 6,577,000 6,577,000 3,288,468 3,288,500 50%
Total Expenses 47,133,445 467,029 735,407 48,335,881 24,481,954 24,127,400 50%
Operating Surplus/ (Deficit) 10,674,470 (504,979) (544,707) 9,624,784 14,805,886 15,582,482 162%
Capital Budget
Capital Grants 1,893,000 1,419,782 249,000 3,561,782 1,780,890 1,775,526 50%
Developer Conts 641,000 641,000 320,496 242,917 38%
Other Capital Conts 18,000 18,000 8,994 18,000 100%
Asset Sales 292,000 292,000 145,998 292,000 100%
Land Sales 264,000 264,000 132,000 100,000 38%
Reserves Tfr From 1,141,650 1,977,364 4,578,438 7,697,452 3,848,790 0%
Loan Proceeds 3,170,000 3,170,000 1,585,002 0%
Depreciation Cashflow
Total Receipts 7,109,650 3,689,146 4,845,438 15,644,234 7,822,170 2,428,443 16%
Asset Renewals 11,668,000 2,095,065 (542,362) 13,220,703 6,610,386 3,550,526 27%
Asset Upgrade/New 2,579,000 797,102 4,525,373 7,901,475 3,950,742 3,117,407 39%
Asset Purchases 90,000 90,000 45,000 287,700 320%
Principal Repayments 1,753,000 1,753,000 876,492 933,279 53%
Reserves Tfr To 1,694,120 292,000 317,720 2,303,840 1,151,868 0%
Total Payments 17,784,120 3,184,167 4,300,731 25,269,018 12,634,488 7,888,913 31%
Capital Surplus/ (Deficit) (10,674,470) 504,979 544,707 (9,624,784) (4,812,318) (5,460,470) 57%
SURPLUS/(DEFICIT) 9,993,568 10,122,012
General Revenue Funding
Overall Surplus/(Deficit) 9,993,568 10,122,012
Note1 Internal transactions have not been eliminated from this report
COMMENTARYGeneral Fund budget remains on track during end of the quarter. Main movements in General Fund relates to revoting of Civic Centre project funded through
previously restricted asset at Year End. Other items being Fitout of Bega Office following the restructure, adjustments to emergency services levy and revoting of
enviornmental projects, most of them funded through reserve transfers.
Also movements in employment cost were due to unbudgeted employee leave entitlements paid out during the year for leaving staff funded out of restricted
assets.
You'll notice that there are no actuals against the Reserve Transfer lines, this is due to the reserves transfers not been finalised.
Rates Coverage Ratio Debt Service Ratio
9

Bega Valley Shire Council [General Fund]
18%% Funded by Grants
- 10,000,000 20,000,000 30,000,000 40,000,000 50,000,000 60,000,000 70,000,000
Overall Expense Progress
Employment Cost Operating Cost Capital Cost Actual
- 1,000,000 2,000,000 3,000,000 4,000,000 5,000,000 6,000,000 7,000,000
Monthly Expense Progress
Employment Cost Operating Cost Capital Cost Actual
- 10,000,000 20,000,000 30,000,000 40,000,000 50,000,000 60,000,000 70,000,000
Overall Income Progress
Rates Income Operating Income Capital Income Actual
-
5,000,000
10,000,000
15,000,000
20,000,000
25,000,000
30,000,000
Monthly Income Progress
Rates Income Operating Income Capital Income Actual
10
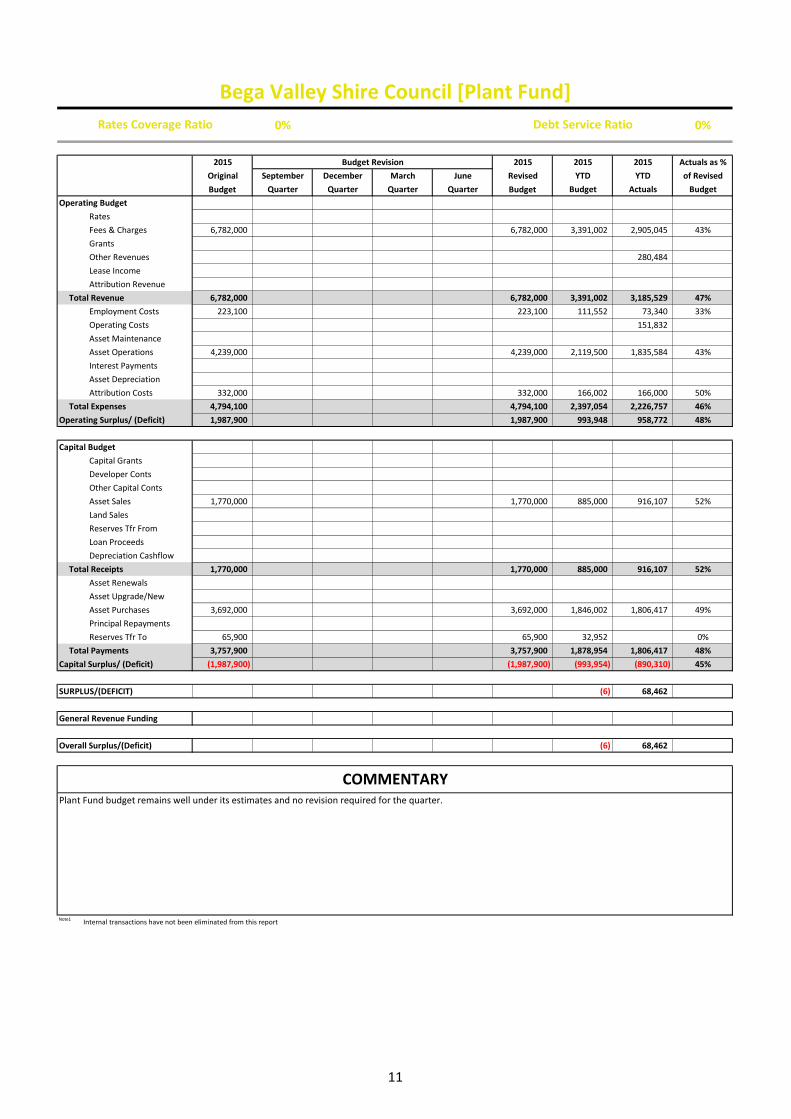
Bega Valley Shire Council [Plant Fund]
0% 0%
2015 Budget Revision 2015 2015 2015 Actuals as %
Original September December March June Revised YTD YTD of Revised
Budget Quarter Quarter Quarter Quarter Budget Budget Actuals Budget
Operating Budget
Rates
Fees & Charges 6,782,000 6,782,000 3,391,002 2,905,045 43%
Grants
Other Revenues 280,484
Lease Income
Attribution Revenue
Total Revenue 6,782,000 6,782,000 3,391,002 3,185,529 47%
Employment Costs 223,100 223,100 111,552 73,340 33%
Operating Costs 151,832
Asset Maintenance
Asset Operations 4,239,000 4,239,000 2,119,500 1,835,584 43%
Interest Payments
Asset Depreciation
Attribution Costs 332,000 332,000 166,002 166,000 50%
Total Expenses 4,794,100 4,794,100 2,397,054 2,226,757 46%
Operating Surplus/ (Deficit) 1,987,900 1,987,900 993,948 958,772 48%
Capital Budget
Capital Grants
Developer Conts
Other Capital Conts
Asset Sales 1,770,000 1,770,000 885,000 916,107 52%
Land Sales
Reserves Tfr From
Loan Proceeds
Depreciation Cashflow
Total Receipts 1,770,000 1,770,000 885,000 916,107 52%
Asset Renewals
Asset Upgrade/New
Asset Purchases 3,692,000 3,692,000 1,846,002 1,806,417 49%
Principal Repayments
Reserves Tfr To 65,900 65,900 32,952 0%
Total Payments 3,757,900 3,757,900 1,878,954 1,806,417 48%
Capital Surplus/ (Deficit) (1,987,900) (1,987,900) (993,954) (890,310) 45%
SURPLUS/(DEFICIT) (6) 68,462
General Revenue Funding
Overall Surplus/(Deficit) (6) 68,462
Note1 Internal transactions have not been eliminated from this report
COMMENTARYPlant Fund budget remains well under its estimates and no revision required for the quarter.
Rates Coverage Ratio Debt Service Ratio
11

Bega Valley Shire Council [Plant Fund]
0%% Funded by Grants
-
2,000,000
4,000,000
6,000,000
8,000,000
10,000,000
Overall Expense Progress
Employment Cost Operating Cost Capital Cost Actual
- 200,000 400,000 600,000 800,000
1,000,000 1,200,000 1,400,000
Monthly Expense Progress
Employment Cost Operating Cost Capital Cost Actual
-
2,000,000
4,000,000
6,000,000
8,000,000
10,000,000
Overall Income Progress
Rates Income Operating Income Capital Income Actual
-
200,000
400,000
600,000
800,000
1,000,000
1,200,000
Monthly Income Progress
Rates Income Operating Income Capital Income Actual
12

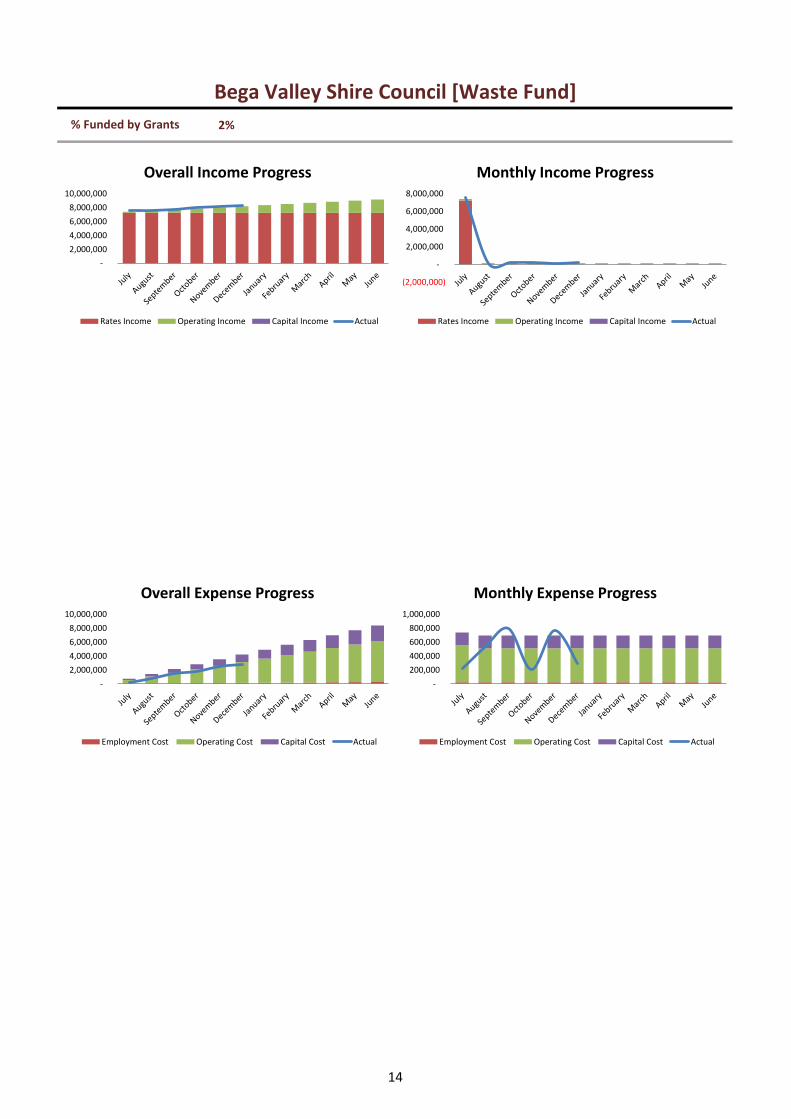
Bega Valley Shire Council [Waste Fund]
79% 0%
2015 Budget Revision 2015 2015 2015 Actuals as %
Original September December March June Revised YTD YTD of Revised
Budget Quarter Quarter Quarter Quarter Budget Budget Actuals Budget
Operating Budget
Rates 7,238,000 7,238,000 7,238,000 7,298,651 101%
Fees & Charges 1,200,000 365,000 1,565,000 782,436 893,746 57%
Grants 180,000 180,000 90,000 157,182 87%
Other Revenues 185,000 185,000 92,502 8,968 5%
Lease Income 1,000 1,000 498 706 71%
Attribution Revenue
Total Revenue 8,804,000 365,000 9,169,000 8,203,436 8,359,253 91%
Employment Costs 286,000 286,000 142,998 113,844 40%
Operating Costs 3,387,000 3,387,000 1,714,996 1,237,012 37%
Asset Maintenance 2,498,000 2,498,000 1,249,002 1,053,530 42%
Asset Operations 7,006
Interest Payments 7,000 7,000 3,498 2,844 41%
Asset Depreciation
Attribution Costs 914,000 914,000 457,002 457,000 50%
Total Expenses 7,092,000 7,092,000 3,567,496 2,871,236 40%
Operating Surplus/ (Deficit) 1,712,000 365,000 2,077,000 4,635,940 5,488,017 264%
Capital Budget
Capital Grants
Developer Conts
Other Capital Conts
Asset Sales
Land Sales
Reserves Tfr From 515,000 515,000 257,502 0%
Loan Proceeds
Depreciation Cashflow
Total Receipts 515,000 515,000 257,502 0%
Asset Renewals 292,892
Asset Upgrade/New 2,215,000 2,215,000 1,107,498 118,177 5%
Asset Purchases
Principal Repayments 12,000 12,000 6,000 12,290 102%
Reserves Tfr To 365,000 365,000 182,430 0%
Total Payments 2,227,000 365,000 2,592,000 1,295,928 423,358 16%
Capital Surplus/ (Deficit) (1,712,000) (365,000) (2,077,000) (1,038,426) (423,358) 20%
SURPLUS/(DEFICIT) 3,597,514 5,064,659
General Revenue Funding
Overall Surplus/(Deficit) 3,597,514 5,064,659
Note1 Internal transactions have not been eliminated from this report
COMMENTARYWaste Fund is tracking well compared to its estimates. There is a positive variance due to increase in gate income at the waste facilites across council. This has
been restricted to fund future waste capital program.
Rates Coverage Ratio Debt Service Ratio
13
Bega Valley Shire Council [Waste Fund]
2%% Funded by Grants
-
2,000,000
4,000,000
6,000,000
8,000,000
10,000,000
Overall Expense Progress
Employment Cost Operating Cost Capital Cost Actual
-
200,000
400,000
600,000
800,000
1,000,000
Monthly Expense Progress
Employment Cost Operating Cost Capital Cost Actual
-
2,000,000
4,000,000
6,000,000
8,000,000
10,000,000
Overall Income Progress
Rates Income Operating Income Capital Income Actual
(2,000,000)
-
2,000,000
4,000,000
6,000,000
8,000,000
Monthly Income Progress
Rates Income Operating Income Capital Income Actual
14
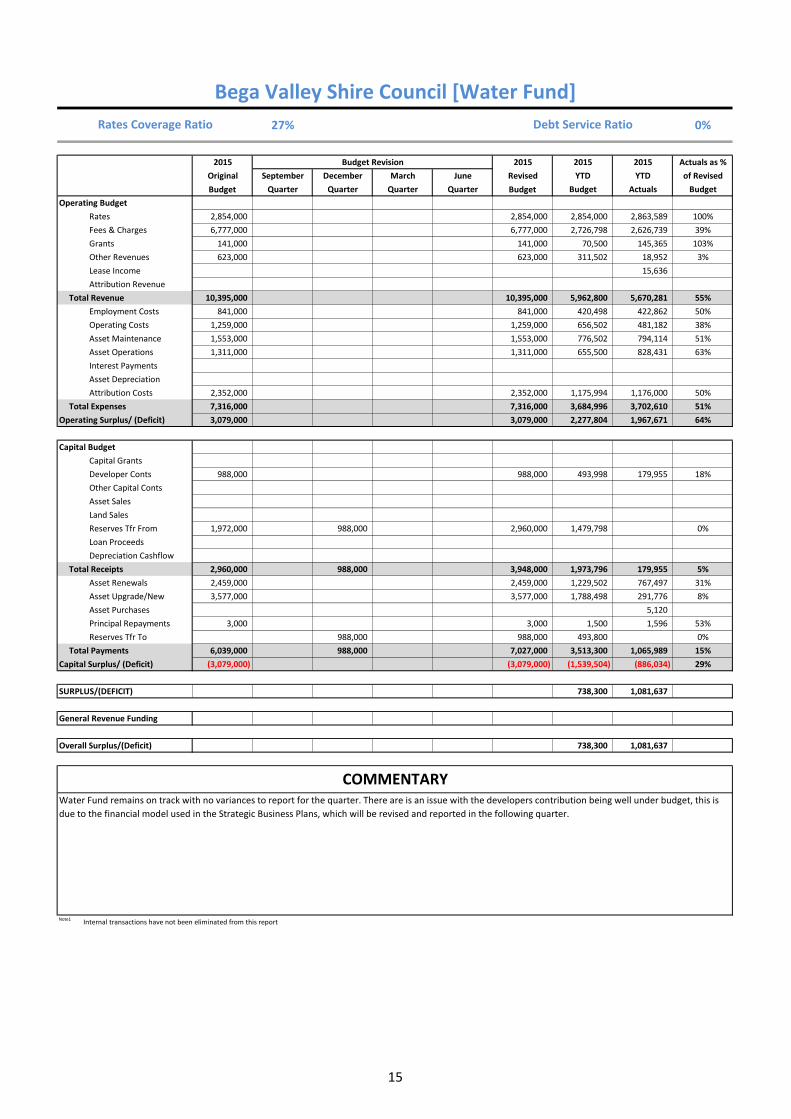
Bega Valley Shire Council [Water Fund]
27% 0%
2015 Budget Revision 2015 2015 2015 Actuals as %
Original September December March June Revised YTD YTD of Revised
Budget Quarter Quarter Quarter Quarter Budget Budget Actuals Budget
Operating Budget
Rates 2,854,000 2,854,000 2,854,000 2,863,589 100%
Fees & Charges 6,777,000 6,777,000 2,726,798 2,626,739 39%
Grants 141,000 141,000 70,500 145,365 103%
Other Revenues 623,000 623,000 311,502 18,952 3%
Lease Income 15,636
Attribution Revenue
Total Revenue 10,395,000 10,395,000 5,962,800 5,670,281 55%
Employment Costs 841,000 841,000 420,498 422,862 50%
Operating Costs 1,259,000 1,259,000 656,502 481,182 38%
Asset Maintenance 1,553,000 1,553,000 776,502 794,114 51%
Asset Operations 1,311,000 1,311,000 655,500 828,431 63%
Interest Payments
Asset Depreciation
Attribution Costs 2,352,000 2,352,000 1,175,994 1,176,000 50%
Total Expenses 7,316,000 7,316,000 3,684,996 3,702,610 51%
Operating Surplus/ (Deficit) 3,079,000 3,079,000 2,277,804 1,967,671 64%
Capital Budget
Capital Grants
Developer Conts 988,000 988,000 493,998 179,955 18%
Other Capital Conts
Asset Sales
Land Sales
Reserves Tfr From 1,972,000 988,000 2,960,000 1,479,798 0%
Loan Proceeds
Depreciation Cashflow
Total Receipts 2,960,000 988,000 3,948,000 1,973,796 179,955 5%
Asset Renewals 2,459,000 2,459,000 1,229,502 767,497 31%
Asset Upgrade/New 3,577,000 3,577,000 1,788,498 291,776 8%
Asset Purchases 5,120
Principal Repayments 3,000 3,000 1,500 1,596 53%
Reserves Tfr To 988,000 988,000 493,800 0%
Total Payments 6,039,000 988,000 7,027,000 3,513,300 1,065,989 15%
Capital Surplus/ (Deficit) (3,079,000) (3,079,000) (1,539,504) (886,034) 29%
SURPLUS/(DEFICIT) 738,300 1,081,637
General Revenue Funding
Overall Surplus/(Deficit) 738,300 1,081,637
Note1 Internal transactions have not been eliminated from this report
COMMENTARYWater Fund remains on track with no variances to report for the quarter. There are is an issue with the developers contribution being well under budget, this is
due to the financial model used in the Strategic Business Plans, which will be revised and reported in the following quarter.
Rates Coverage Ratio Debt Service Ratio
15

Bega Valley Shire Council [Water Fund]
1%% Funded by Grants
-
2,000,000
4,000,000
6,000,000
8,000,000
10,000,000
12,000,000
Overall Expense Progress
Employment Cost Operating Cost Capital Cost Actual
-
200,000
400,000
600,000
800,000
1,000,000
1,200,000
Monthly Expense Progress
Employment Cost Operating Cost Capital Cost Actual
-
2,000,000
4,000,000
6,000,000
8,000,000
10,000,000
12,000,000
Overall Income Progress
Rates Income Operating Income Capital Income Actual
- 500,000
1,000,000 1,500,000 2,000,000 2,500,000 3,000,000 3,500,000
Monthly Income Progress
Rates Income Operating Income Capital Income Actual
16
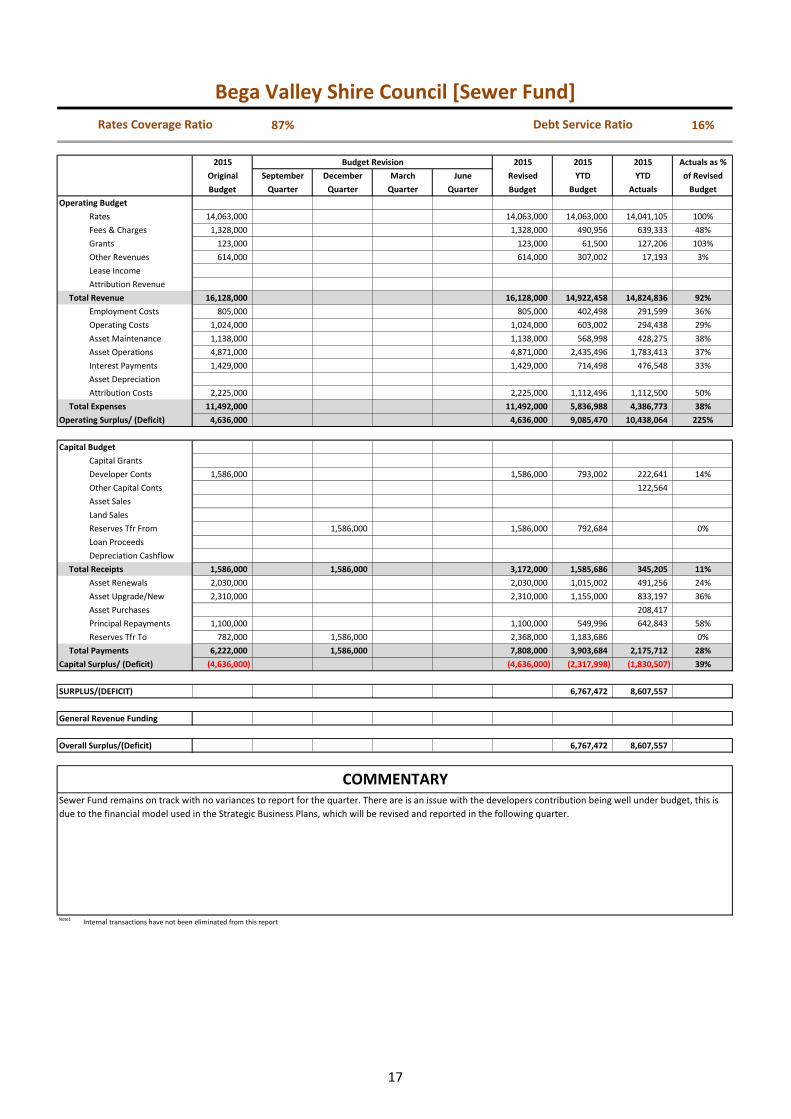
Bega Valley Shire Council [Sewer Fund]
87% 16%
2015 Budget Revision 2015 2015 2015 Actuals as %
Original September December March June Revised YTD YTD of Revised
Budget Quarter Quarter Quarter Quarter Budget Budget Actuals Budget
Operating Budget
Rates 14,063,000 14,063,000 14,063,000 14,041,105 100%
Fees & Charges 1,328,000 1,328,000 490,956 639,333 48%
Grants 123,000 123,000 61,500 127,206 103%
Other Revenues 614,000 614,000 307,002 17,193 3%
Lease Income
Attribution Revenue
Total Revenue 16,128,000 16,128,000 14,922,458 14,824,836 92%
Employment Costs 805,000 805,000 402,498 291,599 36%
Operating Costs 1,024,000 1,024,000 603,002 294,438 29%
Asset Maintenance 1,138,000 1,138,000 568,998 428,275 38%
Asset Operations 4,871,000 4,871,000 2,435,496 1,783,413 37%
Interest Payments 1,429,000 1,429,000 714,498 476,548 33%
Asset Depreciation
Attribution Costs 2,225,000 2,225,000 1,112,496 1,112,500 50%
Total Expenses 11,492,000 11,492,000 5,836,988 4,386,773 38%
Operating Surplus/ (Deficit) 4,636,000 4,636,000 9,085,470 10,438,064 225%
Capital Budget
Capital Grants
Developer Conts 1,586,000 1,586,000 793,002 222,641 14%
Other Capital Conts 122,564
Asset Sales
Land Sales
Reserves Tfr From 1,586,000 1,586,000 792,684 0%
Loan Proceeds
Depreciation Cashflow
Total Receipts 1,586,000 1,586,000 3,172,000 1,585,686 345,205 11%
Asset Renewals 2,030,000 2,030,000 1,015,002 491,256 24%
Asset Upgrade/New 2,310,000 2,310,000 1,155,000 833,197 36%
Asset Purchases 208,417
Principal Repayments 1,100,000 1,100,000 549,996 642,843 58%
Reserves Tfr To 782,000 1,586,000 2,368,000 1,183,686 0%
Total Payments 6,222,000 1,586,000 7,808,000 3,903,684 2,175,712 28%
Capital Surplus/ (Deficit) (4,636,000) (4,636,000) (2,317,998) (1,830,507) 39%
SURPLUS/(DEFICIT) 6,767,472 8,607,557
General Revenue Funding
Overall Surplus/(Deficit) 6,767,472 8,607,557
Note1 Internal transactions have not been eliminated from this report
COMMENTARYSewer Fund remains on track with no variances to report for the quarter. There are is an issue with the developers contribution being well under budget, this is
due to the financial model used in the Strategic Business Plans, which will be revised and reported in the following quarter.
Rates Coverage Ratio Debt Service Ratio
17

Bega Valley Shire Council [Sewer Fund]
1%% Funded by Grants
- 2,000,000 4,000,000 6,000,000 8,000,000
10,000,000 12,000,000 14,000,000
Overall Expense Progress
Employment Cost Operating Cost Capital Cost Actual
- 200,000 400,000 600,000 800,000
1,000,000 1,200,000 1,400,000
Monthly Expense Progress
Employment Cost Operating Cost Capital Cost Actual
-
5,000,000
10,000,000
15,000,000
20,000,000
Overall Income Progress
Rates Income Operating Income Capital Income Actual
(5,000,000)
-
5,000,000
10,000,000
15,000,000
20,000,000
Monthly Income Progress
Rates Income Operating Income Capital Income Actual
18

Group | Community, Relations and Leisure
30%
2015 Budget Revision 2015 2015 2015 Actuals as %
Original September December March June Revised YTD YTD of Revised
Budget Quarter Quarter Quarter Quarter Budget Budget Actuals Budget
Operating Budget
Rates 1,082,400 1,082,400 1,082,400 541,200 50%
Fees & Charges 2,760,655 (107,840) 33,000 2,685,815 1,342,920 1,061,534 40%
Grants 2,495,245 117,710 2,612,955 1,306,470 1,380,094 53%
Other Revenues 94,540 3,100 18,000 115,640 57,810 64,733 56%
Lease Income 178,000 510 8,000 186,510 93,258 123,577 66%
Attribution Revenue 1,350,000 1,350,000 675,000 675,000 50%
Total Revenue 7,960,840 13,480 59,000 8,033,320 4,557,858 3,846,138 48%
Employment Costs 5,989,665 85,960 20,000 6,095,625 3,047,814 3,080,922 51%
Operating Costs 2,264,485 274,470 2,538,955 1,269,468 850,545 33%
Asset Maintenance 619,850 15,050 634,900 317,448 320,626 51%
Asset Operations 1,478,800 14,275 1,493,075 746,550 767,080 51%
Interest Payments 245,000 245,000 122,502 79,447 32%
Asset Depreciation
Attribution Costs 1,622,000 1,622,000 810,966 811,000 50%
Total Expenses 12,219,800 389,755 20,000 12,629,555 6,314,748 5,909,621 47%
Operating Surplus/ (Deficit) (4,258,960) (376,275) 39,000 (4,596,235) (1,756,890) (2,063,483) 45%
Capital Budget
Capital Grants 300,000 300,000 150,000 300,000 100%
Developer Conts
Other Capital Conts 8,000 8,000 3,996 8,000 100%
Asset Sales
Land Sales
Reserves Tfr From 220,830 1,156,828 4,145,373 5,523,031 2,761,482 0%
Loan Proceeds
Depreciation Cashflow
Total Receipts 520,830 1,156,828 4,153,373 5,831,031 2,915,478 308,000 5%
Asset Renewals 1,592,000 518,005 (277,000) 1,833,005 916,578 342,054 19%
Asset Upgrade/New 583,000 343,207 4,145,373 5,071,580 2,535,792 1,671,473 33%
Asset Purchases 90,000 90,000 45,000 65,076 72%
Principal Repayments 254,000 254,000 126,996 175,000 69%
Reserves Tfr To 68,000 68,000 33,996 0%
Total Payments 2,519,000 861,212 3,936,373 7,316,585 3,658,362 2,253,604 31%
Capital Surplus/ (Deficit) (1,998,170) 295,616 217,000 (1,485,554) (742,884) (1,945,604) 131%
SURPLUS/(DEFICIT) (6,257,130) (80,659) 256,000 (6,081,789) (2,499,774) (4,009,086)
General Revenue Funding (6,257,130) (80,659) 256,000 (6,081,789) (2,499,774) (4,009,086) 66%
Overall Surplus/(Deficit)
Note1 Internal transactions have not been eliminated from this report
COMMENTARYCommunity, Relations and Leisure budget remains on track during end of the quarter. Main movements in the group relates to revoting of Civic Centre project,
funded through previosly restricted asset as Year End.
% Funded by Gen Revenue $ Funded by Gen Revenue 6,081,789
19

Group Manager | Anthony Basford
13%
Functions Grants $ Fees $ Gen Rev $ Health
Children Services 904,745 410,463 48,608
Communications and Community Information 13,363 879,936
Community and Culture 475,349 186,402 2,268,734
Community, Relations and Leisure 270 136,656
Leisure 300,000 451,036 675,152
Funding
% Funded by Grants
-
5,000,000
10,000,000
15,000,000
20,000,000
Overall Expense Progress
Employment Cost Operating Cost Capital Cost Actual
-
500,000
1,000,000
1,500,000
2,000,000
Monthly Expense Progress
Employment Cost Operating Cost Capital Cost Actual
-
2,000,000
4,000,000
6,000,000
8,000,000
10,000,000
Overall Income Progress
Rates Income Operating Income Capital Income Actual
-
500,000
1,000,000
1,500,000
2,000,000
Monthly Income Progress
Rates Income Operating Income Capital Income Actual
20

Function | Children Services
10%
2015 Budget Revision 2015 2015 2015 Actuals as %
Original September December March June Revised YTD YTD of Revised
Budget Quarter Quarter Quarter Quarter Budget Budget Actuals Budget
Operating Budget
Rates
Fees & Charges 1,258,655 (107,840) 1,150,815 575,418 410,463 36%
Grants 1,089,545 100,210 1,189,755 594,870 904,745 76%
Other Revenues 35,540 35,540 17,766 2,351 7%
Lease Income
Attribution Revenue
Total Revenue 2,383,740 (7,630) 2,376,110 1,188,054 1,317,558 55%
Employment Costs 1,937,955 5,275 1,943,230 971,622 983,811 51%
Operating Costs 286,885 5,060 291,945 145,962 112,813 39%
Asset Maintenance 146,850 (2,950) 143,900 71,946 100,074 70%
Asset Operations 59,800 33,000 92,800 46,404 38,469 41%
Interest Payments
Asset Depreciation
Attribution Costs 262,000 262,000 130,998 131,000 50%
Total Expenses 2,693,490 40,385 2,733,875 1,366,932 1,366,166 50%
Operating Surplus/ (Deficit) (309,750) (48,015) (357,765) (178,878) (48,608) 14%
Capital Budget
Capital Grants
Developer Conts
Other Capital Conts
Asset Sales
Land Sales
Reserves Tfr From 47,750 25,835 73,585 36,792 0%
Loan Proceeds
Depreciation Cashflow
Total Receipts 47,750 25,835 73,585 36,792 0%
Asset Renewals
Asset Upgrade/New
Asset Purchases
Principal Repayments
Reserves Tfr To
Total Payments
Capital Surplus/ (Deficit) 47,750 25,835 73,585 36,792 0%
SURPLUS/(DEFICIT) (262,000) (22,180) (284,180) (142,086) (48,608)
General Revenue Funding (262,000) (22,180) (284,180) (142,086) (48,608) 17%
Overall Surplus/(Deficit) 0
* Internal transactions have not been eliminated from this report
COMMENTARYChildren Services tracking well within the estimates and no variances to report for the quarter. There is a variance in actuals vs budget between Fees and Grants
that is due to change of funding streams during the year. We will make variances in following quarter when a realistic estimate is provided.
% Funded by Gen Revenue $ Funded by Gen Revenue 284,180
21

Group Manager | Anthony Basford
44%
Funding
Service Area Grants $ Fees $ Gen Rev $ Health Revotes Amount $
Bandara Childcare 391,882 211,972 31,109
Eden Childcare 243,504 159,537 56,843
Eden Preschool 186,672 20,519
Sapphire Mobile Preschool 82,686 18,435
* Above Figures show Actual $
Reserve Name Opening $ Tfr To Tfr From Closing $
71010.7000.7011Children Services General [Bandara] 182,256 182,256
71010.7000.7012Children Services ELE [Bandara] 111,481 111,481
71010.7000.7013Children Services Maintenance [Bandara] 20,000 (16,065) 3,935
71010.7000.7014Children Services Maintenance [Eden CC] 14,000 (10,200) 3,800
71010.7000.7015Children Services General [Eden CC] 164,588 164,588
71010.7000.7016Children Services ELE [Eden CC] 74,635 74,635
71010.7000.7017Children Services General [Eden PS] 240,684 (32,820) 207,864
71010.7000.7018Children Services Maintenance [Eden PS] 4,000 4,000
71010.7000.7019Children Services Maintenance [Sapphire] 6,417 6,417
71010.7000.7020Children Services General [Sapphire] 108,803 (14,500) 94,303
% Funded by Grants
- 50,000
100,000 150,000 200,000 250,000 300,000 350,000
Monthly Expense Progress
Employment Cost Operating Cost Capital Cost Actual
-
500,000
1,000,000
1,500,000
2,000,000
2,500,000
3,000,000
Overall Expense Progress
Employment Cost Operating Cost Capital Cost Actual
- 50,000
100,000 150,000 200,000 250,000 300,000 350,000
Monthly Expense Progress
Employment Cost Operating Cost Capital Cost Actual
-
500,000
1,000,000
1,500,000
2,000,000
2,500,000
Overall Income Progress
Rates Income Operating Income Capital Income Actual
-
50,000
100,000
150,000
200,000
250,000
300,000
350,000
Monthly Income Progress
Rates Income Operating Income Capital Income Actual
22

Function | Communications and Community Information
49%
2015 Budget Revision 2015 2015 2015 Actuals as %
Original September December March June Revised YTD YTD of Revised
Budget Quarter Quarter Quarter Quarter Budget Budget Actuals Budget
Operating Budget
Rates 185,600 185,600 185,600 92,800 50%
Fees & Charges 48,000 (27,000) 21,000 10,500 13,363 64%
Grants 111,000 111,000 55,500 0%
Other Revenues 43,000 18,000 61,000 30,498 40,252 66%
Lease Income
Attribution Revenue 1,097,000 1,097,000 548,502 548,500 50%
Total Revenue 1,484,600 (9,000) 1,475,600 830,600 694,915 47%
Employment Costs 1,832,150 (70,000) 1,762,150 881,076 833,966 47%
Operating Costs 360,000 108,565 468,565 234,294 182,429 39%
Asset Maintenance 26,000 26,000 13,002 11,108 43%
Asset Operations 23,000 23,000 11,502 16,524 72%
Interest Payments 105,000 105,000 52,500 26,747 25%
Asset Depreciation
Attribution Costs 728,000 728,000 363,990 364,000 50%
Total Expenses 3,074,150 38,565 3,112,715 1,556,364 1,434,774 46%
Operating Surplus/ (Deficit) (1,589,550) (38,565) (9,000) (1,637,115) (725,764) (739,859) 45%
Capital Budget
Capital Grants
Developer Conts
Other Capital Conts
Asset Sales
Land Sales
Reserves Tfr From 308,350 308,350 154,176 0%
Loan Proceeds
Depreciation Cashflow
Total Receipts 308,350 308,350 154,176 0%
Asset Renewals
Asset Upgrade/New 199,787 199,787 99,894 0%
Asset Purchases 90,000 90,000 45,000 65,076 72%
Principal Repayments 109,000 109,000 54,498 75,000 69%
Reserves Tfr To
Total Payments 199,000 199,787 398,787 199,392 140,076 35%
Capital Surplus/ (Deficit) (199,000) 108,563 (90,437) (45,216) (140,076) 155%
SURPLUS/(DEFICIT) (1,788,550) 69,998 (9,000) (1,727,552) (770,980) (879,936)
General Revenue Funding (1,788,550) 69,998 (9,000) (1,727,552) (770,980) (879,936) 51%
Overall Surplus/(Deficit)
* Internal transactions have not been eliminated from this report
COMMENTARYCommunications and Community Information function is tracking well within the estimates. Revisions for the quarter are drop in Administration Fees & Charges
and increase in other revenues due to additional contribution from University of Wollongong towards Library
% Funded by Gen Revenue $ Funded by Gen Revenue 1,727,552
23

Group Manager | Anthony Basford
3%
Funding
Service Area Grants $ Fees $ Gen Rev $ Health Revotes Amount $
Communication 1,940 49,213 LIBRARY - BEGA LOVES2READ GRAN 155
Contact Centre 3,988 132,309 LIBRARY - ROARING TO READ 362
Library 7,436 698,413 LIBRARY LOCAL PRIORITY GRANT 44,305
LIBRARY DISABILITY & GEOGRAPHIC 57,942
LIBRARY - SCIENCE IGNITE 573
TELSTRA TECH SAVVY SENIORS 5,226
LIBRARY CAPITAL FOR FITOUT TUR 199,787
* Above Figures show Actual $
Reserve Name Opening $ Tfr To Tfr From Closing $
% Funded by Grants
-
50,000
100,000
150,000
200,000
250,000
300,000
Monthly Expense Progress
Employment Cost Operating Cost Capital Cost Actual
-
500,000
1,000,000
1,500,000
2,000,000
2,500,000
3,000,000
Overall Expense Progress
Employment Cost Operating Cost Capital Cost Actual
-
50,000
100,000
150,000
200,000
250,000
300,000
Monthly Expense Progress
Employment Cost Operating Cost Capital Cost Actual
- 200,000 400,000 600,000 800,000
1,000,000 1,200,000 1,400,000 1,600,000
Overall Income Progress
Rates Income Operating Income Capital Income Actual
(50,000)
-
50,000
100,000
150,000
200,000
250,000
300,000
350,000
Monthly Income Progress
Rates Income Operating Income Capital Income Actual
24

Function | Community and Culture
17%
2015 Budget Revision 2015 2015 2015 Actuals as %
Original September December March June Revised YTD YTD of Revised
Budget Quarter Quarter Quarter Quarter Budget Budget Actuals Budget
Operating Budget
Rates 207,600 207,600 207,600 103,800 50%
Fees & Charges 380,000 380,000 190,002 186,402 49%
Grants 1,294,700 17,500 1,312,200 656,100 475,349 36%
Other Revenues 16,000 3,100 19,100 9,546 22,029 115%
Lease Income 73,000 510 (43,000) 30,510 15,264 19,818 65%
Attribution Revenue
Total Revenue 1,971,300 21,110 (43,000) 1,949,410 1,078,512 807,398 41%
Employment Costs 1,208,560 20,205 1,228,765 614,382 590,307 48%
Operating Costs 1,215,800 160,845 1,376,645 688,314 483,916 35%
Asset Maintenance 51,000 56,000 107,000 53,502 32,082 30%
Asset Operations 73,000 73,000 36,504 36,013 49%
Interest Payments 140,000 140,000 70,002 52,700 38%
Asset Depreciation
Attribution Costs 282,000 282,000 140,988 141,000 50%
Total Expenses 2,970,360 237,050 3,207,410 1,603,692 1,336,018 42%
Operating Surplus/ (Deficit) (999,060) (215,940) (43,000) (1,258,000) (525,180) (528,620) 42%
Capital Budget
Capital Grants
Developer Conts
Other Capital Conts
Asset Sales
Land Sales
Reserves Tfr From 159,943 4,145,373 4,305,316 2,152,626 0%
Loan Proceeds
Depreciation Cashflow
Total Receipts 159,943 4,145,373 4,305,316 2,152,626 0%
Asset Renewals 37,028
Asset Upgrade/New 4,145,373 4,145,373 2,072,688 1,603,086 39%
Asset Purchases
Principal Repayments 145,000 145,000 72,498 100,000 69%
Reserves Tfr To
Total Payments 145,000 4,145,373 4,290,373 2,145,186 1,740,114 41%
Capital Surplus/ (Deficit) (145,000) 159,943 14,943 7,440 (1,740,114) (11645%)
SURPLUS/(DEFICIT) (1,144,060) (55,997) (43,000) (1,243,057) (517,740) (2,268,734)
General Revenue Funding (1,144,060) (55,997) (43,000) (1,243,057) (517,740) (2,268,734) 183%
Overall Surplus/(Deficit)
* Internal transactions have not been eliminated from this report
COMMENTARYCommunity and Culture function is tracking well within the estimates. Revisions this quarter include reduction in anticipated lease income from community halls
and revote for Bega Civic Centre Project
% Funded by Gen Revenue $ Funded by Gen Revenue 1,243,057
25

Group Manager | Anthony Basford
18%
Funding
Service Area Grants $ Fees $ Gen Rev $ Health Revotes Amount $
Ageing and Disability 246,793 4,399 CDAT DRUG ACTION WEEK (NOT CO 14,015
Brighter Futures 199,910 2,879 9,775 HEALTHY COMMUNITIES (COMMO 20,203
Community Development 3,918 4,846 286,273 COMMUNITY - MND PACKS 2,942
Emergency Response [Community 24,728 91,383 SUPPORTED CARE ACCOMMODAT 5,895
Gallery 1,936 49,700 SUPPORTED LIVING ML 9,787
Healthy Communities 1,142 7,856 EMERGENCY RESPONSE - DOYLE 32,648
Volunteer and Community Assets 171,200 1,841,948 ER IN HOME ACCOMMODATION S 14,194
BRAIN INJURY NSW RURAL BROKE 1,256
YOUTH FUNDS (NIGHT BUS) 7,144
YOUTH CENTRE (POLICE BOYS CLUB) 21,321
SETTLEMENTS GRANT 2,376
BRIGHTER FUTURES 28,157
* Above Figures show Actual $
Reserve Name Opening $ Tfr To Tfr From Closing $
71010.7000.7005Bermagui Pre-School 3,295 3,295
71010.7000.7007Committee Funds [Cemetery] 478,179 478,179
71010.7000.7009Committee Funds [On Track] 23,503 23,503
71010.7000.7010Cemetery Improvements
71010.7000.7022ELE [Ageing and Disability] 32,429 32,429
71010.7000.7029Committee Funds [Halls] 110,730 110,730
71010.7000.7040Public Halls
71010.7000.7045Property Sale 73 Upper St 251,519 (50,000) 201,519
71010.7000.7061Brighter Futures [Vehicle Replacement] 30,000 30,000
% Funded by Grants
-
200,000
400,000
600,000
800,000
1,000,000
1,200,000
Monthly Expense Progress
Employment Cost Operating Cost Capital Cost Actual
-
2,000,000
4,000,000
6,000,000
8,000,000
Overall Expense Progress
Employment Cost Operating Cost Capital Cost Actual
-
200,000
400,000
600,000
800,000
1,000,000
1,200,000
Monthly Expense Progress
Employment Cost Operating Cost Capital Cost Actual
-
500,000
1,000,000
1,500,000
2,000,000
2,500,000
Overall Income Progress
Rates Income Operating Income Capital Income Actual
- 50,000
100,000 150,000 200,000 250,000 300,000 350,000 400,000
Monthly Income Progress
Rates Income Operating Income Capital Income Actual
26
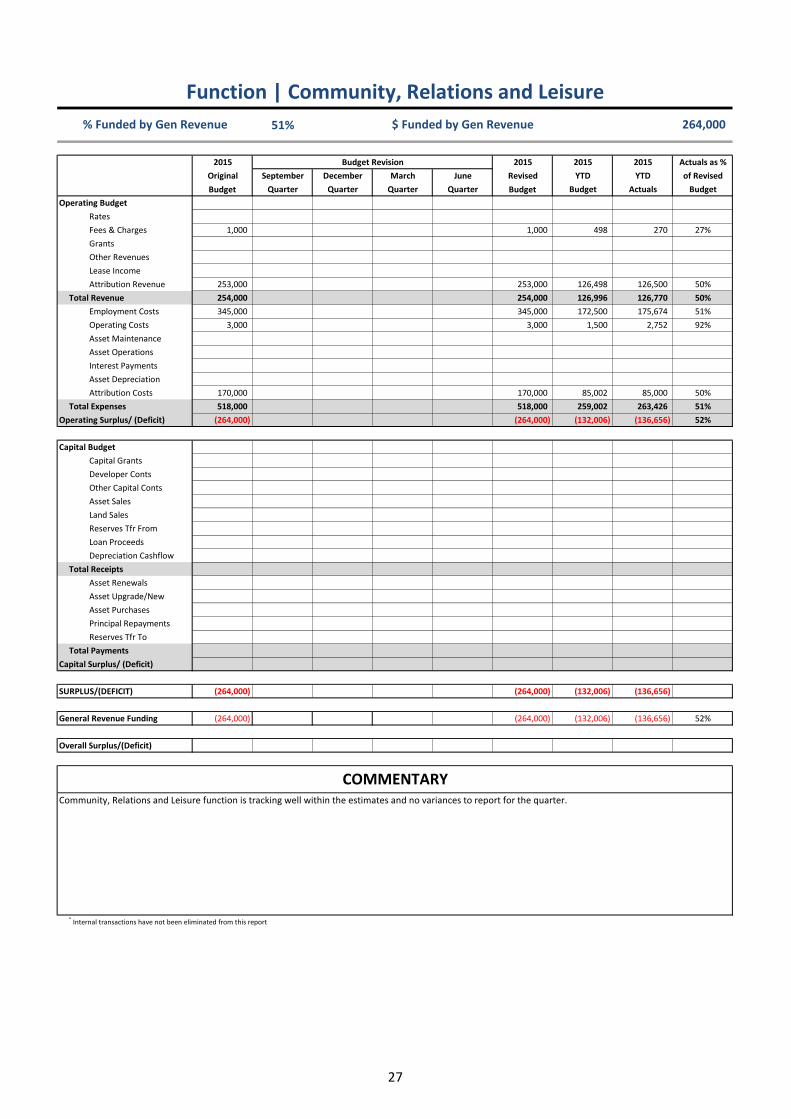
Function | Community, Relations and Leisure
51%
2015 Budget Revision 2015 2015 2015 Actuals as %
Original September December March June Revised YTD YTD of Revised
Budget Quarter Quarter Quarter Quarter Budget Budget Actuals Budget
Operating Budget
Rates
Fees & Charges 1,000 1,000 498 270 27%
Grants
Other Revenues
Lease Income
Attribution Revenue 253,000 253,000 126,498 126,500 50%
Total Revenue 254,000 254,000 126,996 126,770 50%
Employment Costs 345,000 345,000 172,500 175,674 51%
Operating Costs 3,000 3,000 1,500 2,752 92%
Asset Maintenance
Asset Operations
Interest Payments
Asset Depreciation
Attribution Costs 170,000 170,000 85,002 85,000 50%
Total Expenses 518,000 518,000 259,002 263,426 51%
Operating Surplus/ (Deficit) (264,000) (264,000) (132,006) (136,656) 52%
Capital Budget
Capital Grants
Developer Conts
Other Capital Conts
Asset Sales
Land Sales
Reserves Tfr From
Loan Proceeds
Depreciation Cashflow
Total Receipts
Asset Renewals
Asset Upgrade/New
Asset Purchases
Principal Repayments
Reserves Tfr To
Total Payments
Capital Surplus/ (Deficit)
SURPLUS/(DEFICIT) (264,000) (264,000) (132,006) (136,656)
General Revenue Funding (264,000) (264,000) (132,006) (136,656) 52%
Overall Surplus/(Deficit)
* Internal transactions have not been eliminated from this report
COMMENTARYCommunity, Relations and Leisure function is tracking well within the estimates and no variances to report for the quarter.
% Funded by Gen Revenue $ Funded by Gen Revenue 264,000
27

Group Manager | Anthony Basford
0%
Funding
Service Area Grants $ Fees $ Gen Rev $ Health Revotes Amount $
Community, Relations and Leisure 270 136,656
* Above Figures show Actual $
Reserve Name Opening $ Tfr To Tfr From Closing $
% Funded by Grants
-
20,000
40,000
60,000
80,000
Monthly Expense Progress
Employment Cost Operating Cost Capital Cost Actual
-
100,000
200,000
300,000
400,000
Overall Expense Progress
Employment Cost Operating Cost Capital Cost Actual
-
20,000
40,000
60,000
80,000
Monthly Expense Progress
Employment Cost Operating Cost Capital Cost Actual
-
50,000
100,000
150,000
200,000
250,000
300,000
Overall Income Progress
Rates Income Operating Income Capital Income Actual
(10,000)
-
10,000
20,000
30,000
40,000
50,000
60,000
70,000
Monthly Income Progress
Rates Income Operating Income Capital Income Actual
28

Function | Leisure
45%
2015 Budget Revision 2015 2015 2015 Actuals as %
Original September December March June Revised YTD YTD of Revised
Budget Quarter Quarter Quarter Quarter Budget Budget Actuals Budget
Operating Budget
Rates 689,200 689,200 689,200 344,600 50%
Fees & Charges 1,073,000 60,000 1,133,000 566,502 451,036 40%
Grants
Other Revenues 102
Lease Income 105,000 51,000 156,000 77,994 103,760 67%
Attribution Revenue
Total Revenue 1,867,200 111,000 1,978,200 1,333,696 899,497 45%
Employment Costs 666,000 130,480 20,000 816,480 408,234 497,164 61%
Operating Costs 398,800 398,800 199,398 68,635 17%
Asset Maintenance 396,000 (38,000) 358,000 178,998 177,363 50%
Asset Operations 1,323,000 (18,725) 1,304,275 652,140 676,075 52%
Interest Payments
Asset Depreciation
Attribution Costs 180,000 180,000 89,988 90,000 50%
Total Expenses 2,963,800 73,755 20,000 3,057,555 1,528,758 1,509,237 49%
Operating Surplus/ (Deficit) (1,096,600) (73,755) 91,000 (1,079,355) (195,062) (609,739) 56%
Capital Budget
Capital Grants 300,000 300,000 150,000 300,000 100%
Developer Conts
Other Capital Conts 8,000 8,000 3,996 8,000 100%
Asset Sales
Land Sales
Reserves Tfr From 173,080 662,700 835,780 417,888 0%
Loan Proceeds
Depreciation Cashflow
Total Receipts 473,080 662,700 8,000 1,143,780 571,884 308,000 27%
Asset Renewals 1,592,000 518,005 (277,000) 1,833,005 916,578 305,026 17%
Asset Upgrade/New 583,000 143,420 726,420 363,210 68,387 9%
Asset Purchases
Principal Repayments
Reserves Tfr To 68,000 68,000 33,996 0%
Total Payments 2,175,000 661,425 (209,000) 2,627,425 1,313,784 373,413 14%
Capital Surplus/ (Deficit) (1,701,920) 1,275 217,000 (1,483,645) (741,900) (65,413) 4%
SURPLUS/(DEFICIT) (2,798,520) (72,480) 308,000 (2,563,000) (936,962) (675,152)
General Revenue Funding (2,798,520) (72,480) 308,000 (2,563,000) (936,962) (675,152) 26%
Overall Surplus/(Deficit)
* Internal transactions have not been eliminated from this report
COMMENTARYLeisure Services is tracking well within estimates. Revision for the quarter is increase in Fees & Charges in relation to handover of Committee Funds from
Sportsground Committees. And increase in Lease Income estimates for reserves. Reduction in Asset Renewals relate to transfer of these funds to Public
Amenities and Marine Infrastructure for Pambula Rivermouth Toilets and Wonboyn Boat Ramp
% Funded by Gen Revenue $ Funded by Gen Revenue 2,563,000
29

Group Manager | Anthony Basford
0%
Funding
Service Area Grants $ Fees $ Gen Rev $ Health Revotes Amount $
Beaches LPMA CROWN CONTRIBUTION 123,254
Parks 300,000 1,059 304,173 DICKINSON OVAL BERMAGUI SPO 50,000
Pools 395,616 451,294
Sportsgrounds 54,362 7,086
* Above Figures show Actual $
Reserve Name Opening $ Tfr To Tfr From Closing $
71010.7000.7006Bega Sporting Ground Improvement
71010.7000.7008Candelo Park Maintenance 9,197 9,197
71010.7000.7034Foreshore Projects 24,658 24,658
71010.7000.7038Old Bega Racecourse Development 32,815 32,815
71010.7000.7043Sportsground [SV] 356,469 (356,470) (1)
71010.7000.7046Tathra Beach Reserve 61,904 61,904
71010.7000.7047Tura Beach Country Club Crown Land 21,611 21,611
71010.7000.7058LPMA Crown Reserve 123,254 (123,255) (1)
71010.7000.7062Insurance Reimbursement [Dickinson Park] 131,700 (131,700)
71010.7000.7063Ocean Lifeguards [SV]
% Funded by Grants
-
100,000
200,000
300,000
400,000
500,000
Monthly Expense Progress
Employment Cost Operating Cost Capital Cost Actual
-
1,000,000
2,000,000
3,000,000
4,000,000
5,000,000
6,000,000
Overall Expense Progress
Employment Cost Operating Cost Capital Cost Actual
-
100,000
200,000
300,000
400,000
500,000
Monthly Expense Progress
Employment Cost Operating Cost Capital Cost Actual
-
500,000
1,000,000
1,500,000
2,000,000
2,500,000
Overall Income Progress
Rates Income Operating Income Capital Income Actual
-
200,000
400,000
600,000
800,000
1,000,000
Monthly Income Progress
Rates Income Operating Income Capital Income Actual
30

Group | Organisation Development and Governance
96%
2015 Budget Revision 2015 2015 2015 Actuals as %
Original September December March June Revised YTD YTD of Revised
Budget Quarter Quarter Quarter Quarter Budget Budget Actuals Budget
Operating Budget
Rates
Fees & Charges 5,000 5,000 2,502 0%
Grants
Other Revenues 129,000 129,000 64,500 119,949 93%
Lease Income
Attribution Revenue
Total Revenue 129,000 5,000 134,000 67,002 119,949 90%
Employment Costs 755,600 455,450 1,211,050 605,526 582,804 48%
Operating Costs 694,000 780,000 45,000 1,519,000 759,480 1,253,658 83%
Asset Maintenance
Asset Operations
Interest Payments
Asset Depreciation
Attribution Costs 506,000 506,000 253,014 253,000 50%
Total Expenses 1,955,600 1,235,450 45,000 3,236,050 1,618,020 2,089,462 65%
Operating Surplus/ (Deficit) (1,955,600) (1,106,450) (40,000) (3,102,050) (1,551,018) (1,969,513) 63%
Capital Budget
Capital Grants
Developer Conts
Other Capital Conts
Asset Sales
Land Sales
Reserves Tfr From
Loan Proceeds
Depreciation Cashflow
Total Receipts
Asset Renewals
Asset Upgrade/New
Asset Purchases
Principal Repayments
Reserves Tfr To 55,000 55,000 27,498 0%
Total Payments 55,000 55,000 27,498 0%
Capital Surplus/ (Deficit) (55,000) (55,000) (27,498) 0%
SURPLUS/(DEFICIT) (2,010,600) (1,106,450) (40,000) (3,157,050) (1,578,516) (1,969,513)
General Revenue Funding (2,010,600) (1,106,450) (40,000) (3,157,050) (1,578,516) (1,969,513) 62%
Overall Surplus/(Deficit)
Note1 Internal transactions have not been eliminated from this report
COMMENTARYOrganisation Development and Governance is tracking well within estimates. Operating Costs increase is transfer of current project costs from Employee Support
service area.
% Funded by Gen Revenue $ Funded by Gen Revenue 3,157,050
31
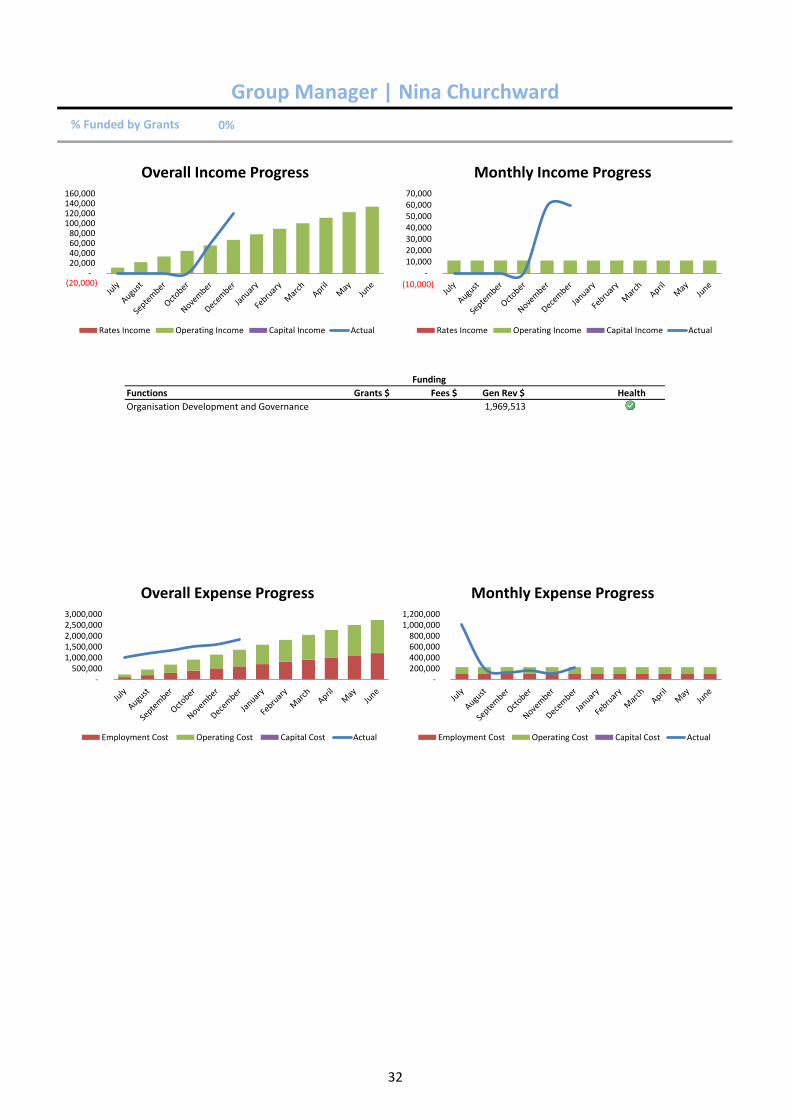
Group Manager | Nina Churchward
0%
Functions Grants $ Fees $ Gen Rev $ Health
Organisation Development and Governance 1,969,513
Funding
% Funded by Grants
-
500,000
1,000,000
1,500,000
2,000,000
2,500,000
3,000,000
Overall Expense Progress
Employment Cost Operating Cost Capital Cost Actual
-
200,000
400,000
600,000
800,000
1,000,000
1,200,000
Monthly Expense Progress
Employment Cost Operating Cost Capital Cost Actual
(20,000) -
20,000 40,000 60,000 80,000
100,000 120,000 140,000 160,000
Overall Income Progress
Rates Income Operating Income Capital Income Actual
(10,000)
-
10,000
20,000
30,000
40,000
50,000
60,000
70,000
Monthly Income Progress
Rates Income Operating Income Capital Income Actual
32

Function | Organisation Development and Governance
96%
2015 Budget Revision 2015 2015 2015 Actuals as %
Original September December March June Revised YTD YTD of Revised
Budget Quarter Quarter Quarter Quarter Budget Budget Actuals Budget
Operating Budget
Rates
Fees & Charges 5,000 5,000 2,502 0%
Grants
Other Revenues 129,000 129,000 64,500 119,949 93%
Lease Income
Attribution Revenue
Total Revenue 129,000 5,000 134,000 67,002 119,949 90%
Employment Costs 755,600 455,450 1,211,050 605,526 582,804 48%
Operating Costs 694,000 780,000 45,000 1,519,000 759,480 1,253,658 83%
Asset Maintenance
Asset Operations
Interest Payments
Asset Depreciation
Attribution Costs 506,000 506,000 253,014 253,000 50%
Total Expenses 1,955,600 1,235,450 45,000 3,236,050 1,618,020 2,089,462 65%
Operating Surplus/ (Deficit) (1,955,600) (1,106,450) (40,000) (3,102,050) (1,551,018) (1,969,513) 63%
Capital Budget
Capital Grants
Developer Conts
Other Capital Conts
Asset Sales
Land Sales
Reserves Tfr From
Loan Proceeds
Depreciation Cashflow
Total Receipts
Asset Renewals
Asset Upgrade/New
Asset Purchases
Principal Repayments
Reserves Tfr To 55,000 55,000 27,498 0%
Total Payments 55,000 55,000 27,498 0%
Capital Surplus/ (Deficit) (55,000) (55,000) (27,498) 0%
SURPLUS/(DEFICIT) (2,010,600) (1,106,450) (40,000) (3,157,050) (1,578,516) (1,969,513)
General Revenue Funding (2,010,600) (1,106,450) (40,000) (3,157,050) (1,578,516) (1,969,513) 62%
Overall Surplus/(Deficit)
* Internal transactions have not been eliminated from this report
COMMENTARYOrganisation Development and Governance is tracking well within estimates. Operating Costs increase is transfer of current project costs from Employee Support
service area.
% Funded by Gen Revenue $ Funded by Gen Revenue 3,157,050
33
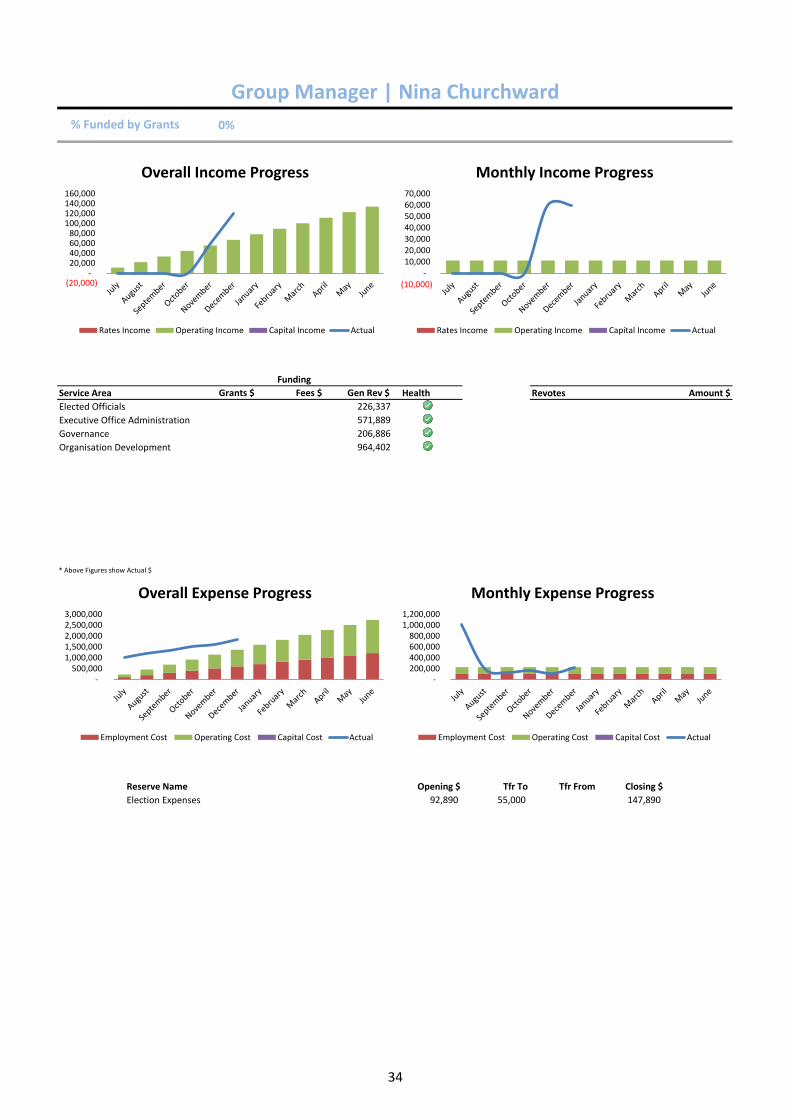
Group Manager | Nina Churchward
0%
Funding
Service Area Grants $ Fees $ Gen Rev $ Health Revotes Amount $
Elected Officials 226,337
Executive Office Administration 571,889
Governance 206,886
Organisation Development 964,402
* Above Figures show Actual $
Reserve Name Opening $ Tfr To Tfr From Closing $
71010.7000.7024Election Expenses 92,890 55,000 147,890
% Funded by Grants
-
200,000
400,000
600,000
800,000
1,000,000
1,200,000
Monthly Expense Progress
Employment Cost Operating Cost Capital Cost Actual
-
500,000
1,000,000
1,500,000
2,000,000
2,500,000
3,000,000
Overall Expense Progress
Employment Cost Operating Cost Capital Cost Actual
-
200,000
400,000
600,000
800,000
1,000,000
1,200,000
Monthly Expense Progress
Employment Cost Operating Cost Capital Cost Actual
(20,000) -
20,000 40,000 60,000 80,000
100,000 120,000 140,000 160,000
Overall Income Progress
Rates Income Operating Income Capital Income Actual
(10,000)
-
10,000
20,000
30,000
40,000
50,000
60,000
70,000
Monthly Income Progress
Rates Income Operating Income Capital Income Actual
34

Group | Planning and Environment
47%
2015 Budget Revision 2015 2015 2015 Actuals as %
Original September December March June Revised YTD YTD of Revised
Budget Quarter Quarter Quarter Quarter Budget Budget Actuals Budget
Operating Budget
Rates 772,600 772,600 772,600 386,300 50%
Fees & Charges 1,849,605 (20,000) 1,829,605 914,802 1,099,720 60%
Grants 261,750 78,775 340,525 170,262 240,697 71%
Other Revenues 110,500 21,000 131,500 65,754 55,711 42%
Lease Income
Attribution Revenue 160,000 160,000 79,998 80,000 50%
Total Revenue 3,154,455 99,775 (20,000) 3,234,230 2,003,416 1,862,427 58%
Employment Costs 3,986,070 3,986,070 1,993,032 1,829,449 46%
Operating Costs 1,440,000 500,485 113,065 2,053,550 1,026,786 827,850 40%
Asset Maintenance 56,000 56,000 27,996 3,053 5%
Asset Operations
Interest Payments
Asset Depreciation
Attribution Costs 1,235,000 1,235,000 617,496 617,500 50%
Total Expenses 6,717,070 500,485 113,065 7,330,620 3,665,310 3,277,851 45%
Operating Surplus/ (Deficit) (3,562,615) (400,710) (133,065) (4,096,390) (1,661,894) (1,415,424) 35%
Capital Budget
Capital Grants
Developer Conts
Other Capital Conts
Asset Sales
Land Sales
Reserves Tfr From 116,400 440,711 133,065 690,176 345,126 0%
Loan Proceeds
Depreciation Cashflow
Total Receipts 116,400 440,711 133,065 690,176 345,126 0%
Asset Renewals
Asset Upgrade/New
Asset Purchases
Principal Repayments
Reserves Tfr To 100,000 100,000 49,998 0%
Total Payments 100,000 100,000 49,998 0%
Capital Surplus/ (Deficit) 16,400 440,711 133,065 590,176 295,128 0%
SURPLUS/(DEFICIT) (3,546,215) 40,001 (3,506,214) (1,366,766) (1,415,424)
General Revenue Funding (3,546,215) 40,001 (3,506,214) (1,366,766) (1,415,424) 40%
Overall Surplus/(Deficit)
Note1 Internal transactions have not been eliminated from this report
COMMENTARYPlanning and Environment is tracking well within estimates. Operating Costs increase is revote of environmental projects from previously restricted asset at Year
End.
% Funded by Gen Revenue $ Funded by Gen Revenue 3,506,214
35

Group Manager | Andrew Woodley
5%
Functions Grants $ Fees $ Gen Rev $ Health
Building and Health Services 22,921 867,626 25,500
Environment Services 217,775 18,424 276,647
Planning and Environment 605,037
Planning Services 213,670 508,241
Funding
% Funded by Grants
- 1,000,000 2,000,000 3,000,000 4,000,000 5,000,000 6,000,000 7,000,000
Overall Expense Progress
Employment Cost Operating Cost Capital Cost Actual
-
100,000
200,000
300,000
400,000
500,000
600,000
Monthly Expense Progress
Employment Cost Operating Cost Capital Cost Actual
-
500,000
1,000,000
1,500,000
2,000,000
2,500,000
3,000,000
3,500,000
Overall Income Progress
Rates Income Operating Income Capital Income Actual
-
200,000
400,000
600,000
800,000
1,000,000
1,200,000
Monthly Income Progress
Rates Income Operating Income Capital Income Actual
36

Function | Building and Health Services
35%
2015 Budget Revision 2015 2015 2015 Actuals as %
Original September December March June Revised YTD YTD of Revised
Budget Quarter Quarter Quarter Quarter Budget Budget Actuals Budget
Operating Budget
Rates
Fees & Charges 1,237,605 (20,000) 1,217,605 608,808 867,626 71%
Grants 40,000 40,000 19,998 22,921 57%
Other Revenues 102,000 21,000 123,000 61,500 55,711 45%
Lease Income
Attribution Revenue 40,000 40,000 19,998 20,000 50%
Total Revenue 1,419,605 21,000 (20,000) 1,420,605 710,304 966,258 68%
Employment Costs 1,455,970 1,455,970 727,980 651,215 45%
Operating Costs 298,000 32,675 (20,000) 310,675 155,340 126,943 41%
Asset Maintenance 4,000 4,000 1,998 100 3%
Asset Operations
Interest Payments
Asset Depreciation
Attribution Costs 427,000 427,000 213,492 213,500 50%
Total Expenses 2,184,970 32,675 (20,000) 2,197,645 1,098,810 991,758 45%
Operating Surplus/ (Deficit) (765,365) (11,675) (777,040) (388,506) (25,500) 3%
Capital Budget
Capital Grants
Developer Conts
Other Capital Conts
Asset Sales
Land Sales
Reserves Tfr From 11,675 11,675 5,838 0%
Loan Proceeds
Depreciation Cashflow
Total Receipts 11,675 11,675 5,838 0%
Asset Renewals
Asset Upgrade/New
Asset Purchases
Principal Repayments
Reserves Tfr To
Total Payments
Capital Surplus/ (Deficit) 11,675 11,675 5,838 0%
SURPLUS/(DEFICIT) (765,365) (765,365) (382,668) (25,500)
General Revenue Funding (765,365) (765,365) (382,668) (25,500) 3%
Overall Surplus/(Deficit) 0
* Internal transactions have not been eliminated from this report
COMMENTARYBuilding and Health Servies tracking well within estimates. Fees and Charges and Operating Costs associated with it reduced in line with trend.
% Funded by Gen Revenue $ Funded by Gen Revenue 765,365
37

Group Manager | Andrew Woodley
2%
Funding
Service Area Grants $ Fees $ Gen Rev $ Health Revotes Amount $
Building Services 748,597 HEALTH - ABORIGINAL LANDS CLE 11,673
Health Services 87,172 87,956
Ranger Services 22,921 31,858 205,657
* Above Figures show Actual $
Reserve Name Opening $ Tfr To Tfr From Closing $
71010.7000.7003Animal Control 32,106 32,106
% Funded by Grants
-
50,000
100,000
150,000
200,000
Monthly Expense Progress
Employment Cost Operating Cost Capital Cost Actual
-
500,000
1,000,000
1,500,000
2,000,000
Overall Expense Progress
Employment Cost Operating Cost Capital Cost Actual
-
50,000
100,000
150,000
200,000
Monthly Expense Progress
Employment Cost Operating Cost Capital Cost Actual
- 200,000 400,000 600,000 800,000
1,000,000 1,200,000 1,400,000 1,600,000
Overall Income Progress
Rates Income Operating Income Capital Income Actual
-
50,000
100,000
150,000
200,000
250,000
300,000
350,000
Monthly Income Progress
Rates Income Operating Income Capital Income Actual
38
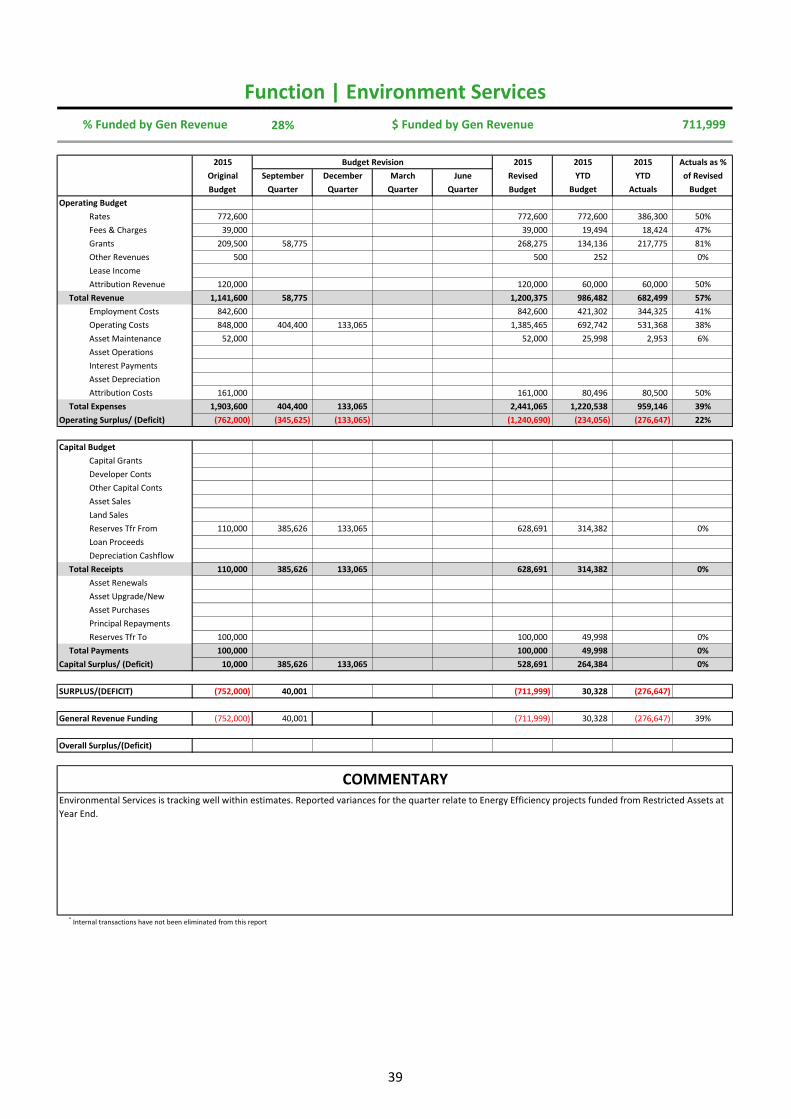
Function | Environment Services
28%
2015 Budget Revision 2015 2015 2015 Actuals as %
Original September December March June Revised YTD YTD of Revised
Budget Quarter Quarter Quarter Quarter Budget Budget Actuals Budget
Operating Budget
Rates 772,600 772,600 772,600 386,300 50%
Fees & Charges 39,000 39,000 19,494 18,424 47%
Grants 209,500 58,775 268,275 134,136 217,775 81%
Other Revenues 500 500 252 0%
Lease Income
Attribution Revenue 120,000 120,000 60,000 60,000 50%
Total Revenue 1,141,600 58,775 1,200,375 986,482 682,499 57%
Employment Costs 842,600 842,600 421,302 344,325 41%
Operating Costs 848,000 404,400 133,065 1,385,465 692,742 531,368 38%
Asset Maintenance 52,000 52,000 25,998 2,953 6%
Asset Operations
Interest Payments
Asset Depreciation
Attribution Costs 161,000 161,000 80,496 80,500 50%
Total Expenses 1,903,600 404,400 133,065 2,441,065 1,220,538 959,146 39%
Operating Surplus/ (Deficit) (762,000) (345,625) (133,065) (1,240,690) (234,056) (276,647) 22%
Capital Budget
Capital Grants
Developer Conts
Other Capital Conts
Asset Sales
Land Sales
Reserves Tfr From 110,000 385,626 133,065 628,691 314,382 0%
Loan Proceeds
Depreciation Cashflow
Total Receipts 110,000 385,626 133,065 628,691 314,382 0%
Asset Renewals
Asset Upgrade/New
Asset Purchases
Principal Repayments
Reserves Tfr To 100,000 100,000 49,998 0%
Total Payments 100,000 100,000 49,998 0%
Capital Surplus/ (Deficit) 10,000 385,626 133,065 528,691 264,384 0%
SURPLUS/(DEFICIT) (752,000) 40,001 (711,999) 30,328 (276,647)
General Revenue Funding (752,000) 40,001 (711,999) 30,328 (276,647) 39%
Overall Surplus/(Deficit)
* Internal transactions have not been eliminated from this report
COMMENTARYEnvironmental Services is tracking well within estimates. Reported variances for the quarter relate to Energy Efficiency projects funded from Restricted Assets at
Year End.
% Funded by Gen Revenue $ Funded by Gen Revenue 711,999
39

Group Manager | Andrew Woodley
11%
Funding
Service Area Grants $ Fees $ Gen Rev $ Health Revotes Amount $
Environment Services 99,468 9,881 362,135 NOXIOUS WEEDS GENERAL CROWN 8,793
Vegetation Management Services 118,307 8,544 N/WEEDS GRANT - REG WEEDS -CHILE 20,090
SRCMA RIPERIAN/GRAZING 5,401
ENERGY EFFICIENCY FUND 102,227
EMP 2.05/06 WONBOYN LAKE ERO 8,119
EMP 4.05/06 LAKE CURALO BOAR 1,616
EMP 6.05/06 MERIM LAKE SPENCE 1,763
PAMBULA LAKE EST MANAGEMEN 49,191
BVSC ESTUARY MONITORING 12/1 12,971
BVSC COASTAL HAZARD DEFINITIO 95,183
SRCMA 0910 WAPENGO LAKE SED 19,341
PROTECTION SALTMARSH WAPEN 9,040
* Above Figures show Actual $
Reserve Name Opening $ Tfr To Tfr From Closing $
71010.7000.7025Environmental Management 149,124 100,000 (363,930) (114,806)
71010.7000.7056Energy Efficiency Fund 303,445 70,000 (237,140) 136,305
% Funded by Grants
-
50,000
100,000
150,000
200,000
250,000
Monthly Expense Progress
Employment Cost Operating Cost Capital Cost Actual
-
500,000
1,000,000
1,500,000
2,000,000
2,500,000
Overall Expense Progress
Employment Cost Operating Cost Capital Cost Actual
-
50,000
100,000
150,000
200,000
250,000
Monthly Expense Progress
Employment Cost Operating Cost Capital Cost Actual
-
200,000
400,000
600,000
800,000
1,000,000
1,200,000
1,400,000
Overall Income Progress
Rates Income Operating Income Capital Income Actual
(200,000)
-
200,000
400,000
600,000
800,000
1,000,000
Monthly Income Progress
Rates Income Operating Income Capital Income Actual
40

Function | Planning and Environment
96%
2015 Budget Revision 2015 2015 2015 Actuals as %
Original September December March June Revised YTD YTD of Revised
Budget Quarter Quarter Quarter Quarter Budget Budget Actuals Budget
Operating Budget
Rates
Fees & Charges
Grants 20,000 20,000 10,002 0%
Other Revenues
Lease Income
Attribution Revenue
Total Revenue 20,000 20,000 10,002 0%
Employment Costs 833,000 833,000 416,496 420,077 50%
Operating Costs 24,000 47,010 71,010 35,502 50,459 71%
Asset Maintenance
Asset Operations
Interest Payments
Asset Depreciation
Attribution Costs 269,000 269,000 134,502 134,500 50%
Total Expenses 1,126,000 47,010 1,173,010 586,500 605,037 52%
Operating Surplus/ (Deficit) (1,126,000) (27,010) (1,153,010) (576,498) (605,037) 52%
Capital Budget
Capital Grants
Developer Conts
Other Capital Conts
Asset Sales
Land Sales
Reserves Tfr From 27,010 27,010 13,506 0%
Loan Proceeds
Depreciation Cashflow
Total Receipts 27,010 27,010 13,506 0%
Asset Renewals
Asset Upgrade/New
Asset Purchases
Principal Repayments
Reserves Tfr To
Total Payments
Capital Surplus/ (Deficit) 27,010 27,010 13,506 0%
SURPLUS/(DEFICIT) (1,126,000) (1,126,000) (562,992) (605,037)
General Revenue Funding (1,126,000) (1,126,000) (562,992) (605,037) 54%
Overall Surplus/(Deficit)
* Internal transactions have not been eliminated from this report
COMMENTARYPlanning and Environment is tracking well within estimates and no variances to report for the quarter.
% Funded by Gen Revenue $ Funded by Gen Revenue 1,126,000
41

Group Manager | Andrew Woodley
2%
Funding
Service Area Grants $ Fees $ Gen Rev $ Health Revotes Amount $
PEG Administration 605,037
* Above Figures show Actual $
Reserve Name Opening $ Tfr To Tfr From Closing $
% Funded by Grants
-
20,000
40,000
60,000
80,000
100,000
120,000
Monthly Expense Progress
Employment Cost Operating Cost Capital Cost Actual
-
200,000
400,000
600,000
800,000
1,000,000
Overall Expense Progress
Employment Cost Operating Cost Capital Cost Actual
-
20,000
40,000
60,000
80,000
100,000
120,000
Monthly Expense Progress
Employment Cost Operating Cost Capital Cost Actual
-
5,000
10,000
15,000
20,000
25,000
Overall Income Progress
Rates Income Operating Income Capital Income Actual
-
500
1,000
1,500
2,000
Monthly Income Progress
Rates Income Operating Income Capital Income Actual
42

Function | Planning Services
59%
2015 Budget Revision 2015 2015 2015 Actuals as %
Original September December March June Revised YTD YTD of Revised
Budget Quarter Quarter Quarter Quarter Budget Budget Actuals Budget
Operating Budget
Rates
Fees & Charges 573,000 573,000 286,500 213,670 37%
Grants 12,250 12,250 6,126 0%
Other Revenues 8,000 8,000 4,002 0%
Lease Income
Attribution Revenue
Total Revenue 593,250 593,250 296,628 213,670 36%
Employment Costs 854,500 854,500 427,254 413,832 48%
Operating Costs 270,000 16,400 286,400 143,202 119,079 42%
Asset Maintenance
Asset Operations
Interest Payments
Asset Depreciation
Attribution Costs 378,000 378,000 189,006 189,000 50%
Total Expenses 1,502,500 16,400 1,518,900 759,462 721,911 48%
Operating Surplus/ (Deficit) (909,250) (16,400) (925,650) (462,834) (508,241) 55%
Capital Budget
Capital Grants
Developer Conts
Other Capital Conts
Asset Sales
Land Sales
Reserves Tfr From 6,400 16,400 22,800 11,400 0%
Loan Proceeds
Depreciation Cashflow
Total Receipts 6,400 16,400 22,800 11,400 0%
Asset Renewals
Asset Upgrade/New
Asset Purchases
Principal Repayments
Reserves Tfr To
Total Payments
Capital Surplus/ (Deficit) 6,400 16,400 22,800 11,400 0%
SURPLUS/(DEFICIT) (902,850) (902,850) (451,434) (508,241)
General Revenue Funding (902,850) (902,850) (451,434) (508,241) 56%
Overall Surplus/(Deficit)
* Internal transactions have not been eliminated from this report
COMMENTARYPlanning Services is tracking well within estimates and no variances to report for the quarter.
% Funded by Gen Revenue $ Funded by Gen Revenue 902,850
43

Group Manager | Andrew Woodley
1%
Funding
Service Area Grants $ Fees $ Gen Rev $ Health Revotes Amount $
Planning Services 213,670 508,241 DA TRACKING TOOL 15,000
ELECTRONIC HOUSING 2,012
RURAL RESIDENTIAL DEVELOPMEN 30,000
ABORIGINAL HERITAGE STUDY - N 16,400
* Above Figures show Actual $
Reserve Name Opening $ Tfr To Tfr From Closing $
% Funded by Grants
-
50,000
100,000
150,000
Monthly Expense Progress
Employment Cost Operating Cost Capital Cost Actual
-
200,000
400,000
600,000
800,000
1,000,000
1,200,000
Overall Expense Progress
Employment Cost Operating Cost Capital Cost Actual
-
50,000
100,000
150,000
Monthly Expense Progress
Employment Cost Operating Cost Capital Cost Actual
-
100,000
200,000
300,000
400,000
500,000
600,000
700,000
Overall Income Progress
Rates Income Operating Income Capital Income Actual
-
10,000
20,000
30,000
40,000
50,000
60,000
Monthly Income Progress
Rates Income Operating Income Capital Income Actual
44

Group | Strategy and Business Services
-137%
2015 Budget Revision 2015 2015 2015 Actuals as %
Original September December March June Revised YTD YTD of Revised
Budget Quarter Quarter Quarter Quarter Budget Budget Actuals Budget
Operating Budget
Rates 16,278,400 16,278,400 16,278,400 18,261,750 112%
Fees & Charges 145,000 600 145,600 72,810 76,692 53%
Grants 5,568,320 (99,655) 35,000 5,503,665 2,751,828 2,860,808 52%
Other Revenues 1,229,000 (129,000) 130,200 1,230,200 615,102 743,660 60%
Lease Income 10,000 32,200 42,200 21,096 40,500 96%
Attribution Revenue 10,703,000 10,703,000 5,351,496 5,414,894 51%
Total Revenue 33,933,720 (228,655) 198,000 33,903,065 25,090,732 27,398,304 81%
Employment Costs 6,815,275 (535,450) 250,000 6,529,825 3,264,930 3,180,824 49%
Operating Costs 3,820,500 (740,000) 91,200 3,171,700 1,899,856 1,641,139 52%
Asset Maintenance 100,000 2,000 102,000 51,000 63,869 63%
Asset Operations 352,000 352,000 175,998 151,257 43%
Interest Payments 209,000 209,000 104,502 141,599 68%
Asset Depreciation
Attribution Costs 1,132,000 1,132,000 566,004 566,000 50%
Total Expenses 12,428,775 (1,275,450) 343,200 11,496,525 6,062,290 5,744,689 50%
Operating Surplus/ (Deficit) 21,504,945 1,046,795 (145,200) 22,406,540 19,028,442 21,653,616 97%
Capital Budget
Capital Grants
Developer Conts
Other Capital Conts
Asset Sales 292,000 292,000 145,998 292,000 100%
Land Sales 264,000 264,000 132,000 100,000 38%
Reserves Tfr From 295,720 62,360 300,000 658,080 329,094 0%
Loan Proceeds
Depreciation Cashflow
Total Receipts 559,720 354,360 300,000 1,214,080 607,092 392,000 32%
Asset Renewals 1,155,000 (635,362) 519,638 259,860 541,282 104%
Asset Upgrade/New 95,000 345,260 440,260 220,134 3,992 1%
Asset Purchases 222,624
Principal Repayments 1,058,000 1,058,000 528,996 519,546 49%
Reserves Tfr To 788,320 292,000 200,000 1,280,320 640,116 0%
Total Payments 3,096,320 637,260 (435,362) 3,298,218 1,649,106 1,287,445 39%
Capital Surplus/ (Deficit) (2,536,600) (282,900) 735,362 (2,084,138) (1,042,014) (895,445) 43%
SURPLUS/(DEFICIT) 18,968,345 763,895 590,162 20,322,402 17,986,428 20,758,171 102%
General Revenue Funding 18,968,345 763,895 590,162 20,322,402 7,992,866 10,567,697 52%
Overall Surplus/(Deficit) 9,993,562 10,190,474
Note1 Internal transactions have not been eliminated from this report
COMMENTARYStrategy and Business Services is tracking well within estimates. Major variances for the quarter include recognition of Southern Phones Dividend income,
Unbudgeted Redundancy payments funded through Restricted Assets and reallocation of unallocated Asset Renewals to other Directorate.
% Funded by Gen Revenue $ Funded by Gen Revenue (20,322,402)
45
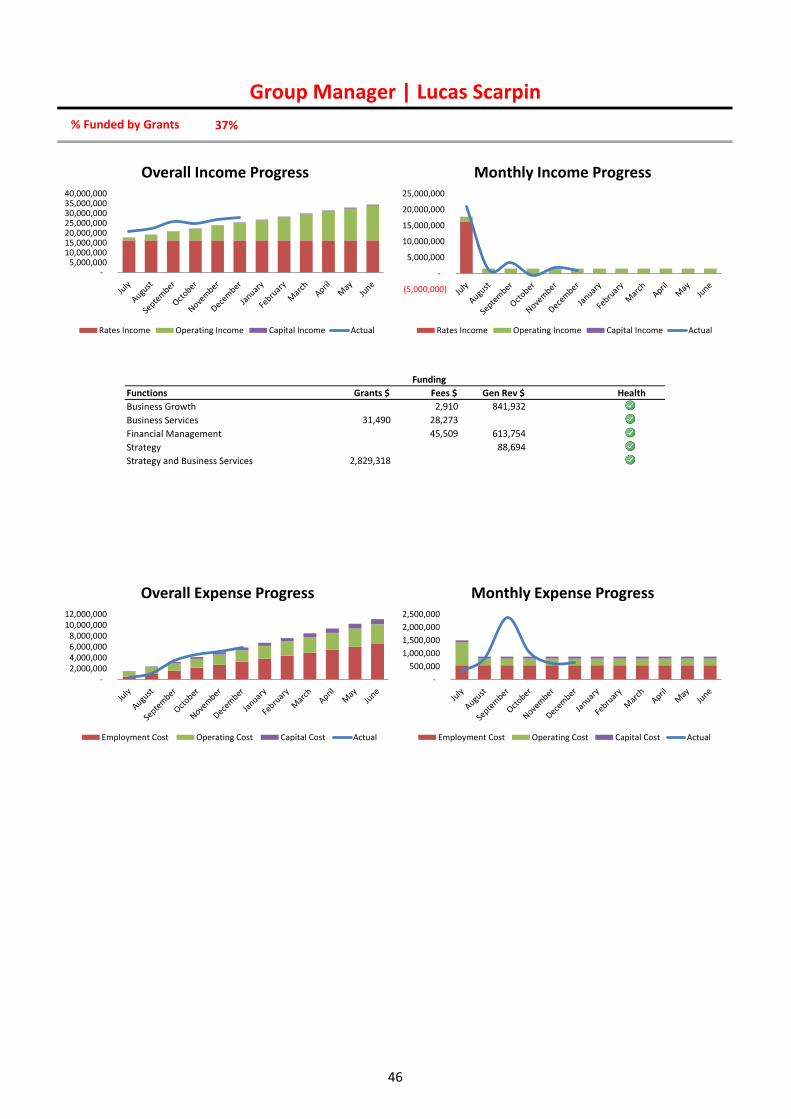
Group Manager | Lucas Scarpin
37%
Functions Grants $ Fees $ Gen Rev $ Health
Business Growth 2,910 841,932
Business Services 31,490 28,273
Financial Management 45,509 613,754
Strategy 88,694
Strategy and Business Services 2,829,318
Funding
% Funded by Grants
-
2,000,000
4,000,000
6,000,000
8,000,000
10,000,000
12,000,000
Overall Expense Progress
Employment Cost Operating Cost Capital Cost Actual
-
500,000
1,000,000
1,500,000
2,000,000
2,500,000
Monthly Expense Progress
Employment Cost Operating Cost Capital Cost Actual
- 5,000,000
10,000,000 15,000,000 20,000,000 25,000,000 30,000,000 35,000,000 40,000,000
Overall Income Progress
Rates Income Operating Income Capital Income Actual
(5,000,000)
-
5,000,000
10,000,000
15,000,000
20,000,000
25,000,000
Monthly Income Progress
Rates Income Operating Income Capital Income Actual
46

Function | Business Growth
22%
2015 Budget Revision 2015 2015 2015 Actuals as %
Original September December March June Revised YTD YTD of Revised
Budget Quarter Quarter Quarter Quarter Budget Budget Actuals Budget
Operating Budget
Rates 460,000 460,000 460,000 230,000 50%
Fees & Charges 3,000 3,000 1,500 2,910 97%
Grants
Other Revenues 385
Lease Income 10,000 32,200 42,200 21,096 40,500 96%
Attribution Revenue 921,000 921,000 460,500 460,500 50%
Total Revenue 1,391,000 35,200 1,426,200 943,096 734,295 51%
Employment Costs 275,000 175,000 450,000 225,006 230,027 51%
Operating Costs 581,000 55,000 138,200 774,200 387,096 541,525 70%
Asset Maintenance 100,000 100,000 49,998 62,181 62%
Asset Operations 352,000 352,000 175,998 151,257 43%
Interest Payments (17,037)
Asset Depreciation
Attribution Costs 126,000 126,000 63,000 63,000 50%
Total Expenses 1,434,000 230,000 138,200 1,802,200 901,098 1,030,953 57%
Operating Surplus/ (Deficit) (43,000) (230,000) (103,000) (376,000) 41,998 (296,658) 79%
Capital Budget
Capital Grants
Developer Conts
Other Capital Conts
Asset Sales
Land Sales
Reserves Tfr From 345,260 50,000 395,260 197,634 0%
Loan Proceeds
Depreciation Cashflow
Total Receipts 345,260 50,000 395,260 197,634 0%
Asset Renewals 541,282
Asset Upgrade/New 345,260 345,260 172,632 3,992 1%
Asset Purchases
Principal Repayments
Reserves Tfr To 186,000 186,000 93,000 0%
Total Payments 186,000 345,260 531,260 265,632 545,274 103%
Capital Surplus/ (Deficit) (186,000) 50,000 (136,000) (67,998) (545,274) 401%
SURPLUS/(DEFICIT) (229,000) (230,000) (53,000) (512,000) (26,000) (841,932)
General Revenue Funding (229,000) (230,000) (53,000) (512,000) (26,000) (841,932) 164%
Overall Surplus/(Deficit)
* Internal transactions have not been eliminated from this report
COMMENTARYBusiness Growth is tracking well within budget. Variance to report for the quarter is Bega Office Fitout following the Restructure.
% Funded by Gen Revenue $ Funded by Gen Revenue 512,000
47

Group Manager | Lucas Scarpin
0%
Funding
Service Area Grants $ Fees $ Gen Rev $ Health Revotes Amount $
Business Growth 2,664 215,648
Property Services and Maintenan 245 581,368
Tourism 44,917
* Above Figures show Actual $
Reserve Name Opening $ Tfr To Tfr From Closing $
71010.7000.7032Council Buildings
71010.7000.7033Narira Village 106,347 106,347
71010.7000.7064VIC and Tourism [SV] 345,258 186,000 (345,260) 185,998
% Funded by Grants
-
100,000
200,000
300,000
400,000
500,000
Monthly Expense Progress
Employment Cost Operating Cost Capital Cost Actual
-
500,000
1,000,000
1,500,000
2,000,000
2,500,000
Overall Expense Progress
Employment Cost Operating Cost Capital Cost Actual
-
100,000
200,000
300,000
400,000
500,000
Monthly Expense Progress
Employment Cost Operating Cost Capital Cost Actual
- 200,000 400,000 600,000 800,000
1,000,000 1,200,000 1,400,000 1,600,000
Overall Income Progress
Rates Income Operating Income Capital Income Actual
(100,000)
-
100,000
200,000
300,000
400,000
500,000
600,000
Monthly Income Progress
Rates Income Operating Income Capital Income Actual
48

Function | Business Services
0%
2015 Budget Revision 2015 2015 2015 Actuals as %
Original September December March June Revised YTD YTD of Revised
Budget Quarter Quarter Quarter Quarter Budget Budget Actuals Budget
Operating Budget
Rates
Fees & Charges 77,000 (5,000) 72,000 36,006 28,273 39%
Grants 35,000 35,000 17,502 31,490 90%
Other Revenues 129,000 (129,000) 2,082
Lease Income
Attribution Revenue 8,308,000 8,308,000 4,153,998 4,217,394 51%
Total Revenue 8,514,000 (129,000) 30,000 8,415,000 4,207,506 4,279,239 51%
Employment Costs 5,618,575 (1,068,830) 250,000 4,799,745 2,399,880 2,383,249 50%
Operating Costs 2,271,000 (995,000) (47,000) 1,229,000 928,510 675,770 55%
Asset Maintenance 2,000 2,000 1,002 1,687 84%
Asset Operations
Interest Payments
Asset Depreciation
Attribution Costs 553,000 553,000 276,498 276,500 50%
Total Expenses 8,442,575 (2,063,830) 205,000 6,583,745 3,605,890 3,337,206 51%
Operating Surplus/ (Deficit) 71,425 1,934,830 (175,000) 1,831,255 601,616 942,033 51%
Capital Budget
Capital Grants
Developer Conts
Other Capital Conts
Asset Sales
Land Sales
Reserves Tfr From 282,900 (282,900) 250,000 250,000 125,052 0%
Loan Proceeds
Depreciation Cashflow
Total Receipts 282,900 (282,900) 250,000 250,000 125,052 0%
Asset Renewals
Asset Upgrade/New
Asset Purchases
Principal Repayments
Reserves Tfr To
Total Payments
Capital Surplus/ (Deficit) 282,900 (282,900) 250,000 250,000 125,052 0%
SURPLUS/(DEFICIT) 354,325 1,651,930 75,000 2,081,255 726,668 942,033 45%
General Revenue Funding 354,325 1,651,930 75,000 2,081,255 726,668 942,033 45%
Overall Surplus/(Deficit)
* Internal transactions have not been eliminated from this report
COMMENTARYBusiness Services is tracking well within budget. Reported variance for the quarter relates to one off trainee grant, employment costs increase in relation to
unbudgeted redundancies. And movement in operating costs to fund current projects in Organisation Development area.
% Funded by Gen Revenue $ Funded by Gen Revenue
49

Group Manager | Lucas Scarpin
1%
Funding
Service Area Grants $ Fees $ Gen Rev $ Health Revotes Amount $
Employee Support 31,490 616
Supply (1,300) 163,652
Technology 28,956 394,055
* Above Figures show Actual $
Reserve Name Opening $ Tfr To Tfr From Closing $
71010.7000.7023Employee Leave Entitlement 1,896,000 (250,000) 1,646,000
71010.7000.7030Information Technology Facilities 377,000 377,000
71010.7000.7066Workforce Strategy [Cadets & Trainees]
% Funded by Grants
(500,000)
-
500,000
1,000,000
1,500,000
2,000,000
Monthly Expense Progress
Employment Cost Operating Cost Capital Cost Actual
- 1,000,000 2,000,000 3,000,000 4,000,000 5,000,000 6,000,000 7,000,000
Overall Expense Progress
Employment Cost Operating Cost Capital Cost Actual
(500,000)
-
500,000
1,000,000
1,500,000
2,000,000
Monthly Expense Progress
Employment Cost Operating Cost Capital Cost Actual
-
2,000,000
4,000,000
6,000,000
8,000,000
10,000,000
Overall Income Progress
Rates Income Operating Income Capital Income Actual
(500,000)
-
500,000
1,000,000
1,500,000
2,000,000
2,500,000
3,000,000
Monthly Income Progress
Rates Income Operating Income Capital Income Actual
50

Function | Financial Management
40%
2015 Budget Revision 2015 2015 2015 Actuals as %
Original September December March June Revised YTD YTD of Revised
Budget Quarter Quarter Quarter Quarter Budget Budget Actuals Budget
Operating Budget
Rates 148,400 148,400 148,400 74,200 50%
Fees & Charges 68,000 2,600 70,600 35,304 45,509 64%
Grants
Other Revenues 10,000 10,000 5,004 2 0%
Lease Income
Attribution Revenue 1,474,000 1,474,000 736,998 737,000 50%
Total Revenue 1,700,400 2,600 1,703,000 925,706 856,711 50%
Employment Costs 833,200 (65,500) 767,700 383,850 358,210 47%
Operating Costs 411,000 411,000 205,500 230,072 56%
Asset Maintenance
Asset Operations
Interest Payments 209,000 209,000 104,502 158,636 76%
Asset Depreciation
Attribution Costs 408,000 408,000 204,006 204,000 50%
Total Expenses 1,861,200 (65,500) 1,795,700 897,858 950,918 53%
Operating Surplus/ (Deficit) (160,800) 65,500 2,600 (92,700) 27,848 (94,207) 102%
Capital Budget
Capital Grants
Developer Conts
Other Capital Conts
Asset Sales
Land Sales
Reserves Tfr From
Loan Proceeds
Depreciation Cashflow
Total Receipts
Asset Renewals
Asset Upgrade/New
Asset Purchases
Principal Repayments 1,058,000 1,058,000 528,996 519,546 49%
Reserves Tfr To
Total Payments 1,058,000 1,058,000 528,996 519,546 49%
Capital Surplus/ (Deficit) (1,058,000) (1,058,000) (528,996) (519,546) 49%
SURPLUS/(DEFICIT) (1,218,800) 65,500 2,600 (1,150,700) (501,148) (613,754)
General Revenue Funding (1,218,800) 65,500 2,600 (1,150,700) (501,148) (613,754) 53%
Overall Surplus/(Deficit)
* Internal transactions have not been eliminated from this report
COMMENTARYFinancial Management is tracking well with no variances to report.
% Funded by Gen Revenue $ Funded by Gen Revenue 1,150,700
51
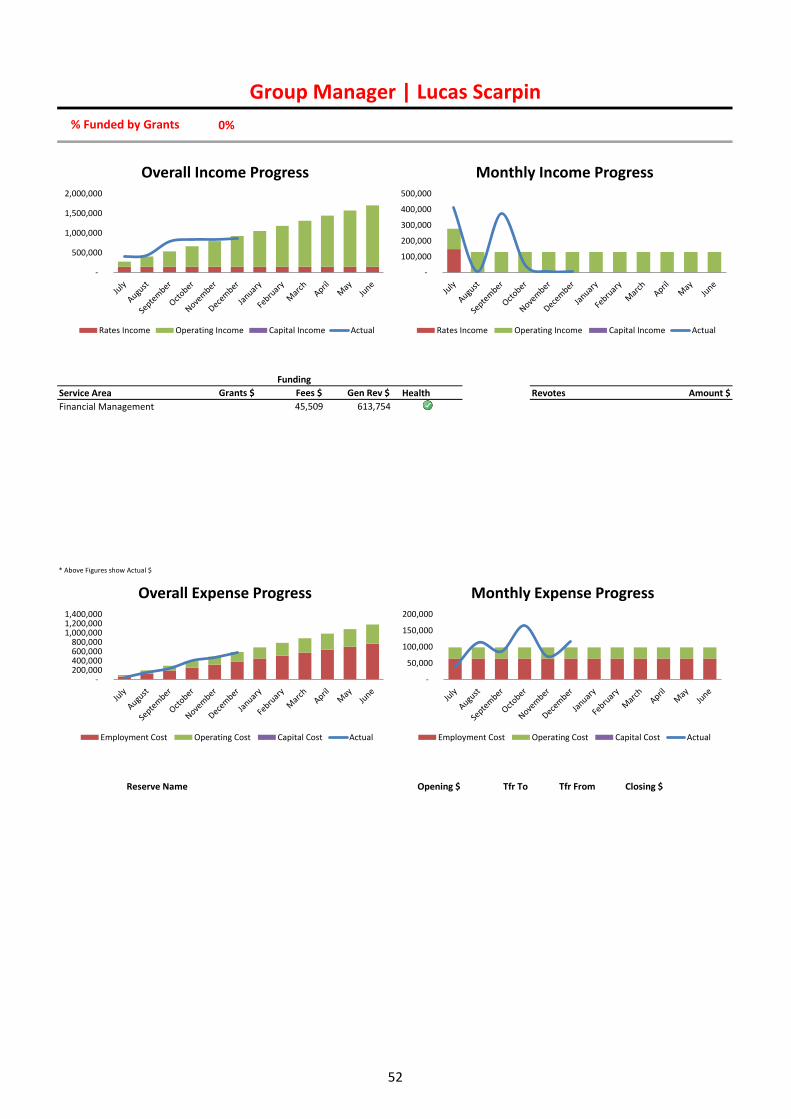
Group Manager | Lucas Scarpin
0%
Funding
Service Area Grants $ Fees $ Gen Rev $ Health Revotes Amount $
Financial Management 45,509 613,754
* Above Figures show Actual $
Reserve Name Opening $ Tfr To Tfr From Closing $
% Funded by Grants
-
50,000
100,000
150,000
200,000
Monthly Expense Progress
Employment Cost Operating Cost Capital Cost Actual
- 200,000 400,000 600,000 800,000
1,000,000 1,200,000 1,400,000
Overall Expense Progress
Employment Cost Operating Cost Capital Cost Actual
-
50,000
100,000
150,000
200,000
Monthly Expense Progress
Employment Cost Operating Cost Capital Cost Actual
-
500,000
1,000,000
1,500,000
2,000,000
Overall Income Progress
Rates Income Operating Income Capital Income Actual
-
100,000
200,000
300,000
400,000
500,000
Monthly Income Progress
Rates Income Operating Income Capital Income Actual
52

Function | Strategy
100%
2015 Budget Revision 2015 2015 2015 Actuals as %
Original September December March June Revised YTD YTD of Revised
Budget Quarter Quarter Quarter Quarter Budget Budget Actuals Budget
Operating Budget
Rates
Fees & Charges
Grants
Other Revenues
Lease Income
Attribution Revenue
Total Revenue
Employment Costs 88,500 88,500 44,250 42,478 48%
Operating Costs 111,000 111,000 55,500 38,716 35%
Asset Maintenance
Asset Operations
Interest Payments
Asset Depreciation
Attribution Costs 15,000 15,000 7,500 7,500 50%
Total Expenses 214,500 214,500 107,250 88,694 41%
Operating Surplus/ (Deficit) (214,500) (214,500) (107,250) (88,694) 41%
Capital Budget
Capital Grants
Developer Conts
Other Capital Conts
Asset Sales
Land Sales
Reserves Tfr From
Loan Proceeds
Depreciation Cashflow
Total Receipts
Asset Renewals
Asset Upgrade/New
Asset Purchases
Principal Repayments
Reserves Tfr To
Total Payments
Capital Surplus/ (Deficit)
SURPLUS/(DEFICIT) (214,500) (214,500) (107,250) (88,694)
General Revenue Funding (214,500) (214,500) (107,250) (88,694) 41%
Overall Surplus/(Deficit)
* Internal transactions have not been eliminated from this report
COMMENTARYStrategy Function is tracking well with no variances to report.
% Funded by Gen Revenue $ Funded by Gen Revenue 214,500
53
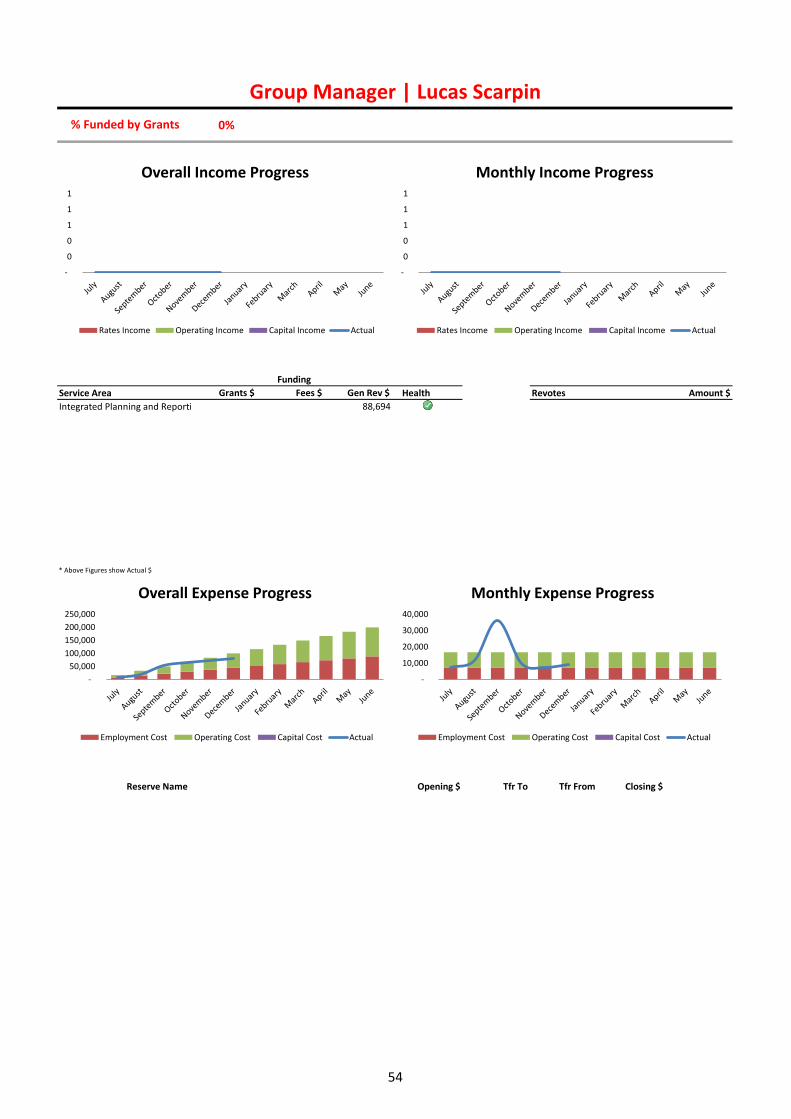
Group Manager | Lucas Scarpin
0%
Funding
Service Area Grants $ Fees $ Gen Rev $ Health Revotes Amount $
Integrated Planning and Reportin 88,694
* Above Figures show Actual $
Reserve Name Opening $ Tfr To Tfr From Closing $
% Funded by Grants
-
10,000
20,000
30,000
40,000
Monthly Expense Progress
Employment Cost Operating Cost Capital Cost Actual
-
50,000
100,000
150,000
200,000
250,000
Overall Expense Progress
Employment Cost Operating Cost Capital Cost Actual
-
10,000
20,000
30,000
40,000
Monthly Expense Progress
Employment Cost Operating Cost Capital Cost Actual
-
0
0
1
1
1
Overall Income Progress
Rates Income Operating Income Capital Income Actual
-
0
0
1
1
1
Monthly Income Progress
Rates Income Operating Income Capital Income Actual
54

Function | Strategy and Business Services
0%
2015 Budget Revision 2015 2015 2015 Actuals as %
Original September December March June Revised YTD YTD of Revised
Budget Quarter Quarter Quarter Quarter Budget Budget Actuals Budget
Operating Budget
Rates 15,670,000 15,670,000 15,670,000 17,957,550 115%
Fees & Charges
Grants 5,568,320 (99,655) 5,468,665 2,734,326 2,829,318 52%
Other Revenues 1,090,000 130,200 1,220,200 610,098 741,191 61%
Lease Income
Attribution Revenue
Total Revenue 22,328,320 (99,655) 130,200 22,358,865 19,014,424 21,528,059 96%
Employment Costs 423,880 423,880 211,944 166,860 39%
Operating Costs 446,500 200,000 646,500 323,250 155,057 24%
Asset Maintenance
Asset Operations
Interest Payments
Asset Depreciation
Attribution Costs 30,000 30,000 15,000 15,000 50%
Total Expenses 476,500 623,880 1,100,380 550,194 336,917 31%
Operating Surplus/ (Deficit) 21,851,820 (723,535) 130,200 21,258,485 18,464,230 21,191,142 100%
Capital Budget
Capital Grants
Developer Conts
Other Capital Conts
Asset Sales 292,000 292,000 145,998 292,000 100%
Land Sales 264,000 264,000 132,000 100,000 38%
Reserves Tfr From 12,820 12,820 6,408 0%
Loan Proceeds
Depreciation Cashflow
Total Receipts 276,820 292,000 568,820 284,406 392,000 69%
Asset Renewals 1,155,000 (635,362) 519,638 259,860 0%
Asset Upgrade/New 95,000 95,000 47,502 0%
Asset Purchases 222,624
Principal Repayments
Reserves Tfr To 602,320 292,000 200,000 1,094,320 547,116 0%
Total Payments 1,852,320 292,000 (435,362) 1,708,958 854,478 222,624 13%
Capital Surplus/ (Deficit) (1,575,500) 435,362 (1,140,138) (570,072) 169,376 (15%)
SURPLUS/(DEFICIT) 20,276,320 (723,535) 565,562 20,118,347 17,894,158 21,360,518 106%
General Revenue Funding 20,276,320 (723,535) 565,562 20,118,347 7,900,596 11,170,044 56%
Overall Surplus/(Deficit) 9,993,562 10,190,474
* Internal transactions have not been eliminated from this report
COMMENTARYStrategy and Business Services is tracking well within estimates. Major variances for the quarter include recognition of Southern Phones Dividend income and
reallocation of unallocated Asset Renewals to other Directorate.
% Funded by Gen Revenue $ Funded by Gen Revenue
55

Group Manager | Lucas Scarpin
195%
Funding
Service Area Grants $ Fees $ Gen Rev $ Health Revotes Amount $
Land Development
SBS Administration 2,829,318
* Above Figures show Actual $
Reserve Name Opening $ Tfr To Tfr From Closing $
71010.7000.7004Asset Replacement 159,350 146,000 305,350
71010.7000.7026Financial Assistance Grant [General]
71010.7000.7027Financial Assistance Grant [Roads]
71010.7000.7036Operational Examination Contigency 130,500 130,500
71010.7000.7039Property Development 2,818,355 756,000 (3,500,000) 74,355
71010.7000.7055Eden Port
71010.7000.7057Revotes
71010.7000.7059Unspent Loans 2,051,760 (745,373) 1,306,387
71010.7000.7065Unspent Grant [Council Contribution] 82,069 (82,070) (1)
71010.7000.7067LIRS Subsidy 122,320 122,320
% Funded by Grants
-
50,000
100,000
150,000
200,000
250,000
Monthly Expense Progress
Employment Cost Operating Cost Capital Cost Actual
-
500,000
1,000,000
1,500,000
2,000,000
Overall Expense Progress
Employment Cost Operating Cost Capital Cost Actual
-
50,000
100,000
150,000
200,000
250,000
Monthly Expense Progress
Employment Cost Operating Cost Capital Cost Actual
-
5,000,000
10,000,000
15,000,000
20,000,000
25,000,000
Overall Income Progress
Rates Income Operating Income Capital Income Actual
(5,000,000)
-
5,000,000
10,000,000
15,000,000
20,000,000
25,000,000
Monthly Income Progress
Rates Income Operating Income Capital Income Actual
56
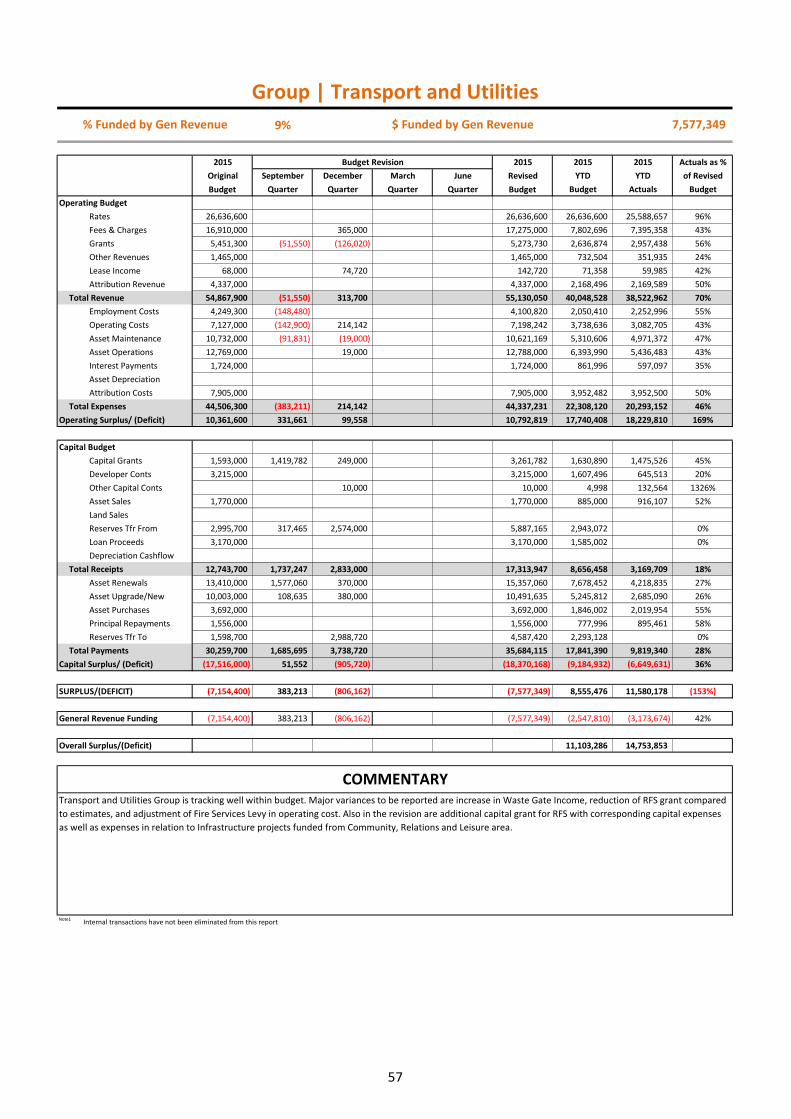
Group | Transport and Utilities
9%
2015 Budget Revision 2015 2015 2015 Actuals as %
Original September December March June Revised YTD YTD of Revised
Budget Quarter Quarter Quarter Quarter Budget Budget Actuals Budget
Operating Budget
Rates 26,636,600 26,636,600 26,636,600 25,588,657 96%
Fees & Charges 16,910,000 365,000 17,275,000 7,802,696 7,395,358 43%
Grants 5,451,300 (51,550) (126,020) 5,273,730 2,636,874 2,957,438 56%
Other Revenues 1,465,000 1,465,000 732,504 351,935 24%
Lease Income 68,000 74,720 142,720 71,358 59,985 42%
Attribution Revenue 4,337,000 4,337,000 2,168,496 2,169,589 50%
Total Revenue 54,867,900 (51,550) 313,700 55,130,050 40,048,528 38,522,962 70%
Employment Costs 4,249,300 (148,480) 4,100,820 2,050,410 2,252,996 55%
Operating Costs 7,127,000 (142,900) 214,142 7,198,242 3,738,636 3,082,705 43%
Asset Maintenance 10,732,000 (91,831) (19,000) 10,621,169 5,310,606 4,971,372 47%
Asset Operations 12,769,000 19,000 12,788,000 6,393,990 5,436,483 43%
Interest Payments 1,724,000 1,724,000 861,996 597,097 35%
Asset Depreciation
Attribution Costs 7,905,000 7,905,000 3,952,482 3,952,500 50%
Total Expenses 44,506,300 (383,211) 214,142 44,337,231 22,308,120 20,293,152 46%
Operating Surplus/ (Deficit) 10,361,600 331,661 99,558 10,792,819 17,740,408 18,229,810 169%
Capital Budget
Capital Grants 1,593,000 1,419,782 249,000 3,261,782 1,630,890 1,475,526 45%
Developer Conts 3,215,000 3,215,000 1,607,496 645,513 20%
Other Capital Conts 10,000 10,000 4,998 132,564 1326%
Asset Sales 1,770,000 1,770,000 885,000 916,107 52%
Land Sales
Reserves Tfr From 2,995,700 317,465 2,574,000 5,887,165 2,943,072 0%
Loan Proceeds 3,170,000 3,170,000 1,585,002 0%
Depreciation Cashflow
Total Receipts 12,743,700 1,737,247 2,833,000 17,313,947 8,656,458 3,169,709 18%
Asset Renewals 13,410,000 1,577,060 370,000 15,357,060 7,678,452 4,218,835 27%
Asset Upgrade/New 10,003,000 108,635 380,000 10,491,635 5,245,812 2,685,090 26%
Asset Purchases 3,692,000 3,692,000 1,846,002 2,019,954 55%
Principal Repayments 1,556,000 1,556,000 777,996 895,461 58%
Reserves Tfr To 1,598,700 2,988,720 4,587,420 2,293,128 0%
Total Payments 30,259,700 1,685,695 3,738,720 35,684,115 17,841,390 9,819,340 28%
Capital Surplus/ (Deficit) (17,516,000) 51,552 (905,720) (18,370,168) (9,184,932) (6,649,631) 36%
SURPLUS/(DEFICIT) (7,154,400) 383,213 (806,162) (7,577,349) 8,555,476 11,580,178 (153%)
General Revenue Funding (7,154,400) 383,213 (806,162) (7,577,349) (2,547,810) (3,173,674) 42%
Overall Surplus/(Deficit) 11,103,286 14,753,853
Note1 Internal transactions have not been eliminated from this report
COMMENTARYTransport and Utilities Group is tracking well within budget. Major variances to be reported are increase in Waste Gate Income, reduction of RFS grant compared
to estimates, and adjustment of Fire Services Levy in operating cost. Also in the revision are additional capital grant for RFS with corresponding capital expenses
as well as expenses in relation to Infrastructure projects funded from Community, Relations and Leisure area.
% Funded by Gen Revenue $ Funded by Gen Revenue 7,577,349
57

Group Manager | Wayne Sartori
7%
Functions Grants $ Fees $ Gen Rev $ Health
Civil Assets 50,700
Emergency Services 471,978
Sewer Services 127,206 639,333
Transport and Utility Group 79,984 72,961
Transport Services 3,480,533 3,298,597
Waste Services 157,182 893,746
Water Services 145,365 2,626,739
Works 3,155,557
Funding
% Funded by Grants
- 10,000,000 20,000,000 30,000,000 40,000,000 50,000,000 60,000,000 70,000,000
Overall Expense Progress
Employment Cost Operating Cost Capital Cost Actual
-
1,000,000
2,000,000
3,000,000
4,000,000
5,000,000
6,000,000
Monthly Expense Progress
Employment Cost Operating Cost Capital Cost Actual
-
10,000,000
20,000,000
30,000,000
40,000,000
50,000,000
60,000,000
70,000,000
Overall Income Progress
Rates Income Operating Income Capital Income Actual
-
5,000,000
10,000,000
15,000,000
20,000,000
25,000,000
30,000,000
35,000,000
Monthly Income Progress
Rates Income Operating Income Capital Income Actual
58

Function | Civil Assets
46%
2015 Budget Revision 2015 2015 2015 Actuals as %
Original September December March June Revised YTD YTD of Revised
Budget Quarter Quarter Quarter Quarter Budget Budget Actuals Budget
Operating Budget
Rates 646,500 646,500 646,500 467,762 72%
Fees & Charges
Grants 131,300 131,300 65,658 58,636 45%
Other Revenues 36,000 36,000 18,000 24,019 67%
Lease Income 52,000 74,720 126,720 63,360 37,674 30%
Attribution Revenue
Total Revenue 865,800 74,720 940,520 793,518 588,090 63%
Employment Costs
Operating Costs 75,000 25,000 100,000 49,998 42,337 42%
Asset Maintenance 320,000 (19,000) 301,000 150,498 119,402 40%
Asset Operations 1,000 19,000 20,000 9,996 12,141 61%
Interest Payments 160,000 160,000 79,998 79,569 50%
Asset Depreciation
Attribution Costs 30,000 30,000 14,994 15,000 50%
Total Expenses 586,000 25,000 611,000 305,484 268,448 44%
Operating Surplus/ (Deficit) 279,800 49,720 329,520 488,034 319,642 97%
Capital Budget
Capital Grants 15,707 15,707 7,848 (7,936) (51%)
Developer Conts
Other Capital Conts
Asset Sales
Land Sales
Reserves Tfr From 60,000 49,225 109,225 54,612 0%
Loan Proceeds
Depreciation Cashflow
Total Receipts 60,000 64,932 124,932 62,460 (7,936) (6%)
Asset Renewals 265,000 64,925 245,000 574,925 287,418 147,667 26%
Asset Upgrade/New 320,000 320,000 159,996 11,075 3%
Asset Purchases
Principal Repayments 291,000 291,000 145,500 143,266 49%
Reserves Tfr To 109,800 49,720 159,520 79,764 0%
Total Payments 985,800 64,925 294,720 1,345,445 672,678 302,008 22%
Capital Surplus/ (Deficit) (925,800) 7 (294,720) (1,220,513) (610,218) (309,944) 25%
SURPLUS/(DEFICIT) (646,000) 7 (245,000) (890,993) (122,184) 9,697 (1%)
General Revenue Funding (646,000) 7 (245,000) (890,993) (122,184) 9,697 (1%)
Overall Surplus/(Deficit) (0)
* Internal transactions have not been eliminated from this report
COMMENTARYCivil Assets are tracking well within budget. Variances relate to additional Lease Income for Airport Lease with additional expenses in relation to it. Also in Asset
Renewals is the inclusion of Wonboyn Jetty previously budgeted in Leisure Services.
% Funded by Gen Revenue $ Funded by Gen Revenue 890,993
59

Group Manager | Wayne Sartori
7%
Funding
Service Area Grants $ Fees $ Gen Rev $ Health Revotes Amount $
Airport 67,119 NSW COASTLINE CYCLEWAY 05/06 19,072
Cycleways 21,809 PAMBULA CYCLEWAY GRANT (RTA 14,441
Marine Infrastructure (7,936) 98,018 BETTER BOATING PROGRAM 12/1 31,414
Stormwater (8,484)
* Above Figures show Actual $
Reserve Name Opening $ Tfr To Tfr From Closing $
71010.7000.7001Airport [Passenger Levy] 159,520 159,520
71010.7000.7002Airport [SV] 10,003 10,003
71010.7000.7028Committee Funds [Tathra Wharf] 2,433 2,433
71010.7000.7031Merimbula Jetty Maintenance and Improve 37,710 37,710
71010.7000.7044Stormwater Management [Annual Charge]
% Funded by Grants
-
20,000
40,000
60,000
80,000
100,000
120,000
Monthly Expense Progress
Employment Cost Operating Cost Capital Cost Actual
- 200,000 400,000 600,000 800,000
1,000,000 1,200,000 1,400,000
Overall Expense Progress
Employment Cost Operating Cost Capital Cost Actual
-
20,000
40,000
60,000
80,000
100,000
120,000
Monthly Expense Progress
Employment Cost Operating Cost Capital Cost Actual
-
200,000
400,000
600,000
800,000
1,000,000
1,200,000
Overall Income Progress
Rates Income Operating Income Capital Income Actual
(100,000) -
100,000 200,000 300,000 400,000 500,000 600,000 700,000 800,000
Monthly Income Progress
Rates Income Operating Income Capital Income Actual
60

Function | Emergency Services
1%
2015 Budget Revision 2015 2015 2015 Actuals as %
Original September December March June Revised YTD YTD of Revised
Budget Quarter Quarter Quarter Quarter Budget Budget Actuals Budget
Operating Budget
Rates 585,600 585,600 585,600 292,800 50%
Fees & Charges
Grants 638,000 (126,020) 511,980 255,996 471,978 92%
Other Revenues
Lease Income
Attribution Revenue
Total Revenue 1,223,600 (126,020) 1,097,580 841,596 764,778 70%
Employment Costs
Operating Costs 792,000 (142,900) 189,142 838,242 419,142 540,437 64%
Asset Maintenance
Asset Operations 178,000 178,000 88,998 60,928 34%
Interest Payments
Asset Depreciation
Attribution Costs 96,000 96,000 48,000 48,000 50%
Total Expenses 1,066,000 (142,900) 189,142 1,112,242 556,140 649,365 58%
Operating Surplus/ (Deficit) 157,600 142,900 (315,162) (14,662) 285,456 115,413 (787%)
Capital Budget
Capital Grants 131,000 249,000 380,000 190,002 0%
Developer Conts
Other Capital Conts
Asset Sales
Land Sales
Reserves Tfr From
Loan Proceeds
Depreciation Cashflow
Total Receipts 131,000 249,000 380,000 190,002 0%
Asset Renewals
Asset Upgrade/New 380,000 380,000 190,002 35,915 9%
Asset Purchases
Principal Repayments
Reserves Tfr To
Total Payments 380,000 380,000 190,002 35,915 9%
Capital Surplus/ (Deficit) 131,000 (131,000) (35,915)
SURPLUS/(DEFICIT) 288,600 142,900 (446,162) (14,662) 285,456 79,498 (542%)
General Revenue Funding 288,600 142,900 (446,162) (14,662) 285,456 79,498 (542%)
Overall Surplus/(Deficit)
* Internal transactions have not been eliminated from this report
COMMENTARYVariances for the quarter are reduction of RFS grant compared to estimates, and adjustment of Fire Services Levy in operating cost. Also in the revision are
additional capital grant for RFS with corresponding capital expenses as well.
% Funded by Gen Revenue $ Funded by Gen Revenue 14,662
61

Group Manager | Wayne Sartori
34%
Funding
Service Area Grants $ Fees $ Gen Rev $ Health Revotes Amount $
Emergency Services 471,978
* Above Figures show Actual $
Reserve Name Opening $ Tfr To Tfr From Closing $
71010.7000.7035Mirador Asset Protection Development 150,000 150,000
71010.7000.7060Rural Fire Service Reserve
% Funded by Grants
-
50,000
100,000
150,000
200,000
250,000
Monthly Expense Progress
Employment Cost Operating Cost Capital Cost Actual
-
500,000
1,000,000
1,500,000
Overall Expense Progress
Employment Cost Operating Cost Capital Cost Actual
-
50,000
100,000
150,000
200,000
250,000
Monthly Expense Progress
Employment Cost Operating Cost Capital Cost Actual
- 200,000 400,000 600,000 800,000
1,000,000 1,200,000 1,400,000 1,600,000
Overall Income Progress
Rates Income Operating Income Capital Income Actual
(100,000)
-
100,000
200,000
300,000
400,000
500,000
600,000
700,000
Monthly Income Progress
Rates Income Operating Income Capital Income Actual
62

Function | Sewer Services
0%
2015 Budget Revision 2015 2015 2015 Actuals as %
Original September December March June Revised YTD YTD of Revised
Budget Quarter Quarter Quarter Quarter Budget Budget Actuals Budget
Operating Budget
Rates 14,063,000 14,063,000 14,063,000 14,041,105 100%
Fees & Charges 1,328,000 1,328,000 490,956 639,333 48%
Grants 123,000 123,000 61,500 127,206 103%
Other Revenues 614,000 614,000 307,002 17,193 3%
Lease Income
Attribution Revenue
Total Revenue 16,128,000 16,128,000 14,922,458 14,824,836 92%
Employment Costs 805,000 805,000 402,498 291,599 36%
Operating Costs 1,024,000 1,024,000 603,002 294,438 29%
Asset Maintenance 1,138,000 1,138,000 568,998 428,275 38%
Asset Operations 4,871,000 4,871,000 2,435,496 1,783,413 37%
Interest Payments 1,429,000 1,429,000 714,498 476,548 33%
Asset Depreciation
Attribution Costs 2,225,000 2,225,000 1,112,496 1,112,500 50%
Total Expenses 11,492,000 11,492,000 5,836,988 4,386,773 38%
Operating Surplus/ (Deficit) 4,636,000 4,636,000 9,085,470 10,438,064 225%
Capital Budget
Capital Grants
Developer Conts 1,586,000 1,586,000 793,002 222,641 14%
Other Capital Conts 122,564
Asset Sales
Land Sales
Reserves Tfr From 1,586,000 1,586,000 792,684 0%
Loan Proceeds
Depreciation Cashflow
Total Receipts 1,586,000 1,586,000 3,172,000 1,585,686 345,205 11%
Asset Renewals 2,030,000 2,030,000 1,015,002 491,256 24%
Asset Upgrade/New 2,310,000 2,310,000 1,155,000 833,197 36%
Asset Purchases 208,417
Principal Repayments 1,100,000 1,100,000 549,996 642,843 58%
Reserves Tfr To 782,000 1,586,000 2,368,000 1,183,686 0%
Total Payments 6,222,000 1,586,000 7,808,000 3,903,684 2,175,712 28%
Capital Surplus/ (Deficit) (4,636,000) (4,636,000) (2,317,998) (1,830,507) 39%
SURPLUS/(DEFICIT) 6,767,472 8,607,557
General Revenue Funding
Overall Surplus/(Deficit) 6,767,472 8,607,557
* Internal transactions have not been eliminated from this report
COMMENTARYSewer Services tracking well within budget with no variances to report
% Funded by Gen Revenue $ Funded by Gen Revenue
63

Group Manager | Wayne Sartori
1%
Funding
Service Area Grants $ Fees $ Gen Rev $ Health Revotes Amount $
Sewer Services 127,206 639,333
* Above Figures show Actual $
Reserve Name Opening $ Tfr To Tfr From Closing $
73010.7000.7004Asset Replacement 2,700,000 2,700,000
73010.7000.7023Employee Leave Entitlement 100,040 100,040
73010.7000.7050Loan Repayments 51,247 51,247
73010.7000.7051New Works 4,840,279 782,000 5,622,279
73010.7000.7053Sinking Fund - Loan 7125 198,550 198,550
73010.7000.7208S64 - Sewer Headworks 3,254,950 1,586,000 (1,586,000) 3,254,950
% Funded by Grants
- 200,000 400,000 600,000 800,000
1,000,000 1,200,000 1,400,000
Monthly Expense Progress
Employment Cost Operating Cost Capital Cost Actual
- 2,000,000 4,000,000 6,000,000 8,000,000
10,000,000 12,000,000 14,000,000
Overall Expense Progress
Employment Cost Operating Cost Capital Cost Actual
- 200,000 400,000 600,000 800,000
1,000,000 1,200,000 1,400,000
Monthly Expense Progress
Employment Cost Operating Cost Capital Cost Actual
-
5,000,000
10,000,000
15,000,000
20,000,000
Overall Income Progress
Rates Income Operating Income Capital Income Actual
(5,000,000)
-
5,000,000
10,000,000
15,000,000
20,000,000
Monthly Income Progress
Rates Income Operating Income Capital Income Actual
64

Function | Transport and Utility Group
0%
2015 Budget Revision 2015 2015 2015 Actuals as %
Original September December March June Revised YTD YTD of Revised
Budget Quarter Quarter Quarter Quarter Budget Budget Actuals Budget
Operating Budget
Rates 49,000 49,000 49,000 24,500 50%
Fees & Charges 123,000 123,000 61,506 79,984 65%
Grants
Other Revenues 1,000 1,000 498 2,319 232%
Lease Income
Attribution Revenue 3,700,000 3,700,000 1,849,998 1,851,089 50%
Total Revenue 3,873,000 3,873,000 1,961,002 1,957,891 51%
Employment Costs 2,094,200 (148,480) 1,945,720 972,864 1,351,350 69%
Operating Costs 262,000 262,000 130,998 129,993 50%
Asset Maintenance
Asset Operations 47,000 47,000 23,502 20,926 45%
Interest Payments
Asset Depreciation
Attribution Costs 1,543,000 1,543,000 771,498 771,500 50%
Total Expenses 3,946,200 (148,480) 3,797,720 1,898,862 2,273,769 60%
Operating Surplus/ (Deficit) (73,200) 148,480 75,280 62,140 (315,878) (420%)
Capital Budget
Capital Grants
Developer Conts 641,000 641,000 320,496 242,917 38%
Other Capital Conts
Asset Sales
Land Sales
Reserves Tfr From
Loan Proceeds
Depreciation Cashflow
Total Receipts 641,000 641,000 320,496 242,917 38%
Asset Renewals
Asset Upgrade/New
Asset Purchases
Principal Repayments
Reserves Tfr To 641,000 641,000 320,496 0%
Total Payments 641,000 641,000 320,496 0%
Capital Surplus/ (Deficit) 242,917
SURPLUS/(DEFICIT) (73,200) 148,480 75,280 62,140 (72,961)
General Revenue Funding (73,200) 148,480 75,280 62,140 (72,961) (97%)
Overall Surplus/(Deficit)
* Internal transactions have not been eliminated from this report
COMMENTARYTransport and Utiliy Group tracking well within budget with no variances to report
% Funded by Gen Revenue $ Funded by Gen Revenue
65

Group Manager | Wayne Sartori
0%
Funding
Service Area Grants $ Fees $ Gen Rev $ Health Revotes Amount $
TUG Administration 79,984 72,961
* Above Figures show Actual $
Reserve Name Opening $ Tfr To Tfr From Closing $
71010.7000.7201S94 - Carparking 938,606 938,606
71010.7000.7202S94 - Public Reserve Acquisition 372,346 372,346
71010.7000.7203S94 - Recreational Facilities
71010.7000.7204S94 - Rural Roads 155,978 155,978
71010.7000.7205S94 - South Pambula 20,808 20,808
71010.7000.7206S94 - Urban Roads 123,878 123,878
71010.7000.7209Other Contribution - Tathra Estate 41,000 41,000
71010.7000.7211S94 - Open Space and Recreation 89,740 (89,740)
71010.7000.7212S94 - Community Facilities 57,700 (57,700)
71010.7000.7213S94 - Roads 448,700 (448,700)
% Funded by Grants
(1,000,000)
(500,000)
-
500,000
1,000,000
Monthly Expense Progress
Employment Cost Operating Cost Capital Cost Actual
-
500,000
1,000,000
1,500,000
2,000,000
2,500,000
Overall Expense Progress
Employment Cost Operating Cost Capital Cost Actual
(1,000,000)
(500,000)
-
500,000
1,000,000
Monthly Expense Progress
Employment Cost Operating Cost Capital Cost Actual
-
1,000,000
2,000,000
3,000,000
4,000,000
5,000,000
Overall Income Progress
Rates Income Operating Income Capital Income Actual
(500,000)
-
500,000
1,000,000
1,500,000
Monthly Income Progress
Rates Income Operating Income Capital Income Actual
66

Function | Transport Services
38%
2015 Budget Revision 2015 2015 2015 Actuals as %
Original September December March June Revised YTD YTD of Revised
Budget Quarter Quarter Quarter Quarter Budget Budget Actuals Budget
Operating Budget
Rates 1,200,500 1,200,500 1,200,500 600,250 50%
Fees & Charges
Grants 4,238,000 (51,550) 4,186,450 2,093,220 1,997,071 48%
Other Revenues 6,000 6,000 3,000 0%
Lease Income
Attribution Revenue
Total Revenue 5,444,500 (51,550) 5,392,950 3,296,720 2,597,321 48%
Employment Costs
Operating Costs 3,124
Asset Maintenance 5,076,000 (91,831) 4,984,169 2,492,106 2,537,721 51%
Asset Operations 1,154,000 1,154,000 577,002 610,555 53%
Interest Payments 128,000 128,000 64,002 38,114 30%
Asset Depreciation
Attribution Costs 372,000 372,000 185,994 186,000 50%
Total Expenses 6,730,000 (91,831) 6,638,169 3,319,104 3,375,515 51%
Operating Surplus/ (Deficit) (1,285,500) 40,281 (1,245,219) (22,384) (778,194) 62%
Capital Budget
Capital Grants 1,462,000 1,404,075 2,866,075 1,433,040 1,483,462 52%
Developer Conts
Other Capital Conts
Asset Sales
Land Sales
Reserves Tfr From 448,700 268,240 716,940 358,476 0%
Loan Proceeds 1,670,000 1,670,000 835,002 0%
Depreciation Cashflow
Total Receipts 3,580,700 1,672,315 5,253,015 2,626,518 1,483,462 28%
Asset Renewals 7,306,000 1,512,135 8,818,135 4,409,052 2,515,764 29%
Asset Upgrade/New 1,581,000 108,635 1,689,635 844,818 1,392,635 82%
Asset Purchases
Principal Repayments 150,000 150,000 75,000 95,467 64%
Reserves Tfr To
Total Payments 9,037,000 1,620,770 10,657,770 5,328,870 4,003,865 38%
Capital Surplus/ (Deficit) (5,456,300) 51,545 (5,404,755) (2,702,352) (2,520,403) 47%
SURPLUS/(DEFICIT) (6,741,800) 91,826 (6,649,974) (2,724,736) (3,298,597)
General Revenue Funding (6,741,800) 91,826 (6,649,974) (2,724,736) (3,298,597) 50%
Overall Surplus/(Deficit)
* Internal transactions have not been eliminated from this report
COMMENTARYTransport Services on track with budget except for Asset upgrades which is over due to Towamba Road upgrade being over budget due to inclement weather.
% Funded by Gen Revenue $ Funded by Gen Revenue 6,649,974
67

Group Manager | Wayne Sartori
24%
Funding
Service Area Grants $ Fees $ Gen Rev $ Health Revotes Amount $
Bridges 962,803 BUS SHELTERS 2006/2007 CPTIGS 22,464
Roads 3,480,533 2,335,794 BUS SHELTERS 2008/2009 CPTIGS 56,578
BUS SHELTERS 2010/2011 CPTIGS 29,591
REPAIR PROGRAM 2013/2014 (INCL 119,223
* Above Figures show Actual $
Reserve Name Opening $ Tfr To Tfr From Closing $
% Funded by Grants
-
500,000
1,000,000
1,500,000
2,000,000
Monthly Expense Progress
Employment Cost Operating Cost Capital Cost Actual
-
5,000,000
10,000,000
15,000,000
20,000,000
Overall Expense Progress
Employment Cost Operating Cost Capital Cost Actual
-
500,000
1,000,000
1,500,000
2,000,000
Monthly Expense Progress
Employment Cost Operating Cost Capital Cost Actual
-
2,000,000
4,000,000
6,000,000
8,000,000
10,000,000
Overall Income Progress
Rates Income Operating Income Capital Income Actual
-
500,000
1,000,000
1,500,000
2,000,000
2,500,000
Monthly Income Progress
Rates Income Operating Income Capital Income Actual
68

Function | Waste Services
0%
2015 Budget Revision 2015 2015 2015 Actuals as %
Original September December March June Revised YTD YTD of Revised
Budget Quarter Quarter Quarter Quarter Budget Budget Actuals Budget
Operating Budget
Rates 7,238,000 7,238,000 7,238,000 7,298,651 101%
Fees & Charges 1,200,000 365,000 1,565,000 782,436 893,746 57%
Grants 180,000 180,000 90,000 157,182 87%
Other Revenues 185,000 185,000 92,502 8,968 5%
Lease Income 1,000 1,000 498 706 71%
Attribution Revenue
Total Revenue 8,804,000 365,000 9,169,000 8,203,436 8,359,253 91%
Employment Costs 286,000 286,000 142,998 113,844 40%
Operating Costs 3,387,000 3,387,000 1,714,996 1,237,012 37%
Asset Maintenance 2,498,000 2,498,000 1,249,002 1,053,530 42%
Asset Operations 7,006
Interest Payments 7,000 7,000 3,498 2,844 41%
Asset Depreciation
Attribution Costs 914,000 914,000 457,002 457,000 50%
Total Expenses 7,092,000 7,092,000 3,567,496 2,871,236 40%
Operating Surplus/ (Deficit) 1,712,000 365,000 2,077,000 4,635,940 5,488,017 264%
Capital Budget
Capital Grants
Developer Conts
Other Capital Conts
Asset Sales
Land Sales
Reserves Tfr From 515,000 515,000 257,502 0%
Loan Proceeds
Depreciation Cashflow
Total Receipts 515,000 515,000 257,502 0%
Asset Renewals 292,892
Asset Upgrade/New 2,215,000 2,215,000 1,107,498 118,177 5%
Asset Purchases
Principal Repayments 12,000 12,000 6,000 12,290 102%
Reserves Tfr To 365,000 365,000 182,430 0%
Total Payments 2,227,000 365,000 2,592,000 1,295,928 423,358 16%
Capital Surplus/ (Deficit) (1,712,000) (365,000) (2,077,000) (1,038,426) (423,358) 20%
SURPLUS/(DEFICIT) 3,597,514 5,064,659
General Revenue Funding
Overall Surplus/(Deficit) 3,597,514 5,064,659
* Internal transactions have not been eliminated from this report
COMMENTARYWaste Fund is tracking well compared to its estimates. There was a positive variance due to increase in gate income at the waste facilites across council. This has
been restricted to fund future waste capital program.
% Funded by Gen Revenue $ Funded by Gen Revenue
69

Group Manager | Wayne Sartori
2%
Funding
Service Area Grants $ Fees $ Gen Rev $ Health Revotes Amount $
Waste Services 157,182 893,746
* Above Figures show Actual $
Reserve Name Opening $ Tfr To Tfr From Closing $
71010.7000.7048Waste Management [Domestic] 4,768,589 (515,000) 4,253,589
71010.7000.7049Waste Management [Other] 342,762 365,000 707,762
% Funded by Grants
-
200,000
400,000
600,000
800,000
1,000,000
Monthly Expense Progress
Employment Cost Operating Cost Capital Cost Actual
-
2,000,000
4,000,000
6,000,000
8,000,000
10,000,000
Overall Expense Progress
Employment Cost Operating Cost Capital Cost Actual
-
200,000
400,000
600,000
800,000
1,000,000
Monthly Expense Progress
Employment Cost Operating Cost Capital Cost Actual
-
2,000,000
4,000,000
6,000,000
8,000,000
10,000,000
Overall Income Progress
Rates Income Operating Income Capital Income Actual
(2,000,000)
-
2,000,000
4,000,000
6,000,000
8,000,000
Monthly Income Progress
Rates Income Operating Income Capital Income Actual
70
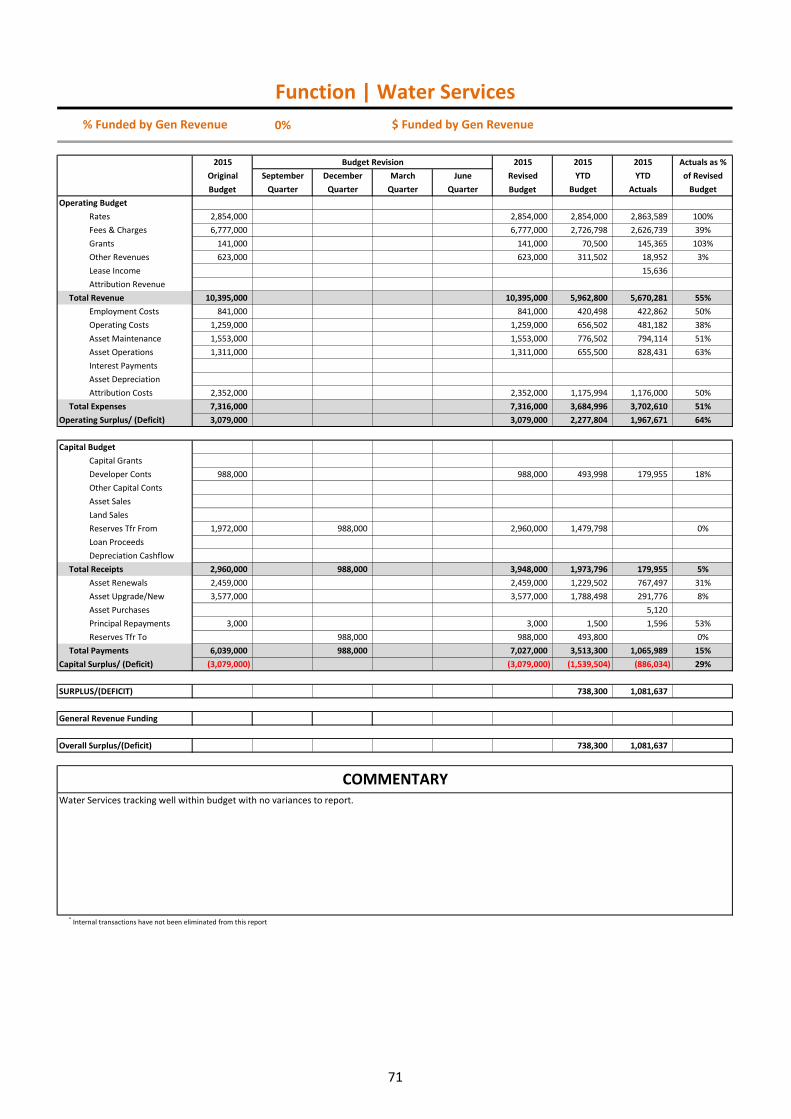
Function | Water Services
0%
2015 Budget Revision 2015 2015 2015 Actuals as %
Original September December March June Revised YTD YTD of Revised
Budget Quarter Quarter Quarter Quarter Budget Budget Actuals Budget
Operating Budget
Rates 2,854,000 2,854,000 2,854,000 2,863,589 100%
Fees & Charges 6,777,000 6,777,000 2,726,798 2,626,739 39%
Grants 141,000 141,000 70,500 145,365 103%
Other Revenues 623,000 623,000 311,502 18,952 3%
Lease Income 15,636
Attribution Revenue
Total Revenue 10,395,000 10,395,000 5,962,800 5,670,281 55%
Employment Costs 841,000 841,000 420,498 422,862 50%
Operating Costs 1,259,000 1,259,000 656,502 481,182 38%
Asset Maintenance 1,553,000 1,553,000 776,502 794,114 51%
Asset Operations 1,311,000 1,311,000 655,500 828,431 63%
Interest Payments
Asset Depreciation
Attribution Costs 2,352,000 2,352,000 1,175,994 1,176,000 50%
Total Expenses 7,316,000 7,316,000 3,684,996 3,702,610 51%
Operating Surplus/ (Deficit) 3,079,000 3,079,000 2,277,804 1,967,671 64%
Capital Budget
Capital Grants
Developer Conts 988,000 988,000 493,998 179,955 18%
Other Capital Conts
Asset Sales
Land Sales
Reserves Tfr From 1,972,000 988,000 2,960,000 1,479,798 0%
Loan Proceeds
Depreciation Cashflow
Total Receipts 2,960,000 988,000 3,948,000 1,973,796 179,955 5%
Asset Renewals 2,459,000 2,459,000 1,229,502 767,497 31%
Asset Upgrade/New 3,577,000 3,577,000 1,788,498 291,776 8%
Asset Purchases 5,120
Principal Repayments 3,000 3,000 1,500 1,596 53%
Reserves Tfr To 988,000 988,000 493,800 0%
Total Payments 6,039,000 988,000 7,027,000 3,513,300 1,065,989 15%
Capital Surplus/ (Deficit) (3,079,000) (3,079,000) (1,539,504) (886,034) 29%
SURPLUS/(DEFICIT) 738,300 1,081,637
General Revenue Funding
Overall Surplus/(Deficit) 738,300 1,081,637
* Internal transactions have not been eliminated from this report
COMMENTARYWater Services tracking well within budget with no variances to report.
% Funded by Gen Revenue $ Funded by Gen Revenue
71

Group Manager | Wayne Sartori
1%
Funding
Service Area Grants $ Fees $ Gen Rev $ Health Revotes Amount $
Water Services 145,365 2,626,739
* Above Figures show Actual $
Reserve Name Opening $ Tfr To Tfr From Closing $
72010.7000.7004Asset Replacement 2,910,452 2,910,452
72010.7000.7023Employee Leave Entitlement 100,000 100,000
72010.7000.7050Loan Repayments
72010.7000.7051New Works 5,800,000 (1,972,000) 3,828,000
72010.7000.7052Tura Beach Works 137,411 137,411
72010.7000.7054Sinking Fund - Loan 7162
72010.7000.7207S64 - Water Headworks 5,099,274 988,000 (988,000) 5,099,274
% Funded by Grants
-
200,000
400,000
600,000
800,000
1,000,000
1,200,000
Monthly Expense Progress
Employment Cost Operating Cost Capital Cost Actual
-
2,000,000
4,000,000
6,000,000
8,000,000
10,000,000
12,000,000
Overall Expense Progress
Employment Cost Operating Cost Capital Cost Actual
-
200,000
400,000
600,000
800,000
1,000,000
1,200,000
Monthly Expense Progress
Employment Cost Operating Cost Capital Cost Actual
-
2,000,000
4,000,000
6,000,000
8,000,000
10,000,000
12,000,000
Overall Income Progress
Rates Income Operating Income Capital Income Actual
-
500,000
1,000,000
1,500,000
2,000,000
2,500,000
3,000,000
3,500,000
Monthly Income Progress
Rates Income Operating Income Capital Income Actual
72
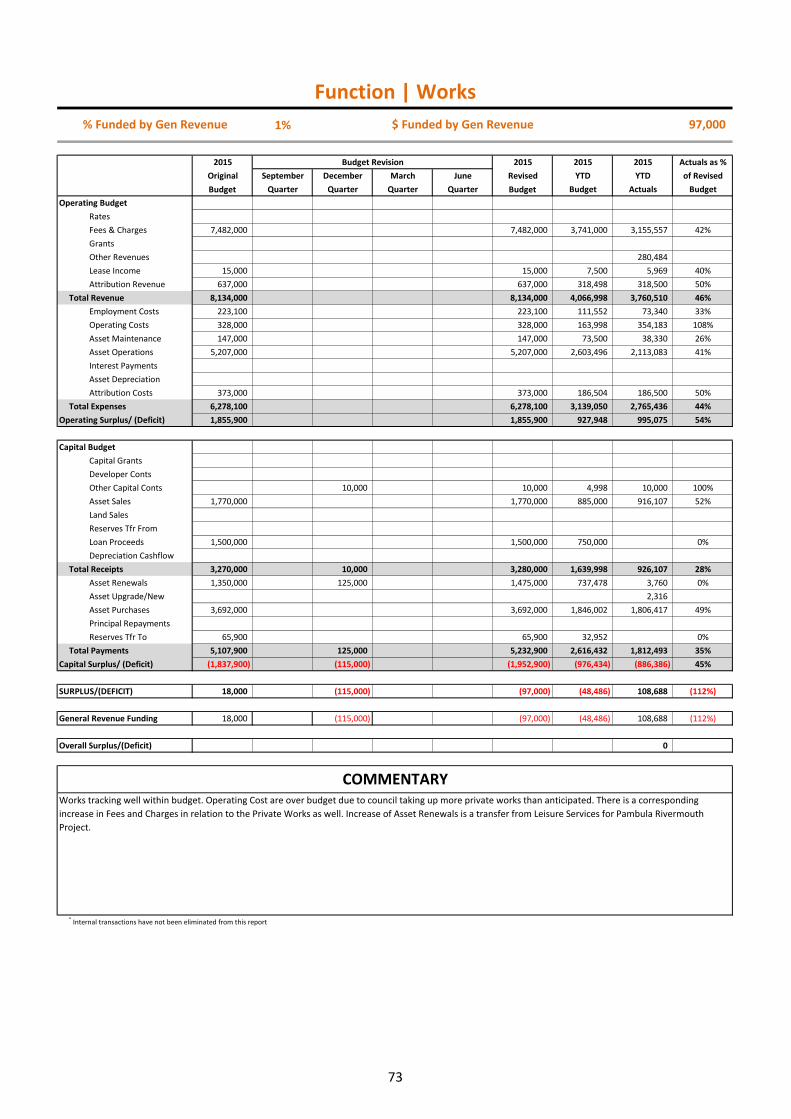
Function | Works
1%
2015 Budget Revision 2015 2015 2015 Actuals as %
Original September December March June Revised YTD YTD of Revised
Budget Quarter Quarter Quarter Quarter Budget Budget Actuals Budget
Operating Budget
Rates
Fees & Charges 7,482,000 7,482,000 3,741,000 3,155,557 42%
Grants
Other Revenues 280,484
Lease Income 15,000 15,000 7,500 5,969 40%
Attribution Revenue 637,000 637,000 318,498 318,500 50%
Total Revenue 8,134,000 8,134,000 4,066,998 3,760,510 46%
Employment Costs 223,100 223,100 111,552 73,340 33%
Operating Costs 328,000 328,000 163,998 354,183 108%
Asset Maintenance 147,000 147,000 73,500 38,330 26%
Asset Operations 5,207,000 5,207,000 2,603,496 2,113,083 41%
Interest Payments
Asset Depreciation
Attribution Costs 373,000 373,000 186,504 186,500 50%
Total Expenses 6,278,100 6,278,100 3,139,050 2,765,436 44%
Operating Surplus/ (Deficit) 1,855,900 1,855,900 927,948 995,075 54%
Capital Budget
Capital Grants
Developer Conts
Other Capital Conts 10,000 10,000 4,998 10,000 100%
Asset Sales 1,770,000 1,770,000 885,000 916,107 52%
Land Sales
Reserves Tfr From
Loan Proceeds 1,500,000 1,500,000 750,000 0%
Depreciation Cashflow
Total Receipts 3,270,000 10,000 3,280,000 1,639,998 926,107 28%
Asset Renewals 1,350,000 125,000 1,475,000 737,478 3,760 0%
Asset Upgrade/New 2,316
Asset Purchases 3,692,000 3,692,000 1,846,002 1,806,417 49%
Principal Repayments
Reserves Tfr To 65,900 65,900 32,952 0%
Total Payments 5,107,900 125,000 5,232,900 2,616,432 1,812,493 35%
Capital Surplus/ (Deficit) (1,837,900) (115,000) (1,952,900) (976,434) (886,386) 45%
SURPLUS/(DEFICIT) 18,000 (115,000) (97,000) (48,486) 108,688 (112%)
General Revenue Funding 18,000 (115,000) (97,000) (48,486) 108,688 (112%)
Overall Surplus/(Deficit) 0
* Internal transactions have not been eliminated from this report
COMMENTARYWorks tracking well within budget. Operating Cost are over budget due to council taking up more private works than anticipated. There is a corresponding
increase in Fees and Charges in relation to the Private Works as well. Increase of Asset Renewals is a transfer from Leisure Services for Pambula Rivermouth
Project.
% Funded by Gen Revenue $ Funded by Gen Revenue 97,000
73

Group Manager | Wayne Sartori
0%
Funding
Service Area Grants $ Fees $ Gen Rev $ Health Revotes Amount $
Council Depots
Fleet 2,905,045
Private Works 192,058 14,792
Public Amenities 310,103
Quarries 58,455
Saleyard
Town Centre Carparks 5,849
* Above Figures show Actual $
Reserve Name Opening $ Tfr To Tfr From Closing $
71010.7000.7037Plant Replacement 555,226 65,900 621,126
71010.7000.7041Quarries and Gravel Pits 283,842 283,842
71010.7000.7042Saleyards 31,354 31,354
% Funded by Grants
-
500,000
1,000,000
1,500,000
Monthly Expense Progress
Employment Cost Operating Cost Capital Cost Actual
-
2,000,000
4,000,000
6,000,000
8,000,000
10,000,000
12,000,000
Overall Expense Progress
Employment Cost Operating Cost Capital Cost Actual
-
500,000
1,000,000
1,500,000
Monthly Expense Progress
Employment Cost Operating Cost Capital Cost Actual
-
2,000,000
4,000,000
6,000,000
8,000,000
10,000,000
12,000,000
Overall Income Progress
Rates Income Operating Income Capital Income Actual
-
200,000
400,000
600,000
800,000
1,000,000
1,200,000
Monthly Income Progress
Rates Income Operating Income Capital Income Actual
74


