ICAIS 22-26 OCT 2017 Ft. Lauderdale
Quantifying the Extent of Niche
Areas in the Global Fleet of
Commercial Ships: The Potential for
"Super-Hot Spots" of Biofouling Cameron S. Moser1, Timothy P. Wier2, Matthew R. First3, Jonathan F. Grant4,
Scott C. Riley2, Stephanie H. Robbins-Wamsley2, Mario N. Tamburri5,
Gregory M. Ruiz6, A. Whitman Miller6, Lisa A. Drake1
1Code 6137, Naval Research Laboratory, Key West, FL 33040 2Excet, Inc., Springfield, VA 22150 3Code 6137, Naval Research Laboratory, Washington, DC 20375 4Battenkill Technologies, Inc., Manchester Center, VT 05255 5Chesapeake Biological Laboratory, University of Maryland Center for
Environmental Science, Solomons, MD 20688 6Smithsonian Environmental Research Center, Edgewater, MD 21037
U.S. Naval Research Laboratory | 2
Introduction
• International Maritime Organization (IMO) Resolution MEPC.207(62):
• Guidelines for the Control and Management of Ships’ Biofouling to Minimize the Transfer of Invasive Aquatic Species
• Adopted on 15 July, 2011

U.S. Naval Research Laboratory | 3
Ships’ Biofouling on a Global Scale
• Policies and management strategies can benefit from an evaluation of biofouling:
• Magnitude on a global scale
• Flux between regions
Global shipping activity; source: http://www.marinetraffic.com/en/ais/home/centerx:-28/centery:42/zoom:4
U.S. Naval Research Laboratory | 4
Goals of this Work
• Develop a method to quantify the scope or extent of biofouling for a given set of data on a fleet of ships
• Apply the method to the global fleet of commercial ships
• Methods can be used to inform risk assessment models for invasion

U.S. Naval Research Laboratory | 5
Quantifying Biofouling on a Ship
• Total wetted surface area (WSA)
• Represents potential for biofuling
• Niche areas
• “Hotspots” for biofouling http://www.asa.com.au/
U.S. Naval Research Laboratory | 6
Biological Niche Areas
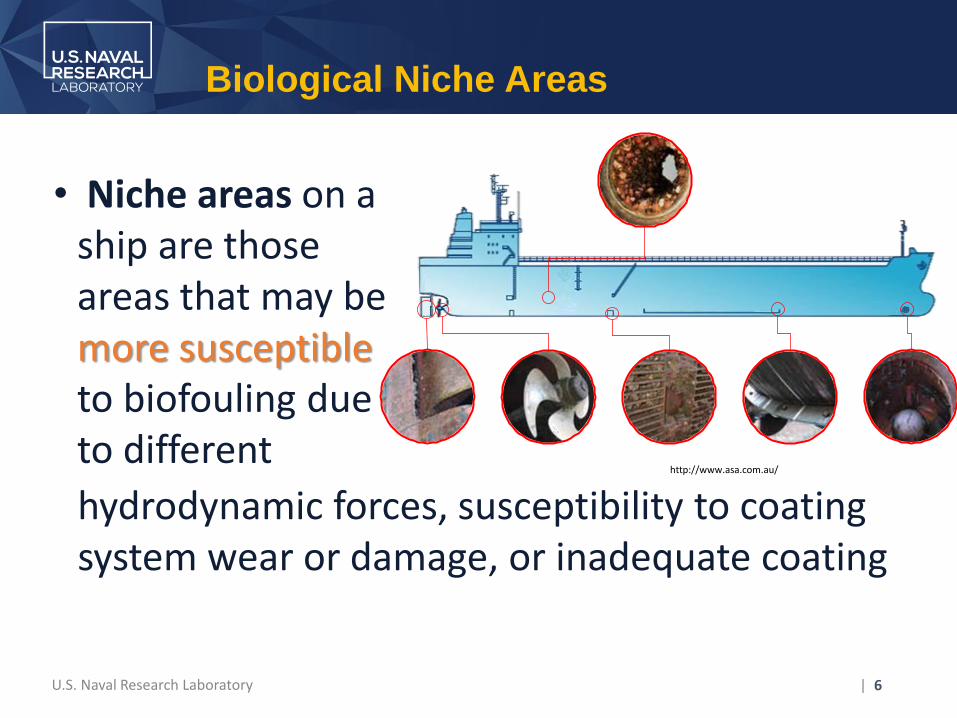
• Niche areas on a ship are those areas that may be more susceptible to biofouling due to different
hydrodynamic forces, susceptibility to coating system wear or damage, or inadequate coating
http://www.asa.com.au/
U.S. Naval Research Laboratory | 7
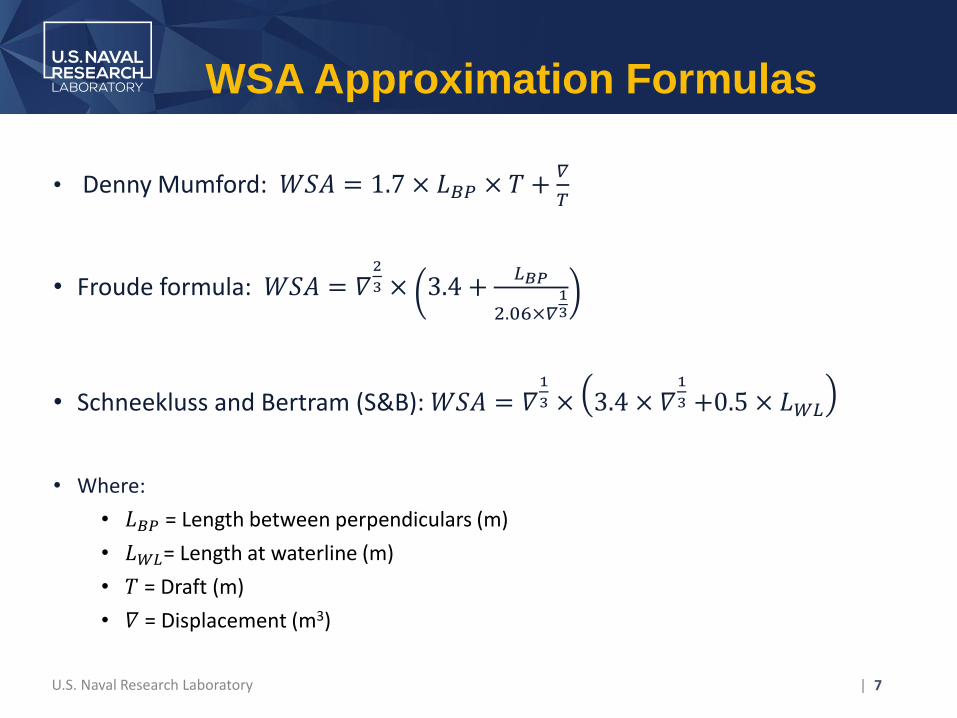
WSA Approximation Formulas
• Denny Mumford: 𝑊𝑆𝐴 = 1.7 × 𝐿𝐵𝑃 × 𝑇 +𝛻
𝑇
• Froude formula: 𝑊𝑆𝐴 = 𝛻2
3 × 3.4 +𝐿𝐵𝑃
2.06×𝛻13
• Schneekluss and Bertram (S&B): 𝑊𝑆𝐴 = 𝛻1
3 × 3.4 × 𝛻1
3 +0.5 × 𝐿𝑊𝐿
• Where:
• 𝐿𝐵𝑃 = Length between perpendiculars (m)
• 𝐿𝑊𝐿= Length at waterline (m)
• 𝑇 = Draft (m)
• 𝛻 = Displacement (m3)

U.S. Naval Research Laboratory | 8
Data Collection
• Sources include: • Smithsonian Environmental Research Center
(National Ballast Information Clearinghouse; NBIC)
• American Bureau of Ships
• Bureau Veritas
• Russian Register of Shipping
• Det Norske Veritas
• GrossTonnage.org
• 191,440 ship records
• 120,252 confirmed active ships from 1999-2013 (NBIC)
• All ships include IMO numbers and ship type
U.S. Naval Research Laboratory | 9
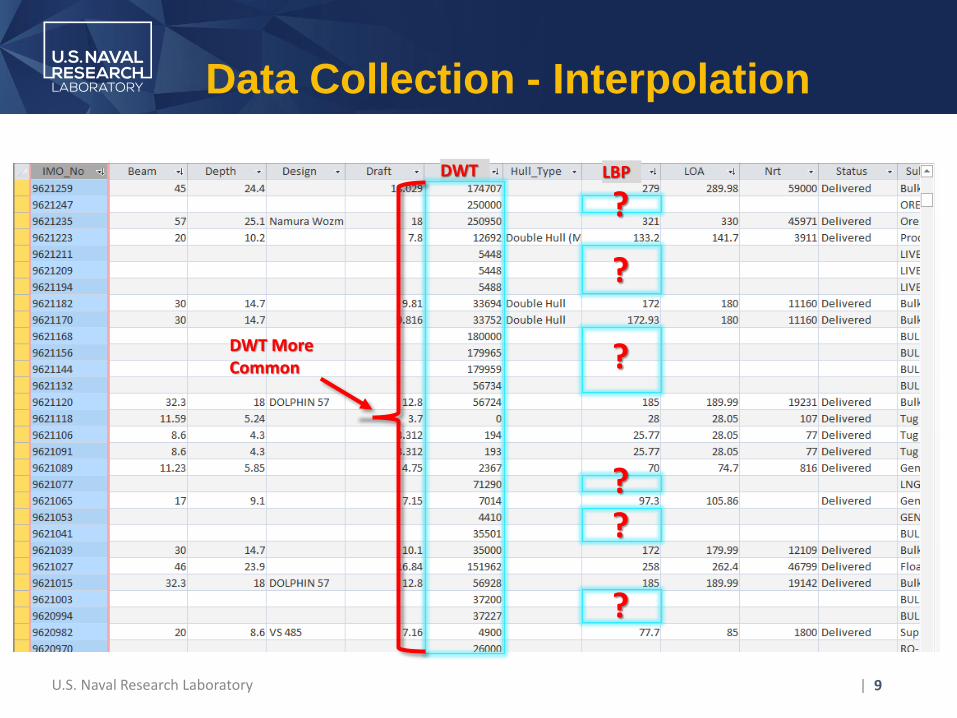
Data Collection - Interpolation
LBP
?
?
?
? ?
?
DWT
DWT More Common
U.S. Naval Research Laboratory | 10
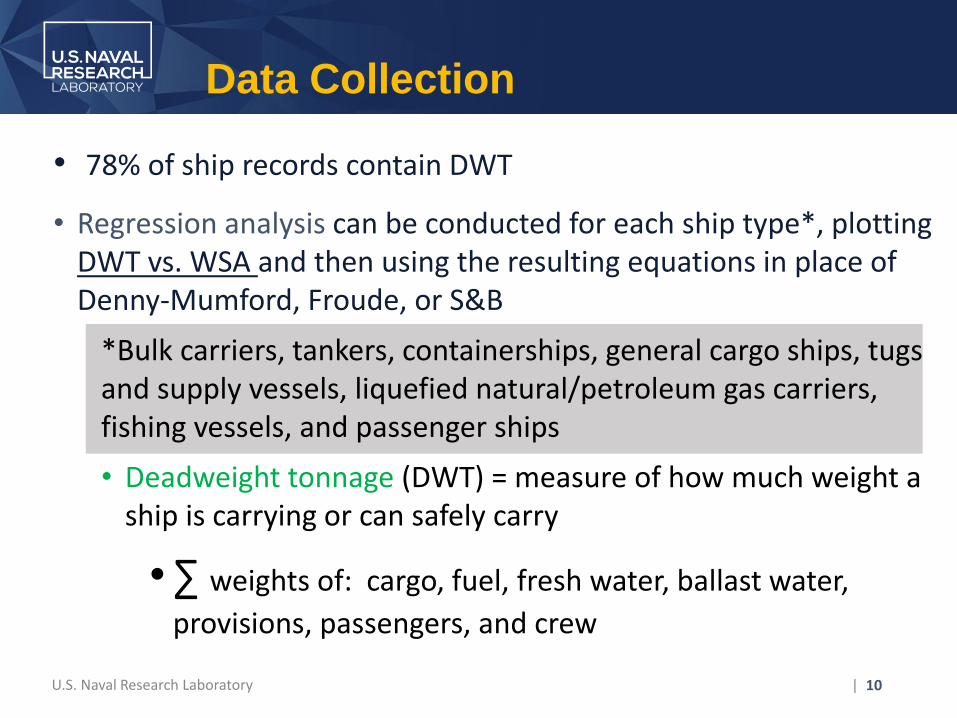
Data Collection
• 78% of ship records contain DWT
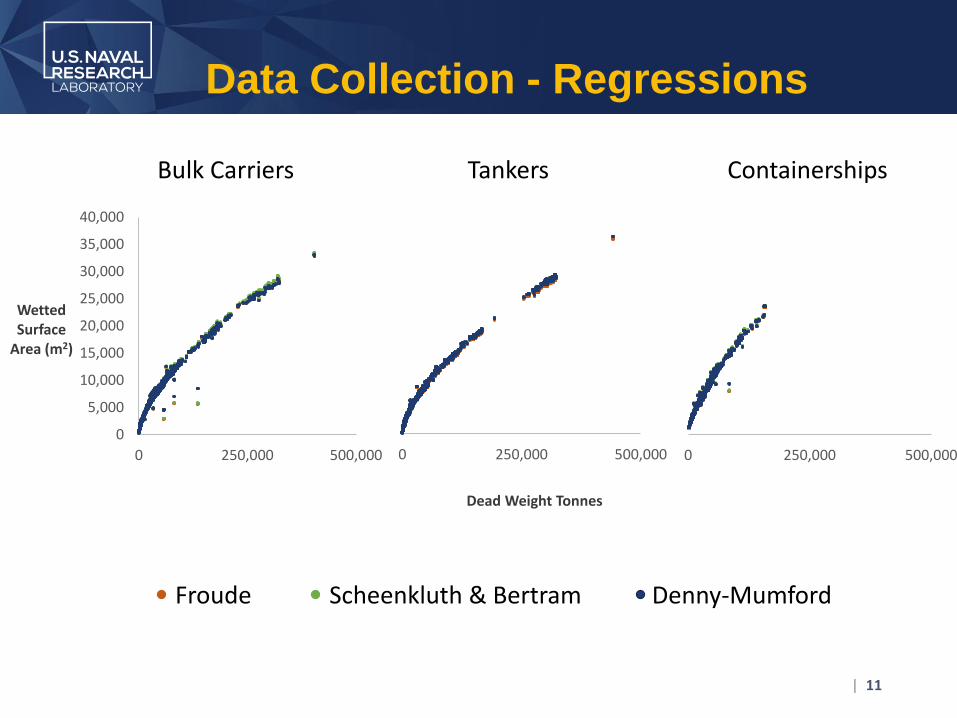
• Regression analysis can be conducted for each ship type*, plotting DWT vs. WSA and then using the resulting equations in place of Denny-Mumford, Froude, or S&B
*Bulk carriers, tankers, containerships, general cargo ships, tugs and supply vessels, liquefied natural/petroleum gas carriers, fishing vessels, and passenger ships
• Deadweight tonnage (DWT) = measure of how much weight a ship is carrying or can safely carry
•∑ weights of: cargo, fuel, fresh water, ballast water,
provisions, passengers, and crew
U.S. Naval Research Laboratory
0
5,000
10,000
15,000
20,000
25,000
30,000
35,000
40,000
0 250,000 500,000
Wetted Surface
Area (m2)
Denny-Mumford
| 11
Data Collection - Regressions
0 250,000 500,000 0 250,000 500,000
Froude Scheenkluth & Bertram
Dead Weight Tonnes
Bulk Carriers Tankers Containerships
U.S. Naval Research Laboratory | 12
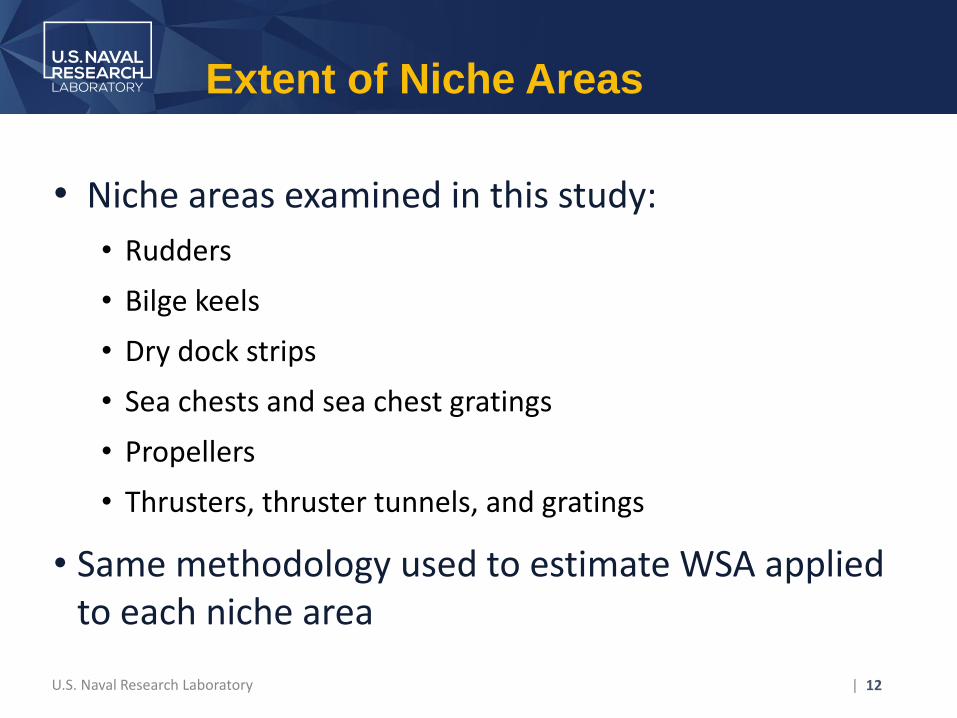
Extent of Niche Areas
• Niche areas examined in this study:
• Rudders
• Bilge keels
• Dry dock strips
• Sea chests and sea chest gratings
• Propellers
• Thrusters, thruster tunnels, and gratings
• Same methodology used to estimate WSA applied to each niche area

U.S. Naval Research Laboratory
Bulkers and Tankers over 50% of the fleet
| 13
Results - Total Hull WSA
40,000 80,000 120,000
Passenger
Fishing
LNG and LPG
Tug and Supply
Other
General Cargo
Containership
Tanker
Bulk Carrier
WSA x 103 (m2)
1
Total WSA of active ships = 325 km2
2
3
4
5
6
7
8
9
Rank Ship Type

U.S. Naval Research Laboratory | 14
Extent of Niche Areas
Area Surface Area (m2) Football Field 5,400
Manhattan Island 87,460,000
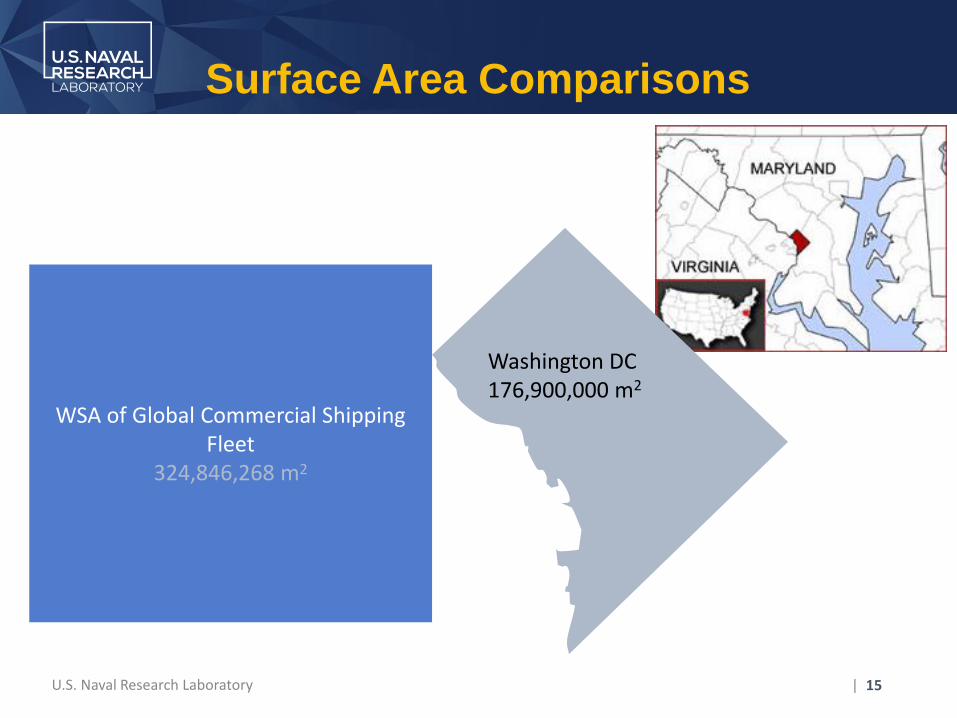
Washington DC 176,900,000
Malta 316,000,000
WSA of Global Commercial Shipping Fleet 324,846,268
Grenada 344,000,000
Guam 541,000,000
Los Angeles 1,302,000,000
Everglades 1,900,000,000
Rhode Island 3,140,000,000
U.S. Naval Research Laboratory | 15
Surface Area Comparisons
WSA of Global Commercial Shipping Fleet
324,846,268 m2
Washington DC 176,900,000 m2

U.S. Naval Research Laboratory | 16
Results – Extent of Niche Areas
Passenger ships have the highest niche area to WSA ratio (large number of thrusters)
#1 - Bulkers #2 - Tankers
U.S. Naval Research Laboratory | 17
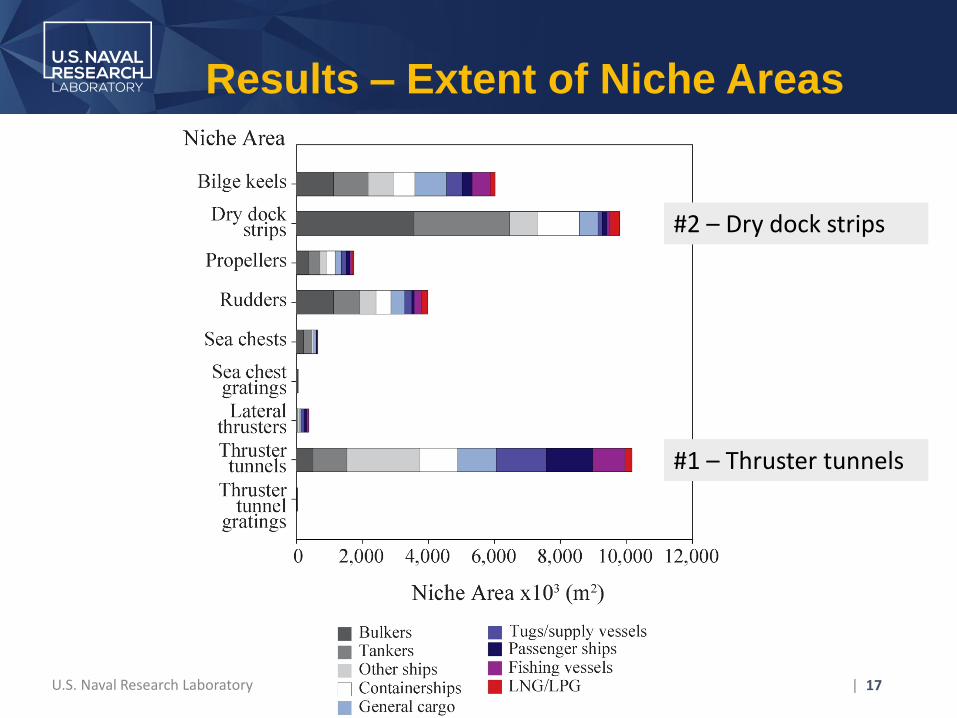
Results – Extent of Niche Areas
#2 – Dry dock strips
#1 – Thruster tunnels
U.S. Naval Research Laboratory | 18
Conclusions
• Bulk carriers and tankers comprise a majority of the hull WSA of the global fleet of commercial ships
• Thruster tunnels and dry dock strips make up a majority of the extent of niche areas
• Thrusters could be considered “super hot-spots” as they could actively expel organisms when activated, usually when maneuvering close to port

U.S. Naval Research Laboratory | 19
Future work
• Methods developed to estimate the hull WSA and extent of niche areas for a given data set on a fleet of ships can be used to help determine flux of biofouling into ports and local regions and ultimately inform risk assessment models for invasion
U.S. Naval Research Laboratory | 20
Acknowledgements
We thank,
Mario Tamburri (Maryland Environmental Resource Center) and Carolyn Junemann (Maritime
Administration) for advice and programmatic support.
This work was supported by Diane Lysogorski, Former Section Head of NRL Code 6136 and Director of the
Center for Corrosion Science and Engineering - Key West, Florida

U.S. Naval Research Laboratory
Publications
• Moser CS, Wier TP, Grant JF, Riley SC, Robbins-Wamsley SH, Tamburri MN, Ruiz GN, Miller AW, First MR, and Drake LA (2017). Quantifying the extent of niche areas in the global fleet of commercial ships: the potential for “super-hot spots” of biofouling. Biol. Invasions. doi: 10.1007/s10530-017-1386-4
• Moser CS, Wier TP, Grant JF, Tamburri MN, Ruiz GN, Miller AW, First MR, and Drake LA (2015). Quantifying the total wetted surface area of the world fleet: A first step in determining the potential extent of ships’ biofouling. Biol. Invasions. 18(1):265–277. doi:10.1007/s10530-015-1036-7


