1
Quantification of Virtual Water balance of Tunisia: Flows Embedded in the main produced,
consumed and exchanged Agricultural Commodities
Mariem Makhlouf , Aymen Frija, Ali Chebil , Asma Souissi, Talel Stambouli, Abdalah Benalaya
Abstract
This paper estimates the virtual water content and flows of Tunisia embedded in its main exchanged
strategic agricultural commodities, with clear quantification of both green and blue water.
Comprehensive surveys of inputs and outputs of main agricultural commodities consumed and
exported in Tunisia were conducted and validated in all bioclimatic regions of the country. Virtual
water content was also estimated for the same crops in different bioclimatic areas. Our calculations
show that Tunisia is a net virtual water “importer”. We also surprisingly show that, even though olive
production is mostly rain fed, olive oil production is still identified as the most water demanding
commodity (7 m3/kg) in Tunisia due to the need of blue water for its processing. By exporting 145.9
thousand tons of olive oil and 97.8 thousand tons of date in 2013, Tunisia has respectively lost 1079.6
and 283.6 Million m3 of virtual water. On the other hand, by importing 2146.6 thousand tons of cereals
and 15.7 thousand tons of potato in the same year, Tunisia has respectively saved 2901.7 and 3.14
Million m3of water resources.
Key word: Trade, Agriculture, Virtual Water, Tunisia
Résumé
Ce travail évalue la teneur en eau virtuelle et les flux de la Tunisie incorporées dans ses principaux
produits agricoles stratégiques échangés, avec une quantification précise de l'eau verte et bleue. Une
enquête approfondie des principaux produits agricoles consommés et exportés en Tunisie a été réalisée
et validée dans toutes les régions bioclimatiques du pays. La teneur en eau virtuelle a également été
estimée pour les mêmes cultures dans différentes régions bioclimatiques. Nos calculs montrent que la
Tunisie est un pays "importateur net " d‟eau virtuelle. Nos résultats montrent aussi que, même si la
production d'olives est principalement pluviale, la production d'huile d'olive est toujours identifiée
comme le produit le plus exigeant en eau (7 m3 / kg) en Tunisie en raison de la nécessité de l'eau bleue
pour son transformation. Dès lors, en exportant 145.9 mille tonnes d'huile d'olive et 97.8 mille tonnes
de dattes en 2013, la Tunisie a perdu respectivement 1079.6 et 283.6 Mm3 d'eau. D'autre part, en
important 2146.6 mille tonnes de céréales et 15.7 mille tonnes de pommes de terre dans la même
année, la Tunisie a économisé respectivement 2901,7 et 3.14 6 Mm3 de ressource d'eau.
Mot clé : Commerce, Agriculture, Eau Virtuelle, Tunisie
1. Introduction
Since the beginning of the 21 century water has been increasingly considered as an economic good. In
addition to the necessity of water valuation and pricing, another major inspiration related to the
metaphor of virtual has been driven by water scarcity and necessity for sustainable management
options for water resources through controlling food trade. The concept of virtual water was first
introduced by Allan (1998) to indicate the volume of water used to produce a commodity. The main
components of virtual water are the green (the infiltrated rainwater stored in soils) and the blue water
(referring to surface and ground water). Nevertheless, from an economic point of view, mostly blue
water has been always considered for productivity growth assessment in agricultural (and other)
sectors.
In 1997, Allan introduced the concept of virtual water as “a powerful economic tool to deal with water
scarcity problems of nations” (Allan, 1997). Virtual water can then be considered as a potential tool to
resolve the geopolitical conflicts between nations suffering from water penury, which in turn has deep
implications on food security (Allan, 1996). In this context and according to the World Bank,
countries in the Middle East and North Africa, which are among the poorest in the world in terms of

2
water resources availability may have potential benefit by investigating the scope of virtual water trade
on savings of their limited water resources.
Wichelns (2001) and Allan (2003) also mentioned the close similarity between virtual water and the
theory of comparative advantage, and that “virtual water can be considered as a descendant of that
theory”. Based on this interpretation scarce water nations can gain by importing water-intensive crops
while using their limited water availability for cropping activities generating greater added value
(Chapagain and Hoekstra, 2003; Wichelns, 2004). Therefore, optimal trading strategies may be
defined by taking into account the opportunity costs of production within countries, evaluating
comparative advantages, and considering other social, economic, and environmental dimensions of
public policy objectives (Wichelns, 2010). Hoekstra and Hung (2005) were the first to develop a
methodology to estimate the quantity of virtual water flows between nations through crop and
livestock trade. Their method can also be helpful in generating public awareness concerning the
volume of water required for commodity production. They used basic approach of multiplying
international crop trade (ton/year for each crop) by its associated virtual water content expressed in
m3/ton for each crop (Hoekstra and Hung, 2005; Novo, 2008). Despite the importance of virtual water
trade analysis on policy and management making towards water scarcity, only few studies was
developed in a national level.
This study particularly focuses on the Tunisian case. As most of Mediterranean countries, Tunisia is
considered as a water scarce. Annual per capita water availability in Tunisia is only around 500 m3 and
is expected to decrease to 370 m3 per capita in 2030. Agriculture is the largest water user in Tunisia,
accounting for about 80% of annual consumption while domestic use 12% and other uses (industrial
and tourism) 8% (Plan Bleu, 2011). Our objective is to analyze the flows of virtual water in the main
exchanged strategic commodities of Tunisia; and to evaluate the virtual water balance of the country.
Through this investigation we aim to define the scope of the virtual water concept for saving water
resources in Tunisia, and providing policy insights about possible impact of considering virtual water
trade in the national water management strategy. Contrary to the majority of the studies quantifying
virtual water content and referring their calculations to the FAO‟s database concerning the crop water
requirement, the current study is rather based on a database derived from our own field investigation
including 80% of the country‟s regions and cropping systems. In Tunisia, Chahed et al. (2010) was the
first who evoked the concept of virtual water, by developing a method of systematic assessment of
water resources involved in the production of rain-fed crops, particularly cereals and olive (Chahed et
al., 2010). He especially stressed the importance of considering green water in the estimation of virtual
water content of rain-fed crops. Chahed et al (2015) also attempts to highlight the relationship between
water scarcity and food security through evaluating the amount of water equivalent of food stuff
production in Tunisia. Since the water equivalent of food demand has increased essentially due to
population growth, recourse to virtual water trade through the exchange of agricultural products allow
a water gain of 5,8 Km3.
The rest of the paper is organized as follows. The second section presents a brief description of the
literature review. The methodology used to quantify virtual water content of agricultural commodities
in Tunisia is presented in the third section. Results are presented and discussed in sections four and
five. And a last section concludes.
2. Literature review
Major research efforts have been made to account for the virtual water flows in the world. These
works are not only attached to quantify these "silent" transfers water, but also to assess the impacts on
water resources management at both local and global level. Firstly, several studies assessed the flow of
global virtual water or between continents such as Chapagain and Hoekstra (2003), Oki et al (2003),
Zimmer and Renault (2003). Since then, Estimate of Chapagain and Hoekstra (2003), completed
during the period 1995-1999 and included agricultural and non-agricultural goods. The result of this
estimate shows that the global virtual water flows is about 1040*109 m
3/ year of which 67% is

3
generated by international crop trade. Nevertheless, Chen et al (2013) highlighted, through the
estimation of the international virtual water flows embodied in agricultural and non-agricultural
products, the importance of taking into account the non-agricultural product when overall water
budget is considered. Duarte et al (2016) evaluate the virtual water trade at a continental scale for the
period of 1965-2010, in which they classified North America as the major net exporter of virtual
water. Later, studies assessing virtual water flows of the countries with the rest of world, appeared to
show the importance of virtual water concept, as an awareness indicator, in the analysis of the
objectives of the national policy of the water shortage. Since the water shortage problem is a
vulnerable political issue in the Middle East region, El-Sadek (2011) emphasizes the major role of the
virtual water concept, as a component of the Integrated Water Resources Management, in the
enhancement of the internal and external water use efficiency. The Middle East region has to import
virtual water in order to ensure food security of their countries. For instance, the Egyptian food import
leaded to 14*103 m
3of of virtual water import. The results of the study shows the Arab countries
should promote their scarce water value through producing a high value crop such as horticulture
instead of cotton or rice which are water intensive and low-value crops. Tamea et al (2013) in their
research evaluated the Italian virtual water balance on time and space during 1986- 2010. A
geographical identification of virtual water flows was then implemented. This study shows that the
food trade in the world is being scaled relative to domestic production. In Italy, import of virtual water
recorded an increase of 26% between 1986 and 2010. These estimates rank Italy among the most net
virtual water importers country. While, Sun et al (2013) focused on virtual water concept relevance, as
an economic tool of water productivity, to ensure food security in China. This study treated separately
blue and green virtual water contents at different regions. According to Sun, virtual water trade might
alleviate water pressure and improve water save in arid regions through food exchange. Grains in
china hold more than 50% of green virtual water. Therefore, the regional exchange of grains (wheat,
maize and rice) generate 11.47 Gm3 of green virtual water save. Authors suggested to encourage the
grain-sown in southern regions in order to valorize green water and ensure more water savings.
In the context of overuse of the fresh water resource and the necessity of increasing agricultural
productivity in Iran, the Relationship between water scarcity and virtual water import at a national
level was evaluated by Mohammadi et al (2014). In this study, authors noted that the Iranian exported
goods holds high volumes of water. On the other hand, low water intensity goods with a high added
value are imported. Therefore, during the period 2001-2008, Iran had water import dependency
through the import of 12.7 billion m3. This study affirm than that taking into account virtual water
trade in water management policy , allow to Iran to save 12.7 billion m3
of domestic water resource
through food trade. Giving the importance of grain production in china, Sun et al (2016) examined
virtual water flow through grain transfer in order to improve water efficient distribution and reduce
water resources stress at regional scale.in this study, results shows that Northeast China and Huang-
Huai-Hai region are the major virtual water export regions through grain transfer. According to Sun
(2016), china saved 48 Gm3 of blue water related to grain virtual water transfer, which represent about
82% of the total water saving. Nevertheless, grain export in Heilongjiang and Inner Mongolia regions
increased the water stress index by 138% and 129%, which means that the quantification of virtual
water flows may lead to the water redistribution in order to guarantee the sustainability of grain
production in china
3. Methodology for the estimation of virtual water content and flows
To calculate the virtual water trade flows, the following suggested methodology based on Novo (2008)
which is in turn based on the one proposed by Hoekstra and Hung (2005). However, in this paper we
build on these existing methodologies by separately considering the green and blue virtual water
content. Our methodology is based on two steps: (1) quantification of the virtual water content in the
main strategic agricultural commodities; and (2) estimation of the water flows from the agricultural
trade balance. Therefore, the originality of our methodology is summarized, first in the use of our own
database developed at a country scale. Secondly, in the separate estimation of the green and blue
virtual water which has been highlighted only by few studies.
4
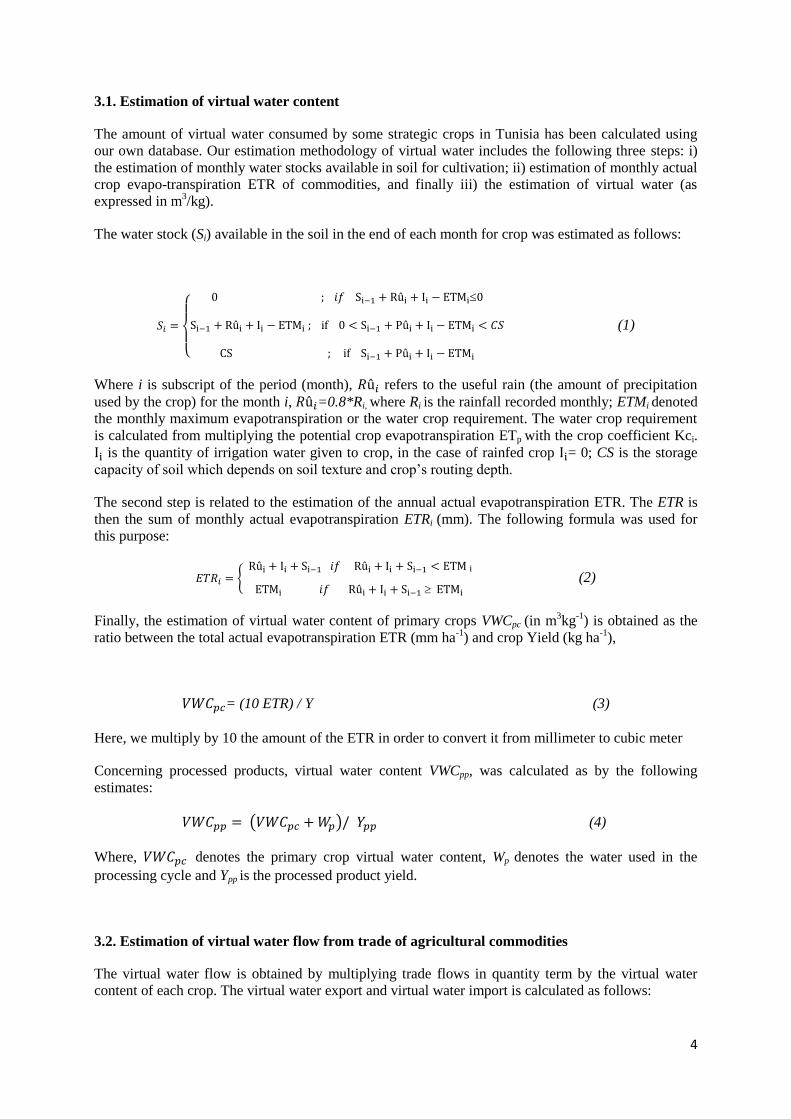
3.1. Estimation of virtual water content
The amount of virtual water consumed by some strategic crops in Tunisia has been calculated using
our own database. Our estimation methodology of virtual water includes the following three steps: i)
the estimation of monthly water stocks available in soil for cultivation; ii) estimation of monthly actual
crop evapo-transpiration ETR of commodities, and finally iii) the estimation of virtual water (as
expressed in m3/kg).
The water stock (Si) available in the soil in the end of each month for crop was estimated as follows:
{
(1)
Where i is subscript of the period (month), refers to the useful rain (the amount of precipitation
used by the crop) for the month i, =0.8*Ri, where Ri is the rainfall recorded monthly; ETMi denoted
the monthly maximum evapotranspiration or the water crop requirement. The water crop requirement
is calculated from multiplying the potential crop evapotranspiration ETp with the crop coefficient Kci.
is the quantity of irrigation water given to crop, in the case of rainfed crop = 0; CS is the storage
capacity of soil which depends on soil texture and crop‟s routing depth.
The second step is related to the estimation of the annual actual evapotranspiration ETR. The ETR is
then the sum of monthly actual evapotranspiration ETRi (mm). The following formula was used for
this purpose:
{
(2)
Finally, the estimation of virtual water content of primary crops VWCpc (in m3kg
-1) is obtained as the
ratio between the total actual evapotranspiration ETR (mm ha-1
) and crop Yield (kg ha-1
),
= (10 ETR) / Y (3)
Here, we multiply by 10 the amount of the ETR in order to convert it from millimeter to cubic meter
Concerning processed products, virtual water content VWCpp, was calculated as by the following
estimates:
( ) (4)
Where, denotes the primary crop virtual water content, Wp denotes the water used in the
processing cycle and Ypp is the processed product yield.
3.2. Estimation of virtual water flow from trade of agricultural commodities
The virtual water flow is obtained by multiplying trade flows in quantity term by the virtual water
content of each crop. The virtual water export and virtual water import is calculated as follows:

5
VWexc = VWCc×Qcex (5)
VWimc= VWCc ×Qcim (6)
NVWim= VWim- VWex (7)
In which VWexc and VWimc (m3/year) represent respectively the virtual water export and virtual water
import, VWCc (m3kg
-1) is virtual water content of each crop c, Qcex and Qcim denotes the quantity
(ton/year) of exported and imported crops c.
The balance of virtual water, also called “Net virtual water import” NVWim is the result of virtual water
import minus virtual water export. Therefore, a country might be a net “exporter” of water if the result
is positive and a net “importer” of water if the result is negative.
3.3. Data sources
Some data such as irrigation water quantities per crop, crop yields, and monthly amount of rainfall
were used to calculate the virtual water content. This data was collected within the framework of
“virtual water and food security”, where a field surveys were conducted during the crop year 2012-
2013 The survey included the twenty four governorates which are aggregated into four regions
(Northwest (NW), Central west (Cw), Central and South-East (CSE) and Southwest (Sw)).in our
survey, we considered a stratified random selection of four farm types in each governorate based on
their size (0-5ha; 5-20ha, 20-50ha and more 50ha), five bio climatic area: Humid Sub-Humid (HSH),
Cold Semi-Arid (CSA), Hot Semi-Arid (HAS), Arid (A) and Saharan (S). Our database includes
average technical and economic data of the main crops grown (strategic crops and those concerned
with international trade) in Tunisia. Our survey was through a farm management follow up. Samples
were determined considering the bio climatic area, farm type, the conduit system (rain fed and
irrigated) and the main crops of each area specifically involved in international trade. The farm type
model refers to the characterization of the farm by its size. The technical and economic data are
normalized for one hectare and included; i) a general crop description (type, variety, conduit system,
agro climatic area, etc.); ii) revenue (products and by-products); iii) variable costs (mechanization,
labor, fertilizer, phytosanitary treatment, cost of water, transport, etc); iv) the gross margin per hectare.

6
Figure 1. Different bioclimatic areas in Tunisia
The obtained gross margin per crop and farmer summarizes the revenue and expenditure operations.
From the technical and economic sheets by crop and farmer, we could build representative sheets.
First, we calculated the crop‟s representative weighted average sheets in in each region and agro
climatic area. Indeed, technical and economic sheets are not limited to estimating gross margins but it
was also used to estimate the real cost of production and the crop‟s profitability.it provides also water
demand per hectare per crop which would allow farmers' awareness of the importance of water
management and offer an. opportunity to enhance water value through the choice of the appropriate
farming systems. Obtained data were validated first at a regional scale by the Regional Commissions
for Agricultural Development and secondary at a national scale by the Ministry of Agriculture.
Climatic data such as crop coefficient value per crop (Kc) was taken from FAO data base, the potential
crop evapotranspiration value (ETp) are from National Institute of Metrology data base. Finally, the
estimated data of virtual water content was associated to data related to the foreign agricultural trade in
order to quantify the water flows embedded into this trade. Trade data of different agricultural
commodities was expressed in quantities (ton/year) of exported and imported crop and was collected
from the Tunisian Ministry of Agriculture (2013), as well as from the National Institute of Statistics of
Tunisia (INS).
4. Results
4.1. Virtual water content
This section will represent the results obtained on basis of calculations of virtual water content,
separated into green and blue water content for a large number of crops during the crop year 2012-
2013.The results showed that the virtual water content depend on several factors, such as crop,
production system (rain-fed or irrigated), yield fluctuation.
Regarding the primary crops and in the case of grain, the virtual water content in rain-fed agriculture is
higher than the virtual water content in irrigated agriculture which is due to low yield crop in rain-fed
area. Nevertheless, the part of green virtual water content of grain is more significant and represents
80% of the total virtual water content since the grain is cultivated in winter period, then crop water
requirements are mainly satisfied with green water obtained from precipitation. Unlike grain, the blue
virtual water content of vegetable represents around 60% of the total virtual water content due to a
couple of reasons; such as the period of cultivation which is summer period wherein the crop water
requirement is the highest (Figure 2).
Figure 2 Green and blue virtual water content
In order to achieve the main virtual water perspective through saving water, in environment term, and
reach higher water use efficiency, in an economic term, it will be recommended to deflect to the
production of low virtual water content crop which means high water productivity crop. Considering
the Tunisian case, it‟s recommended then to substitute peppers, which hold 0.35m3/kg of virtual water,

7
by tomato which only holds 0.09m3/kg of virtual water. And considering the rational allocation of
water resource between country‟s regions, virtual water content estimation may have an important
effect. For instance, it‟s much more profitable to cultivate potato in the central region of Tunisia,
which hold a low virtual water content (0.098m3/kg) comparing to the North (0.157 m
3/kg). Unlike
citrus that is to be cultivated in country‟s northern region since it holds less virtual water content.
Table 1. Average virtual water content of selected crops in Tunisia (m3/kg)
Blue virtual water
content (m3/kg)
Green virtual water
content(m3/kg)
Total virtual water
content (m3/kg)
Durum wheat (irrigated) 0.36 0.69 1.05
Barley (irrigated) 0.31 0.98 1.29
Olives (rainfed) 0.00 1.60 1.60
Olives (irrigated) 0.59 0.82 1.41
(Processed) Olive oil 6,19 1,21 7,4
Grapes (irrigated) 0.09 0.06 0.15
Citrus-maltaise (irrigated) 0.16 0.12 0.28
Dates (irrigated) 2.76 0.10 2.87
Potaoes (irrigated) 0.10 0.06 0.16
Tomato (irrigated) 0.06 0.02 0.09
(Processed) Canned tomatoes 5,78 0,22 6
Regarding processed products, it holds a higher amount of virtual water than primary crops, since a
ton of olive oil holds 7400m3 of virtual water and a ton of canned tomato holds 6000 m
3of virtual
water. (Table 1)
4.2. Differences of virtual water content between regions and agro climatic areas
Some variability of the virtual water content of the selected crops in Tunisia is also observed between
different bioclimatic areas of the country. In this section we are reporting some of this variability,
which might be useful for alleviating pressure on water resource in relevant regions. Our results are
showing that tomato is grown in four bioclimatic areas of Tunisia. The lowest VWC of tomato is equal
to 0.063 m3/kg and is registered in the Northern Humid Sub-Humid humid region. The same crop
holds about 0.10 m3/kg
of water in the arid areas of central west Tunisia. Therefore, it will be worthy
to think about replacing tomato in arid areas by other crops that hold low virtual water content, and
provides similar or higher monetary value. Similarly, olive groves are also grown in three bioclimatic
areas (see Figure1) of Tunisia. Our results show that rain fed olive grove consume more water in the
northern CSA and HAS regions with a VWC of 0.20 m3/kg of olives compared to 0.12 m
3/kg in the
central and southern Arid regions. In fact, the low VWC in arid region is mainly explained by the low
crop yield in this area. Concerning cereals, it is shown that irrigated durum wheat consume less virtual
water in the northwest HSH area of Tunisia with a value of 0.08 m3/kg compared to durum wheat
grown in the CSA and HSA areas. Another remark which we can draw from this comparison is related
to the fact that irrigated tree crops (Figure 3.b) have generally a higher content of virtual water
compared to the vegetable crops (Figure 3.c)

8
Figure 3 Virtual water content by crop, system, region and bioclimatic areas (Figures 3.b and 3.c are
only conducted for irrigated crops).
4.3. Virtual water flows embedded in agricultural trade
Concerning virtual water exports, the commodities covered by this analysis are as follows: Olive oil,
date palms, citrus, fresh tomato and watermelon. Olive oil and dates are the major commodities
providing value for the agricultural exports in Tunisia. The results obtained show that, more than 80%
of the virtual water exported is blue virtual water. Then, by exporting 145.900 tons of olive oil and
97.800 tons of date palms, Tunisia export respectively 1079.6Million cubic meters and 283.62Million
cubic meters of virtual water; this suggests that Tunisia is a net virtual water exporter through olive oil
and date palms trade(table 2).
The virtual water export and more precisely, blue virtual water export means obviously losing national
water. Nevertheless, to preserve water resources it is preferable to export commodities holding a low
virtual water content or to export commodities in which green virtual water is upper than blue virtual
water. But in this context, it‟s not possible to suggest for Tunisia not to export olive oil, since because
it may deeply affect the agricultural trade balance and consequently the country‟s food security.
The calculation of virtual water import will be limited to the following crops: durum wheat, soft
wheat, barley and potatoes. The choice of these crops was due to limited data especially in case of
vegetal oils of which Tunisia is very dependent on international markets. With the exception of vegetal
oils, Tunisian virtual water import is mainly generated through the trade of cereals, especially barley
and bread wheat import. According to (Chapagain and Hoekstra, 2003), Tunisia is saving respectively
2901.7 Million cubic meters and 3.14Million cubic meters of water resources, By importing 2146.600
tons of cereals and 15.7 thousand tons of potato (Table 2).

9
Table2. Flows of virtual water embedded in main exchanged agricultural commodities (1000 m3)
Virtual water export Virtual water import
Commodity Value (1000 m3) Commodity Value (1000 m
3)
Olive oil 1079660 Durum wheat 565560
Date palms 283620 Bread wheat 1169480
Citrus 6360 Barley 1163550
Tomato 2390 Potato 3140
Water melon 1980
However, locally produced cereals holds 80% of green virtual water and reaches 100% in a wet year.
However, in the case of Tunisia, the import of grain is not aiming to save water but is mainly due to a
shortage of domestic grain supply compared to the domestic demand. Taking into account only
exchanged pre-selected commodities; and as it‟s mentioned in Figure 4, the net virtual water import of
Tunisia is calculated as being negative and equal to -1530860 Million cubic meters. The negative net
virtual water import leads to conclude that Tunisia is a net virtual water importer.
Figure 4. Net virtual water import through agricultural commodities trade
5. Discussion
According to Hoekstra (2003), the virtual water content depends on several factors such as the place
and the period of production, the production method and the associated efficiency of the use of water.
Our results show similar figures of virtual water content of some agricultural commodities in China.
According to Sun (2013), wheat in China holds around 1.071 m3 of water per kg, while in Tunisia, our
results indicate that wheat hold 1.120 m3 of per kg. However, while the Tunisian wheat holds around
80% of green water, wheat in China only holds 60% of this type of water. On the other hand, our
results concerning the contribution of green water on the agricultural production are close to these
obtained by Meknnen and Hoekstra (2011), Chahed et al (2015) and Zoumides et al (2014). Results
from Chahed et al (2015) show that during the period 2006-2010, 85% virtual water content of a set of
selected crops in Tunisia (see Ref. for more details) was green water. Zoumides et al (2014) showed
that 87% of total water equivalent of crop supply in Cyprus is primarily green water.
The first result of our study highlights importance of green water in Tunisian agriculture through the
quantification of the virtual green water content. Results show that commodities such as olives,
almond, oats and barley are among the crops with higher share of green water content compared to the
share of blue water (Chouchane et al., 2013). Most of these crops are not traded (exported) and are
consumed locally. Concerning virtual water trade, our results shows that Tunisia is essentially
exporting blue water. This is especially due to the high contribution of water intensive crops such as

10
dates and olive oil to the agricultural export of Tunisia. Olive oil does not require blue water for the
production of olives but do consume a lot of it during its processing. On the other hand, Tunisia is
importing virtual water through the import of grain. This is implicitly indicating that through this
import, Tunisia is preserving its green water and importing this same type of virtual water since it is
mostly indicated that tops grain exporters of the world are actually exporting green virtual water.
Information generated by comparing the virtual water content among crops in different regions and
systems (rain fed and irrigated) might be highly useful for policy makers to investigate the possibility
to promote specific crops in specific regions. Such a policy can be considered within the set of water
demand management instruments adopted by the Tunisian government, and may in turn promote
better allocation of water resource and enhance its durability. Crops should in fact be promoted in the
bioclimatic areas where they are consuming the least of virtual water. For instance, it‟s recommended
to encourage the cultivation of grains in the Northern regions instead of central and Southern regions (Sun, 2016). Then, these guidelines may contribute to water save especially groundwater which is
overused in some regions in Tunisia. Therefore, estimating VWC provides an opportunity for a new
mapping of agricultural systems and for a better reallocation of water resources among regions.
Final results of the paper show that Tunisia holds a negative water equivalent balance of its agro-food
exchange, which is to say that Tunisia is a net virtual water importer and is saving water through its
trade. Nevertheless, the export of intensive blue water consuming crops should be given consideration
(Chouchane et al, 2013). These results can be used to promote more efficient water use and organized
value chains of the highest blue water consuming crops in Tunisia. This will be a pre-requisite for
enhancing the value of blue water used for these productions, and allow more equitable cost sharing in
case higher taxes for blue water might be applied.
6. Conclusion
This paper was exploring the scope of the virtual water concept to assist efforts of enhancing water
resources management in Tunisia. The concept of virtual water was mainly introduced to i) quantify
and compare crops virtual water content in different bioclimatic areas and agricultural systems of
Tunisia; and to ii) provide some guidelines for better water allocations through optimized cropping
patterns based on their respective virtual water content. In addition to that, the concept of virtual water
trade was also explored in this study through comparison of virtual water content among the main
exported and imported agricultural commodities of Tunisia.
Our results show that green water is a major component of virtual water content of cereal crops,
including wheat, barley, and oats. This is valid for both irrigated and rainfed systems. On the other
hand vegetable crops were found to have a higher content of blue virtual water compared cereals. It is
also worth noting that some processed commodities, such as olive oil and canned tomatoes are
consuming much blue water for their transformation and processing, compared to the green water
effectively assessed for their production. Results also show that some differences of VWC exist
among same crops cultivated in different bioclimatic areas. This difference is due to the fact that yields
of these crops are different among regions, but also to the level of specialization and management
practices of farmers in these regions. We argue that these differences can be used to assist policy
making for better allocation of water resource and enhancing its durability. Specific crops should be
promoted in the bioclimatic areas where they are consuming the least of virtual water. Finally, it was
also shown that Tunisia is a net importer of virtual water. But we believe this is not intentional and is
simply due to its dependency to international markets for the import of many necessary food
commodities such as cereals, animal feed, and vegetal oils.
The concept and results presented in this study can assist policy makers for setting effective water and
trade policies that may ensure an enhanced balance between water and food security, especially in this
period where Tunisia is negotiating a final free agricultural trade agreement with the European Union.
Hence, integrated water resources management including new agricultural policies and institutional

11
change that create more incentives for producers are needed for sustainable management of water
resource and securing water for the future in Tunisia.
References
Aldaya M. M., Allan, J. A. and Hoekstra, A. Y,2010. Strategic importance of green water in
international crop trade. Ecological Economics, 69(4), 887-894.
Allan J. A. 1996. Policy responses to the closure of water resources: regional and global issues. Water
policy: Allocation and management in practice, 228-234.
Allan J.A., 1997. Virtual Water: a long term solution for water short Middle Eastern economies?
Occasional paper 3, the 1997 British Association Festival of Science, Roger Stevens Lecture
Theatre, University of Leeds, Water and Development Session - TUE.51, 14.45. September 1997.
21p
Allan J.A, 1998. Virtual Water: A Strategic Resource: Global Solutions to Regional Deficits.
Groundwater 36, No. 4: 546.
Allan J.A, 1999. Productive efficiency and allocative efficiency: Why better way management may
not solve the problem. Agricultural water management 40. 71-77
Allan J.A, 2001. The Middle East Question: Hydro-politics and the global economy. London. United
Kingdom. IB Tauris
Allan J.A, 2003. Virtual Water - the Water, Food, and Trade Nexus, Useful Concept or Misleading
Metaphor? Water International. 28. 4-11
Besbes M, Chahed J, Shayeb H and Hamdane A., 2013. L‟eau en Tunisie. Research Gate. August
2013. 20p
Chahed J., Besbes M. and Hamdane A., 2015. Virtual-Water Content of Agricultural Production
and Food Trade Balance of Tunisia, International Journal of Water Resources Development vol.
31. Iss. 3, 407-421.
Chahed J., Besbes M. and Hamdane A., 2010. Alleviating water scarcity by optimizing "Green
Virtual-Water": the case of Tunisia. Proceeding of the ESF Strategic Workshop on Accounting for
water scarcity and pollution in the rules of international trade. 25-26November 2010.Research
Report Series No.54 Research Report Series No. 54. UNESCO-IHE, Delft, the Netherlands.
Chapagain A.K. and Hoekstra A.Y., 2003. Virtual water flows between nations in relation to trade and
livestocks products. Value of Water Research Report Series No.13, UNESCO-IHE, Delft, the
Netherlands.
Chapagain A.K., Hoekstra A.Y., and Savenije H. H. G., 2006. Saving water through global trade,
Hydrology and Hearth System sciences 10, 455- 468.
Chen Z. M. and Chen G. Q., 2013. Virtual water accounting for the globalized world economy:
national water footprint and international virtual water trade.Ecological Indicators, 28, 142-149.
Chouchane H., Hoekstra A. Y., Krol M. S. and Mekonnen M. M., 2013. The water footprint of Tunisia
from an economic perspective. Ecological indicators, 52, 311-319.
Duarte R., Pinilla, V. and Serrano A., 2016. Understanding agricultural virtual water flows in the
world from an economic perspective: A long term study.Ecological Indicators, 61, 980-990.
El-Sadek A.2011. Virtual water: an effective mechanism for integrated water resources management
.Agricultural Sciences Vol.2. June 201. 248-261pp
Hoekstra A.Y.and Hung P.Q., 2002.Virtual water trade: A quantification of virtual water flows
between nations in relation to international crop trade. Value of water Research Report Series
No.11, UNESCO-IHE, Delft, The Netherlands.

12
Hoekstra A.Y., 2003, Virtual water trade: Proceedings of the International Expert Meeting on Virtual
Water Trade, February 2003, Value of Water Research Report Series No. 12. UNESCO-IHE,
Delft, the Netherlands.
Hoekstra A.Y. and Hung P.Q., 2005, Globalization of water resources: international virtual water
flows in relation to crop trade. Global Environment Change Part A 15, 45-56.
Mekonnen M.M., Hoekstra A.Y., 2011. National water footprint accounts: the green, blue and grey
water footprint of production and consumption (Volume1: main report). Value of Water Research
Report series No.50, UNESCO-IHE, Delft, The Netherlands.
Ministry of Agriculture. 2000-2012. Survey of irrigated areas
Ministry of Agriculture. 2013, Annual directory of Agricultural Statistics 2013.
Mohammadi-Kanigolzar F., Ameri, J. D. and Motee N., 2014. Virtual Water Trade as a Strategy to
Water Resource Management in Iran. Journal of Water Resource and Protection, 6(02), 141.
Novo P. and Garrido A., 2008. Are virtual water “flows” in Spanish grain trade consistent with
relative water scarcity? Ecological Economics, 68(5), 1454-146
Oki T., Sato M., Kawamur, A., Miyake M., Kanae S. and Musiake K., 2003.Virtual water trade to
Japan and in the world. In Hoekstra, AY „Virtual water trade: Proceedings of the International
Expert Meeting on Virtual Water Trade‟, Value of Water Research Report Series (No. 12).
Plan Bleu. 2011. L‟efficience d‟utilisation de l‟eau et approche économique ; Etude Nationale,
Tunisie. Centre d‟Activités Régionales PNUE/PAM. Juillet 2011. 19p
Sun S. K., Wu P. T., Wang Y. B., Zhao X. N., 2013. The virtual water content of major grain crops
and virtual water flows between regions in China. Journal of the Science of Food and
Agriculture, 93(6), 1427-1437.
Sun S., Wang Y., Engel B. A., Wu P., 2016. Effects of virtual water flow on regional water resources
stress: A case study of grain in China. Science of The Total Environment, 550, 871-879.
Tamea S., Allamano P., Carr J. A., Claps P., Laio F., Ridolfi L., 2013. Local and global perspectives
on the virtual water trade. Hydrology and Earth System Sciences, 17(3), 1205-1215.
Wichelns, D., 2001. The role of “virtual water” in efforts to achieve food security and national goals,
with an example from Egypt. Agricultural Water Management 49, 131-151.
Wichelns D., 2004. The policy relevance of virtual water can be enhanced by considering comparative
advantages. Agricultural Water Management, 66(1), 49-63.
Wichelns, D., 2010. Virtual Water: A Helpful Perspective, Islam Zeitschrift Für Geschichte Und
Kultur Des Islamischen Orients, 2203-2219.
Zimmer, D., & Renault, D. (2003). Virtual water in food production and global trade: Review of
methodological issues and preliminary results. In Virtual water trade: Proceedings of the
International Expert Meeting on Virtual Water Trade, Value of Water Research Report
Series (Vol. 12, No. 1, pp. 1-19).
Zoumides C., Bruggeman A., Hadjikakou M. and Zachariadis T., 2014. Policy-relevant indicators for
semi-arid nations: The water footprint of crop production and supply utilization of
Cyprus. Ecological Indicators, 43, 205-214.


