
The bitterness of low quality remains long after the
sweetness of low price is forgotten ~ Benjamin Franklin
Master Thesis – Jella Jongerius Delft University of Technology – Civil Engineering and Geosciences
Master programme: Construction Management and Engineering
Quantifiable Performance Information, the road to winning tenders?
A research into the optimisation of the application of QPI by vendors


Quantifiable Performance Information, the road to winning
tenders?
A research into the optimisation of the application of QPI by vendors
Delft University of Technology
Civil Engineering and Geosciences
Construction Management and Engineering
Grontmij Nederland B.V. Transportation and Mobility
Department of ‘Wegen’
Master Thesis – Jella Jongerius
Contact: [email protected]
De Bilt, May 2014
Thesis committee:
Prof. dr. ir. M.J.C.M. (Marcel) Hertogh
Prof. mr. dr. ir. S.C. (Sicco) Santema
Ir. H.C. (Cigdem) Demirel
Drs. C. (Lotje) Egmond
Drs. R.J. (Robert Jan) Jonker
Delft University of Technology
Delft University of Technology
Delft University of Technology
Grontmij Nederland B.V.
Grontmij Nederland B.V.

i
Preface
This thesis is the final result of my graduation research and the conclusion of my time as a
student at Delft University of Technology. During the past nine months I worked hard and with
great pleasure on this research.
I could not have performed this research without a lot of persons. First I would like to thank my
thesis committee. Marcel, for his enthusiasm, his open mind about my research and for always
looking at the bigger picture. Sicco, also for his open mind, his BVP knowledge and for
challenging me to be critical. And Cigdem, for her insights on practical research matters.
Without the support of Grontmij my graduation research would not have been the same. They
gave me the room to develop my own plan and encouraged me to make the most of it.
Furthermore, they gave me unlimited access and insight in their internal practises. Therefore, I
would like to thank them.
Also I would like to thank the entire team ‘Omgevingsmanagement’ for the lunches and being
able to ask you anything whenever I wanted. Especially Rik for helping me to arrange my
internship at Grontmij. Without this team I would not have had such a great time during my
research.
Furthermore, I would like to thank Lotje. We did not discuss my research content that often, but
when we discussed my plans your insights were always useful. You said the right things to keep
me on track and you knew how to put things in the right perspective, which helped me to stick to
my scope and conduct my research with more focus. I would also like to thank Robert Jan for his
insights during my committee meetings and for involving me in the BVP network within
Grontmij.
I also owe a big thanks to all my interviewees. Without them this research would not have been
possible.
Furthermore, I would like to thank my family and friends who supported me during my entire
study time and this research. Especially John and Nina, for putting a roof over my head during
my time in De Bilt and my parents, Aniek, Jolien, Max and Irene for their listening and support.
Jella Jongerius
Delft, May 2014

ii
Summary
In the Dutch construction industry a few years ago a new procurement method was introduced.
This new procurement method is called: Best Value Procurement (BVP). The incentive to start
using a new way of procuring started to occur when a committee started to investigate the
construction fraud in 2002. To be able to make a change from awarding on lowest price to
awarding on a good quality versus price ratio BVP was introduced in the Netherlands.
However, BVP is not only a way of procuring. It is an extended method, which is also used in the
execution of projects. Because of this and the focus on quality this method is changing the
industry. Rijkswaterstaat and a lot of other clients are already using BVP and plan to use it
extensively in the future. Therefore, vendors need to follow this line and make themselves
capable of winning BV tenders.
However, in BV tenders other things are requested. The vendors do not need to deliver an
extensive action plan, but only need to deliver three qualitative documents: a risk file, a value
added file and a performance substantiation. Within these documents the vendors need to proof
their expertise by substantiating the documents with Quantifiable Performance Information
(QPI). This information is factual, dominant information that can show the expertise of a vendor
on this specific project.
Although engineering companies often are aware of their strengths it seems to be difficult for
them to translate this to QPI and substantiate in a dominant way that they are the expert for a
certain project. A problem becomes visible between the use of QPI at this time by vendors and
the standard of QPI that is expected by the clients to be able to successfully participate in
tenders. This gap needs to be explored and closed.
Therefore, the main objective of this research is: to develop a model for engineering companies
to improve the way they measure and apply QPI in BV tenders.
To be able to achieve this objective a main research question for this research is stated. This
question is:
How can engineering companies improve the application of Quantifiable Performance Information
in tenders?
Theoretical Background
To be able to answer this research question three research phases are needed. The first phase is
the Theoretical Background. In this phase three subjects are explored based on a literature
study. These subjects all come forward as crucial to be able to gather and apply good QPI.
First, a good information system (IS) is necessary. Such a system allows to balance the amount of
information and makes sure that the information is understandable and clear for everyone. Here
also comes forward what is needed for information to be dominant. In the IS performance
information is gathered and assessed in a proper way.
Secondly, a Performance Measurement System (PMS) is necessary to measure critical
performances. The performance measures that are stated in the PMS are needed to measure the
performances of an organisation based on their expertise. The outcome of this system is
performance information, which is the base for QPI.
The final and third subject that is studied are Key Performance Indicators (KPI’s). These KPI’s are
variables that are quantifiable, which make it possible to relate a performance to a pre-set
standard. KPI’s are the input for the PMS, because they enable performance measurement.

iii
The IS comprises both the PMS and the set of KPIs, where the KPI’s are the input for the PMS.
What, furthermore, comes forward from the literature study is that the environment in which
the IS, PMS and QPI operate is formed by an organisations proposition or strategy. All three
aspects are directly linked to the proposition of an organisation. This is the case, because to be
able to show your expertise in QPI the performance information that is the output of the PMS
should be linked to the expertise or proposition of a client. Furthermore, to be able to measure
the right performances the KPI’s should directly be linked to the proposition. Also the IS should
be linked to the proposition, this gives the data within the IS a certain context, which makes the
information easier to understand.
Furthermore, a proposition should be used in a consistent way. Consistency is crucial. All actions
and decisions that are taken need to be directed by the proposition, therefore, the three aspects:
IS, PMS and KPI’s all fall within the environment of an organisations proposition.
Practical Comparison
The next step in this research is the Practical Comparison. In this section the findings from the
literature study are verified and new findings are done. The first step in this section is
performing an extensive case study analysis. In this analysis 13 BV tenders are analysed on
different aspects.
After this two employees of Grontmij are interviewed to be able to get an insight of the current
state of performance measurement, KPI’s and propositions within the organisation. This helps to
establish where they stand and what is necessary to improve QPI.
The final step in this section is interviewing seven employees of three different clients and one
BVP expert. In these interviews the findings from the case study analysis and the literature study
are verified by the clients. This is needed because according to the literature and the practice of
an engineering company itself a good view is gained on how the application of QPI is improved,
but in the end the clients are reviewing and scoring the qualitative documents and the QPI. So, if
they have a different view on QPI this should be known. Therefore, these interviews and, thus,
this step of verification are necessary to get a good overall insight on QPI.
From this section in general comes forward that a proposition is indeed important for improving
the application of QPI. This proposition needs to be stated based on an organisations own
strengths and capabilities in combination with the markets demand. To be able to do this a
format called: the Business Canvas, should be used. As also comes forward from the literature
study this proposition is the base for the PMS, KPI’s and, thus, QPI. Furthermore, it gives
direction to making choices in which tenders an organisation should participate.
A good start of a PMS is made by starting to measure performances based on the most common
client objectives from the request for tenders. These two types are: planning and budget related
objectives. For these two categories KPI’s and performance measures should be stated. The
overall distribution of the different kinds of objectives is shown in figure 1.

iv
Figure 1: Distribution of all objectives in objective categories
Furthermore, the clients and expert state that performance measurement is solely a task of the
vendors. They need to be creative with measuring their own performances to be able to gather
the right performance information and be able to state QPI.
Ways of measuring performances are extending the use of the client surveys and the WRR. With
a few alterations these two tools are ready to be used as a first step in performance
measurement.
QPI is seen by the clients as hard and objective information. This information needs to be
verifiable, simple and transparent. Another important aspect of QPI is that it needs to be linked
to a specific project. According to the clients performance information also needs to be
dominant.
Performance information is seen as dominant by clients if it is:
Irrefutable (no discussion or interpretation possible)
Measurable
Verifiable
Specific
Realistic
Show a high performance
Translated to a specific tender
Simple
It also comes forward that QPI consists of three different aspects. These aspects are: ‘stating
experience’, and showing ‘the effect’ and ‘the success’ of a certain measure. These three aspects
all need to be used to be able to state QPI. A prerequisite of QPI, and all qualitative documents in
general, is that it needs to be formulated in a SMaRt way.
The letters A and T are small in this abbreviation, because the clients indicate that measures and
QPI do not need to show ambition or time-boundness to be dominant. Therefore, only the
aspects of Specific, Measurable and Realistic are taken into account or at least have the main
focus of a vendor when stating their QPI and qualitative documents.
When a qualitative document is set up by vendors the following steps need to be taken:
0
5
10
15
20
25
30
Realisation budget
Works budget
Realisation planning
Works planning
v
1. State the risk or value added option
2. Make your claim (what will the measure to control the risk or execute the value added
option)
3. State your project specific experience (base of QPI)
4. Substantiate this experience with the success and effect on the client objectives
(substantiation of QPI)
If these steps are taken into account the set-up of the qualitative documents is good in the view
of the clients.
Design Phase
In the next and final phase of the research all findings from the previous sections are combined,
this phase is called: Design. The main outcome of all findings is a roadmap, which is shown in
figure 2. This roadmap helps to answer the main research question and will, thus, help to
improve the application of QPI by engineering companies. This roadmap consists of four
different steps that need to be taken on a strategic, tactical and operational organisational level.
First, a proposition needs to be formulated. This proposition is the base of QPI and should be
stated based on an engineering companies own strengths in combination with the market
demand. It gives direction to in which tenders an engineering company participates and it is
leading in stating KPI’s.
Setting up a set of KPI’s is the second step in the roadmap to improve the application of QPI. A set
of KPI’s should consist of a diverse set of KPI’s of both qualitative and quantitative KPI’s.
Furthermore, these KPI’s should be: measurable, relevant (link to proposition) and accountable.
A good set of KPI’s will enable performance measurement.
The third step in the roadmap is, therefore, setting up a PMS. In this PMS performance measures
are stated that actually enable the measurement of the KPI’s. These performance measures need
to measure internal, external, financial and non-financial aspects to give a good and complete
insight in the performances of an organisation. This insight on the performances of an
organisation challenges the proposition to keep improving. Therefore, a learning loop is visible
between the PMS and the proposition. Furthermore, it becomes clear that these aspects all
evolve over time.
The final step within the roadmap to improve QPI is stating QPI. The input for this QPI is the
performance information that comes forward from the PMS. With this information QPI is stated.
QPI consists of three different aspects. As a base previous ‘experiences’ are stated, which are
substantiated by making the ‘effect’ and ‘success’ of the measures and experience for the specific
tender visible. Furthermore, the QPI needs to be stated in a SMaRt way.
If all four steps of the roadmap are completed then QPI is formulated, which can be applied in a
tender. A learning loop is visible between the application of QPI in a tender, winning the tender
and measuring the performances of the tender that is won in the PMS. Because when QPI is
applied in a tender the quality of the offer rises, so more tenders are won. When a tender is won,
more performances can be measured, which will lead to the gathering of more performance
information and, thus, more application of QPI. Than the learning loop can start again. QPI will,
thus, keep on improving in this loop.
When this roadmap is used this will improve the application and gathering of QPI by engineering
companies.

vi
Figure 2: Roadmap to improve the application of QPI
The changes that need to be made within the roadmap need to happen on both a strategic,
tactical and an operational organisational level. This will take some time. To be able to already
make some changes that will, for now, improve the use of QPI for every step in the roadmap
quick wins are indicated.
To be able to start improving not only the QPI in tenders, but also improve the qualitative
documents in general a checklist is set up that is used during the writing of the qualitative
documents to see if the aspects that diminish the scores stated earlier are not incorporated. This
checklist leads not directly to an improvement of the application of QPI. But it will improve the
quality of the tenders overall, because it can be used to predict if and prevent that mistakes are
made. Especially the general and risk file related aspects are predicted and prevented by using
the checklist. This, thus, supports the application of QPI in the overall qualitative documents.
Also some quick wins come forward to be able to improve the qualitative documents in general
on a shorter term.
Overall conclusion
With the roadmap engineering companies are able to improve their application of QPI. The
roadmap indicates a good process for improving QPI. It allows engineering companies to gain
more insight in what is needed for QPI and also gives insight on how the QPI can be applied. The
quick wins that are formulated in the roadmap also helps engineering companies to make
improvements on the gathering and application of QPI on a short term. Therefore, there is
concluded that the roadmap and the quick wins are the answer to the main research question.

vii
Furthermore, the outcomes that are related to the qualitative documents, the general quick wins
and the checklist, maybe do not directly contribute to improving the application of QPI, but it
does support, complement and improve the offers, in which the QPI is used, in general.
Therefore, this research helps engineering companies not only to improve their application of
QPI, but also to improve their tenders in general.
Scientific relevance
The contribution of this research to science is the roadmap. There is, nowadays, no literature
available that focuses on QPI combined with the way this could be gathered and applied. This
research fills this scientific knowledge gap. It gives new insights on which processes are needed
within an organisation to be able to gather and apply QPI in an effective way.
Practical relevance
The practical relevance of the research is large. The outcomes of the research can be applied by
engineering companies or other vendors in the forms of the roadmap, the quick wins in the
roadmap, the quick wins in general and the checklist.
The roadmap and the quick wins within the roadmap give insights and direction to be able to
improve the gathering and application of QPI.
The general quick wins and the checklist do not directly contribute to improving the application
of QPI. However, these two outcomes do contribute to the improvement of the qualitative
documents and offers in general, which supports and complements the application of QPI.
Altogether this will, hopefully, result in winning more tenders.

viii
Table of content
Preface ................................................................................................................................................................................ i
Summary ........................................................................................................................................................................... ii
Table of content ......................................................................................................................................................... viii
Section I: Introduction ................................................................................................................................................ 1
Introduction ........................................................................................................................................................... 2 1
1.1 Background Information .................................................................................................................................. 2
1.2 Traditional procuring ........................................................................................................................................ 2
1.3 Economically Most Advantageous Tender ................................................................................................ 3
1.4 Best Value Procurement/Best Value Sales ................................................................................................ 4
1.5 Problem analysis .................................................................................................................................................. 6
1.6 Problem formulation .......................................................................................................................................... 7
1.7 Research objective .............................................................................................................................................. 7
1.8 Research questions ............................................................................................................................................. 7
Research Methodology ...................................................................................................................................... 9 2
2.1 Methodology .......................................................................................................................................................... 9
2.2 Research Framework ...................................................................................................................................... 10
Section II: Theoretical Background .................................................................................................................... 11
Introduction ........................................................................................................................................................ 12 3
Information Systems ....................................................................................................................................... 12 4
4.1 Construction Industry Structure ................................................................................................................ 12
4.2 Rate of Change ................................................................................................................................................... 14
4.3 Quantifiable Performance Information ................................................................................................... 16
4.4 Conclusion ........................................................................................................................................................... 17
4.5 Explanation of model ...................................................................................................................................... 18
Performance Measurement .......................................................................................................................... 20 5
5.1 Performance measurement in general .................................................................................................... 20
5.1.1. Link to organisation ...................................................................................................................................... 21
5.1.2 Pitfalls and difficulties ................................................................................................................................... 21
5.2 Performance measures .................................................................................................................................. 22
5.3 Performance measurement systems ........................................................................................................ 23
5.4 Conclusion ........................................................................................................................................................... 24
5.5 Explanation of model ...................................................................................................................................... 25

ix
Key Performance Indicators ........................................................................................................................ 27 6
6.1 KPI’s in general .................................................................................................................................................. 27
6.2 Categories and characteristics of KPI’s .................................................................................................... 28
6.3 Scores on KPI’s ................................................................................................................................................... 29
6.4 Examples of KPI’s.............................................................................................................................................. 30
6.5 Conclusion ........................................................................................................................................................... 31
6.6 Explanation of model ...................................................................................................................................... 32
Conclusion ........................................................................................................................................................... 33 7
Section III: Practical Comparison ........................................................................................................................ 35
Introduction ........................................................................................................................................................ 36 8
Case study analysis .......................................................................................................................................... 36 9
9.1 Introduction ........................................................................................................................................................ 36
9.2 Cases ...................................................................................................................................................................... 36
9.3 Objectives ............................................................................................................................................................. 37
9.4 Scores ..................................................................................................................................................................... 40
9.7 QPI ........................................................................................................................................................................... 43
9.8 Conclusion ........................................................................................................................................................... 44
Current practice ........................................................................................................................................... 45 10
Client and expert view ............................................................................................................................... 45 11
11.1 QPI ........................................................................................................................................................................ 46
11.2 Objectives .......................................................................................................................................................... 49
11.3 Performance measurement ....................................................................................................................... 52
11.4 EMAT ................................................................................................................................................................... 53
11.5 WRR in execution ........................................................................................................................................... 53
11.7 Conclusion ......................................................................................................................................................... 54
Conclusion ...................................................................................................................................................... 55 12
Section IV: Design ....................................................................................................................................................... 57
Introduction ................................................................................................................................................... 58 13
Roadmap ......................................................................................................................................................... 58 14
14.1 1. Proposition ................................................................................................................................................. 58
14.2 2. KPI’s ................................................................................................................................................................ 60
14.3 3. PMS .................................................................................................................................................................. 62
14.4 4. QPI ................................................................................................................................................................... 63
14.5 Overall roadmap ............................................................................................................................................. 65
x
Qualitative documents ............................................................................................................................... 68 15
Validation of the checklist ........................................................................................................................ 68 16
Conclusion ...................................................................................................................................................... 68 17
Section V: Conclusions ............................................................................................................................................. 70
Conclusion ...................................................................................................................................................... 71 18
Recommendations ....................................................................................................................................... 75 19
Discussion ....................................................................................................................................................... 77 20
References ...................................................................................................................................................... 79 21
Abbreviations ................................................................................................................................................ 82 22
List of figures ................................................................................................................................................. 83 23
List of tables ................................................................................................................................................... 84 24

Page | 1
Section I: Introduction

Page | 2
1 Introduction
1.1 Background Information
The construction industry in the Netherlands is a very traditional and rigid industry. Things are
done in a certain way and that is hard to change. However, some changes were, and still are,
necessary. (De Ridder, 2011b)
An incentive to change the way of working in the construction industry came forward when in
2002 a committee started a research on the construction fraud in the Netherlands. During the
nineties pricing agreements were systematically made within cartels. This led to unfair
competition and left little room for innovation or making profit. At that time the attitude and
structure of the industry and market shaped the perfect environment for this fraud. (Tweede
kamer, 2003)
Changes are being made in several ways. There is, for example, a change visible in the contracts
that are being used. There is a growing use of innovative integrated contracts. Changes are also
made in the way of thinking, flow thinking is a new trend, which influences chain management.
Furthermore, new types of procurement procedures are introduced and their use is increasing
at a rapid pace. (Rydell, Verheul, & Santema, 2013).
CROW (2007) states that: “Changing an industry starts by changing the request for tender.” This
indicates that changing the way of procuring is a good start of changing the construction
industry as a whole. However, there must be kept in mind that this is a first step in a long
process. A closer look is taken at these new ways of procuring in this introduction. But to be able
to do that first the traditional way of procuring is introduced.
1.2 Traditional procuring
The traditional way of procuring is still used nowadays. In this method the client specifies very
precisely what he wants. Vendors are chosen on who can deliver the project, according to the
specifications, for the lowest price. The main award criterion on which the decision for a vendor
is made is, therefore, the lowest price. (Van Duren, & Dorée, 2008)
Due to this focus on price the vendors are forced to make an offer with a very low price, which is
often close or similar to cost price. The vendors are, therefore, not able to make a profit and can
only meet the minimum requirements of the client. To be able to make a profit they try to find
loopholes in the contract or the specifications of the client to make additional works necessary.
For these extra efforts extra payments are received. Only with this additional work the vendors
are able to make a reasonable profit. (Van Duren, & Dorée, 2008)
This situation is illustrated in a transaction model of the value, price and costs of a project in
figure 3. In this figure it is shown that the difference between the value and the price is the
benefit for the client in the form of added value. When a vendor delivers more quality the value
of the project becomes larger. The difference between the price and the costs is the benefit for
the vendor. This benefit comes forward in the form of profit. (CROW, 2007)(De Ridder, 2011a)

Page | 3
Figure 3: Value, price, costs model in traditional procurement (Based on (De Ridder, 2011a) and (CROW, 2007, intermezzo p. 12))
This traditional attitude and way of procuring often leads to cost and planning overruns and a
lower quality (and thus value) of the delivered works. This is also made visible within the model.
The vendors are not challenged to deliver their best work and cannot think in favour of the
client’s needs, because their own benefits are also very small. Therefore, they are forced to do
exactly what is asked, nothing more, nothing less. Offering something extra to add quality is
almost not possible, because this will almost certainly cost extra money and raise the price. In
this way no tenders can be won, so delivering extra’s are a disadvantage. (Bossink, & Crucq,
2011)(Van Duren, & Dorée, 2008)
This way of procuring and working does not seem to be a very logical and healthy way of
working and doing business. But in 2008 still 80% of the tenders were procured with this
method. This indicates that the construction industry is still using a procurement method that
does not contribute to a healthy industry, therefore, changes need to be made. (De Ridder,
2011b)(Van Duren, & Dorée, 2008)
1.3 Economically Most Advantageous Tender
A big step forward in improving the way of procuring was made in April 2013, when a new
procurement law, ‘Aanbestedingswet 2012’, was introduced in the Netherlands. An important
change in this law is that all clients are obliged to award on a criterion called Economically Most
Advantageous Tender (EMAT). Only when the reasons for tendering solely on a price criterion is
clearly motivated an exception is made and there is deviated from using EMAT. (Pianoo, 2013)
In the EMAT method vendors are selected on a combination of price and quality. The quality is
measured in criteria, which are set in advance. With this method a client is able to find the
economically most advantageous tender. (Van de Rijt, & Santema, 2013)
The scores on the EMAT criteria are translated into monetary values with the method ‘Gunnen
op waarde’. In this way, both price and quality have the same unit and therefore they can easily
be compared. (Rijkswaterstaat, n.d.a)(Van de Rijt, & Santema, 2013)
When the score on a criteria is sufficient, the monetary values of each criteria are subtracted
from the offered price. When the score is insufficient, the monetary value is added to the offered
price. The monetary value that remains is called the fictive price. Based on this fictive price a
ranking is made. The vendor with the lowest fictive price wins the tender, because he offered the
best quality versus price ratio. (Bossink, & Crucq, 2011).

Page | 4
Because of this ranking offering a higher quality, and thus more value, is rewarded with a lower
fictive price, which improves the ranking of a vendor. Therefore, the criteria is used to stimulate
the offering of extra quality. The vendor is more likely inclined to anticipate to the clients
desires. (Bossink, & Crucq, 2011)
For EMAT tenders also a value, price and cost model exists. This model is shown in figure 4. In
this figure there is shown that in EMAT tenders the value that is delivered is higher, because the
delivered quality is higher. The total value that is added is also larger. The price is higher than in
a traditional tender, because the price is more realistic. And because the vendors are not solely
evaluated on the offered price. It is also shown that in this tender procedure it is more common
that profit is made, because of the realistic price no additional work is necessary to make a
profit. This makes the benefit for both the client and the vendor larger. (CROW, 2007)(De
Ridder, 2011a)
Figure 4: Value, price, costs model in an EMAT tender (Based on (De Ridder, 2011a) and (CROW, 2007, intermezzo p. 12))
There are different variants of EMAT tenders that are used in the Netherlands. One of these
variants is Best Value Procurement, this variant is introduced in the next paragraph.
1.4 Best Value Procurement/Best Value Sales
One of the latest developments within EMAT in the Netherlands is the usage of a new American
procurement strategy: Best Value Procurement (BVP). (Rydell et al., 2013)
In 1993 Dean Kashiwagi, a professor at Arizona State University, created a procurement process
named Best Value Performance Information Procurement System (BV PIPS). In this research this
process is referred to as Best Value Procurement. The underlying theory of BVP is the
Information Measurement Theory (IMT) that was also developed by Dean Kashiwagi. (PBSRG,
n.d.)(Van de Rijt, & Santema, 2013)
The Best Value (BV) method has already been tested for 1583 times for a total amount of $3.8
Billion in the construction industry. The projects have a success rate of 98%. BVP lifts the
original EMAT procedure to another level, which makes the focus on quality even greater. This
seems to pay off in this very high success rate. (PBSRG, n.d.)(Van de Rijt & Santema, 2013)
BVP is not only a way of procuring although the name seems to suggests this, it is an extended
method, a philosophy, which is also used in the design and execution of projects. This makes BVP
a very extensive method that covers not only the procurement phase, but the execution phase as
well.

Page | 5
BVP is not based on finding the vendor who offers the lowest price, but on finding the vendor
who offers the most value for the lowest price. In this way the client tries to find an expert to
execute his project. (Van de Rijt, & Santema, 2013)
In BVP quality and, therefore, value are a large part of the tender. This is reflected in the weights
that are used in reviewing BV tenders. Generally, in BVP, quality has a weight of 75%, while the
price has a weight of only 25%. The method is, thus, value based. (Van de Rijt, & Santema, 2013)
To be able to successfully use BVP a different mindset from both the client and the vendor is
required. In traditional procurements, for example, the client is used to manage, control and
specify everything the vendor does. In this way a non-expert is telling the expert what to do. This
is no logical way of working. (Rydell et al., 2013)
In BVP this is turned around. The client specifies only a global question based on some carefully
stated objectives and a maximum price limit, which is called the upper limit price. These client
objectives are the key element and the base of the request for tenders, because it is the only way
a client can give direction to the offers of the vendors. This leaves room for the vendors to be
innovative and decide themselves what the best way to address the project is, within the given
budget and taking the objectives into account. In this way the vendors can show what they are
capable of and are stimulated to perform on the top of their game. Furthermore, it is crucial that
the offers of the vendors contribute to these client objectives. (Rydell et al., 2013)
For the vendors it is important that they know what they are capable of and are aware of their
expertise. It is also important for them to be able to show the client their expertise, because by
showing their expertise in a dominant way the vendors can proof their expertise. Showing this
expertise happens mainly with Quantifiable Performance Information (QPI). This is factual data
about performances which makes clear if parties are capable of executing a certain project. With
this information it is made dominantly clear who the best vendor is. If no vendor can distinguish
them self on quality by the use of QPI, then the vendor that offers the lowest price is chosen.
(Rydell et al., 2013)(Van de Rijt, & Santema, 2013)
Another difference with more traditional tenders is that after awarding the project to a vendor it
is important that the client keeps its distance in order to create space and freedom for the expert
to turn his offer into reality. The vendor is the expert, so no control by the client should be
necessary. (Van de Rijt, & Santema, 2013)
There are two important parties that are involved in this method, the client and the vendor. The
method is two sided. On the side of the client this method is called BVP, because they try to
purchase something and try to find vendors for their project. The other side of this method is
viewed from the vendors perspective. This method is called Best Value Sales (BVS), because the
vendor tries to sell their product to the client. (Rydell et al., 2013)(Van de Rijt, & Santema, 2013)
Both sides of the method have different phases which, ideally, need to be executed to
successfully finish a project. These phases run parallel to each other and are shown in figure 5.
Figure 5: Phases of Best Value Procurement and Best Value Sales

Page | 6
BVP starts with a preparation phase. During this phase the client prepares the request for
tender, formulates his objectives carefully and brings his question to the market. After the offers
of the vendors are submitted the selection phase can start. During this phase the tenders are
reviewed, a ranking is made and a winner is chosen. The scoring of the offers happens on a scale
of dominance. Only dominantly good, dominantly bad or neutral scores are achieved. There are
no scores in between these scores, which ensures a clear review with large differences instead of
small irrelevant differences. In the pre-award phase that follows the chosen vendor gets time to
plan the entire project in detail. When the product of this phase is acceptable for the client the
award becomes final and the real work can start in the execution phase. (Van de Rijt, & Santema,
2013)
In BVS the vendor’s first task is to have a good vision on their qualities and focus within their
work field. This is stated in a proposition. When this proposition is clear a vendor can open up to
the market and participate in tenders that are in line with this proposition. During the
tender/proposal phase all tender documents are delivered and the vendor is interviewed. After
this phase the choice for one vendor is made by the client. Only one party goes on through the
next and final phase, the realisation phase. In this phase the project is finally prepared and
executed. (Rydell et al., 2013)
Since 2008 BVP is used in the Netherlands by Rijkswaterstaat. Rijkswaterstaat procured half of
the ‘Spoedaanpak Wegen’ with BVP. Nowadays the procedure is expanding quickly.
Rijkswaterstaat has already finished about 20 projects with this method and is planning to
procure many more projects with this method in the coming years. Also other public clients,
such as: Provinces, Municipalities and Water Boards, are working with BVP. There is, therefore,
a big sense of urgency for vendors and clients in the Netherlands to get familiar with this new
approach. (Rijkswaterstaat, n.d.b)
1.5 Problem analysis
As mentioned in the previous paragraph BVP requires a completely different attitude from the
vendors and the client. At the beginning of the tender process the vendors do not need to deliver
an extensive action plan as is usual in traditional tenders, but instead they have to deliver three
written documents, the qualitative documents: a performance substantiation, a risk file and a
value added file. (Van de Rijt, & Santema, 2013)
Furthermore, the vendors are interviewed by the client. During these interviews, and in the
documents as well, the vendors can show their expertise by substantiating the documents and
answers with QPI. Furthermore, all documents need to be formulated in a SMART way. This
stands for Specific, Measurable, Ambitious, Realistic and Time-bound. (Van de Rijt, & Santema,
2013)
However, engineering companies seem to have difficulties with proving their expertise by
substantiating every document with QPI. In practice these companies work from project to
project, without a proper evaluation of finished projects. This is caused by the attitude of most
organisations that there can only be worked on a project when the budget for that project is still
open. When a project is delivered this budget is often closed immediately, therefore, there is no
budget for a proper project evaluation. This indicates that there is almost no attention for the
evaluation of the quality of the product that was delivered, so there is no room for performance
measurement.

Page | 7
Because of this, no information is gathered that is used as a substantiation in the form of QPI in
following tenders. Therefore, in new tender procedures no expertise is proven with factual data
on the performance of earlier projects and vendors cannot dominantly proof their expertise.
This is a missed opportunity, because a lot of data that could form QPI is lost. This is a problem.
Therefore, engineering firms need to pay more attention to this crucial part of BVP and need to
improve application of QPI. This can make the difference between winning or losing a tender.
(Rydell et al., 2013)
Another part of the problem is that engineering companies have an idea of what their expertise
is and in what part of their work field they excel. But they cannot properly express their
expertise in QPI and therefore, once again, they cannot dominantly proof their expertise to win
tenders. So they need to learn how to translate their strengths and expertise into QPI to be able
to make dominantly clear to the client what they are capable of. (Rydell et al., 2013)
Therefore, QPI is crucial in BV tenders. It seems to be a catalyst when it comes to winning
tenders. When a tender is won, the performances of this project are measured. This results in
QPI, which can then be used in the documents that are delivered in a new tender. So, when more
tenders are won, more QPI is gathered and more tenders are won. The circle is then complete.
Therefore, it is very important that vendors understand how they can gather and apply QPI.
1.6 Problem formulation
Engineering companies are often aware of their strengths and skills. However, they are not able
to express their expertise in QPI and do not evaluate projects properly. What QPI exactly is, how
it can be measured and how it can be used in new tenders in an effective way is not clear for
engineering companies.
In BV tenders QPI plays a crucial role, because with this information the different vendors can
show their expertise. Rijkswaterstaat and other public clients have the intention to increase the
use of BVP, therefore, engineering companies are forced to embrace this way of procuring and
adapt their way of approaching tenders.
The problem becomes visible as a gap between the application of QPI at this time and the
standard of QPI that is needed to be able to participate successfully in BV tenders according to
the clients. This gap needs to be closed to be able to win tenders.
1.7 Research objective
The main objective of the research is: to develop a roadmap for engineering companies to
improve the way they gather and apply QPI in BV tenders.
To be able to reach the main objective first a sub objective needs to be achieved. This objective
is: to gain insight in what QPI is and how it is gathered.
1.8 Research questions
To be able to reach the research objective in an effective and structured way a main research
question is formulated. When this question is answered the research objective is obtained. To be
able to answer this main research question, several sub questions are formulated. These sub
questions contribute to the answering of the main question and a few also provide the

Page | 8
information to achieve the sub objective that is stated in the previous paragraph. In this way the
research is divided into different parts. This makes the research more manageable and easier to
oversee.
There are three sub questions that each belong to a different phase of the research. In that phase
this specific sub question is answered. In the next chapter the phases of this research are
explained.
The main research question is:
How can engineering companies improve the application of Quantifiable Performance Information in tenders?
The sub questions are:
1. Theoretical Background
What is needed for QPI to make it suitable for tenders according to the existing
literature?
o Information Systems
o Performance measurement
o Key Performance Indicators
The outcome of this phase is a conceptual model. This represents the ideal situation that
is extracted from the literature on what is needed for engineering companies to gather
QPI.
2. Practical Comparison
How is the current application of QPI compared to the use of QPI as stated in the
conceptual model and what new insights can be discovered in practice?
3. Design phase
How can the results of the theoretical background and practical comparison help
engineering companies to improve their application of QPI in tenders?

Page | 9
2 Research Methodology
In this chapter the methodology that is used in this researched is explored. But first two aspects
need to be made clear.
The viewpoint from which this research is performed is the point of view of the client. This
might seem strange, because the research is performed for a vendor and the research question is
formulated for engineering companies. But the client is the party that reviews the tenders and,
therefore, it is most valuable for vendors to know what the clients view is on QPI and how that
influences the evaluation of tenders.
Furthermore, the scientific field in which this research takes place is process management. The
research takes a closer look at the processes of gathering and applying QPI in tenders to be able
to improve the application of QPI.
2.1 Methodology
The research methodology is made visible in figure 6 in the next paragraph. The research is
executed in three different phases.
Phase 1) Theoretical Background
The first phase of the research is called the ‘Theoretical Background’. In the pyramid shaped
research framework it is shown that this phase forms the base for the rest of the research.
The first phase is an overall exploration of the subject of the research. Several subjects such as:
BVP, Information Systems, Performance Measurement and Key Performance Indicators are
explored by performing a literature study. From this first phase a conceptual model of all
literature combined comes forward. This is a framework of how the literature describes the
content of these different subjects. The model is focused on bringing all the literature subjects
together on how, in an ideal situation, QPI is gathered and improved according to the literature.
Phase 2) Practical Comparison
When this conceptual model is known, this literature based model is used to analyse practical
cases and it is verified by several clients and a vendor.
To be able to do this a case study analysis is performed for 13 BV tenders that Grontmij
participated in. This analysis gives an insight in several aspects of BV tenders and the use of QPI
in specific. Seven employees of three different clients of these case studies are also interviewed
to be able to determine what their view is on QPI and the other findings of the case study
analysis and the conceptual model from the previous phase. In this way the findings are verified
by the clients. Verification also happens by interviewing a BVP expert.
Another part of this phase is looking at the way an engineering company (Grontmij) already uses
performance measurement in projects and in what way projects are evaluated at this time. A
look is also taken at the proposition of Grontmij. By getting insight in these subjects it becomes
clear what the current state of the use of QPI, performance measurement and the way of
tendering is in practice. These insights are gained by keeping interviews with two employees of
Grontmij.
This phase will give an overall insight on what is important for QPI and BV tenders in general in
the view of a vendor, which is verified by the clients and an expert.

Page | 10
Phase 3) Design Phase
In the design phase all results and insights from the two previous phases are combined and a
roadmap is made that will help to obtain the main objective and answer the main research
question. The roadmap will be able to help engineering companies to improve their application
of QPI.
All additional findings that do not directly contribute to improving QPI, but do support the
improvement of BV tenders in general will also be brought together in a model, a checklist, to be
able to improve tenders overall. To be able to see if this checklist will contribute to eliminating
common mistakes from the qualitative documents a validation is performed.
After the design phase is completed conclusions and recommendations of the overall research
are made. Here the research question is answered and recommendations are made for further
research.
2.2 Research Framework
Figure 6: Research framework (based on (Verschuren, & Doorewaard, 2010))

Page | 11
Section II: Theoretical Background

Page | 12
3 Introduction
In this section the literary background of this research is presented. This section exist of three
chapters that all work together to answer the sub question that is linked to this phase of the
research. This question is:
What is needed for QPI to make it suitable for tenders according to the existing
literature?
To be able to answer this question a literature study is performed. Three subjects are explored.
These subjects are: Information Theory, Performance Measurement and Key Performance
Indicators. When these three subjects are combined the relationship of these subjects and what
is needed for gathering QPI becomes visible. The result of this section is a model that shows
these relations to each other and how a combination of these subjects will result in QPI.
First the three subjects are explored separately in three different chapters, which all end with a
conceptual sub model of that specific subject. In the final conclusion all three subjects and sub
models are merged into one conceptual model that reflects the relationship of the subjects with
QPI. This model in combination with the sub models is a base for improving the gathering and
application of QPI in engineering companies.
4 Information Systems
In 1991 the Information Measurement Theory (IMT) was formulated at the Arizona State
University. This theory is the base for BVP and is a structure that optimises information systems.
The theory considers different concepts, for example, it uses the laws of physics and deductive
logic (common sense) to give an explanation of the structure of an event. It can show the
relationship between factors when statistical analysis techniques cannot be used, because of
insufficient data. (Kashiwagi, 2002)
In this theory information is seen as: “the combination of laws and data which represents the
existing conditions that are used to accurately predict a future outcome. Information is not what
an individual may perceive, but an explanation of what actually exists.” (Kashiwagi, 2002)
To be able to win BV tenders and most likely also other EMAT tenders it is important for
engineering companies to have an optimised Information System (IS). QPI is the ultimate output
of an optimised IS. Therefore, in this chapter IS’s are explored based on IMT.
4.1 Construction Industry Structure
According to the IMT the construction industry is defined by two major components (Kashiwagi
et al., 2002):
Performance
Competition
With these two components a representation of the construction industry is made. This
representation is shown in figure 7 and is called the Construction Industry Structure analysis
(CIS). The logic of this analysis identifies that the traditional management of the construction
industry is mostly reactive, inefficient and ineffective. To be able to increase the efficiency and
the quality the entire system must change. This can only happen when dominant performance

Page | 13
information is available. In the CIS performance can, therefore, be replaced by the level of use of
performance information. (Kashiwagi et al., 2009)
In CIS the two major components, performance (information) and competition, form the axes of
the figure. This results in a figure with four quadrants.
Figure 7: Construction Industry Structure (CIS) (Kashiwagi et al., 2002)
Quadrant I is the lower right quadrant. In quadrant I the competition is high and the
performance of the industry is lower than what it could be. Vendors are not forced to deliver
their best possible performance. Furthermore, the use of performance information is low.
(Kashiwagi et al., 2002) This quadrant represents the situation in the traditional way of
procuring, where the dominant factor in procuring is the lowest price. In this environment the
client expects the highest performance, while the vendor offers the lowest possible performance.
This is caused by price pressure and price based awarding. (Van Duren, & Dorée, 2008)
Because of this contradicting expectations and behaviour there is tension in the relationship
between the vendor and the client. In this price based awarding situation vendors are hesitant to
offer a high performance, because according to the literature most of the time this will drive the
price up. Vendors cannot afford to raise the price, because of the high competition on offering
the lowest price, therefore no higher performance is offered. (Kashiwagi et al., 2002)(Kashiwagi
et al., 2009)(Van Duren, & Dorée, 2008)
However, a remark should be made here. From the practical experience of BVP in the
Netherlands it has come forward that offering a high quality and a low price often accompany
each other. On this specific subject the theory does not comply with the practical experience. (De
Wilde, 2013)
Quadrant II is the quadrant that represents the situation when BVP is used and which is,
according to IMT, the desirable quadrant to be in. Here, there is not only a high level of
competition, but also a high level of performance and, therefore, a high level of the use of

Page | 14
performance information. In a study by Kashiwagi and Massner (2002) it is stated that the
industry can move to this quadrant when during the award process value is also taken into
account. In this quadrant the price pressure decreases in comparison to quadrant I, because of
the focus on both value and price. The price in this quadrant is then the competitive price.
Furthermore, the use of performance information is of great importance and is needed on a high
level, because with this information the value of a tender is made clear and a vendor can show
his expertise. (Kashiwagi & Massner, 2002)
In quadrant III at the upper left side of the CIS there is a low level of competition, whilst the level
of performance, and use of performance information, is high. In this quadrant the level of
competition is so low that sometimes only one vendor offers to execute the project. There is no
real competition, so vendors are not forced to offer the best performance they can offer. In this
quadrant there is also price pressure, because of the lack of competition the focus will remain on
the price that the vendor offers instead of the value. This quadrant is called the ‘Negotiated Bid’.
For a healthy industry with a good market this is not a good quadrant to be in, because of the
lack of competition. (Kashiwagi & Massner, 2002)
The lower left quadrant, Quadrant IV, is the quadrant where both competition and the use of
performance information are low. This seems to be a combination that causes the industry to be
instable, because vendors cannot maintain themselves and are not able to remain in business for
a very long time. Therefore, an industry needs performance, competition or both to be able to
maintain itself. This quadrant is therefore not taken into account. (Kashiwagi & Massner, 2002)
Nowadays, a movement from Quadrant I and III is visible towards Quadrant II. Clients that are in
an industry which is in quadrant I are forced to find vendors that focus on performance, because
of the increased request to move the focus from price to value. Therefore, Quadrant I moves
towards quadrant II. The other movement from quadrant III to quadrant II is caused by the price
pressure that results from the low level of competition. Clients are forced to move towards a
more competitive quadrant, because of the price pressure. This movement is based on the
assumption that a higher level of competition will lower the price and at the same time the level
of performance will be maintained or improved. (CROW, 2007)(De Ridder, 2011a) (Kashiwagi et
al., 2002)
Furthermore, an important remark is that the use of performance information is crucial for the
movement towards Quadrant II. Without such information the real performance of a vendor
cannot be made dominantly clear and, therefore, the vendor that offers the highest performance
cannot be found. This indicates that it is important for engineering companies to have an insight
in their performance by means of performance information to be able to win BV tenders.
(Kashiwagi et al., 2002)
4.2 Rate of Change
That performance information is necessary in a value based industry also comes forward from
another part of IMT. This part is shown in a figure that is called the Rate of Change (RoC), see
figure 8. In this figure the relationship of the perception of information over time by an
individual is made visible. (Kashiwagi & Massner, 2002)
In the graph two different points are indicated with a letter, these points both represent a
certain type of person, either type A or type C. On the one side the level of information that a

Page | 15
type A person perceives, uses and passes is high. On the other side of the graph it is indicated
that a type C person perceives, uses and passes a low level of information. (Kashiwagi, 2002)
This graph is related to the change process of persons. When a person receives new information,
this causes change. This change causes the person to be able to perceive more information. This
means that over time persons get better in perceiving information. This is shown in the lines on
which the points of a type A and C person lie in the RoC graph. This means that a person or an
organisation can get better at processing and perceiving information over time. This is
convenient for performance information, because this will get interpreted in a better way when
time goes by. (Kashiwagi, 2002)
Figure 8: Rate of Change graph + KSM (Kashiwagi et al., 2002)
The right side of the graph is called the Kashiwagi Solutions Model (KSM), here there is shown
that also other components are influenced by the information level. For example, when there is a
high level of information no decisions have to be made. This is the case, because when there is
full information, the information can make the performance dominantly clear. When something
is dominantly clear no decisions have to be made, because the decision has been made by itself.
(Kashiwagi, 2002)
A type C person which has a low level of information represents the price based award process,
and, therefore, Quadrant I in the CIS. The low level of information forces the use of minimum
standards, control by rules and inspection. Because of the low information these measures are
necessary for a client to make sure the minimum standards are met and to ensure the outcome
of the decisions is favourable and according to the specifications and wishes of the client.
(Kashiwagi, 2002)
On the other side of the figure, the type A person represents the value based award process and,
therefore, Quadrant II in the CIS. From the KSM comes forward that when there is a high level of
information no rules and standards need to be set and no decisions have to be made. Also no
inspections have to take place and still the performances are maximised. Having full information

Page | 16
is, therefore, needed to be able to move to a value based environment. Engineering companies
need to have full information on their performances in the form of QPI to be able to win value
based tenders. (Kashiwagi, 2002)
4.3 Quantifiable Performance Information
The previous paragraph revealed that having full information and, thus, (quantifiable)
performance information is crucial for a value based environment and award process.
Therefore, in this paragraph information and QPI are explored.
Information is a driving power for organisations, because information helps to think logical and
take logical actions. It is, therefore, important for organisations to have a solid information
system to be able to keep improving and keep moving forward. (Sullivan et al., 2006)
In the last decades the gathering and sharing of information has increased tremendously,
because of the enhanced use of computers and the internet information has never been so
accessible as today. On the one hand this is convenient for the IS’s in organisations, but on the
other hand there is a large risk of overabundance of information. When there is too much
information available it gets harder to focus on the relevant information. (Sullivan et al., 2006)
According to Sullivan et al. (2006) the performance in the construction industry is low, because
the overabundance of information reduces the accountability of engineering companies.
Therefore, the level of information has to be chosen carefully at a balancing point where the
information still allows for complete understanding and accountability. A proper IS is required.
However, finding the balance in an IS seems to be contradicting to the KSM. In the KSM it was
stated that full information is necessary for easy decision making and improving performances,
the more information the better. Because of the insight that too much information can also make
an IS less effective the perspective in which full information is seen becomes different. In this
new perspective full information does not mean that an organisation needs all possible
information, but they need all relevant and necessary information to be able to understand and
oversee the big picture. (Kashiwagi, 2002)(Sullivan et al., 2006)
If an organisation wants to ensure an efficient IS the following steps need to be taken:
1. Eliminate data and capture information
2. Identify the important information
3. Simplify the information
4. Translate the information into measurements
5. Minimise communication
According to the first step data is something different than information. Information is able to
clarify things and is unambiguous, it reduces uncertainty and makes things understandable. If it
does not contribute to these goals it is data and not information. Information is data that is
organised and set into a context. Data has no context and are mere facts. Data, therefore, leads to
reduced accountability and has to be eliminated from the IS. An important remark that has to be
made is that what is information for one person is maybe data for another. Information has to
make sense to a person, when it does not, it is no information, but data. (Sullivan et al., 2006)
Furthermore, it is important that information is understandable for everyone, for an entire
organisation. Therefore, information needs to be simplified, here also a balance needs to be
found. Too simple information has no proper context and is, therefore, not useful (it is data). Too

Page | 17
complex information distracts from and conceals what is actually important. Therefore, making
information simple and consistent is difficult. Only critical information may remain. To be able to
make information simple and consistent the information needs to be linked to the organisations
proposition or strategy. This is an important aspect of information that needs to be kept in mind
in the IS. (Sullivan et al., 2006)
A special kind of information, that is the key of this research, is performance information or
more specifically QPI. QPI is information about the performance of an organisation. With this
information an organisation is able to get a better insight in his performances and it can act on
this. QPI is performance information that is quantifiable and is displayed as digits. They are
measurable facts in a context. (Van de Rijt, & Santema, 2013)
QPI is dominant information, this means that the QPI should make it dominantly clear if (in the
scope of this research) a vendor is capable of executing a certain project. Therefore, as already
shown in the KSM no real decision has to be made. However, the concept of dominant
information not very clear. It seems to be very hard to show performances in a real dominant
way. (Van de Rijt, & Santema, 2013)
Van de Rijt and Santema (2013) identified six characteristics that QPI should have to make the
performance information dominant. According to them dominant performance information
should be:
Irrefutable
Verifiable
Accurate
Quantifiable
Show a high performance
Translated to the current project
Another perspective on QPI is that it should be formulated in a SMART way. This also brings
along characteristics for performance information to be dominant, some characteristics occur in
both perspectives. The SMART characteristics for performance information are:
Specific
Measurable
Ambitious
Realistic
Time bound
When QPI is formulated these two groups of characteristics of dominant information have to be
taken into account. In this way QPI is displayed in an effective way that is useable in BV and
other EMAT tenders. (Van de Rijt, & Santema, 2013)
4.4 Conclusion
In this paragraph a conclusion is drawn from the information in this chapter. In figure 9 an
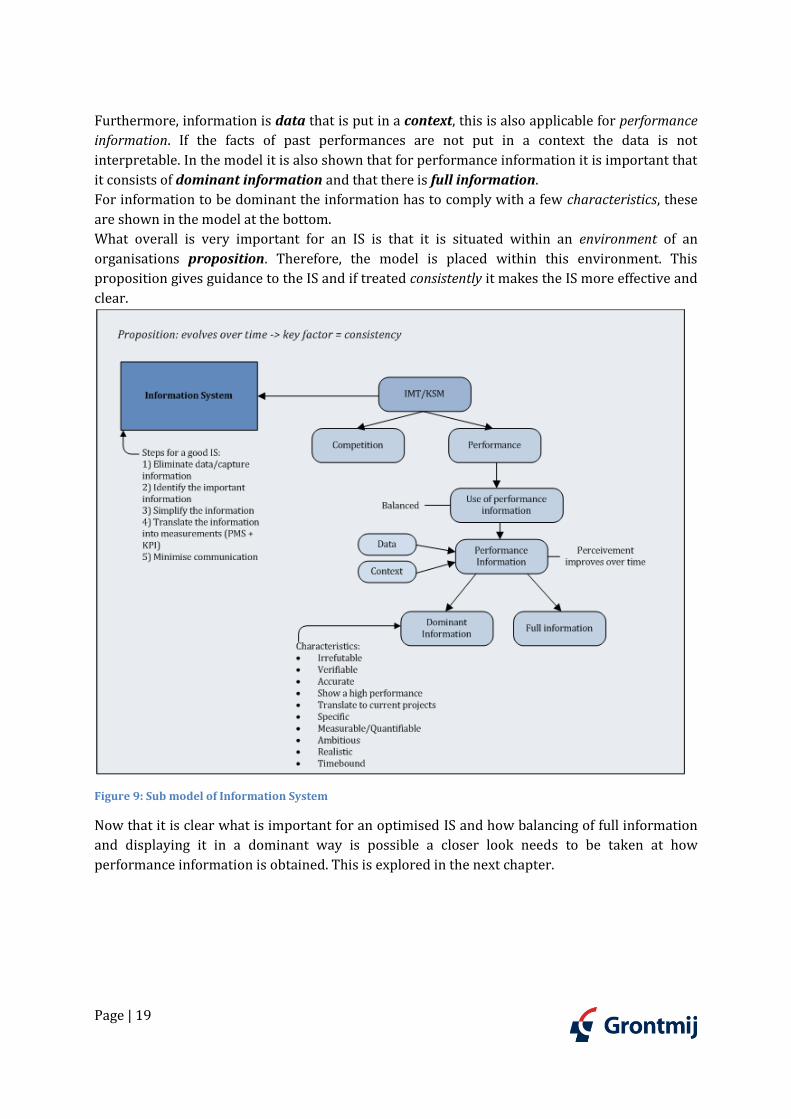
overview of the information in this chapter is shown.
The IMT is a structure that optimises IS’s. The output of an optimised IS is QPI. This information
and, therefore, this optimised system is necessary to be able to win tenders.
According to IMT the construction industry is based on two components: competition and
performance. To be able to move to a value based industry there must be both competition and a

Page | 18
high performance. Also a high level of performance information is required. According to KSM
there must be full information in a value based industry.
However, it is important to remark that the amount of information has to be balanced.
Otherwise, it loses its effectiveness.
Furthermore, five steps need to be taken to be able to set up an optimised IS:
1. Eliminate data and capture information
2. Identify the important information
3. Simplify the information
4. Translate the information into measurements
5. Minimise communication
Step one indicates that data is not the same as information. Information is data that is set within
a context.
An important point of performance information and, thus, the entire IS is that it needs to be
linked to the organisations proposition.
To be able to use QPI in a tender it is necessary that performance information is represented in a
dominant way. There are a few characteristics that dominant performance information needs to
have to be dominant, these are:
Irrefutable
Verifiable
Accurate
Show a high performance
Translated to the current project
Specific
Measurable/Quantifiable
Ambitious
Realistic
Time bound
The results from this chapter are combined in a sub model. This model is shown and explained
in the next paragraph.
4.5 Explanation of model
In figure 9 the sub model of the IS that is explored in this chapter is shown. In this paragraph this
model is explained.
From the literature it comes forward that the IS is based on the IMT/KSM theory of Dean
Kashiwagi. Therefore, these theories are the input for the IS. According to these two theories it is
essential for an IS to have a high level of competition within the market and a high level of
performance. This is indicated with the two squares that are output of the IMT/KSM block. This
high level of performance can also be seen as a high level of performance information. This is
shown in the model as the use of performance information.
From the literature it comes forward that when using performance information the level of
performance information should be balanced. Too much performance information will lead to
chaos, which makes it hard to differentiate the important information from the unimportant
information. However, also too little performance information is not favourable, because than
the effectiveness of the information is lost.
Page | 19
Furthermore, information is data that is put in a context, this is also applicable for performance
information. If the facts of past performances are not put in a context the data is not
interpretable. In the model it is also shown that for performance information it is important that
it consists of dominant information and that there is full information.
For information to be dominant the information has to comply with a few characteristics, these
are shown in the model at the bottom.
What overall is very important for an IS is that it is situated within an environment of an
organisations proposition. Therefore, the model is placed within this environment. This
proposition gives guidance to the IS and if treated consistently it makes the IS more effective and
clear.
Figure 9: Sub model of Information System
Now that it is clear what is important for an optimised IS and how balancing of full information
and displaying it in a dominant way is possible a closer look needs to be taken at how
performance information is obtained. This is explored in the next chapter.

Page | 20
5 Performance Measurement
As mentioned in the previous chapter it is necessary for vendors and, thus, engineering
companies to make their expertise and capabilities explicitly and unambiguously clear in
tenders. Therefore, performance information has to be obtained. This information has to meet
the standards of information that are stated in the previous chapter. To be able to obtain this
performance information organisations have to measure their performances in a controlled and
explicit way. This is done by using performance measurement, which is explored in this chapter.
5.1 Performance measurement in general
Performance measurement is defined by Bourne, Neely, Mills and Platts (2003) as: “the process
of quantifying the efficiency and effectiveness of an action.” This indicates that performance
measurement is a process in which the actions that an organisation undertakes determine the
performance of this organisation in ways of the efficiency and effectiveness.
Performance measurement can take place by the use of performance measures. Bourne et al.
(2003) define performance measures as: “a metric used to quantify the efficiency and/or
effectiveness of an action.” So, performance measures are used to quantify the efficiency and
effectiveness of the actions that are undertaken by an organisation.
These two definitions come together in the definition of a Performance Measurement System
(PMS), according to Bourne et al. (2003) a PMS is defined as: “the set of metrics used to quantify
both the efficiency and the effectiveness of actions.” From this definition comes forward that a
PMS consists of a set of performance measures, which try to quantify all actions of an
organisation. The performance of an organisation is, therefore, a function of the efficiency and
effectiveness of the actions it undertakes. To be able to gather QPI engineering companies have
to implement a PMS. (Bourne et al., 2003)(Neely et al., 1995)
Performance measurement is a continuous process of monitoring/measuring, reporting and
evaluating. It is used to measure past performances, but it can also be used to show progress in
achieving certain objectives. (Aedes, 2013)
Ultimately the goal of performance measurement is that informed decisions are made based on
the performance information that emerges from the measurements. When the QPI is dominant
the decision making should be easy, because, as shown in the KSM in the previous chapter, when
there is dominant and full information available no decisions have to be made. The decisions are
so obvious they are made by them self. These decisions are, for example, a decision of a client for
a certain vendor that is capable to execute a certain project, but it can also help to make internal
decisions at the management level of an organisation to change certain processes or the way of
working. (Aedes, 2013)
Performance measurement on itself is not a goal. It affects an organisation as a whole. It is, for
example, helping to make the performance of an organisation transparent. More transparency
helps to identify the strengths and weaknesses of an organisation. Therefore, the organisation
can easily make decisions on what is going well, what can be improved and what needs to be
changed. Because of this transparent view into the strengths and weaknesses it also becomes
easier to choose their core business, which is based on an organisations strengths. Therefore, it
also improves the focus of an organisation on achieving their objectives, which makes it easier to
Page | 21
evaluate and adjust the performance of an organisation. Because of the clear view adjustments
are made with more conviction and precision. (Aedes, 2013)
Another effect of performance measurement is that it helps to compare performances not only
internally between different segments of a company, but it also enables to compare an
organisations performances with an external competitor.
Performance measurement also makes people more aware of their accountability. This motivates
people and organisations to perform well, because when an organisations strength and
performance is measured they want to get the best result possible. People are, therefore,
motivated and more eager to strive for a better performance.
Furthermore, performance measurement also enhances communication. This is linked to the
more open environment in the organisation which enables more specified and clear
communication. (Aedes, 2013)
For performance measurements to be effective it is necessary to be performed against a
reference framework. Against such a framework the measurements of actions are judged. This
puts the performance measurements in a realistic perspective, which is important to be able to
make well informed decisions based on QPI. (Bourne et al., 2003)
5.1.1. Link to organisation
The most important characteristic that performance measurement needs to take into account,
and needs to incorporate, is that it should always be linked to and derived from a company’s
proposition, therefore, it has to be completely integrated in an organisation. The management of
the organisation must give their full support to it. This is important, because the measuring of
the performances impacts the environment of the organisation, which must be accepted by the
entire organisation The key factor of a proposition is consistency. A proposition can only exist
when there is a consistency in decisions and actions. (Bourne et al., 2000)(Bourne et al.,
2003)(Neely et al., 1995)
However, it must also be taken into account that propositions evolve by the decisions that are
made, this makes them complex. Therefore, it is important that the PMS is continuously aligned
with the underlying proposition. This enables the system to improve the strategic management
by challenging the proposition and to act in a consistent way. (Bourne et al., 2000)(Bourne et al.,
2003)
Furthermore, the importance of strategic variables should be reinforced by the measurements.
Measuring only the subjects that are critical for an organisation to achieve their proposition is
important for an organisation to be able to have success and achieve their long term prospects.
(Neely et al., 1995)
5.1.2 Pitfalls and difficulties
Measuring performances also brings some pitfalls and difficulties along. These have to be taken
into consideration when a PMS is introduced in an organisation. In this way the organisation can
cope with performance information in a better way, because it puts it in a wider context.
A pitfall is that only short term objectives are taken into account. This is, for example, the case
when only financial and internal information is gathered. This is not desirable, because then no
Page | 22
real course is taken to improve performance on a long term base. This happens in traditional
measures. (Aedes, 2013)
When using performance measurement it is important that managers make decisions based on
the performance information that is delivered by the PMS. However, a pitfall is that managers
keep making decisions based on their intuition instead of making a decision based on
performance information. This eliminates all benefits of measuring performances at once and is,
therefore, undesirable. (Aedes, 2013)
Another performance information related pitfall occurs when performance information is
simplified too much. When this occurs performance information can lose its context and
decisions are made based on wrong assumptions. Furthermore, when interpreting performance
information that came forward from performance measurements one has to be careful, because
persons and organisations always try to manipulate the outcomes in such a way that there
performance looks better. This is called: gaming the numbers. Therefore, everyone who
interprets performance information has to be aware of the fact that it only represents a model of
reality. (Aedes, 2013)
One of the difficulties of performance measurement is finding the right balance in the amount of
information that is collected. This also came forward in the previous chapter. The effectiveness
of performance measurement is often greatly reduced when managers receive a data overload.
This stands in the way of good decision making, because the vision of the decision making gets
blurred. It is also possible that too little information is gathered. Then decision making cannot be
effective as well. There is a possibility that essential information is missing and, therefore, the
big picture is missing. Finding a good balance in the level of information that is gathered is
crucial for effective performance measurement. (Aedes, 2013)(Neely, 1999)
5.2 Performance measures
In the previous paragraph the definition of performance measures is stated. In this paragraph
performance measures are further explored.
Traditional performance measures only focus on financial and internal measures. These
traditional measures have a few characteristics that make these measures not suitable for the
market situation nowadays. For example, these measures encourage a short term perspective,
are one dimensional and do not completely focus on an organisations proposition. These
characteristics cause problems on the long term and do not stimulate constant improvement.
What is also a problem here is that these internally focused performance measures do not
measure information that is relevant for clients. Therefore, measuring performances with only
traditional measures does not contribute to gathering QPI. (Bourne et al., 2003)(Neely, 1999)
Furthermore, Bourne et. al (2003) state that more innovative sets of performance measures that
are used nowadays consist of a multi-dimensional set of performance measures.. This indicates
that the set of performance measures do not only take financial and internal measures into
account, but also include non-financial and external measures. Because of this external focus
these measures are more useful for obtaining QPI. With these measures also the strategic focus
is improved, because of this multi-dimensional perspective. These measures are called: current
measures.
To be able to measure performances in a clear and unambiguous way performances need to be
measured in numbers with an accompanying unit. In this way factual information about

Page | 23
performances comes forward, which is the base for QPI. To be able to set up performance
measures that measure performances in numbers the measures need to be based on
performance indicators. These indicators need to be linked to the organisations proposition, just
like the measures and the IS. These indicators are called: Key Performance Indicators (KPI’s).
KPI’s are explored in the next chapter, because they are crucial input for the performance
measures. (Aedes, 2013)
According to Van de Rijt and Santema (2013) past performance is no longer a criterion on which
vendors are reviewed in BVP. However, in my opinion performance measures, and eventually
QPI, do focus, at least for a part, on measuring past performances and showing past performance
results. Therefore, past performance is still part of the evaluation of BV tenders.
5.3 Performance measurement systems
As mentioned before a PMS consists of a set of performance measures. A PMS has to be able to
give a complete picture of the performances of the entire organisation. These performances need
to be linked to the proposition of the organisation. (Bourne et al., 2003)
Neely, Gregory and Platts (1995) state that a PMS consists of three different levels on which it is
examined. These levels are:
1. The individual performance measures
2. The set of performance measures, which form the PMS
3. The relationship of the PMS with the environment
A representation of these three levels is shown in figure 10. PMS’s contain different individual
performance measures, which together form the system. All these individual measures need to
be set into a strategic context to be able to reach the objectives and support the proposition of
the organisation. The measurement of the individual measures stimulates action. Only by
consistency of the organisations actions the organisations proposition is realised. (Neely et al.,
1995)
Figure 10: Visualisation of Performance Measures in a PMS (Based on (Neely et al., 1995))

Page | 24
During the implementation of the PMS the interaction with the environment has to be taken into
account, this environment can also be seen as the proposition of an organisation. There are two
dimensions in the environment, namely the internal and the external environment. The internal
environment is the organisation itself, the external environment is the market in which the
organisation competes. (Neely et al., 1995)
The external environment, or the market, seems to consist of two parties. On the one side the
clients and on the other side the competitors. To be able to perform on a top level both sides
need to be taken into account. (Neely et al., 1995)
According to Bourne, Mills, Wilcox, Neely and Platts (2000) the development of a PMS is
performed in three phases.
Phase 1: Design phase, in this phase the performance measures are designed in two sub
phases. One sub phase is identifying the proposition that needs to be measured
and the other is designing the actual measures.
Phase 2: Implementation phase, in this phase the information is collected, processed and
sorted.
Phase 3: Use phase, in this phase the measures should be used to measure the success of
the proposition, challenge assumptions and test the validity of the proposition. A
review is performed and then actions are undertaken according to the measures
outcome.
5.4 Conclusion
A representation of this chapter is presented in figure 11 at the end of the next paragraph. In this
paragraph the conclusions of this chapter are drawn.
Performance measurement quantifies the efficiency and effectiveness of actions. Performance
measurement is necessary to be able to measure the performances of organisations in a
quantifiable way. It obtains performance information that will form QPI.
Performance measurement has multiple effects on an organisation. These effects are:
Transparency
Focus
Evaluate and adjust
Comparison
Accountability
Motivation
Communication
The PMS exists of multiple performance measures that measure performances, which are set
against a reference framework. This framework enables an organisation to judge the outcomes.
There are two types of performance measures: traditional and current measures. Traditional
measures use financial and internal measures. Current measures use the traditional measures
and adds non-financial and external measures to them.
An important aspect is that the performance measures and PMS are linked to the proposition of
the organisation to be able to measure the right aspects of their performances.
From the literature a few characteristics of a PMS come forward.
Page | 25
Characteristics of a PMS are:
Integrated in an organisation
Full support by management
Measure only critical subjects
Focus on long-term prospects
Continually align with proposition
Balance information
The development of a PMS happens in three different phases. These phases are:
1. Design phase
2. Implementation phase
3. Use phase
All the findings from this chapter are combined in figure 11, in a sub model. This model is
explored in the next paragraph.
5.5 Explanation of model
The findings from the literature study in this chapter are shown in figure 11 at the end of this
paragraph. In this figure there is shown at the top that a certain performance has a certain
efficiency and effectiveness. These two aspects of a performance are quantified by a Performance
Measurement System. To be able to measure the performances and do this quantification
several performance measures are used. This is represented in the figure, because the
performance is the input for the performance measures, which are in their turn the input for the
PMS.
There are two categories of performance measures. The first category exist of traditional
measures. In these measures only financial and internal measures are performed. While with the
current measures also non-financial and external measures are performed.
The PMS is set against a reference framework. This provides a context for an organisation to be
able to judge the performance measurements.
Furthermore, several characteristics to which a PMS should comply are incorporated in the
model on the bottom right.
The development of a PMS happens in three different phases. These phases are:
1. Design phase
2. Implementation phase
3. Use phase
An important aspect of the entire PMS model is that the performance measures and PMS need to
be linked to the proposition of the organisation. This proposition can give direction to which
performances are measured. This is shown by the environment in which the model is placed.

Page | 26
Figure 11: Sub model of Performance Measurement System
To be able to make the measurements quantifiable and to be able to measure aspects that are
understandable and easy to interpret the performances have to be measured based on Key
Performance Indicators. This subject is explored in the next chapter.
Page | 27
6 Key Performance Indicators
Key Performance Indicators (KPI’s) are necessary in performance measurement to make sure
that in a PMS the correct variables are measured. The choice of these performance indicators is
very important, because they have to give a complete and good representation of the overall
performances, otherwise the PMS delivers incorrect QPI and wrong decisions are made based on
this information. To be able to get a good insight in what KPI’s are they are explored in this
chapter.
6.1 KPI’s in general
KPI’s are defined as: “quantifiable variables that make it possible to relate a performance to a
pre-set standard.” KPIs are quantifiable, therefore, the indicators are expressed in a number
with a unit. Each indicator has a unit that corresponds to that specific indicator. In this way
performance indicators are able to show dominant information in a verifiable and transparent
way. (Aedes, 2013) (Van de Rijt & Santema, 2013)
In the construction industry the goal of KPI’s is to enable the measurement of the performances
of a project or organisation. Just like the IS and PMS also for KPI’s the link to the organisations
proposition is very important. KPI’s are needed to indicate the effectiveness of the proposition of
an organisation. (Rydell et al., 2013)
The performances of an organisation on its objectives cannot be measured by only one
performance indicator. A set of indicators is required that covers the performances of the entire
proposition. If the KPI’s in the set are chosen and formulated in a correct way the entire set of
KPI’s and, therefore, also the PMS and QPI is linked to the proposition of the organisation. In this
way an organisation can ensure that the proposition gets achieved. (Aedes, 2013)(Nicis Institute,
2010)
According to A.P.C. Chan and A.P.L. Chan (2004) in the PMS the following factors need to be taken into account for the development of KPI’s:
The number of KPI’s that is required should be balanced and be manageable, otherwise the PMS becomes either too complex, or the proposition is not entirely represented
KPI’s need to be used in a systematic and consistent way over multiple projects Data collection must be simple A large sample size is needed for KPI’s to be effective, they need to be applicable to every
project The entire organisation must approve and support the PMS and the corresponding KPI’s KPI’s change over time, because the proposition and objectives of the organisations are
subject to continuous changes. The KPI’s need to follow this move and must evolve. When an organisation decides that it wants to measure its performances, first it is important
that it is decided what performances are going to be measured. When this is clear these subjects
need to be translated into KPI’s. When, for example, the performances of a certain subject
depend on a specific group of stakeholders it is convenient to have a KPI that takes the needs of
these stakeholders into account. (Aedes, 2013)

Page | 28
6.2 Categories and characteristics of KPI’s
According to Lin, Shen, Sun and Kelly (2011) KPI’s are divided into three groups of indicators
that all focus on a different kind of indicator. These three groups are:
Predicting Indicators
Process-related Indicators
Outcome-related Indicators
To be able to have a complete PMS all three indicators should be represented in the PMS.
In a research of the Nicis Institute (2010) three criteria came forward that need to be taken into
account when performance indicators are chosen and formulated. These three criteria are:
Measurable
Relevant
Accountable
A KPI is measurable when an indicator is measured in an unambiguous an explicit way. The KPI
needs to be expressed in a number with an accompanying unit. When an indicator contributes to
the objectives and proposition of an organisation the KPI is relevant. The relevancy of a KPI is
important for an organisation, because then a KPI contributes to achieving the objectives of an
organisation. The last criterion indicates if a KPI is accountable. For KPI’s it is important that the
organisation is completely accountable for the performances that a KPI reflects. Because when
an organisation is accountable for a specific performance measured by the KPI the organisation
can influence the performance on this KPI and, thus, the performance of this KPI is in their own
control. (Nicis institute, 2010)
According to the literature the perfect KPI combines all of these three criteria. However, the
KPI’s that consist of all three criteria are very rare. It is, therefore, hard to find solid criteria that
comply with all of these criteria. Often KPI’s are based on only two of these three criteria, which
is a risk because the third criterion is not involved. Then a KPI can, for example, be accountable
and measurable, but when it is not relevant for the organisation it is useless. Therefore, a KPI
that misses the link with one of these three criteria has to be perceived with the knowledge that
a criterion is missing in mind. When this is done the outcomes of the KPI is assessed in a correct
context and this puts the result in the right perspective. (Nicis institute, 2010)
From these KPI’s dominant performance information comes forward, or at least the base for
dominant performance information has to come forward. Therefore, the characteristics of
dominant information in paragraph 4.4 also have to be kept in mind when KPI’s are set up.
Performance indicators are expressed in a one dimensional or a multi-dimensional way. Multi-
dimensional performance indicators are expressed as ratios of two different units, while one
dimensional performance indicators express one measured unit. If multi-dimensional values are
used this makes the performances comparable with other companies. (Aedes, 2013)
Cox, Issa and Ahrens (2003) make a differentiation between quantitative and qualitative KPI’s.
Quantitative indicators are physically measured and are often the most obvious indicators.
Qualitative indicators are often not immediately visible as possible KPI’s, because they are
difficult to assess and measure.
Another distinction between two kinds of KPI’s is made by Chan et al. (2004) who looks at KPI’s
as both subjective and objective indicators. Objective indicators are similar to the quantitative

Page | 29
KPI’s, they are quantifiable and are expressed quite easily in hard digits and numbers. These
KPI’s are based on hard information and are calculated with mathematical formulas. Subjective
KPIs are similar to qualitative KPIs. These KPI’s are harder to quantify. Eventually they are
expressed in numbers, but these numbers are based on soft information, for example, opinions
and personal judgements. (Neely, 1999) (Nicis institute, 2010)
In a complete set of KPI’s both objective and subjective KPI’s are required. Because the hard
information that comes forward from the objectives are viewed in a better context when
subjective KPI’s are also added. This helps to give more insight in the overall results of the
indicators. Therefore, it is important to combine these two kinds of indicators. (Nicis institute,
2010)
6.3 Scores on KPI’s
When an organisation uses performance measurement and gets a score on a certain KPI, this
score is either positive or negative. This score causes an incentive for the organisation to make
changes and improve. Such an incentive is either powerful or very low. A too powerful incentive
makes an organisation desperate to achieve a good performance and, therefore, they will do
anything to accomplish this. The way this is done is mostly not favourable for the organisations
performance. However, a too low incentive brings along the risk that the incentive is not
observed or is ignored by an organisation. Therefore, a balance is also important when it comes
to the strength of incentives from the KPI’s in the PMS. (Nicis institute, 2010)
As comes forward from the definition of KPI’s it is necessary that KPI’s relate to a pre-set
standard. This is similar to the reference framework against which the PMS is set in the previous
chapter. In this way KPI’s are set in a certain context and performances are compared to these
standards. In other words, standards make KPI’s functional. (Aedes, 2013)
Standards are set in different ways, for example, as:
Norms
Benchmarks
Historical data
Norms are formulated by an organisation and can reflect a certain level of performance that at
least must be achieved. When a performance scores above this norm, the performance is decent.
But when the performance stays below the norm the organisation has to change and improve to
be able to achieve the objectives. The norms are, therefore, a good reference to keep track of
performances. (Aedes, 2013)
Another type of standard to which performances are compared is benchmarking. In
benchmarking the performances of an organisation are compared to the performances of other
organisations that perform in the same market and work in the same processes. In this way the
standard becomes the performance of the market. (Aedes, 2013)
The last standard that is identified is historical data. In this way of assessing performance
information the performance of a current project or process is compared to earlier results on
similar projects or processes. In this way the company sets its own standards by its past
performance. A remark here must be made that when an organisations performances in the past
are low, the standard to which the current performances are compared is also low. Therefore, an
organisation is not forced to improve its performances, because from the standard it seems that

Page | 30
what was good enough in the past is still good enough in the current market. This is no good
reference for improvement. (Aedes, 2013)
6.4 Examples of KPI’s
In this paragraph examples are given of possible categories of KPI’s. Within these categories
different examples of actual KPI’s are given. When reading this paragraph one thing that has to
be kept in mind is that the categories and examples of KPI’s are all based on literature for the
construction industry, which mainly focuses on the actual execution of construction works.
Therefore, these KPI’s and categories are a good example of how KPI’s for contractors are
categorised and formulated. But most likely these are less useful for engineering companies,
because their works often are focused on the work before the execution starts. Therefore, this
paragraph must give an idea of what categories and KPI’s can look like, but must not be
interpreted as readily applicable for engineering companies.
The basic criteria that determine project success and, thus, a good performance are according to
Neely (1999):
Time
Cost
Quality
These three criteria are named the ‘Iron Triangle’ by Atkinson (1999). According to him the Iron
Triangle is the base for project success, and thus, a good performance. These criteria are,
therefore, seen as the base for a PMS and KPI’s.
Time and costs are measurable criteria and have units that are simply defined. But according to
Atkinson (1999) these two criteria are only based on best guesses. Quality is an even more
difficult criterion, because it depends on people’s perspectives and beliefs. It changes over time
and it is different for every person. Therefore, it is hard to capture in a KPI. Furthermore, quality
is seen as a neutral criterion by public clients. This means that it does not determine project
success for clients. This is taken into account when formulating KPI’s by vendors. (Van Loenhout,
2013)
Because of these difficulties of measuring the criteria, the Iron Triangle on its own is not enough
to capture the complete performances on projects of an organisation. Therefore, additional
criteria on which KPI’s are based are necessary. The Iron Triangle on its own is too restricted.
(Atkinson, 1999) (Van Loenhout, 2013)
In literature on KPI’s a lot of different examples of KPI’s and categories are given. In table 1 an
overview of different identified categories and examples of KPI’s are given to give an example of
what KPI’s can look like.

Page | 31
Table 1: Examples of KPIs in the construction industry (Atkinson, 1999; Egan, 1998; BRE, 2013; Chan et al., 2004; DETR, 2000; Cox et al., 2003)
6.5 Conclusion
KPI’s are important for measuring the correct variables in a PMS. These KPI’s have to give a good
representation of overall performances and have to be linked to an organisations proposition.
One KPI is not enough to cover the entire proposition and performances, therefore, a set of
indicators is required.
KPI’s are quantifiable variables and exist of a number with a corresponding unit. This unit can
either be one or multi-dimensional. KPI’s, furthermore, reflect dominant information and are,
therefore, important to be able to obtain QPI.
Category of KPI
Atkinson (1999)
Egan (1998) BRE (2013) Chan et al. (2004)
DETR (2000) Cox et al. (2003)
Time -Time - Construction
Time
- Time
Predictability
- Construction Time
-Construction Time -Speed of Construction -Time Variation
-Construction Time -Time predictability
-On-time completion -Lost time accounting
Costs -Cost - Construction
Cost
-Cost
predictability
- Construction Cost
-Unit Cost -Percentage net variation over final cost -Net Present Value
- Construction Cost -Cost predictability -Return on Capital -Return on value added -Return on Investment
-Construction cost -Turnover
Quality -Quality
Qualifications & Skills -Impact on Environment -Whole Life Performance
-Quality -Environment Impact Assessment (EIA) scores -Functionality
-Quality -Change orders
Defects -Defects -Defects -Defects
Safety -Safety
-Accidents
-Accidents -Accidents -Fatalities
-Safety
Productivity -Productivity -Productivity -Productivity
Profitability -Profitability -Profitability -Profitability
Client satisfaction
-Client
Satisfaction
-Client Satisfaction -Employee Satisfaction
-Client satisfaction -User satisfaction -Design team satisfaction -Construction team satisfaction
-Client satisfaction
Staff -Staff Turnover -Sickness Absence -Working Hours
-Rework -Percent complete -Absenteeism -Motivation

Page | 32
Criteria that are necessary to formulate a good set of KPI’s are:
Balanced number of KPI’s
Used in consistent and systematic way
Data collection must be simple
Large sample size is needed
Approved and supported by organisation
Evolves over time with a changing proposition
Furthermore, there are three kinds of KPI’s:
Predicting indicators
Process-related indicators
Outcome related indicators
When it comes to KPI’s there are three criteria that all KPI’s should possess. These criteria are:
Measurable
Relevant
Accountable
An ideal KPI combines all three of these criteria, but mostly two criteria are combined in one
KPI. Then it is important that the missing criterion is kept in mind, this gives the KPI a better
perspective.
Furthermore, KPI’s are either objective/quantitative or subjective/qualitative. Objective KPI’s
are based on hard information, facts, and are measured by formulas. Subjective KPI’s are based
on soft information, such as opinions.
Finally, a set of KPI’s is set against a reference framework. This framework exists of pre-set
standards, such as: norms, benchmarks or historical data. These give KPI’s a framework to which
they are compared. This makes them easier to assess.
6.6 Explanation of model
In figure 12 a representation of the information in this chapter is shown. In this paragraph this
visualisation of the literature is explained.
KPI’s are important for measuring the correct variables in a PMS. One KPI is not enough to cover
the entire proposition and performances, therefore, a set of KPI’s is required. This is shown in
the large square in the model. This set of KPI’s consists of multiple KPI’s.. These indicators are
outcome related, process related or predicting. All KPI’s have to comply with three criteria. They
should be: measurable, relevant and accountable.
On the right side of the model there is shown that the KPI’s can either be objective/quantitative
or subjective/qualitative. These two types of KPI’s are both needed within a set of KPI’s to give
a good overview of the performances that are being measured.
The set of KPI’s is set against a reference framework. Just like the PMS here as well this
reference framework sets the KPI’s in a certain perspective to be able to judge the outcomes.
Another important aspect for the set of KPI’s is, just like the IS and PMS, that it is linked to the
proposition of an organisation. When an organisation knows what it wants to achieve and be
good at for this particular performance KPI’s are stated. Therefore, here as well the environment
of the model is the proposition of the organisation.

Page | 33
Figure 12: Sub model of set of KPIs
7 Conclusion
In this chapter an overall conclusion of this section is given. This conclusion is based on the
previous three chapters about IS, PMS and KPI’s and is focused on how these three subjects
contribute to optimising the gathering and application of QPI.
In figure 13 a representation is shown of the links between the subjects of the previous chapters.
In this model there is shown that the proposition of an organisation is the environment in which
the entire model takes place. All aspects within this environment of the proposition and
objectives are linked to them. For example, for performance information it is important that the
entire IS is linked to the proposition. This also counts for the PMS and the KPI’s.
The proposition of an organisation is complex. It evolves over time with all decisions that are
made. However, despite these changes it is necessary for an organisation to have a consistent
proposition that is reflected in all actions that are taken. Therefore, the proposition of an
organisation is the base and environment of the entire model.
Another important aspect that is needed to be able to gather and apply QPI is the IS. This system
represents an optimised IS in which performance information is gathered and assessed in a
proper way. The IS comprises both the PMS and set of KPI’s, because performance
measurement happens within the IS and KPIs are the input for the PMS.
The PMS consists of a number of performance measures. These measures are all linked with the
proposition and occur within the IS. Performance measurements need to be performed in such a
way that the outcome is used as the base of QPI. Therefore, only the critical subjects are
measured in a quantifiable way. To be able to do this KPI’s are necessary. These KPI’s are within
the IS, the input for the PMS and are also linked to the proposition of an organisation.
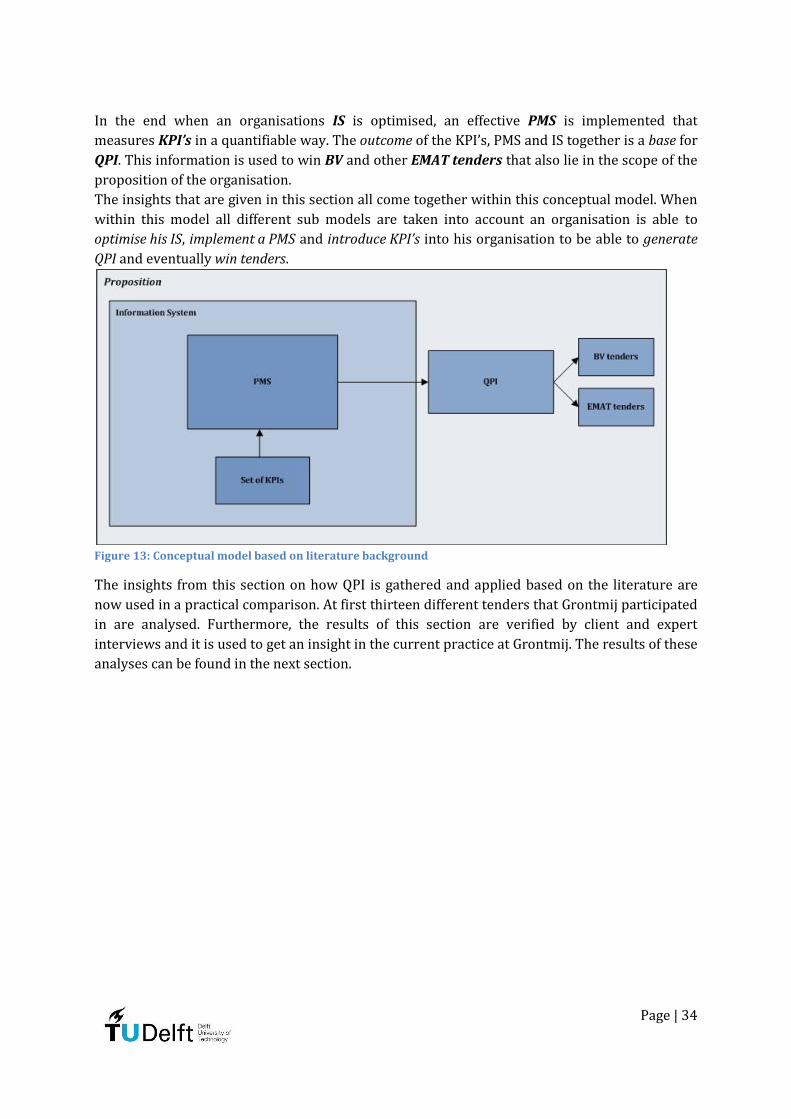
Page | 34
In the end when an organisations IS is optimised, an effective PMS is implemented that
measures KPI’s in a quantifiable way. The outcome of the KPI’s, PMS and IS together is a base for
QPI. This information is used to win BV and other EMAT tenders that also lie in the scope of the
proposition of the organisation.
The insights that are given in this section all come together within this conceptual model. When
within this model all different sub models are taken into account an organisation is able to
optimise his IS, implement a PMS and introduce KPI’s into his organisation to be able to generate
QPI and eventually win tenders.
Figure 13: Conceptual model based on literature background
The insights from this section on how QPI is gathered and applied based on the literature are
now used in a practical comparison. At first thirteen different tenders that Grontmij participated
in are analysed. Furthermore, the results of this section are verified by client and expert
interviews and it is used to get an insight in the current practice at Grontmij. The results of these
analyses can be found in the next section.

Page | 35
Section III: Practical Comparison

Page | 36
8 Introduction
In the exploration of the problem, BVP and the literature study a lot of information comes
forward. This information forms the base of this research as is explained in the research
methodology that is shown in the methodology pyramid in figure 6.
Now the base of the research is finished a next step is taken, which is called the ‘Practical
Comparison’. As shown in the research methodology pyramid this next step consists of three
separate sub steps.
Together these three sub steps will give an insight in the current practice of Grontmij, in BV
tenders in general, and in what is needed and important, for example, in the opinion of clients to
be able to win BV tenders.
9 Case study analysis
To be able to get a good insight in BV tenders and to be able to answer the main research
question 13 BV tenders are analysed in a case study analysis. The results of this analysis are
explored in this chapter.
9.1 Introduction
In the introduction of this research an insight is given in the BV philosophy and method. Here
the insight is gained that the client objectives are the key element of BV request for tenders.
These objectives give the offers of the vendors direction. All qualitative documents need to be
linked to these objectives, otherwise these documents cannot be scored and are not taken into
account. This indicates that the client objectives are crucial for the tenders. Therefore, the
different types of client objectives are analysed. In paragraph 9.3 the results of this analysis are
shown. (Rydell et al., 2013)
In the introduction it also comes forward that the way of scoring qualitative documents also
happens in line with the BV approach. Only dominant scores or a neutral score are given. Based
on this knowledge it is interesting to see how the scores of Grontmij are on this scale of
dominance. In this way there is seen what their actual performances are in these 13 tenders.
And it will indicate if improving the qualitative documents is really necessary or if certain
documents are already scoring well. Therefore, the results of the analysis of the scores and
which documents need to be improved is shown in paragraph 9.4. (Van de Rijt, & Santema,
2013)
In the literature study there is shown that having a proper IS and being able to use dominant
information is necessary to be able to apply good QPI. In the conceptual model there is shown
what is necessary for good QPI. Now this is looked at in practice.
9.2 Cases
As mentioned above in this chapter the results of the case study analysis that is performed are
discussed. For a good insight in the BV tenders in general and in the offers of Grontmij in specific
13 BV tenders that Grontmij participated in are analysed. The complete analysis of all 13 case
studies can be found in Appendix A.

Page | 37
The 13 cases that are analysed are stated in table 2.
Table 2: Overview of analysed case studies
9.3 Objectives
A large part of the analysis of the case studies focuses on the different objectives that are set by
the clients. These objectives are set to give direction to the vendor within the request for tender
and are, therefore, crucial in BV tenders. Because of this importance the clients put a lot of effort
and thought into the objectives of their request for tenders. (Rydell et al., 2013)
In BV request for tenders the vendors are supposed to link all their qualitative documents (risk-
and value added files) to the client objectives. Thus, if it is known which objectives are common
or generally important for clients a vendor can take this into account in its QPI. This can give
direction to the PMS on what performances should be measured to deliver proper QPI and, thus,
good qualitative documents. Therefore, a closer look is taken at these different client objectives.
Objective categories
In the next part of the objectives analysis a closer look is taken at the different client objectives.
In a lot of the cases a distinction is made between the overall objectives of a client and the
objectives that are specifically focussed on the works that needs to be performed for the specific
tender. These different objectives are called respectively the general objectives and the works
objectives. The general objectives mainly come forward when the assignment for this particular
tender is only a small part of a larger project or when a client has some main ambitions.
This paragraph focuses on these two kinds of objectives. All objectives are analysed and divided
into a specific objective category, which gives insight into the most common objective categories.
An example of a request for tender with the two different kinds of objectives that are divided
into categories is shown in figure 14.
Figure 14: Example of objective categories in request for tenders
In the analysis 19 objective categories are observed in 13 request for tenders. These categories
are explained in table 3.
Table 3: Explanation different objective categories
Objective category Explanation
1. Works planning Achieving the planning for the specific works of the tender.
2. Realisation Contributing to achieving the planning for the entire realisation of

Page | 38
planning the project.
3. Works budget Delivering the works within the upper set limit price, or as low as
possible.
4. Realisation budget Contributing to staying within the budget of the entire realisation
of the project.
5. Quality Delivering a solution with a high standard of quality.
6. Project Specific These objectives are very specifically oriented at the
projects/works that are requested.
7. Unburdening Unburdening the client as much as possible by efficiently
involving the client or by taking responsibility and having a pro-
active attitude.
8. Safety The safety of a solution needs to be guaranteed.
9. Image Contributing to or not damaging the clients image.
10. Sustainability Offering a sustainable solution.
11. Comply with law The solution should comply with the Dutch law.
12. Support There should be strived for as much support as possible for the
offered solution.
13. Collaboration The use of knowledge and cooperation needs to be maximised.
14. Client satisfaction The client needs to be satisfied as much as possible.
15. No appeal The offered solution should be set-up in such a way that there is
as little appeal as possible against it.
16. Additional work Include as much extra functionalities as possible in the solution.
17. Nature The solution that is offered should make a contribution to nature.
18. Flexibility There must be a lot of flexibility and freedom in the design of the
solution.
19. Hindrance Reducing the hindrance of the environment as much as possible.
What is striking in table 3 is that there is made a difference between two kinds of planning and
budget, because there is a division visible within the categories of planning and budget.
At first there are two objective categories stated for planning and budget, which focuses on the
entire realisation planning and budget of the project. Because the focus of these two objective
categories is on the entire project, the performance of the vendor in respect to this objective
needs to be so clever that the planning and budget are positively affected for the entire project.
When this is shown a good impression is made by the vendor. These objective categories are
called the realisation budget and realisation planning.
The other kind of planning and budget objectives focuses on achieving only the works of the
specific request for tender within time and budget. The works planning objective often focuses
on achieving certain milestones within the specific works. The works budget objective, however,
is somewhat different. The objectives in this category often state that the offer of the vendor for
the tender should be below the set upper limit price or as far below this amount as possible. This
seems to be a strange objective within the BV approach, because this objective category seems to
ask vendors to give the lowest price. Which is not in line with the BV approach. Another thing
that is striking and contradicting in this objective category is that staying within the upper limit
price is actually a requirement, because when a vendor offers his works at a higher price than

Page | 39
the upper limit price he is immediately excluded from the tender. Therefore, this objective
category seems to be quite strange and contradicting compared to the other objective categories.
This seems to be no category where a vendor needs to start measuring his performances. He just
has to make sure that he stays below the requirement of the upper limit price.
Overall view on the objectives
In the analysis of the objectives at first the two different kinds of objectives (general and works)
are analysed separately. These separate analyses are shown in Appendix B. What is remarkable
about the works objectives is that in the planning category more than 82% of the objectives fall
within the works planning objective category, while the rest of the planning related objectives
are realisation planning related objectives. In the budget related objectives, however, it shows
that the objectives are divided evenly over the realisation budget and the works budget
category. Furthermore, there are no clear outstanding differences visible in the two kinds of
objectives. Therefore, in this paragraph there is focused on the two kinds of objectives
combined, this is called the overall view on the objectives.
According to the findings about BVP in the introduction section the qualitative documents that
need to be delivered by the client, almost always, need to be linked to both the general
objectives of a client and the works related objectives. Therefore, this analysis of the overall
objectives is important.
During the analysis every objective has been granted a certain objective category. In figure 15 an
overview is given on the distribution of the different objective categories in all objectives. All
101 objectives are divided into the earlier mentioned 19 detected objective categories.
The three categories that really stand out from this graph are: the planning, budget and project
specific objectives. 24,75% of the objectives are project specific, 21,8% of the objectives are
planning related, 14,9% are budget related and 7,9% of all objectives are quality related and also
unburdening and safety related objectives occur in 5% of the objectives.
This analysis indicates that almost a quarter of the objectives is focused very specifically on the
specific project or works that are requested in a tender. These objectives focus on performances
that are hard for vendors to measure, because they specifically focus on one project. However,
when a project falls within a very specific expertise of a vendor this can work in a vendors
favour. Because then, maybe, a vendor is able to gather and apply performance information on
this specific objective.
However, in most of the tenders it is good to know for vendors that this many objectives are
focused on the specific project or works. But most of the time no real action for, for example,
performance measurement is undertaken by the vendor based on this knowledge.
From the six objective categories that occur most frequently, both the planning and budget
related performance information consist of hard data, as appeared in paragraph 6.2. These two
categories are based on facts, which should make them fairly simple to measure according to the
insights about KPI’s and performance measurement in the ‘Theoretical Background’. Certainly
compared to the soft data objectives that are related to quality, safety and unburdening. These
objectives are soft, because they rely on the view of a certain client and, therefore, cannot be
measured as factual data. (Neely, 1999)
With this insight in the objectives in the request for tenders compared to the information that
came forward in chapter 6 about KPI’s it would be wise for engineering companies to develop
KPI’s for at least the two hard data objective categories: planning and budget. When the

Page | 40
performances of vendors on these two aspects are measured already 36,7% of the objectives are
covered and proven with QPI. Together with quality, the planning and budget related objectives
form the Iron Triangle as is mentioned in paragraph 6.4. However, according to Van Loenhout
(2013) the quality related objectives do not need to be measured, because in the clients perceive
the quality criterion as neutral when it comes to proving project success. Starting by measuring
the planning and budget related objectives is, therefore, sufficient.
Figure 15: Overview of all objective categories
This analysis also indicates that if there is a standard project evaluation available that is always
conducted with KPI’s of achieving the clients budget and planning objectives already a lot of
effective information for QPI is gathered for future request for tenders.
9.4 Scores
The clients of the different tenders reviewed and scored the 13 tenders that Grontmij
participated in. In this paragraph the scores of the qualitative documents that were delivered by
Grontmij are analysed, because according to the literature on BVP the scale and way of scoring
BV tender is very different from the scoring of other tenders.
Scoring scale
As is also stated in the introduction section in the BV approach a special scale is used to be able
to score the qualitative documents and interviews of the vendors. The 12 analysed cases are
mostly scored on this specific scale, which is shown in figure 16. However, there must be noted
that some projects also awarded scores in between the numbers on this scale. This is not
favourable, because this does not make the scoring procedure transparent. For a clear
procurement procedure it is important that this scale is used in its original form to be able to
find the best vendor in a clear, dominant and convincing way. (Van de Rijt, & Santema, 2013)
0
5
10
15
20
25
30
Realisation budget
Works budget
Realisation planning
Works planning

Page | 41
Figure 16: Assessment scale of the BV approach (Based on (Van de Rijt, & Santema, 2013))
The scale runs from the numbers 2, 4, 6, and 8 up to 10. The scale is constructed based on
dominance. Therefore, scoring a 6 on this scale represents scoring a neutral score. To be able to
get a score higher or lower than a 6, a vendor must show that he can perform dominantly better
or worse than just doing what is asked. Because the scale is based on dominance a vendor is only
able to achieve a higher score when he can make explicitly clear that he can perform and bring
something of extra value to the project. When this is not dominantly clear and the offer needs to
be interpreted or a discussion is necessary to decide on a grade the score becomes neutral. To be
able to score lower than a neutral score a vendor must make it dominantly clear that his offer
does not contribute to the client objectives for the project or even harms the objectives. (Van de
Rijt, & Santema, 2013)
In this paragraph the results of 12 tenders that clients reviewed are analysed. The analysis of
every separate qualitative document and the interviews on their scores can be found in
Appendix C. In this paragraph the focus lies on the overall scores, the quality versus price ratio
and the ranking of the different tenders.
Overall scores
After the analysis of all the scores on the qualitative documents and the interviews in Appendix
C, now these scores are analysed together. In figure 17 all scores of the documents and
interviews are combined. All scores above 6 are divided into the category dominantly good and
all scores below 6 are divided into the category dominantly bad. All scores of a 6 are seen as
neutral.
All three types of scores occur almost the same amount of times. This indicates that Grontmij is
able to really score dominantly good and make their expertise clear, but is also able to make a
negative or neutral impression with their expertise.
To be able to win BV tenders only dominantly good scores are necessary. The other two types of
scores are not good enough to be able to win tenders in a dominant way. A vendor must,
therefore, be able to proof their expertise with QPI. Therefore, still about two third of the scores
and, thus, the offers need to be improved. This can, partially, be achieved by applying QPI in the
qualitative documents and interviews. But this indicates that there is still a long way to go before
all scores are on the desired level of dominantly good.

Page | 42
Figure 17: Overview of all scores
Quality versus price ratio
Another part of the scores that is interesting to take into account is the quality versus price ratio
that the client uses while calculating the fictive tender prices of all vendors. Therefore, a closer
look is taken at the different quality versus price ratios of the cases in Appendix A.
The average quality versus price ratio is: 79,4%. This means that the upper limit price is taken
into account at a 100% and that (on average) 79,4% of this amount is diminished by offering
quality. Scoring well on the qualitative documents and interviews is very important. Only by
achieving perfect dominant scores (of a 10) the entire quality percentage is subtracted. Winning
by just offering a low price is no longer possible, because of this high percentage that is given to
quality aspects.
The quality versus price ratio is built up from the different values that are awarded to the
qualitative documents and interviews. In the request for tender all qualitative documents are
awarded with a percentage of the upper limit price that is set on forehand.
This means that if a document is awarded with a percentage of 20% of the upper limit price and
a vendor scores the maximum score (10) on this document, the vendors subscription price is
diminished with 20% of the upper limit price that was set on forehand. When all percentages of
the different qualitative documents and interviews add up to 100% of the entire upper limit
price this is distracted from the subscription price. Which can lead to a negative fictive price,
because the subscription price is often lower than the upper limit price.
The weight percentages also show how important a client finds every qualitative document and
interview. Therefore, an analysis is performed on these percentages. The results of this analysis
are shown in figure 18. The interviews are, in general, most important according to the clients.
On average the interviews are taken into account for 35% of the upper limit price, when a
maximum score is achieved. Often this percentage is divided over two or even three interviews.
Then every individual interview is scored half or a third of this percentage.
But to be able to even participate in the interviews first sufficient scores have to be gained on the
qualitative documents. The risk file of the client and the value added files are taken into account
for respectively 18% and 16%. This indicates that these two documents are seen by the client as
0
2
4
6
8
10
12
14
16
18
Dominantly good Neutral Dominantly bad
Nu
mb
er
of
oc
cu
ra
nc
e
35,3% 33,3%
31,4%

Page | 43
half as important as the interviews, but together they are seen as evenly important. Good scores
on these two documents are, therefore, essential for a good ranking and for participating in the
interviews.
The last document that often occurred in the cases is the risk file of the vendor risks, this risk file
is on average seen by the client as the least important document. The average percentage that is
subtracted from the upper limit price when scoring a maximum score is 8%. This is half of the
percentage of the value added file and the risk file of the client. And only a quarter of the
percentage that is awarded to the interviews. This indicates that this is the least important
document, which is in line with the notion that this document is not often requested anymore,
because in the BV approach an expert should be perfectly able to control their own risks and
these risks, therefore, should not be taken into account in the tender. (Van de Rijt, & Santema,
2013)
Figure 18: Percentages of the upper limit price awarded for maximum scores
9.7 QPI
From the literature study, paragraph 4.1, it comes forward that incorporating QPI in the risk and
value added file is crucial for winning tenders. Different degrees become visible in the use of QPI.
From this general analysis it comes forward that there are five degrees of QPI. A representation
of these degrees is shown in figure 20.
Interviews 35%
Risk file client 18%
Risk file vendor
8%
Value added file
16%
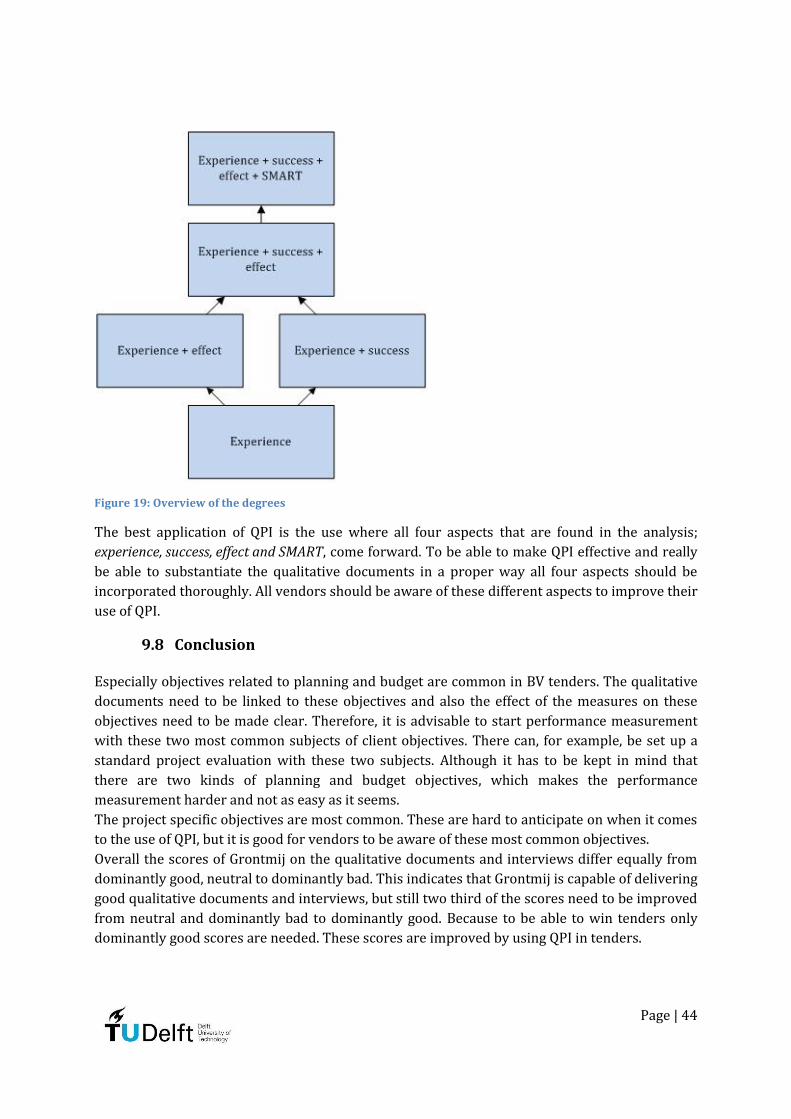
Page | 44
Figure 19: Overview of the degrees
The best application of QPI is the use where all four aspects that are found in the analysis;
experience, success, effect and SMART, come forward. To be able to make QPI effective and really
be able to substantiate the qualitative documents in a proper way all four aspects should be
incorporated thoroughly. All vendors should be aware of these different aspects to improve their
use of QPI.
9.8 Conclusion
Especially objectives related to planning and budget are common in BV tenders. The qualitative
documents need to be linked to these objectives and also the effect of the measures on these
objectives need to be made clear. Therefore, it is advisable to start performance measurement
with these two most common subjects of client objectives. There can, for example, be set up a
standard project evaluation with these two subjects. Although it has to be kept in mind that
there are two kinds of planning and budget objectives, which makes the performance
measurement harder and not as easy as it seems.
The project specific objectives are most common. These are hard to anticipate on when it comes
to the use of QPI, but it is good for vendors to be aware of these most common objectives.
Overall the scores of Grontmij on the qualitative documents and interviews differ equally from
dominantly good, neutral to dominantly bad. This indicates that Grontmij is capable of delivering
good qualitative documents and interviews, but still two third of the scores need to be improved
from neutral and dominantly bad to dominantly good. Because to be able to win tenders only
dominantly good scores are needed. These scores are improved by using QPI in tenders.

Page | 45
It also seems that the interviews are taken into account the most in BV tenders. The scores on
the interviews count for 35% of the quality scores. However, in order to participate in the
interview the scores on the qualitative documents need to be sufficient.
Furthermore, the value added file and the client risk file are taken into account for respectively
16% and 18% of the upper limit price. Therefore, these two documents are together equally
important (34%) as the interviews. Without proper scores there cannot be participated in the
interviews. Thus, a lot of effort has to be put into these documents.
There are four aspects that are important for the set-up of QPI. These four aspects are:
experience, success, effect and SMART formulation.
The most effective use of QPI is reached when all four aspects are combined. This means that at
first the experience to related projects is mentioned, after that there is mentioned that this
experience was successful, then there is stated what the effect of this measure is on the
objectives of this specific project. And finally it is needed that all of this information is
formulated in a SMART way.
10 Current practice
11 Client and expert view
To be able to verify the findings that are gathered by performing the literature study, exploring
the 13 different case studies and keeping interviews with employees of Grontmij, interviews
with different clients are held.
This verification is important, because in the literature study an ideal picture is shown on how
QPI should be gained an applied and in the case study analysis there is shown how the practice
of BV tenders at Grontmij is at this time.
These findings are either theoretically based or practically based on the vendor’s experience.
However, in practice the clients are the parties that review the tenders, decide if the qualitative
documents are sufficient and decide if QPI is used in an effective way or not. Therefore, it is
important that the clients recognise these findings and to know what their view on these aspects
is. Because when in literature and vendor practice QPI is seen in a certain way, but in practice
clients review it in a very different way the view of QPI needs to be adapted to be able to win
tenders in practice. Therefore, the interviews with the clients are a necessary step of
verification.
Also an interview with an expert of BVP is held to gain more insight in the results from the
literature study and to give insights from a clear BV point of view.
To be able to get a good and diverse insight in the visions of clients of BV tenders in QPI and the
related analysed subjects three cases of three different clients are selected from the 13 cases
that are analysed in the case study analysis. From each of these three different clients two or
three employees are interviewed. Most of the time these persons are the tender manager and
someone that participated in the review committee of the tender. This entire chapter is based on
the overall views of all interviewees, because of confidentiality no direct links to sources are
made in this chapter.

Page | 46
11.1 QPI
At first the view that the clients have on QPI is important for vendors. In the opinion of the client
QPI is crucial for vendors to be able to deliver a good offer for a BV tender. In their view QPI is
hard information that is made as objective as possible. The information has to bring forward a
performance that is related to the specific project of the tender. Furthermore, the information has
to be verifiable, because in the pre-award phase the promised performances with the QPI are
verified by the client. If a statement that is made in QPI then seems to be incorrect the award is
withdrawn. It also has to be simple and transparent. Furthermore, all clients state that it is
crucial that QPI is dominant.
Dominant information
In the view of the different clients dominant means that the QPI is so clear that there is no
discussion possible about the meaning of the information and no interpretation of the
information is necessary. What is stated is all that is needed and it says all. This corresponds
with the criterion of dominance in the literature study that dominant information is irrefutable.
According to the client this is the most important criterion which makes information dominant.
Furthermore, what makes information dominant is that it is measurable in numbers, which are
verifiable. Numbers are seen by the clients as hard data or facts, this makes information very
clear and, therefore, dominant. That the numbers and information need to be verifiable in order
to be dominant is also an important aspect according to the clients, because this possibility of
verification gives meaning and certainty about the information that is given. These two criteria
also come forward as important in chapter 4 of the literature study.
The criteria that come forward in the literature study on dominant performance information
that are part of the SMART abbreviation are not all seen as equally important by the different
clients. For example, the clients state that dominant information has to be specific, measurable
and realistic. But, in their opinion, dominant information does not necessarily has to be
ambitious or time-bound. This is the case, because a performance can also be very generic and
still be effective, not every project is unique or very complex and in need of ambitious solutions.
So, when it is a quite standard project the QPI does not have to be ambitious to be dominant.
However, often ambitious is even mentioned in the selection criteria as important and this
indicates that clients do review the qualitative documents on being ambitious. One client states
that indeed they used the selection criterion of showing ambition in the past, but they
recognised that this is no good criterion to review a project on, therefore, this aspect is not taken
into account in their new BV tenders.
The clients also state that performance information does not always have to be time-bound to be
dominant, because it depends on the objective to which the QPI is related if the time aspect is an
important aspect of the QPI. Therefore, QPI only needs to be time-bound when this is relevant
for the client objectives, but it is no criterion to make QPI dominant. With this knowledge the
abbreviation of SMART changes to SMaRt, where the aspects: SMR are seen as the most
important. When stating QPI vendors should take these three aspects into account.
Other criteria that came forward in the literature study as important, such as: showing a high
performance and translating the information to the specific tender, are also seen by the clients as
important. According to the clients and expert QPI is not solely based on past performances. It is
not only a way for vendors on showing earlier experiences, but it also needs to focus on what the

Page | 47
approach that is suggested will bring for this specific project. The effect of the measures on the
objectives of the client is most important.
Set-up of QPI
From the case study analysis it comes forward that QPI ideally needs to consist of four different
aspects. These aspects are: experience, effect, success and SMART formulation. These aspects are
verified in the client interviews and also their own view on the set-up of QPI is asked. In this part
the set-up of QPI in the view of the clients and expert is stated.
However, to be able to apply QPI first two other aspects need to be stated according to the
clients and the expert. The first step to be able to deliver a proper qualitative document is the
stating of a risk or value added option. This risk or value added option needs to be linked to the
project and needs to be relevant for the client.
After this risk or value added option is stated a claim is made by the vendor. In this claim an
approach is stated. This approach helps to mitigate the risk or helps to add extra value to the
clients objectives, this is still no aspect of QPI but a necessary condition that needs to be stated
to be able to apply QPI.
After this claim is made the claim needs to be substantiated with QPI. According to the case
study analysis QPI, ideally, consists of four different aspects. These aspects are now verified by
the clients and an expert. They all state that the aspect of the experience that a vendor has with
this approach in comparable projects needs to be mentioned. This is the first aspect of QPI that
they mention, which comes across with the aspect from the case study analysis. However, the
clients all state that just showing experience cannot stand alone in QPI. The experience is what
makes the information performance information, but the experience in itself says nothing. It is,
thus, seen by them as the base of QPI, which needs to be complemented with other aspects.
After the experience is stated it is important, according to the clients and expert, that there is
shown what this experience brings for this specific project, because the experience will only
have value for a client when it has a positive effect on the client objectives. The link and effect on
the objectives in the specific project is most crucial for QPI in the opinion of the clients, because
with this aspect of QPI the earlier experiences of a vendor are translated to the specific project of
the tender. With this aspect of the information a vendor can really show their contribution to the
specific project.
Not all clients are of opinion that the vendors need to show that the experience they had was
successful. That the experience was successful is something that the clients feel they can
automatically assume, because if the experience was not successful a vendor would not use the
performance information. However, in contradiction to this they also state that stating success is
crucial not to only make a client assume that it was successful, but to make it dominantly clear
that the experience indeed was successful and will bring success in this specific project.
Therefore, it is seen as important that the success is made explicitly clear. However, what makes
showing success difficult is that it is not generally clear what success is. Therefore, vendors need
to state that the experience was successful, why this will help the new project to also be
successful and explain what they see as success. From this it also comes forward that showing
the effect on the objectives and showing success go hand in hand and strengthen each other.
Showing the effect combined with success is, in the clients opinion, what makes the QPI
dominant.
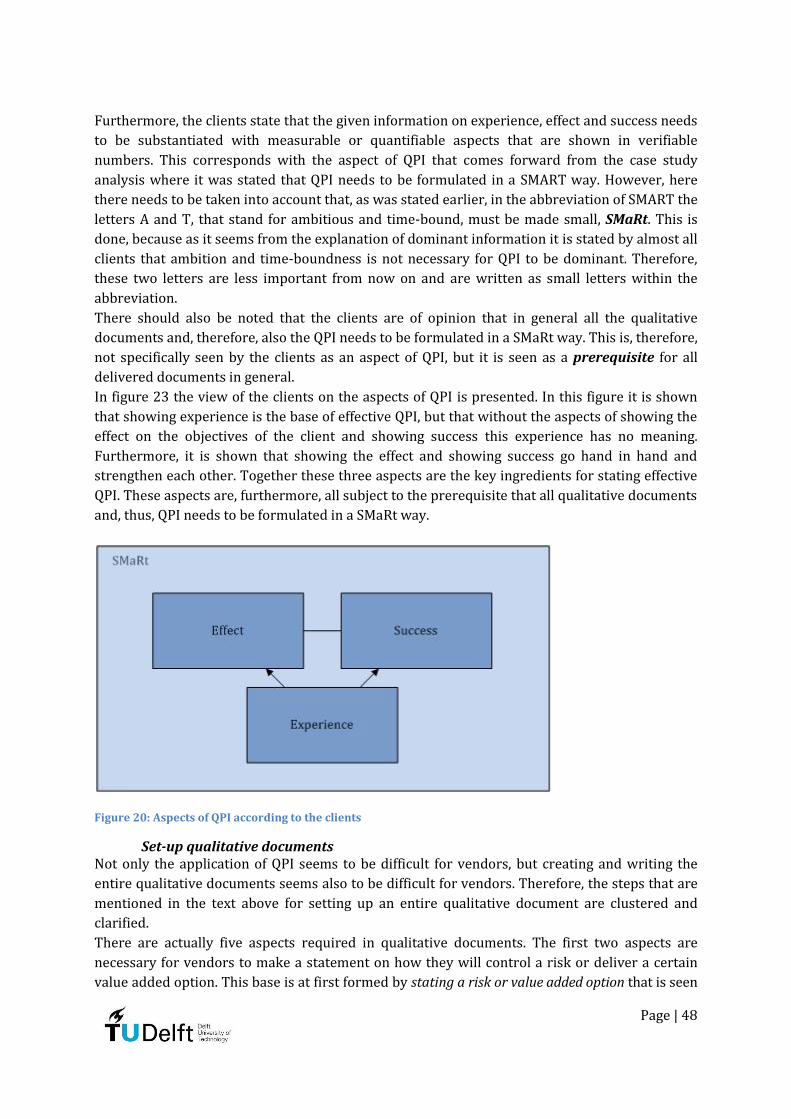
Page | 48
Furthermore, the clients state that the given information on experience, effect and success needs
to be substantiated with measurable or quantifiable aspects that are shown in verifiable
numbers. This corresponds with the aspect of QPI that comes forward from the case study
analysis where it was stated that QPI needs to be formulated in a SMART way. However, here
there needs to be taken into account that, as was stated earlier, in the abbreviation of SMART the
letters A and T, that stand for ambitious and time-bound, must be made small, SMaRt. This is
done, because as it seems from the explanation of dominant information it is stated by almost all
clients that ambition and time-boundness is not necessary for QPI to be dominant. Therefore,
these two letters are less important from now on and are written as small letters within the
abbreviation.
There should also be noted that the clients are of opinion that in general all the qualitative
documents and, therefore, also the QPI needs to be formulated in a SMaRt way. This is, therefore,
not specifically seen by the clients as an aspect of QPI, but it is seen as a prerequisite for all
delivered documents in general.
In figure 23 the view of the clients on the aspects of QPI is presented. In this figure it is shown
that showing experience is the base of effective QPI, but that without the aspects of showing the
effect on the objectives of the client and showing success this experience has no meaning.
Furthermore, it is shown that showing the effect and showing success go hand in hand and
strengthen each other. Together these three aspects are the key ingredients for stating effective
QPI. These aspects are, furthermore, all subject to the prerequisite that all qualitative documents
and, thus, QPI needs to be formulated in a SMaRt way.
Figure 20: Aspects of QPI according to the clients
Set-up qualitative documents Not only the application of QPI seems to be difficult for vendors, but creating and writing the
entire qualitative documents seems also to be difficult for vendors. Therefore, the steps that are
mentioned in the text above for setting up an entire qualitative document are clustered and
clarified.
There are actually five aspects required in qualitative documents. The first two aspects are
necessary for vendors to make a statement on how they will control a risk or deliver a certain
value added option. This base is at first formed by stating a risk or value added option that is seen

Page | 49
as important and that is linked to the clients objectives. The second step or aspect of the base of
the document is formulating the claim which mitigates the risk or enhance the value added
option. This step is seen as the claim that is made by the vendor.
After these two aspects are made clear this base needs to be substantiated by the three aspects
of QPI, which are: showing the experience, substantiated by the effect and the success of the claim.
These are the steps that every tender team of a vendor that is working on an offer in a BV tender
should keep in mind when writing a risk or value added file. An overview of these steps is shown
in figure 24.
Figure 21: Steps of information in qualitative documents
QPI at this time The clients notice that delivering good qualitative documents with effective use of QPI is,
currently, still difficult for vendors. This is not remarkable, because the introduction of BVP in
the Netherlands went very fast. More and more clients are using BVP, because of this trend in
procuring the vendors need to move along and make sure they are capable of producing
effective QPI and good qualitative documents in general. Most of the vendors still need to make
changes to be able to apply QPI. These changes mostly need to be made at several organisational
levels, which takes some time. However, the clients do indicate that they can definitely see an
improvement in the way vendors substantiate their qualitative documents and in the level of QPI
that is used.
This visible change also means that vendors are beginning to understand the urgency to not
begin with performance measurement and gathering QPI when a tender becomes available on
the market. But to start measuring performances and stating a proposition before a tender is
requested. In this way the vendors are able to apply QPI in tenders, without having to start from
zero and being very creative to put together qualitative documents with some substantiation
when a request for tender comes along.
11.2 Objectives
As mentioned before the client objectives that are stated in request for tenders are crucial to be
able to award projects with the BV approach. According to the clients these objectives are the
base of the tender, because the vendors must base their offer on these objectives. All the
information that is delivered by the vendors that is not linked to the client objectives is not even
taken into account by the client. The objectives, therefore, have the power to give direction to
the vendors when making their offer and play a crucial role in BV tenders. Because of this
importance a lot of time and effort is put into choosing and formulating the objectives by the
client. The objectives need to be really clear and, therefore, also in the objectives a SMaRt
formulation is desirable.
The most important lesson that is learned from the clients perspective on the client objectives is
that the objectives of the clients differ per project. For each project they formulate new

Page | 50
objectives, which are project specific. This also is shown in the results from the case study
analysis, where it is shown that almost a quarter of the client objectives are very project specific.
Overall the objectives make or break the project and are most important, therefore, in general
not one objective is more important than another.
Furthermore, an interesting insight is given by the clients into the overall view of the clients on
the objectives. Clients believe that the objectives need to be strongly related to the specific
project of the tender. Therefore, the works objectives are seen as more important than the
general objectives. This needs to be taken into account by vendors in prioritising their risk and
value added options and the QPI in their offers.
Planning and budget
From the case study analysis there comes forward that planning and budget are the most
common client objectives that occur in BV tenders. The clients all state that budget and planning
are always important, in every project. But if those two aspects are also the most important
objectives is not that obvious for them. They all state that staying within the planning and
budget are more conditions in projects that all vendors need to take into account, than that they
are the most important objectives. However, they also think that for vendors these two hard
data aspects that are always represented in every project are a good start for setting up
performance measurement within an organisation.
The difference between the two different kinds of planning and budget objectives that is made in
the case study analysis are recognised by the clients. Especially the realisation planning and
budget are seen as important objectives, because in these objectives a vendor needs to show that
they can do their own works in such a clever way that it diminishes the costs or time that is
needed for the rest of the project. This shows insight in the entire project and shows expertise.
The works planning and budget objectives are seen by the clients as something that is necessary
in every project, but are seen as less important.
However, an important remark should be made on the works budget objective. As is stated in
the case study analysis this objective seems to be a strange objective, because often this
objective is stated in such a way that it is focussed on the aspect that the vendors prices need to
be beneath the upper limit price or as much below that level as possible. This seems to be an odd
objective, because staying below the upper limit price is a hard requirement for participating in
the tender. Therefore, I stated that this objective is not relevant. However, the expert states that
this objective is mostly used not to keep the prices below the upper limit price, but to be able to
score value added options that only have an effect on the costs of a project. Because value added
options can only be scored when they contribute to a client objective, adding this type of a
budget objective ensures a client of being able to benefit from value added options that saves
them money. This means that the works budget objective is a valid client objective and does not
only focus on the already hard requirement. But still gathering QPI for the objective should not
be a main priority, because that is not what this objective is used for.
Safety Safety is a frequently recurring objective. However, from the interviews there is gained a new
insight that some clients feel that safety is more important for them than for other clients.
However, almost all clients and the expert agree that safety should not be an objective, because
safety should always be guaranteed. All clients believe that there must not be made any

Page | 51
commercial assessment on safety aspects. Therefore, there is concluded that safety aspects are
seen as very important by clients, but are mostly seen as a hard requirement. Thus, safety
objectives are not seen as very effective by the clients and expert.
Unburdening
Another common objective in request for tenders are objectives related to the unburdening of
the client. According to the clients this objective is no good objective. Although they all used this
objective in the past they now recognise the problems that can occur when using this objective
and almost all state that it should not be used any more. This objective is interpreted in so many
different ways by both the client and vendor that it is no good objective to give direction in a
tender. It only leads to misunderstandings.,
The different views that occur are that the client often sees unburdening as a promise for a high
transparency in the cooperation with the vendor. They want to be aware of where the vendor is
going, where they will end and want to be given some certainty about the outcome by the
vendor. This shows that a client expects from being unburdened that there is an open
communication and that they expect to be kept up to date with the process of the vendor.
However, the vendors feel that to unburden the client they should take (some) work out of the
hands of the client and give them a free ride through the project. In this way they can do their
work and at the end they can deliver it to the client. In this view the client is specifically not kept
up to date, but only has to sign for the result.
These two completely different views on the same objective causes friction. This shows that it is,
also for the objectives, important to be stated in a dominantly clear and SMaRt way. No
interpretation by the vendor should be necessary, because this can lead to differences in vision
on the objectives, which affects the works that are delivered. This indicates that unburdening is
no good client objective.
Another aspect that also shows that unburdening is not seen as a good client objective is the fact
that the clients wish to be unburdened is seen as contradictory to the BV philosophy. In BVP
there is a small scope that is shaped by the objectives in which the vendors should do their offer.
However, by stating unburdening as an objective this invites the vendor to pull as much tasks
and responsibilities to themselves as possible, which widens this narrow scope.
Quality
Quality is, especially in BV tenders, important. However, the quality objective in request for
tenders is not seen as very clear by the clients. The general client perspective on the quality
objective is that quality most of the time comes forward in other objectives that, in the clients
perspective, determine the quality of the project. Most of the time these objectives that relate
indirectly to the quality are the project specific related objectives. An objective specifically
related to quality is not very common according to the clients and they do not use it very often.
In the relatively short time that BVP is being used changes are already being made. Clients have
already learned from some of their mistakes and are fine tuning their objectives in request for
tenders. It is interesting to see that from the five most common client objectives already three
are not seen by the clients as relevant or effective objectives any more. For vendors it is good to
be aware of these new insights that clients have about their objectives, to keep anticipating on
these objectives and to keep evolving.

Page | 52
11.3 Performance measurement
According to the clients performance measurement to gather performance information is solely
a task of the vendors themselves. They need to decide what is important performance
information that they can successfully use in BV tenders and start measuring that information.
The clients should not directly be involved in this process.
However, the clients do have an opinion on how performances can best be measured. For,
example, they think that there are already some simple ways visible on how vendors can
measure their performances or use other information as QPI.
Some clients are measuring performances themselves. One client, for example, measures the
vendors performances on being pro-active in the execution of projects. This is done by awarding
a grade to the vendors for their pro-active attitude. This grade is also known by the vendor. This
grade can, therefore, be used by the vendor as performance information in next tenders.
Especially in tenders from this specific client this grade has a certain value.
Clients also give grades in general to vendors and in executing the projects clients also keep
track of other aspects in the cooperation with the vendor. Therefore, a good start is to assess
which clients measure what performances and put this performance information in a database.
In that way when a new request for tender comes along there is viewed which of this
information is useful in this specific tender.
Another way for vendors to start measuring their performances on, for example, planning is in
the opinion of a few clients and the expert using the results of the Weekly Risk Report (WRR).
This report is a part of the BV method. In this report the risks that occur in the project during the
execution or are foreseen by the vendor are reported every week by the vendor to the client. In
this report there is also stated who is responsible for the risk and what the effect of the risk is
on, for example, the planning. This report is approved every week by the client. (Rydell et al.,
2013)
Actually in this report every event that delayed the planning is stated and there is also stated
who’s responsibility this was. This information could be processed into performance
information, because with this information there can be shown that a vendor stayed within
planning when a vendor can prove with the report that all delays were either not avoidable or he
can show that the delays were the responsibility of the client. In this way performance
information is gathered on planning, which can also be easily verified, because the client has
approved the information.
In the WRR also other KPI’s can be stated which are tracked during the execution of the project.
In that way the WRR is, according to the clients and expert, a good tool to gather performance
information that is also verified by the client, because the clients grades the aspects in the WRR
on a weekly base.
In the clients opinion to be able to gather more performance information in a shorter amount of
time it is advisable for vendors to start introducing WRR also in projects that are won in
traditional tenders. The WRR is both a good manner for clients and vendors to be transparent
and manage a project in a good way, therefore, this WRR is useful in traditional tenders as well.
Which enables a vendor to measure performances with a WRR also in other projects than BV
projects.
The clients all state that there must be kept in mind by the vendors that, although performance
measurement seems to be very difficult to set up, everything can be measured. You just have to
Page | 53
be creative. The metrics and KPI’s have to be formulated in a very precise way, which allows all
kinds of performances to be measured. What has to be kept in mind here is that the performance
information that is gathered must be linked to the client objectives. But measurements can differ
from just keeping track on things, such as keeping track of the amount of additional work that is
needed in a project, but it can also be based on an opinion or grade that needs to be given by the
client or a third party, such as measuring client satisfaction or the satisfaction of the
environment.
11.4 EMAT
Within the main research question of this research there is stated that the possession and
application of QPI by vendors cannot only improve the results on winning BV tenders, but might
also improve the offers that are delivered by the vendors in all kinds of tenders. Therefore, the
opinion on the use of QPI in all kinds of tenders is verified by the clients.
The clients and the expert agree that when a vendor possesses QPI this can be used in all kinds
of EMAT tenders. In their opinion this dominant information cannot hurt the offer in other
EMAT tenders. But if it will be scored and taken into account depends on the selection and
reviewing criteria that are used.
When such dominant performance information is used in, for example, an action plan, this will at
least give a more positive impression of the expertise of the vendor, which will not diminish the
score. And because of the dominance of the information it will help to improve the SMaRtness of
the documents.
Furthermore, the clients state that when a vendor possesses QPI this means that he knows what
his strengths and skills are. This knowledge is crucial for a vendor to be able to perform at a high
level. Therefore, possessing this QPI is also positive for the performances of vendors and, thus,
just having this information is already beneficial for all kinds of tenders.
11.5 WRR in execution
For the BV approach and effective procurement of these tenders it is important that not only
during the procurement phase, but also during the execution of the project the BV approach is
used. This means that, according to the literature, in the execution phase there should be a
minimum of management and control by the client. One of the tools that should be used during
the execution phase is, as earlier mentioned, the WRR. Although this is part of the BV approach it
seems that in many tenders the BV approach is only seen as a procurement method. This is
partially caused by the misleading name of BVP, but in practice it is more than just a
procurement method.
The clients that are interviewed state that they all acknowledge that BVP is more than just a
procurement method and that it is an approach for the entire project. They also state that in the
projects that they represent from the analysed case studies the WRR is used or will be used
during execution. One client, however, mentions that it still is a difficult and unfamiliar way of
working during the execution phase. During the project that is being executed they at first
started with using the WRR, this went well and shaped an environment of open communication
and transparency. However, when there were a few bumps in the road that damaged the
cooperation for a moment immediately the use of the WRR’s was stopped by the client and both
the vendor and client fell back in their traditional roles. Which meant managing and controlling

Page | 54
the process of the vendor by the client. After a while both the vendor and client came to the
conclusion that they had fallen back in old behaviour which did not seem to help the project,
therefore, the relationship was recovered and the WRR and BV approach are embraced again.
This example shows that clients (and vendors as well) really have the intention to embrace the
entire BV approach, but that when the process becomes difficult or some problems arise it is in
the nature of the client and vendor to get back to their old ways. Therefore, the use of the BV
approach still is a learning process for both parties. But when a vendor and client realise this
and are aware of this instinctive behaviour that is occurring, that is the first step forward
towards embracing the BV approach. Being aware of your pitfalls is step one to making sure that
it does not happen again.
11.7 Conclusion
According to the clients and expert QPI is hard, objective, verifiable, simple, transparent
information that is related to a specific project. It also has to be dominant.
Performance information is seen as dominant by clients if it is:
Irrefutable (no discussion or interpretation possible)
Measurable
Verifiable
Specific
Realistic
Show a high performance
Translated to a specific tender
Simple
The set-up of QPI and the aspects of QPI that result from the case study analysis are recognised
by the clients and the expert. They are of opinion that the aspect experience is the base of QPI. In
itself this experience means nothing, but by adding the aspects of ‘success’ and ‘effect’ good QPI
is gained. Especially the effect of the previous experience and the proposed measure on the
objectives of this specific project is crucial for good QPI. SMaRt formulation of QPI is seen by the
expert and clients as a prerequisite for all qualitative documents and the offer in general. This is
not specifically seen as an aspect of QPI.
When a qualitative document is set up by vendors the following steps need to be taken:
1. State the risk or value added option
2. Make your claim (what will the measure to control the risk or execute the value added
option)
3. State your project specific experience
4. Substantiate this experience with the success and effect on the client objectives
The clients state that they put a lot of time and effort in the objectives of every BV tender,
because in BV tenders these objectives provide the entire direction of the request for tender. The
link to the specific project in these objectives is very important, therefore, often the works
objectives are seen as more important than the general client objectives.
The clients do recognise that planning and budget, both the works and realisation related
objectives are common and important objectives. However, they do feel that these aspects are
important in every project and, therefore, should always be taken into account. Because of this
Page | 55
importance and the frequent occurrence as client objectives the clients agree that starting
performance measurement based on planning and budget is a good start of gathering QPI.
The safety objective is seen by the clients as a prerequisite. There should not be made
commercial considerations on safety is the general view of the clients. The unburdening
objective, is in the clients view no good objective. Although all clients used this objective in the
past, they all state they will not do this again. Because of the different perceptions that exist on
this objective it is not able to give good direction to the tender.
The quality objective is also not seen as very common or important, because the quality aspects
often return in many different objectives that together decide the quality of a project.
According to the clients and expert performance measurement is solely a task of the vendor
itself. They need to decide their capabilities and decide what message they want to get across.
The client should not primarily be involved in this process. However, clients also measure
performances and often these performances are vendor performances. This information is often
public and therefore vendors should gather and use this information as QPI.
Easy ways to start performance measurements are according to several clients and the expert,
the WRR and the client survey. When these two tools are extended and adjusted to be able to
measure performances and get a verification by the client on these performances, this is a good
base for QPI and a solid beginning of the PMS. Furthermore, they state that everything can be
measured, vendors just have to be creative.
All clients and the expert state that having QPI is also beneficial for offers that are made in other
kinds of EMAT tenders. They believe that having such dominant information on your own
expertise and knowing what you are capable of certainly helps to make offers in other tenders
better. So, improving the application QPI has multiple benefits for vendors.
12 Conclusion
According to the literature study the base for improving QPI and, thus, improving the offers for
BV tenders is an organisations proposition. This proposition has to be stated at a relatively low
level in an organisation to be able to make a specific proposition. The proposition should be
stated in the format of the Business Canvas that is based on an organisations own strengths and
capabilities in combination with the market demands.
Based on this proposition choices for participating in specific tenders are made. This diminishes
the amount of tenders that there is participated in, but improves the winning rate. Also because
the proposition gives direction to the PMS, KPI’s and thus QPI.
Within the request for tenders the client objectives are most important for clients to give
direction to the tenders. There are two types of objectives works objectives and general
objectives. The works objectives are often more important to the clients.
A start of a PMS is made by starting to measure the performances of two of the most common
overall client objectives. These objectives are planning and budget related objectives. These
objectives can both be separated into two types: realisation and works related objectives.
Furthermore, performance measurement is seen as solely a task for the vendors themselves.
They have to start measuring performances based on their proposition. This is harder than it
seems, but there has to be kept in mind that everything can be measured as long as you are
creative.

Page | 56
Simple measures that can be used to measure performances by making small alterations are the
WRR and the client survey. When these two tools are adapted in such a way that performance
information is gathered this can simply be used in every project, which enables fast gathering of
performance information. What also has to be kept in mind is that clients also measure
performances. This information can also be used by vendors as performance information.
QPI is seen as hard, objective, verifiable, simple, transparent information that is related to a
specific project. It also has to be dominant.
Performance information is seen as dominant by clients if it is:
Irrefutable (no discussion or interpretation possible)
Measurable
Verifiable
Specific
Realistic
Show a high performance
Translated to a specific tender
Simple
With these characteristics of dominant performance information there is shown that within the
aspects of the SMART abbreviation only the S, M and R aspects are seen as important. Showing
ambition and time-boundness are not seen as important by the clients to make QPI dominant.
Therefore, from now on the abbreviation of SMART is stated as SMaRt, because these two
aspects are seen as not important.
When QPI is gathered and applied it is interesting to know that good QPI consists of three
different aspects. The base of QPI is ‘experience’, which is substantiated by a combination of the
‘effect’ and the ‘success’. These three aspects all need to be incorporated to apply good QPI and
all need to be stated in a SMaRt way. This SMaRt formulation is seen as a requirement for not
only QPI, but the entire offer.
Good QPI can also be used in other EMAT tenders. This makes these tenders also more
dominant, which will at least not diminish the quality of the offer.
When a qualitative document is set up by vendors the following steps need to be taken:
1. State the risk or value added option
2. Make your claim (what will the measure to control the risk or execute the value added
option)
3. State your project specific experience (base of QPI)
4. Substantiate this experience with the success and effect on the client objectives
(substantiation of QPI)
If these steps are taken into account the set-up of the qualitative documents is good in the view
of the clients.

Page | 57
Section IV: Design
Page | 58
13 Introduction
In this chapter the outcome of this research is presented. In this section the information from
the introduction and the results from the literature background and the practical comparison
are combined to be able to answer the main research question, which is:
How can engineering companies improve the application of Quantifiable Performance Information in tenders?
14 Roadmap
To be able to make the results from this research usable for engineering companies all results
are combined in such a way that it is clear for engineering companies how they can start to
improve their application of QPI. Therefore, a roadmap is made to show engineering companies
which steps they need to take and which challenges they need to overcome to be able to improve
their application of QPI.
The four steps that need to be set on different organisational levels to improve the application of
QPI and especially the gathering of QPI are, in the end, combined in an overall roadmap. This
roadmap gives an insight in how the different steps are linked to each other.
The separate steps of the roadmap are explored in the different paragraphs. At the end of each
paragraph a visualisation of the findings within a sub model is presented. In these sub models
also the other steps of the overall roadmap are shown to give insight on the position of each sub
step within the overall roadmap.
Because the different steps of the roadmap need to be taken on different organisational levels,
from a strategic and tactical to an operational level, these changes take a while. They cannot
happen overnight, because processes throughout the entire organisation must be changed.
However, engineering companies are participating in BV tenders at this time as well. Therefore,
it is also good for organisations to know what, besides these big steps indicated in the roadmap,
can be done at this time, to make improvements now. In this way the application of QPI can,
immediately, be improved.
These short term improvements are called ‘quick wins’, which are achieved on a shorter notice
than the big steps in the roadmap that need to be taken. When these are achieved the use of QPI
is improved immediately. In every step of the roadmap quick wins are indicated.
However, there must be kept in mind that to make proper changes and improve the level of QPI
to the desired level the entire steps in the roadmap need to be taken on different organisational
levels to really make a change.
14.1 1. Proposition
The first step that is taken to be able to improve the application of QPI in tenders comes forward
from the literature background and the practical comparison. This first step is the formulation
of a proposition.
This is an important step and is the base of the changes that need to be made at a strategic
organisational level to be able to improve the gathering and application of QPI.

Page | 59
In the conceptual model it comes forward that the proposition of an organisation is the
environment in which all performance measurement and the entire process of gaining QPI takes
place. This indicates that a proposition is crucial for gaining QPI.
Furthermore, from the steps of BVS that are mentioned in the introduction of this research it
already appeared that having an understanding of your qualities in the form of a proposition is
the first phase of BVS. And, therefore, the base of every tender from the vendors point of view.
(Rydell et al., 2013)
However, nowadays it seems that engineering companies do not have clear propositions and
only start thinking about their expertise and how they can show their expertise when they have
a specific request for tender where they can participate in. This missing step in BVS is made
visible in figure 25.
Figure 22: Overview missing step BVS (Bases on (Rydell et al., 2013))
For an organisation to be able to show their expertise and what they are capable of it is
necessary that they are aware of their expertise and qualities. When there is no insight in the
strengths of an organisation they are not able to show their expertise in a dominant way to
clients. This indicates that knowing the strengths and qualities of an organisation is the base for
using QPI and, thus, for being able to dominantly show expertise. Therefore, engineering
companies must fill in the gap in the BVS phase model to be able to win tenders by using QPI.
(Rydell et al., 2013)
As comes forward in chapter 10 a proposition is stated by using the Business Canvas, which is
shown in figure 20. A proposition is based on both the internal and the external environment of
an organisation. The base and most important aspect of the proposition is the internal
environment. This internal environment exists of the vendors own strengths, capabilities and
qualities. When these are known the external environment is analysed. The external environment
is based on the markets position and demand. The internal environment is, therefore, compared
to the markets position to see if the qualities of an organisation are relevant for the market. After
these two environments are known the proposition is stated. (Rydell et al., 2013)(Neely et al.,
1995)
A second requirement to set up a proposition is that it is necessary that the proposition is stated
on a strategic organisational level. This is important, because it needs to be supported on
management level, so it can become completely integrated within the organisations working
procedures and is able to put the organisation into the same mindset. It is, therefore, important
that an entire organisation acts on the proposition in a consistent way. This shapes a clear and
consistent environment in which it is clear what is important and what is not. (Bourne et al.,
2000)(Bourne et al., 2003)(Neely et al., 1995)
A proposition helps to make information more understandable and simple, because of the clear
focus of the proposition. One could see a proposition as the context in which data becomes
information. It becomes logical and understandable for everyone. Although a proposition needs
to be consistent it must also be noted that a proposition evolves over time. This is caused by all

Page | 60
the decisions that are being made and by the changing market demands. Therefore, continually
the proposition has to be aligned with the changing internal and external environments. (Bourne
et al., 2000)(Bourne et al., 2003)
The proposition is leading for two aspects. In first instance a proposition decides the focus of an
organisation and, therefore, decides in which tenders a vendor should participate. This focus can,
for example, lie on certain projects where an organisation knows they can excel in. When this is
clear, for every tender there is decided if it fits within the proposition. If it does, there is
participated in this tender. If it does not fall within the proposition, there should not be
participated in this tender. When an organisation only participates in tenders where they can
excel in the winning rate rises. (Rydell et al., 2013)
Another aspect that is lead by the proposition is that it decides which aspects of an organisation’s
performances need to be measured. When a vendor only wants to participate in tenders that fit
within its proposition it is important to have performance information based on this
proposition. In that way performance information specifically focused on these tenders is used
in their offers. Therefore, the proposition is the base for developing KPI’s. This is the next step in
the roadmap for gaining QPI. (Rydell et al., 2013) (Bourne et al., 2000)(Bourne et al., 2003)
An overview of the proposition and its important aspects is presented in figure 26.
Figure 23: Roadmap step 1, Proposition
14.2 2. KPI’s
As mentioned in the previous phase the next step on the roadmap to QPI is stating KPI’s that are
based on the proposition. According to the literature study a set of KPI’s is necessary for QPI,
because only by measuring performances linked to the proposition an organisation is able to

Page | 61
gather QPI and apply this QPI to make their expertise dominantly clear. (Aedes, 2013)(Nicis
Institute, 2010)
Therefore, the KPI’s need to be set up at a tactical organisational level and need to be based on
the proposition. The KPI’s need to be selected and formulated in a very careful way, because the
entire set of KPI’s has to give a good representation of the performances on the entire
proposition.
It is good for an organisation to be aware that the KPI’s must be able to show information in a
dominant, verifiable and transparent way and that it must enable the measurement of
performances. Therefore, the set of KPI’s needs to comply with several characteristics that came
forward in the literature study and conceptual model. For example, there must be taken into
account that the data collection of a certain KPI is simple and that the set of KPI’s is consistent
with the proposition. (Chan & Chan, 2004)
Furthermore, for the set of KPI’s there must be kept in mind that there is a mix needed of both
qualitative and quantitative KPI’s, as comes forward in the literature study. This indicates that
some KPI’s are based on hard data, which are facts. And that other KPI’s are based on softer data,
such as opinions. This mix provides the most effective set of KPI’s that represents the entire
proposition in an effective way. (Cox et al., 2003) (Neely, 1999) (Nicis institute, 2010)
As stated in the literature study the KPI’s itself should ideally consist of three characteristics. A
KPI should be measurable. Quantitative KPI’s are often seen as easier to measure than
qualitative KPI’s. However, when an organisation is creative with stating its KPI’s both kinds of
KPI’s can be made measurable. Another characteristic is that KPI’s should be relevant. This
means that every KPI needs to be in line with an organisations proposition and must contribute
to the insight on the performances of the proposition. The final characteristic is accountable. For
every performance that is measured by a KPI someone should be accountable. This is important,
because when a performance falls short someone can take responsibility and improve the
performance. Otherwise there is a risk that no action is undertaken based on the performance
information. (Nicis Institute, 2010)
Another important remark about KPI’s is that the set of KPI’s is dynamic, because it is based on
the proposition that changes and evolves over time. Therefore, also the set of KPI’s evolves and
changes over time. However, this must always happen in line with the proposition. (Chan & Chan,
2004)
An overview of what is needed and is important for a set of KPI’s in this step of the roadmap is
shown in figure 27.

Page | 62
Figure 24: Roadmap step 2, KPI’s
14.3 3. PMS
After a set of KPI’s is stated the next step in the roadmap can be taken. This step consists of
setting up a PMS, this needs to happen on a tactical organisational level. This system enables an
organisation to quantify the efficiency and effectiveness of actions undertaken by an
organisation. The performances of an organisation linked to the proposition are actually
measured within this PMS with the use of the already stated set of KPI’s. To be able to measure
these performances and, thus, the KPI’s, performance measures are stated. (Bourne et al., 2003)
The information that is used and is the output of the PMS needs to be balanced. This is necessary
to be able to make the information understandable and make persons accountable for the
outcomes. When there is an overflow of information in a non-structured way coming from the
PMS a large part of the information is lost and the purpose of the measurements is also lost.
Therefore, it is extremely important that also the PMS is in line with the proposition. Because the
KPI’s are all formulated based on the proposition this will almost automatically be the case if
these KPI’s and the proposition are used in a consistent way within the PMS. Within the PMS
there needs to be a continuous process of monitoring, measuring, reporting and evaluating of the
performances. This all needs to be done in a consistent way, so the outcome is understandable
and linked to the proposition. (Aedes, 2013)(Neely, 1999)
Both traditional and current measures need to be used. This means that not only financial and
internally focussed performances are measured, but also non-financial and externally focused
aspects are used. Especially these externally focused aspects are important for QPI, because the

Page | 63
QPI is based on performance information that is important for the clients of an organisation, an
external party. (Bourne et al., 2003)(Neely, 1999)
As comes forward in paragraph 6.3 a reference framework is needed for every PMS to be able to
judge the outcome of the PMS. This reference framework consists of standards for every
measure and KPI. In this way there is seen if the objectives of an organisation on their
performances are met. (Aedes, 2013)
The factual information that comes forward from the performance measures are the base for
QPI. Therefore, the next step in the roadmap is developing QPI with this performance
information. In figure 28 the step in the roadmap of the PMS is shown.
Figure 25: Roadmap step 3, PMS
14.4 4. QPI
When the foundation for developing QPI is finished by having successfully completed the
previous steps the next and final step in developing QPI is taken, namely stating the QPI. This
application of QPI takes place on an operational organisational level.
The performance information that comes forward from the PMS is the base for this QPI. To be
able to form QPI it is necessary that the performance information from the PMS is saved in a
clear and transparent way, so for new tenders it can easily be gathered and used. For QPI it is
important that the factual information about performances is shown in a dominant way. In this
way there has to be no discussion about the substantiation of a certain measure and it is
immediately clear if the expected performance is good. QPI gives insight in the value of an offer.
QPI is, therefore, necessary for vendors to distinguish themselves on quality instead of price, and
thus, to show their expertise. (Van de Rijt, & Santema, 2013)
Page | 64
For QPI to be dominant it has to comply with a few characteristics. One of the most important
characteristics is that the information needs to be irrefutable to be dominant. This means that
there must be no discussion or interpretation possible about the content of the QPI. It must be
very clear. Other important characteristics are that it should be verifiable, linked to the specific
tender and that it shows a high performance. (Van de Rijt, & Santema, 2013)
Furthermore, all qualitative documents that need to be delivered in a vendors offer need to be
substantiated with QPI. One prerequisite where all these documents need to comply to is that all
information in the qualitative documents and certainly the QPI needs to be formulated in a
SMaRt way.
After the performance information is gained as the output of the PMS it has to be transformed to
QPI. According to the findings of the case study analysis and the interviews there is concluded
that the base of QPI is the experience that a vendor has with similar projects. This experience
should be stated first as the base of the QPI. After that the effect and the success of the experience
need to be shown. With the effect there is meant what the experience in previous projects will
specifically bring for this tender and what the effect of this experience will be on the clients
objectives. Furthermore, it is important to state that the experience was a success and to show
that the effect on this project will also be beneficial for the client objectives. This must be made
explicitly clear.
An overview of what is needed to be able to apply QPI is shown in the final step of the roadmap
in figure 29.
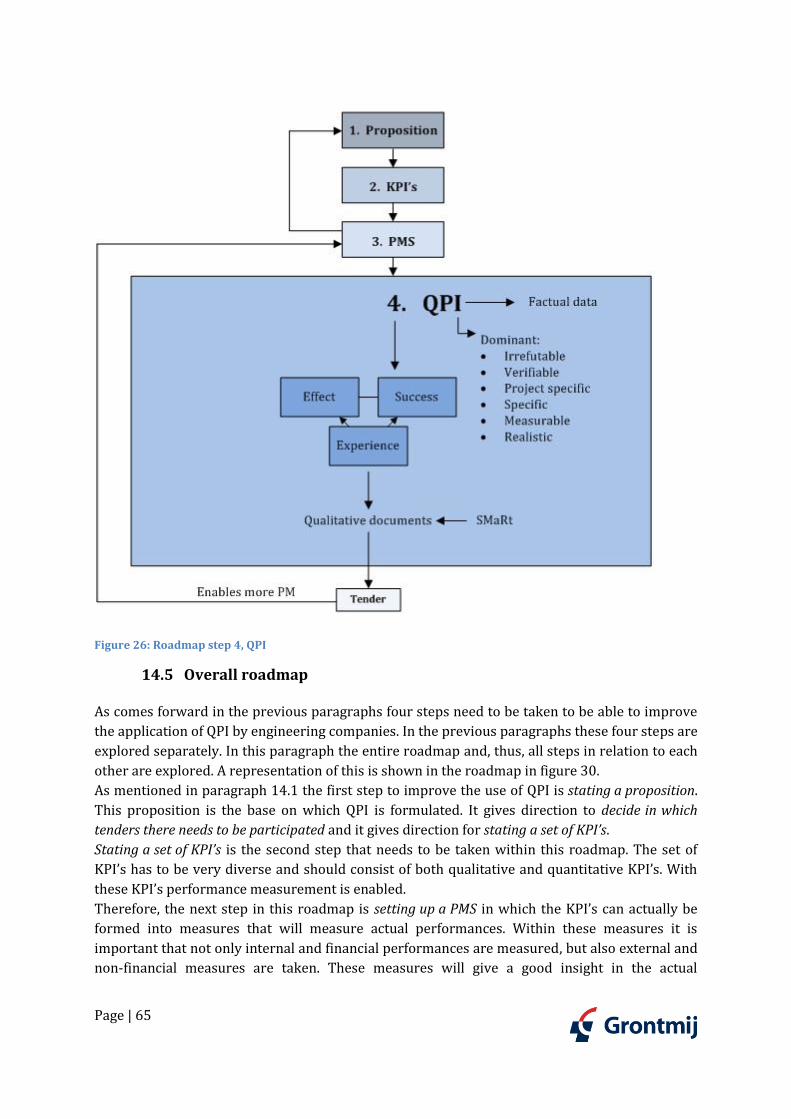
Page | 65
Figure 26: Roadmap step 4, QPI
14.5 Overall roadmap
As comes forward in the previous paragraphs four steps need to be taken to be able to improve
the application of QPI by engineering companies. In the previous paragraphs these four steps are
explored separately. In this paragraph the entire roadmap and, thus, all steps in relation to each
other are explored. A representation of this is shown in the roadmap in figure 30.
As mentioned in paragraph 14.1 the first step to improve the use of QPI is stating a proposition.
This proposition is the base on which QPI is formulated. It gives direction to decide in which
tenders there needs to be participated and it gives direction for stating a set of KPI’s.
Stating a set of KPI’s is the second step that needs to be taken within this roadmap. The set of
KPI’s has to be very diverse and should consist of both qualitative and quantitative KPI’s. With
these KPI’s performance measurement is enabled.
Therefore, the next step in this roadmap is setting up a PMS in which the KPI’s can actually be
formed into measures that will measure actual performances. Within these measures it is
important that not only internal and financial performances are measured, but also external and
non-financial measures are taken. These measures will give a good insight in the actual

Page | 66
performances of an organisation. This performance information is the base for setting up and
applying QPI.
The next, and final, step in the roadmap is actually stating the QPI. With the performance
information that comes forward from the PMS, the QPI that is used is improved. What also helps
to improve the application of QPI is the insight that QPI needs to consist of three different
aspects. The base of QPI is stating experience. This needs to be substantiated and followed by
stating the effect of the experience for this project on the client objectives and stating that this
was and, therefore, will be successful. Furthermore, it is good to keep in mind that this QPI is
formulated in a SMaRt way.
Learning loops
Within the overall roadmap there are several loops incorporated that are focussed on giving
feedback between the different steps. These loops are seen as learning loops, because with the
insights that are given throughout the roadmap things are continuously evaluated, learned and
adjusted.
The first learning loop that is important within the roadmap is made visible within the overall
roadmap in figure 30. This loop runs from the PMS back to the proposition. As mentioned in
paragraph 5.1 the PMS helps to evaluate and adjust performances. This means that the PMS
gives a good insight in the performances of an organisation, because these performances are
measured and set against a reference framework. Therefore, the performances are evaluated
and can adjust the proposition. It is, for example, possible that from the measurements it
appears that what is seen by the organisation as a strength is not a real strength of the
organisation, because the performance measurements show no good results on the
performances of this strength. But maybe it also gives insight in some aspects that an
organisation excels in which are, until then, not seen as an expertise of the organisation. These
insights create an incentive to change the proposition. Therefore, the PMS can challenge the
proposition. It enables an organisation to give feedback to their own proposition and to adjust
and improve this proposition based on the actual performances of the organisation. It provides a
learning experience about the proposition and the actual performances of an organisation.
Within this first loop also the step of setting up a set of KPI’s is involved, because when a
proposition is adapted the KPI’s will change with the proposition, which will influence the PMS.
As already seemed in paragraph 6.3 the outcomes of the KPI’s from the PMS are seen as
incentives to make changes. In this loop these changes are made.
The second learning loop that is also directly visible within the roadmap in figure 30 becomes
visible between the stating and applying of QPI in a tender, winning a tender and the PMS. When
an organisation is able to formulate QPI this can be applied in offers for BV tenders. This is also
shown in the model. When QPI is used this makes an offer dominantly better, which leads to
higher scores and a higher winning rate of tenders.
When a tender is won and a project is executed this leads to more input for the PMS, because
these performances are also measured. The performances of these projects that are measured
lead to more performance information and, thus, more QPI. With this QPI again more tenders are
won. Therefore, it seems that improving the application of QPI will work as a catalyst for winning
more tenders, which will work as a learning experience over every tender that is participated in
with QPI and every new tender that is won. This loop, thus, keeps on improving the application
of QPI over time. It is a continuous process.

Page | 67
What, furthermore, is interesting to notice is that in paragraph 4.2 it is shown that a person gets
better in perceiving information over time. The good thing about this is that over time the clients
also get better in perceiving the QPI, therefore, the information becomes more clear to them.
Which will, over time, help to bring across an organisations expertise to clients.
The vendors themselves also seem to get better in perceiving and applying the performance
information.
When an engineering company completes all four steps and keeps on evolving these steps the
application of QPI will keep on improving over time.
Figure 27: Roadmap to improve application of QPI
1. Proposition
2. KPI’s
3. PMS
4. QPI
Tender
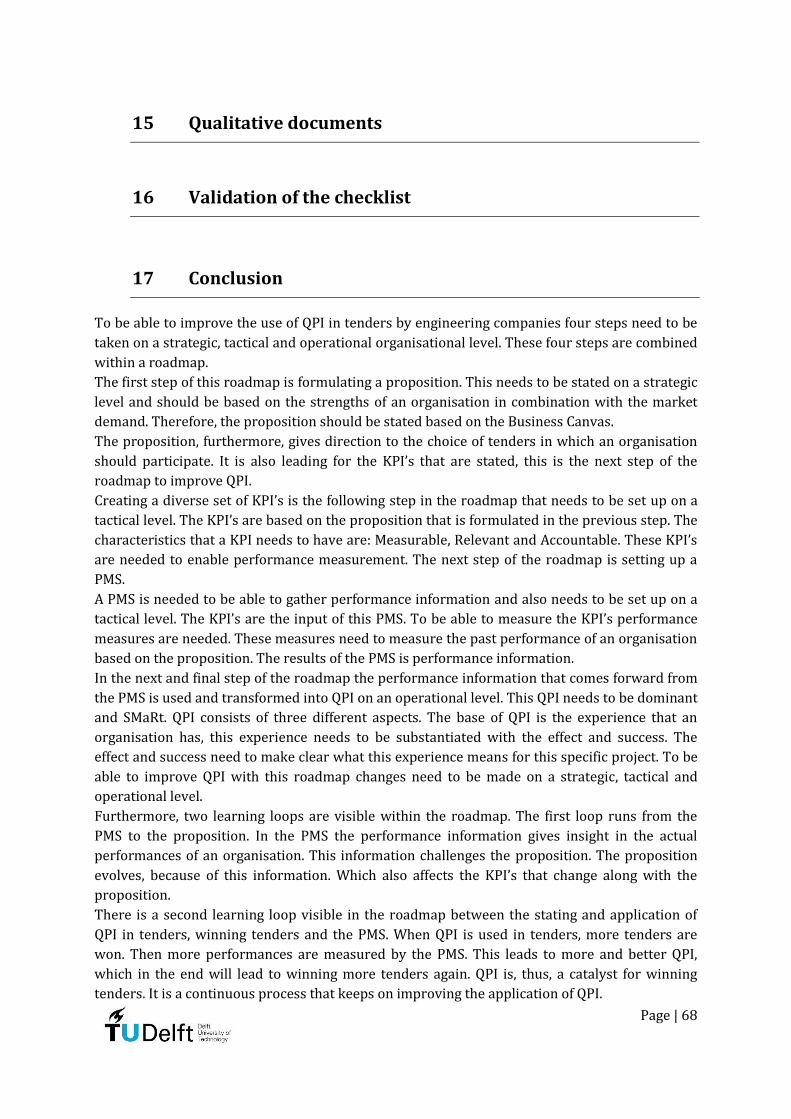
Page | 68
15 Qualitative documents
16 Validation of the checklist
17 Conclusion
To be able to improve the use of QPI in tenders by engineering companies four steps need to be
taken on a strategic, tactical and operational organisational level. These four steps are combined
within a roadmap.
The first step of this roadmap is formulating a proposition. This needs to be stated on a strategic
level and should be based on the strengths of an organisation in combination with the market
demand. Therefore, the proposition should be stated based on the Business Canvas.
The proposition, furthermore, gives direction to the choice of tenders in which an organisation
should participate. It is also leading for the KPI’s that are stated, this is the next step of the
roadmap to improve QPI.
Creating a diverse set of KPI’s is the following step in the roadmap that needs to be set up on a
tactical level. The KPI’s are based on the proposition that is formulated in the previous step. The
characteristics that a KPI needs to have are: Measurable, Relevant and Accountable. These KPI’s
are needed to enable performance measurement. The next step of the roadmap is setting up a
PMS.
A PMS is needed to be able to gather performance information and also needs to be set up on a
tactical level. The KPI’s are the input of this PMS. To be able to measure the KPI’s performance
measures are needed. These measures need to measure the past performance of an organisation
based on the proposition. The results of the PMS is performance information.
In the next and final step of the roadmap the performance information that comes forward from
the PMS is used and transformed into QPI on an operational level. This QPI needs to be dominant
and SMaRt. QPI consists of three different aspects. The base of QPI is the experience that an
organisation has, this experience needs to be substantiated with the effect and success. The
effect and success need to make clear what this experience means for this specific project. To be
able to improve QPI with this roadmap changes need to be made on a strategic, tactical and
operational level.
Furthermore, two learning loops are visible within the roadmap. The first loop runs from the
PMS to the proposition. In the PMS the performance information gives insight in the actual
performances of an organisation. This information challenges the proposition. The proposition
evolves, because of this information. Which also affects the KPI’s that change along with the
proposition.
There is a second learning loop visible in the roadmap between the stating and application of
QPI in tenders, winning tenders and the PMS. When QPI is used in tenders, more tenders are
won. Then more performances are measured by the PMS. This leads to more and better QPI,
which in the end will lead to winning more tenders again. QPI is, thus, a catalyst for winning
tenders. It is a continuous process that keeps on improving the application of QPI.

Page | 69
These changes in the roadmap will not happen overnight, time is needed to make them.
Therefore, also some quick wins for every step in the roadmap are mentioned. These quick wins
are things that engineering companies can start changing right away. In that way improving QPI
can start immediately.
Overall there is concluded that the roadmap is a good first step for engineering companies to
change their organisation on a strategic, tactical and operational level to be able to improve their
application of QPI. Furthermore, this research contributes to the overall improvement of the BV
offers by vendors by improving their qualitative documents in general.

Page | 70
Section V: Conclusions

Page | 71
18 Conclusion This research is an exploratory research on how engineering companies and vendors in general
can improve their application of QPI within tenders. The urgency for this research comes
forward from the gap that is visible in the current application of QPI by vendors and the
expected level of QPI by the clients. The main objective for this research is, therefore, to develop
a model that helps engineering companies to improve the way they measure, formulate and
apply QPI.
The main research question that is answered is:
How can engineering companies improve the application of Quantifiable Performance Information
in tenders?
Important aspects from literature study
In the research three steps are taken to be able to answer this question. At first a close look is
taken at the currently available literature about BVP and tenders in general. After that the
currently available literature is explored on aspects that are linked to QPI.
From the literature study there is concluded that there are three important subjects that are
needed to be able to gather and apply QPI. These three subjects are: an Information System (IS), a
Performance Measurement System (PMS) and a set of Key Performance Indicators (KPI’s).
Furthermore, these three linked aspects all need to be set in the environment of an organisations
proposition. A PMS is a system that consists of several performance measures, which uses a set of
KPI’s as an input. When all performances are measured in line with the proposition and its
corresponding KPI’s the outcome of the PMS is performance information. This performance
information is transformed to QPI. This QPI can then be used in new tenders that are also in line
with the organisations proposition.
A conceptual model gives an overview of the three different aspects and the environment of the
proposition in relation to improving the application of QPI.
Insights from practical comparison
After this literature background is completed a practical comparison is performed, which
verifies the findings from the literature study and gives new insights on the current practice.
Proposition
A proposition can best be stated based on an organisations strengths in combination with the
markets demand. The Business Canvas is used for stating the proposition. This proposition is
leading for the tenders that are participated in.
Performance measurement
Performance measurement is seen as solely a task for vendors. Therefore, vendors need to start
measuring performances. A good start can, for example, be made by measuring aspects of two of
the most common client objective categories: planning and budget. But there must also be kept
in mind that almost a quarter of the client objectives is focused on project specific aspects. These
are hard to measure. However, when a tender falls within an organisations specific expertise
maybe there is performance information available for these project specific objectives.

Page | 72
Qualitative documents in general
According to the clients not all 5 aspects in the SMART formulation are seen as important.
According to the clients the offer of a vendor does not necessarily need to be ambitious or time-
bound. Therefore, these letters are made small in the abbreviation and the focus will lie on the
Specific, Measurable and Realistic aspects.
When a qualitative document is set up by vendors the following steps need to be taken:
1. State the risk or value added option
2. Make your claim (what will the measure to control the risk or execute the value added
option)
3. State your project specific experience (base of QPI)
4. Substantiate this experience with the success and effect on the client objectives
(substantiation of QPI)
If these steps are taken into account the set-up of the qualitative documents is good in the view
of the clients.
QPI
QPI is seen by the clients as hard and objective information. This information is verifiable,
simple and transparent. Another important aspect of QPI is that it is linked to a specific project.
According to the clients performance information also is dominant.
Performance information is dominant when it is:
Irrefutable (no discussion or interpretation possible)
Measurable
Verifiable
Specific
Realistic
Show a high performance
Translated to a specific tender
Simple
Furthermore, QPI consists of three different aspects. The first aspect is ‘experience’. This aspect
is the base of QPI, in which vendors can show they have relevant experience in related projects.
This experience is substantiated with the following two aspects. These aspects are the ‘effect’
and ‘success’. The effect aspect consists of showing what the effect of the measure is on this
specific project. The success aspect consists of stating that the previous experience and, thus, the
proposed measure is successful. This aspect goes hand in hand with the effect, but they are
mentioned separately to make the success also dominantly clear.
QPI is formulated in a SMaRt way. This is a prerequisite for all QPI and the entire qualitative
documents.
Design
All the previous findings are needed to come to a roadmap that engineering companies can use
to improve their application of QPI and, thus, answer the main research question. Therefore, all
findings are combined. There is concluded from the findings in the previous sections that there
are four aspects visible that are needed to be able to improve the application of QPI. These four
aspects are:
1. Proposition

Page | 73
2. KPI’s
3. PMS
4. QPI
Based on these four aspects a roadmap is made that is used to make necessary changes on a
strategic, tactical and operational organisational level to be able to improve the application of
QPI.
The first step that needs to be taken is stating a proposition. This is the base on which QPI is
built. This proposition gives direction to two different aspects. First of all it gives direction to the
tenders in which an organisation participates. It helps to make actions and decisions within an
organisation consistent. Secondly, it is leading for developing a set of KPI’s. The proposition is
based on the Business Canvas, with a base that focuses on an organisations own strengths. This
is combined with the markets demand. It also has to be taken into account that a proposition
develops over time.
The second step in the roadmap to QPI is that a set of KPI’s is developed. A set of KPI’s evolves
with the proposition and consists of diverse KPI’s. There should, for example, be incorporated
both qualitative and quantitative KPI’s. Furthermore, a set of KPI’s enables performance
measurement in line with the proposition.
Therefore, the next step to improve the use of QPI is setting up a PMS. In the PMS for all KPI’s
performance measures are stated to enable performance measurement. Within these measures
it is important that not only internal and financial performances are measured, but also external
and non-financial measures are taken. The outcome of the PMS is performance information of an
organisation that is in line with the proposition. This information gives insight in an
organisations performances, which is compared to a reference framework. This insight in the
performances challenges the proposition. Therefore, a learning loop in the roadmap is visible
between the PMS and the proposition. This is a continuous learning process.
From the performance information that is the output of the PMS QPI is made. This the next, and
final, step in the roadmap. For stating QPI the three aspects of QPI are used. The base of the QPI
is ‘experience’, which is substantiated with stating the ‘effect’ and the ‘success’. Furthermore, the
QPI is formulated in a SMaRt way.
When this QPI is stated it is applied in tenders. The use of QPI improves the quality of an offer.
Therefore, more tenders are won and in the execution of these projects, again, performances are
measured. Therefore, QPI leads to winning more tenders, more performance measurement and
more QPI. This is the second learning loop that is visible within the roadmap. Within this loop
QPI keeps on improving over time.
This roadmap is, therefore, on a strategic, tactical and operational level the base for engineering
companies to improve their application of QPI.
Quick wins and the checklist
Changing an organisations way of working on a strategic, tactical and operational level will take
some time. However, from this research also several aspects come forward that fall within the
roadmap, but can make changes on a shorter term. These changes improve the application of
QPI and are a good start for engineering companies to make changes now. These changes are
called: quick wins.
Also a checklist is made for engineering companies to check their offers on several aspects that
come forward as flaws in the qualitative documents according to the clients. This checklist leads

Page | 74
not directly to an improvement of the application of QPI. But it will improve the quality of the
tenders overall, because it can be used to predict if and prevent that mistakes are made.
Especially the general and risk file related aspects are predicted and prevented by using the
checklist. Therefore, it will support the quality of the tenders in general and the application of
QPI.
Overall conclusion
With the roadmap engineering companies are able to improve their application of QPI. The
roadmap indicates a good process for improving QPI. It allows engineering companies to gain
more insight in what is needed for QPI and also gives insight on how the QPI can be applied. The
quick wins that are formulated in the roadmap also helps engineering companies to make
improvements on the gathering and application of QPI on a short term. Therefore, there is
concluded that the roadmap and the quick wins are the answer to the main research question.
Furthermore, the outcomes that are related to the qualitative documents, the general quick wins
and the checklist, maybe do not directly contribute to improving the application of QPI, but it
does support, complement and improve the offers, in which the QPI is used, in general.
Therefore, this research helps engineering companies not only to improve their application of
QPI, but also to improve their tenders in general.
Scientific relevance
The contribution of this research to science is the roadmap. There is, nowadays, no literature
available that focuses on QPI combined with the way this could be gathered and applied. This
research fills this scientific knowledge gap. It gives new insights on which processes are needed
within an organisation to be able to gather and apply QPI in an effective way.
The scientific relevance is enlarged, because not only the view of the vendor is taken into
account, but also the clients perspective is analysed.
Because of these insights the research objective is met and the research question is answered.
Practical relevance
The practical relevance of the research is large. The outcomes of the research can be applied by
engineering companies or other vendors.
The first contribution to the engineering companies is the roadmap. This roadmap gives
direction for the engineering companies to set up their proposition, KPI’s and PMS to be able to
gather QPI and apply it in tenders. When QPI is available and used in the way as described in the
roadmap the quality of the qualitative document will improve and more tenders are won. Also
because the roadmap ensures that engineering companies only subscribe in tenders within their
expertise the winning rate gets higher.
Another outcome of the research that also contributes to the practice of engineering companies
and application of QPI are the quick wins. The quick wins within the roadmap are of relevance,
because they provide fast ways for engineering companies to improve the gathering and
application of QPI. This is needed, because it will take a while before all steps in the roadmap are
taken. With these quick wins improvements of QPI can be made now.
Furthermore, the general quick wins and the checklist do not directly contribute to improving
the application of QPI. The open minded attitude that is kept within this research contributed in
gaining these extra insights. With the quick wins and the checklist not only the QPI, but the

Page | 75
entire quality of the qualitative documents is improved. This gives engineering companies
direction, guidance and support during the setting up of the qualitative documents. Which will
support and complement the improvements that are made within the gathering and application
of QPI and make the offers overall better. This will, hopefully, result in winning more tenders.
19 Recommendations After performing this research a few recommendations are made for further research. In this
research a certain amount of time is available, therefore, there are still some aspects visible that
can be made clear with further research. Here the recommendations for further research are
explored.
Firstly, I would recommend that further research is performed about the implementation of
the roadmap to improve the application of QPI. The steps in the roadmap are stated to all
together help to improve the application of QPI. But implementing this roadmap and making
changes within an organisation on a strategic, tactical and operational level is worth an
entirely new research. Therefore, further research should be performed on how these
changes can be made and the roadmap can actually be implemented.
It is interesting to see if the changes that I propose within my roadmap and the quick wins
will really lead to the improvement of QPI and, thus, better scores from the clients. Because
these changes will not happen overnight it is interesting to make a new analysis two years
from now to see if the evaluations of clients have improved and if this is also visible in the
scores and winning rate. This would be a good validation of the roadmap and the quick wins.
A step of the roadmap that can also be researched to a further extend is the PMS. From this
research and specifically the interviews with the clients and employees of Grontmij it
appeared that performance measurement is very hard for engineering companies. It seems to
be logical and simple, but developing a PMS that extracts exactly the right performance
information is really difficult. Therefore, it is advisable to do some extra research specifically
on performance measurement and how this can actually happen in an effective way to really
make sure that the performance information can be used in QPI.
Another recommendation to further research is linked to the previous recommendation.
What is also a difficulty in the road to QPI is making the performance information available
and applicable for QPI. There is a system or database necessary where all performance
information can be saved, sorted and categorised in such a way that it can easily be found and
re-used in BV tenders. When this is the case and a database is available it will become more
easy to find relevant performance information for different tenders. This will save time and
money that is spend on setting up offers for tenders. Therefore, further research should be
performed on setting up such a database.
An aspect of BV tenders that has been under exposed in this research is another qualitative
document that also needs to be delivered in BV tenders. This document is called the
performance substantiation. In this research this document is not taken into account, because
in the BV tenders that are researched no performance substantiations are requested. But in
new BV tenders this file is requested. Therefore, it is interesting to research what the
common mistakes or pitfalls within this document are, how QPI can be incorporated within
this document and what the clients perspective is on this document.

Page | 76
According to the view of the clients in this research the aspects of ambition and time-
boundness are not very important for QPI. However, in the SMART assessment tool analysis
compared to the clients opinions I did incorporate these two aspects. It is also interesting to
see in a new analysis what the outcome of the analysis of the SMART assessment tool would
be when only the SMR aspects are taken into account. According to the clients these are the
aspects where they review SMARTness on. So, one would assume that the clients scores come
across with the scores of the SMaRt tool.
My final recommendation for further research is based on all different kinds of BV tenders
that are being used. Because of the growing publicity on BVP more clients are using BVP.
However, there are a lot of clients that do not use the BVP philosophy entirely. Therefore,
there are several tenders that only use a part of the BV method or only use it as a
procurement procedure. For example, some clients only use the interviews or the risk file in
other tender procedures. These different variants of BVP do not contribute to the
transparency that the BV tenders normally offer. When a client only asks a client risk file as
an addition to the action plan the vendors do not know if this risk file is reviewed based on
the BV philosophy. Therefore, these different variants lead to less transparency and more
vagueness about the review of the tenders. Additional research to these tenders that only use
a part of the BV philosophy is necessary to make clear how vendors can cope with these
tenders.

Page | 77
20 Discussion
An interesting insight was given in an interview with a client. This insight is that the BV
philosophy can also be seen as a method that makes it more clear and predictable which vendor
will win a certain tender. This is the case, because if vendors follow the BV philosophy they only
participate in the tenders that fit within their proposition. Therefore, only real experts
participate in tenders. This eliminates a lot of vendors from participating on forehand. This
lowers the amount of vendors that subscribe in every tender. Which is a start of making the
winner of a tender more predictable.
Another insight here is that there is also a shift visible from ‘the client chooses the best vendor’
towards ‘the vendor chooses their client of choice’. Instead of always having a lot of vendors that
participate in all tenders and the clients choosing the winning vendor from that large group a
shift is visible to a situation where the vendors choose their client. In the ideal situation a vendor
only participates in tenders they can excel in, because they are in line with their proposition.
Therefore, they only participate in tenders they know they can win. This indicates that the
vendors actually choose the clients that they want to work for. This is an interesting shift,
because this changes the vision of procuring entirely.
A positive effect that comes forward from using BVP is the fact that vendors are being forced to
analyse their performances. Therefore, vendors gain new insights about their actual
performances, are forced to think about what their performances mean to a client, they
reconsider their performances and think about how they can transfer their performances to the
client. These insights and moments of reflection of an organisation on its performances will
improve their performances over time. Which will benefit the construction industry, the clients
and the vendor itself. In this view BVP as a procurement method contributes to better
performances and a better construction industry in general.
However, if nowadays the real experts are found with this procurement method I am not sure. I
think that all vendors first need to improve their proposition, PMS and QPI to really be able to
dominantly proof their expertise. I expect that in two years most vendors have gathered
performance information and can really proof their expertise. From then BV as a procurement
method can really start working.
According to the BV theory and methodology BVP seems to be a very logical way of procuring
and working. However, after performing this research I think that, although it sounds logical and
easy, for almost every vendor and client BVP is still difficult and a real challenge.
For clients it seems to be a challenge to change their normal ways of working. This starts by
setting up entirely different request for tenders. Where especially the objectives that they state
are crucial and leading for the rest of the project. Stating good and clear objectives seems to be
hard according to several clients. They have to put a lot of thought and effort into them and need
to make sure that they also consist of dominant and SMaRt information. This is needed, because
the objectives need to be very clear and no discussion or interpretation should be possible about
them. Otherwise the result of the tender will not match with the desired outcome.
However, what is the most difficult and crucial part of the BV method is the actual cooperation
during the phases that follow on the pre-award of the assignment. What is especially difficult is
letting go of the old ways of cooperation. The clients need to let go their ways of management

Page | 78
and control. To be able to do this they must be completely convinced by their choice for a
specific expert. Because when they can have faith in a good result, letting go is easier. This
indicates that procuring with BVP is not, yet, enough to ensure a client that he has found the best
party for the project. Otherwise these doubts would not exist.
An important aspect to overcome these doubts in the execution phase is that the vendor must
give transparency in its way of working to be able to assure to the client that they know what
they are doing and that the project is going in the right direction.
It all seems to revolve about cooperation. It is important that the teams of both the vendor and
the client give each other their room, while also giving insight in each other’s work. Only in that
way they are both be able to let go.
These challenges and difficulties that clients and vendors have indicate that the BV methodology
is not as easy as it seems. In the coming years the vendors need to step up their game to be able
to really become an expert in a certain area of expertise and to show that in tenders, this
research can contribute to make these improvements. The coming years will show if clients and
vendors are able to overcome these challenges.
If both clients and vendors can settle in cooperating in a completely different way, without
falling back to all kinds of controlling measures and needs to ask for additional work the BV
method will be able to prevail. Because only when a client can truly find the best expert this
ideal form of cooperation that BV promises will be possible.
But if they can overcome these challenges I believe that this will change the industry for the
better and that BVP will be used more frequently. However, if both the client and vendor are not
able to close the gap to use the BV methodology in the correct way, especially if the cooperation
with each other does not improve, I do not know if BV will still be used in the future. Then I think
it will evolve or will be replaced by another quality focused method.
For now, however, I think that BVP has set a good first step to make a change in the construction
industry away from the focus on price.

Page | 79
21 References
Aedes (2013). Sturen op resultaat: handleiding prestatiemeting. Retrieved from:
http://www.aedes.nl/binaries/downloads/opdrachtgeverschap-in-de-bouw/20130617-sturen-
op-resultaat-aedes.pdf Last visit: 10 December 2013.
Arup (2013). Nesciobrug.
http://www.arup.com/Projects/Nescio_Bridge/Nescio_Bridge_1.aspx?sc_lang=nl-NL Last visit:
22 October 2013.
Atkinson, R. (1999). Project management: cost, time and quality, two best guesses and a
phenomenon, its time to accept other success criteria.
Booij, A. (2013). Towards the Best Value vendor.
http://repository.tudelft.nl/view/ir/uuid%3A0f388691-ff19-4a09-9fd9-ec3f144f5f8b/ Last visit:
10 March 2014.
Bossink, W., & Crucq, H. (2011). Handleiding EMVI Rijkswaterstaat 2011.
http://www.rijkswaterstaat.nl/images/Handleiding%20EMVI%202011_tcm174-331409.pdf
Last visit: 21 October 2013.
Bourne, M., Mills, J., Wilcox, M., Neely, A., & Platts, K. (2000). Designing, implementing and
updating performance measurement systems. International Journal of Operations & Production
Management, Vol. 20, No. 7, pp. 754-771.
Bourne, M., Neely, A., Mills, J., & Platts, K. (2003). Implementing performance measurement
systems: a literature review. International Journal of Business Performance Management, vol. 5,
No. 1, pp. 1-24.
Cox, R.F., Issa, R.R.A., Ahrens, D. (2003). Management’s Perception of Key Performance Indicators
for Construction. Journal of Construction Engineering and Management, No. 129, pp. 142-151.
CROW (2007). Gunnen op waarde: hoe doe je dat? Praktische handreiking voor bouwopdrachten.
Ede, the Netherlands: CROW.
DETR (2000). KPI Report for The Minister for Construction. Retrieved from:
https://www.gov.uk/government/uploads/system/uploads/attachment_data/file/16323/file1
6441.pdf Last visit: 5 December 2013
Duren, J. van, & Dorée, A. (2008). An evaluation of performance information procurement system
(PIPS). University of Twente, UTpublications. http://doc.utwente.nl/61476/ Last visit: 8
October 2013.
Grontmij (2013f). Risicodossier Opdrachtgever definitief, NWO.
http://www.emeraldinsight.com/journals.htm?articleid=849266&show=abstract

Page | 80
http://www.rws.nl/zakelijk/zakendoen_met_rws/werkwijzen/gww/aanbesteden_en_contracte
ren/best_value_procurement/resultaten/_ Last visit: 10 October 2013.
Kashiwagi, D. (2002). Application of information measurement theory (IMT) to construction.
Arizona State University, Performance Based Studies Research Group.
Kashiwagi, D., & Massner, S. (2002). Solving the Construction Craftsperson Skill Shortage Problem
Through Construction Undergraduate and Graduate Education. Arizona State University,
Performance Based Studies Research Group.
Kashiwagi, D., Kashiwagi, J., & Savicky, J. (2009). Industry Structure: Misunderstood by Industry
and Researchers. Arizona State University, Performance Based Studies Research Group.
Last visit: 10 May 2014.
Lin, G., Qiping Shen, G., Sun, M., & Kelly, J. (2011). Identification of Key Performance Indicators for
measuring the performance of value management studies in construction. Journal of Construction
Engineering and Management, no. 137, pp. 698-706.
Loenhout, C. Van (2013). Public project manager’s perspective on project success.
http://repository.tudelft.nl/view/ir/uuid%3Afdcecd58-3da5-466a-b74a-7a5034460aff/ Last visit:
16 April 2014.
Minderhoud, N. (2013). Het Beste Idee 2013. Not published, internal presentation at ‘Het Beste
Idee 2013’. De Bilt, 2013.
Neely, A. (1999). The performance measurement revolution: why now and what next?
International Journal of Operations & Production Management, Vol. 19, No. 2, pp. 205-228.
Neely, A., Gregory, M., & Platts, K. (1995). Performance measurement system design: A literature
review and research agenda. International Journal of Operations & Production Management, Vol.
15, No. 4, pp. 80-116.
Nicis institute (2010). Handboek prestatiemeting: kwaliteit in kaart. Retrieved from:
http://nicis.platform31.nl/Wat_doen_wij/Verspreiding/Docbank/Bestuur/Bestuur_algemeen/H
andboek_prestatiemeting Last visit: 27 November 2013.
PBSRG (n.d). Dean Kashiwagi, Phd, PE. http://pbsrg.com/contact/staff/dean-
kashiwagi/extended/ Last visit: 21 October 2013.
Pianoo (2013). Belangrijkste wijzigingen Aanbestedingswet ten opzichte van Bao + Wira.
http://www.pianoo.nl/belangrijkste-wijzigingen-aanbestedingswet-ten-opzichte-van-bao-wira
Last visit: 21 October 2013.
Pijlman, R. (n.d.). SMART doelen stellen.
http://www.carrieretijger.nl/functioneren/management/leidinggeven/doelen-stellen/smart

Page | 81
Ridder, H.A.J. De (2011a). Dynamic control of projects. Retrieved from: Blackboard TU Delft,
course: ‘Dynamic control of projects’. Internal publication.
Ridder, H.A.J. De (2011b). LEGOlisering van de bouw. Haarlem, MGMC.
Rijkswaterstaat (n.d.a). Economisch Meest Voordelige Inschrijving (EMVI).
http://www.rijkswaterstaat.nl/zakelijk/zakendoen_met_rws/inkoopbeleid/aanbesteden/emvi/
Last visit: 10 October 2013.
Rijkswaterstaat (n.d.b). Resulaten.
Rijkswaterstaat West-Nederland Zuid (2013). Planuitwerking en voorbereidende activiteiten t.b.v.
aanleg Nieuwe Westelijke Oeververbinding (Blankenburgverbinding) GUNNINGSBESLISSING.
Zaaknummer: 31080179. Rotterdam, 2013.
Rijt, R. van de, & Santema, S. (2013). Prestatieinkoop – met Best Value naar succesvolle projecten.
Pijnacker, The Netherlands: Graphicom International.
Rydell, M., Verheul, D., & Santema, S. (2013). Prestatieverkoop – Klanten winnen met Best Value.
Pijnacker, The Netherlands: Graphicom International.
Sullivan, K.T., Kashiwagi, D., Savicky, J., Kashiwagi, M., Egbu, C., & Chang, C-K. (2006). Increasing
performance by minimizing the passing of information. In: Boyd, D (Ed) Procs 22nd Annual
ARCOM Conference, 4-6 September 2006, Birmingham, UK, Association of Researchers in
Construction Management, pp. 103-112.
Tweede Kamer der Staten Generaal (2003). Eindrapport Parlementaire Enquêtecommissie. ‘s
Gravenhage, the Netherlands: Sdu Uitgevers.
Wilde, M. De (2013). Best Value Prorail. Not published, Presentatie BVP-sessie bij
Rijkswaterstaat, Lessons learned from BVP implementation at Prorail, 2 December 2013, slide
11.
Figure on cover page:
Reprinted from [Bridge, infinity, utopia][ca. 2013] Copyright 2013 by ForWallpaper.com.
Retrieved from: http://nl.forwallpaper.com/wallpaper/bridge-infinity-utopia-206197.html Last
visit: 10 March 2014.
Quote on cover page:
Quote Vadis (n.d.). "The bitterness of poor quality remains long after the sweetness of low price is forgotten." Retrieved from: http://quotevadis.com/post/61513508904/the-bitterness-of-poor-quality-remains-long-after Last visit: 10 May 2014.

Page | 82
22 Abbreviations
Page | 83
23 List of figures
Figure 1: Distribution of all objectives in objective categories ......................................................................iv
Figure 2: Roadmap to improve the application of QPI ......................................................................................vi
Figure 3: Value, price, costs model in traditional procurement (Based on (De Ridder, 2011a) and
(CROW, 2007, intermezzo p. 12)) ............................................................................................................................... 3
Figure 4: Value, price, costs model in an EMAT tender (Based on (De Ridder, 2011a) and (CROW,
2007, intermezzo p. 12))................................................................................................................................................. 4
Figure 5: Phases of Best Value Procurement and Best Value Sales ............................................................... 5
Figure 6: Research framework (based on (Verschuren, & Doorewaard, 2010)) ................................. 10
Figure 7: Construction Industry Structure (CIS) (Kashiwagi et al., 2002) .............................................. 13
Figure 8: Rate of Change graph + KSM (Kashiwagi et al., 2002) ................................................................ 15
Figure 9: Sub model of Information System ........................................................................................................ 19
Figure 10: Visualisation of Performance Measures in a PMS (Based on (Neely et al., 1995)) ........ 23
Figure 11: Sub model of Performance Measurement System ...................................................................... 26
Figure 12: Sub model of set of KPIs ......................................................................................................................... 33
Figure 13: Conceptual model based on literature background ................................................................... 34
Figure 14: Example of objective categories in request for tenders ............................................................ 37
Figure 15: Overview of all objective categories ................................................................................................. 40
Figure 16: Assessment scale of the BV approach (Based on (Van de Rijt, & Santema, 2013)) ....... 41
Figure 17: Overview of all scores ............................................................................................................................. 42
Figure 18: Percentages of the upper limit price awarded for maximum scores .................................. 43
Figure 19: Overview of the degrees ........................................................................................................................ 44
Figure 20: Aspects of QPI according to the clients ............................................................................................ 48
Figure 21: Steps of information in qualitative documents ............................................................................ 49
Figure 22: Overview missing step BVS (Bases on (Rydell et al., 2013)) .................................................. 59
Figure 23: Roadmap step 1, Proposition ............................................................................................................... 60
Figure 24: Roadmap step 2, KPI’s ............................................................................................................................. 62
Figure 25: Roadmap step 3, PMS .............................................................................................................................. 63
Figure 26: Roadmap step 4, QPI ................................................................................................................................ 65
Figure 27: Roadmap to improve application of QPI ......................................................................................... 67

Page | 84
24 List of tables
Table 1: Examples of KPIs in the construction industry (Atkinson, 1999; Egan, 1998; BRE, 2013;
Chan et al., 2004; DETR, 2000; Cox et al., 2003) ................................................................................................ 31
Table 2: Overview of analysed case studies ......................................................................................................... 37
Table 3: Explanation different objective categories ......................................................................................... 37


