Q4 2018AD FRAUD UPDATE
AD FRAUD UPDATE | Q4 2018
ABOUT PIXALATE
Pixalate is an omni-channel fraud intelligence company that
works with brands and platforms to prevent invalid traffic and
improve ad inventory quality. We offer the only system of
coordinated solutions across display, app, video, and OTT for
better detection and elimination of ad fraud.
Pixalate is an MRC-accredited service for the detection and
filtration of sophisticated invalid traffic (SIVT) across desktop
and mobile web, mobile in-app, and OTT advertising.
www.pixalate.com
TABLE OF CONTENTS
Key takeaways………………..………………………………. 3
Latest ad fraud stats…….…………………………………. 4
Android vs. iOS…………………………………………..…... 9
In-app ad fraud………………………………………………… 17
2
TABLE OF CONTENTS

AD FRAUD UPDATE | Q4 2018 3
Q4 2018 saw a big jump in ad fraud as scammers took advantage of holiday budgets
21% average fraud rate (U.S.)
KEY TAKEAWAYSThere was a 24% increase in IVT in Q4
compared to Q3
Mobile in-app programmatic advertising had
a 23% IVT rate in Q4
Android devices had 1.7x more ad fraud
compared to iOS devices
Sites with ads.txt had 23% less IVT than
sites without ads.txt

AD FRAUDAROUND THE WORLD
AD FRAUD UPDATE | Q4 2018
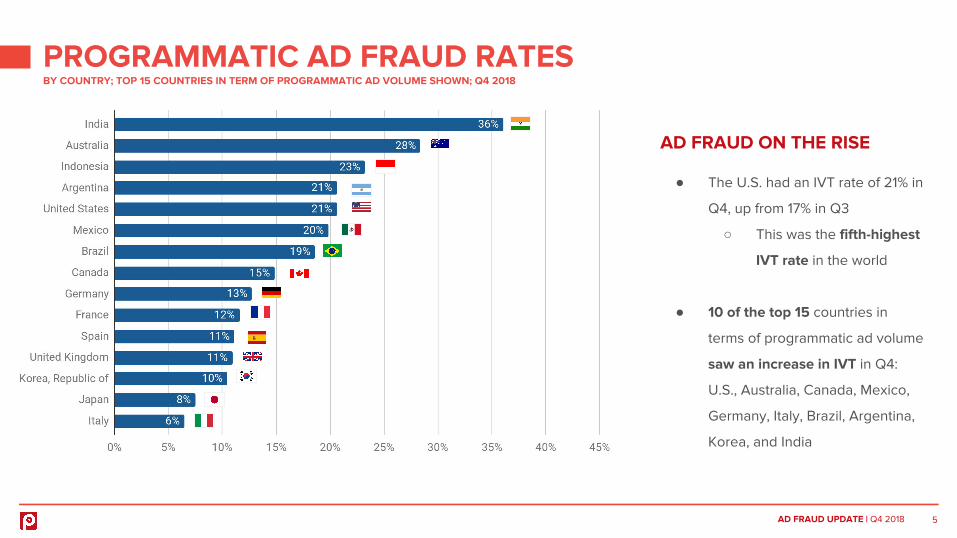
PROGRAMMATIC AD FRAUD RATESBY COUNTRY; TOP 15 COUNTRIES IN TERM OF PROGRAMMATIC AD VOLUME SHOWN; Q4 2018
5
AD FRAUD ON THE RISE
● The U.S. had an IVT rate of 21% in
Q4, up from 17% in Q3
○ This was the fifth-highest
IVT rate in the world
● 10 of the top 15 countries in
terms of programmatic ad volume
saw an increase in IVT in Q4:
U.S., Australia, Canada, Mexico,
Germany, Italy, Brazil, Argentina,
Korea, and India
AD FRAUD UPDATE | Q4 2018
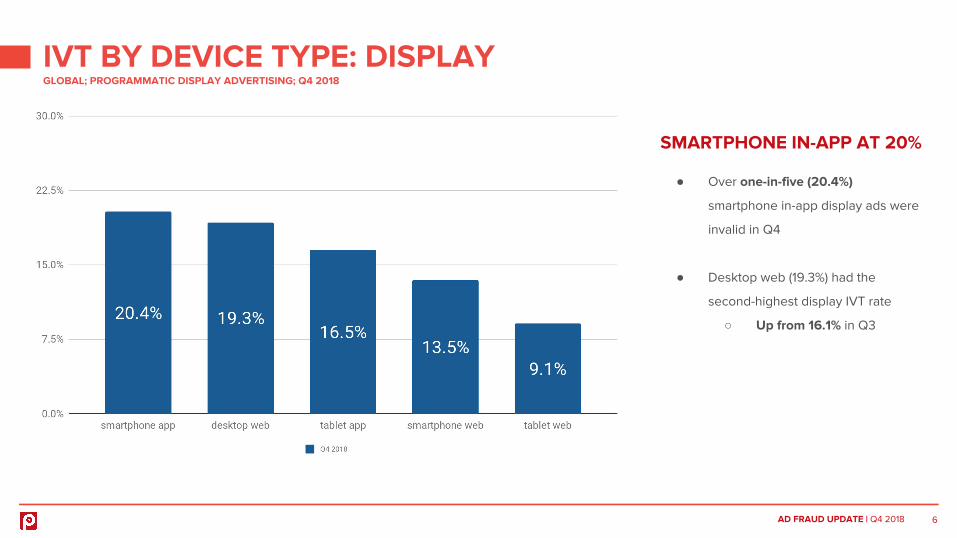
IVT BY DEVICE TYPE: DISPLAYGLOBAL; PROGRAMMATIC DISPLAY ADVERTISING; Q4 2018
6
SMARTPHONE IN-APP AT 20%
● Over one-in-five (20.4%)
smartphone in-app display ads were
invalid in Q4
● Desktop web (19.3%) had the
second-highest display IVT rate
○ Up from 16.1% in Q3
AD FRAUD UPDATE | Q4 2018
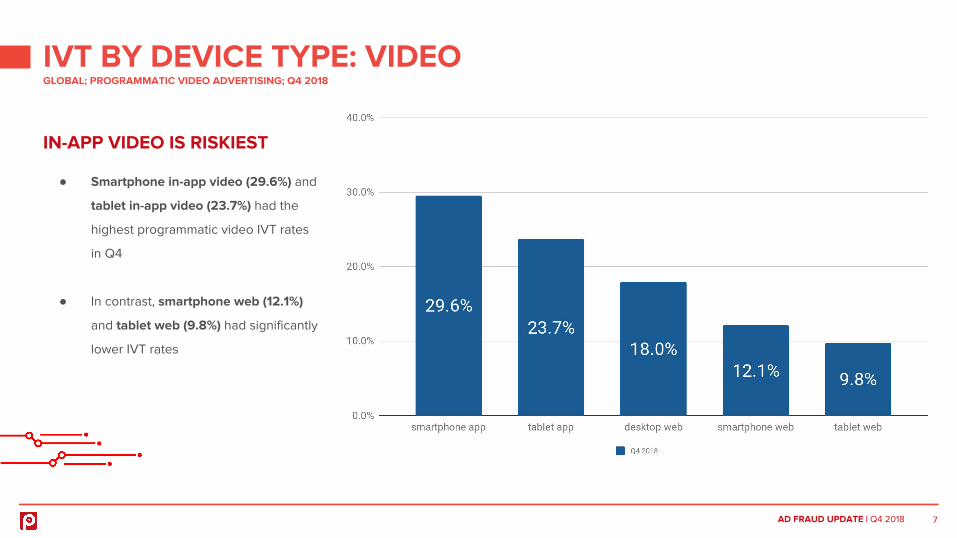
IVT BY DEVICE TYPE: VIDEOGLOBAL; PROGRAMMATIC VIDEO ADVERTISING; Q4 2018
7
IN-APP VIDEO IS RISKIEST
● Smartphone in-app video (29.6%) and
tablet in-app video (23.7%) had the
highest programmatic video IVT rates
in Q4
● In contrast, smartphone web (12.1%)
and tablet web (9.8%) had significantly
lower IVT rates
AD FRAUD UPDATE | Q4 2018
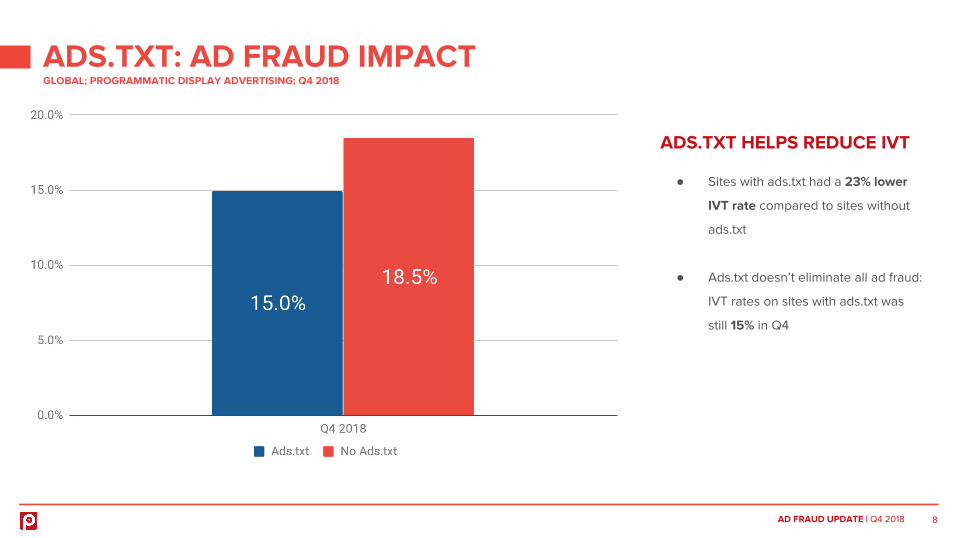
ADS.TXT: AD FRAUD IMPACTGLOBAL; PROGRAMMATIC DISPLAY ADVERTISING; Q4 2018
8
ADS.TXT HELPS REDUCE IVT
● Sites with ads.txt had a 23% lower
IVT rate compared to sites without
ads.txt
● Ads.txt doesn’t eliminate all ad fraud:
IVT rates on sites with ads.txt was
still 15% in Q4

ANDROID vs. iOS

AD FRAUD UPDATE | Q4 2018
OVERALL IN-APP AD FRAUD RATESGLOBAL; PROGRAMMATIC IN-APP ADVERTISING; Q3-Q4 2018
10
17.1%Q3 2018
22.7%Q4 2018Mobile in-app IVT rates rose 33% in
Q4 2018

AD FRAUD UPDATE | Q4 2018
Q4 201826.2% 15.9%
ANDROID vs. iOS: OVERALL IVT RATESGLOBAL; PROGRAMMATIC IN-APP ADVERTISING; Q4 2018
11
Android devices had a 1.7x higher IVT rate vs. iOS devices, with IVT rates over one-in-four.
But iOS devices weren’t fraud-free, as they still had a nearly 16% IVT rate.1.7x
higher IVT rate on Androids

AD FRAUD UPDATE | Q4 2018
ANDROID vs. iOS: SMARTPHONESGLOBAL; PROGRAMMATIC IN-APP ADVERTISING; Q4 2018
12
15% - 25% AT RISK
● Smartphone app advertising is risky
on both iOS and Android devices,
with a minimum 16.3% IVT rate
● Over one-in-four (26.4%) of
programmatic ads meant for
Android smartphone users were
actually invalid

AD FRAUD UPDATE | Q4 2018
ANDROID vs. iOS: TABLETSGLOBAL; PROGRAMMATIC IN-APP ADVERTISING; Q4 2018
13
ANDROID NEARLY 2X HIGHER
● Just over 13% of programmatic ads
on iOS tablets were invalid in Q4
2018
● The IVT rate was nearly 2x higher
on Android devices, at 24%
AD FRAUD UPDATE | Q4 2018
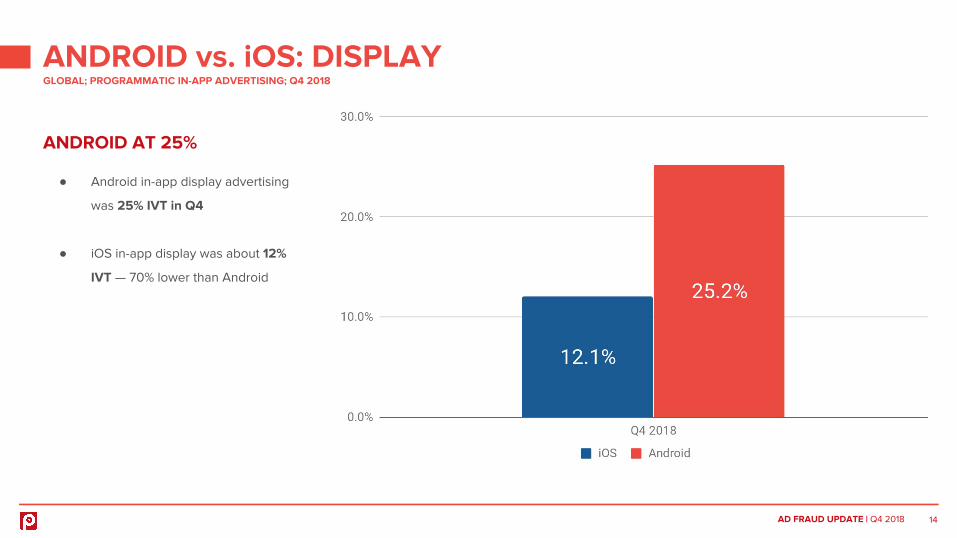
ANDROID vs. iOS: DISPLAYGLOBAL; PROGRAMMATIC IN-APP ADVERTISING; Q4 2018
14
ANDROID AT 25%
● Android in-app display advertising
was 25% IVT in Q4
● iOS in-app display was about 12%
IVT — 70% lower than Android
AD FRAUD UPDATE | Q4 2018
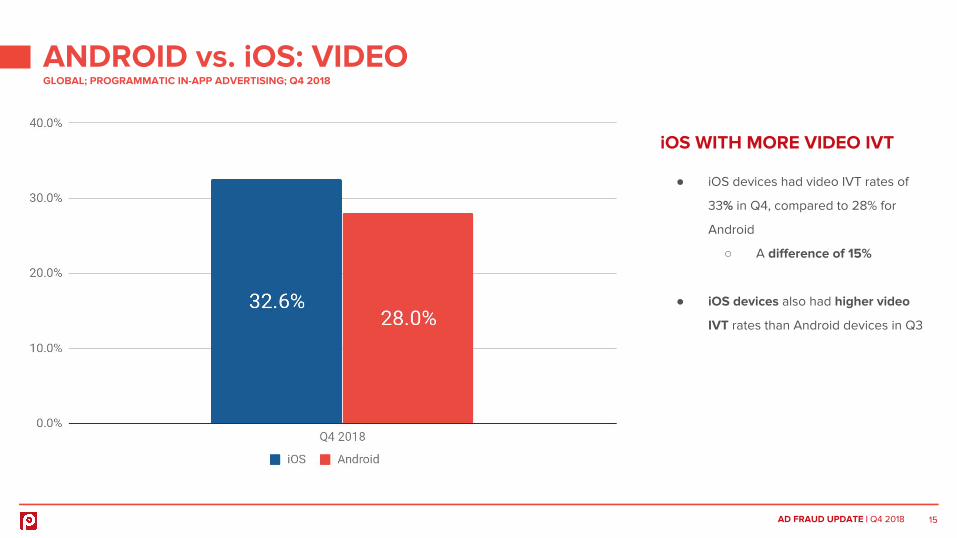
ANDROID vs. iOS: VIDEOGLOBAL; PROGRAMMATIC IN-APP ADVERTISING; Q4 2018
15
iOS WITH MORE VIDEO IVT
● iOS devices had video IVT rates of
33% in Q4, compared to 28% for
Android
○ A difference of 15%
● iOS devices also had higher video
IVT rates than Android devices in Q3

AD FRAUD UPDATE | Q4 2018
ANDROID vs. iOS: THE WHOLE ECOSYSTEMGLOBAL; PROGRAMMATIC IN-APP ADVERTISING; Q4 2018
16
ANDROID RISKY EVERYWHERE
● iOS is a tale of two ad types: iOS
in-app video IVT rates are 2x - 3x
higher than display
● On Android devices, in-app IVT rates
are about 25% for both video and
display, making it a risky channel
across the board

AD FRAUDBY APP CATEGORY
AD FRAUD UPDATE | Q4 2018
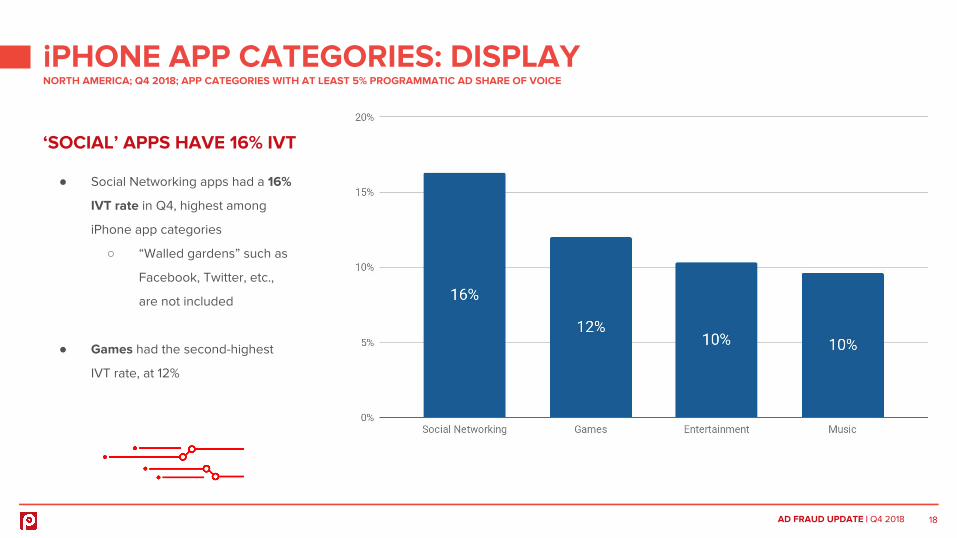
iPHONE APP CATEGORIES: DISPLAYNORTH AMERICA; Q4 2018; APP CATEGORIES WITH AT LEAST 5% PROGRAMMATIC AD SHARE OF VOICE
18
‘SOCIAL’ APPS HAVE 16% IVT
● Social Networking apps had a 16%
IVT rate in Q4, highest among
iPhone app categories
○ “Walled gardens” such as
Facebook, Twitter, etc.,
are not included
● Games had the second-highest
IVT rate, at 12%

AD FRAUD UPDATE | Q4 2018
iPHONE APP CATEGORIES: VIDEONORTH AMERICA; Q4 2018; APP CATEGORIES WITH AT LEAST 5% PROGRAMMATIC AD SHARE OF VOICE
19
‘WEATHER’ WITH HIGHEST IVT
● iPhone Weather apps and
Entertainment apps both had video
IVT rates above 25%
● Across the board, iPhones had a
bigger problem with in-app video
ad fraud compared to in-app display
ad fraud
AD FRAUD UPDATE | Q4 2018
ANDROID PHONE APP CATEGORIES: DISPLAYNORTH AMERICA; Q4 2018; APP CATEGORIES WITH AT LEAST 5% PROGRAMMATIC AD SHARE OF VOICE
20
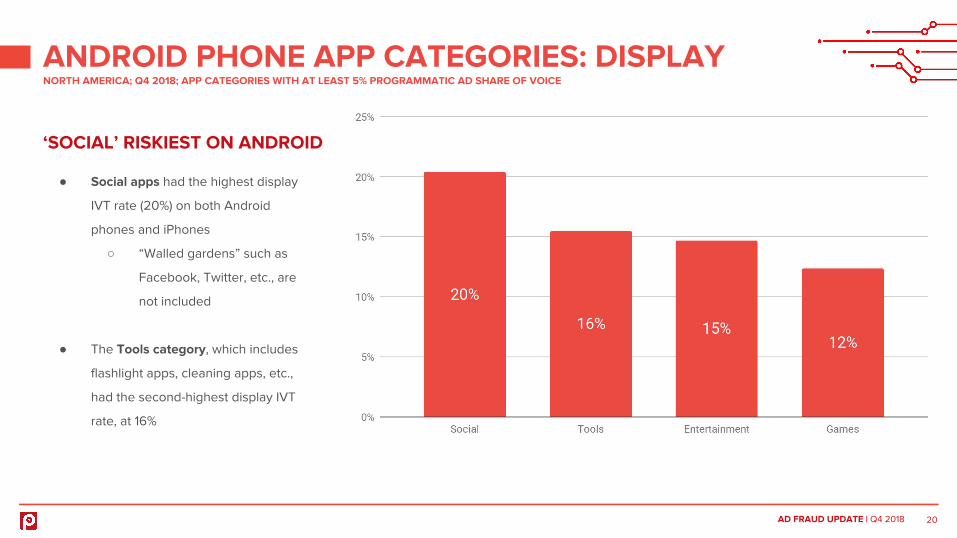
‘SOCIAL’ RISKIEST ON ANDROID
● Social apps had the highest display
IVT rate (20%) on both Android
phones and iPhones
○ “Walled gardens” such as
Facebook, Twitter, etc., are
not included
● The Tools category, which includes
flashlight apps, cleaning apps, etc.,
had the second-highest display IVT
rate, at 16%

AD FRAUD UPDATE | Q4 2018
ANDROID PHONE APP CATEGORIES: VIDEONORTH AMERICA; Q4 2018; APP CATEGORIES WITH AT LEAST 5% PROGRAMMATIC AD SHARE OF VOICE
21
‘ENTERTAINMENT’ AT 28%
● The Entertainment app category
had the highest Android phone
video IVT rate, at 28%
○ The Entertainment
category was over 25% IVT
for video on iPhones too
● Games (22%), Tools (22%), and
Health & Fitness (21%) all had IVT
rates above 20%

AD FRAUD UPDATE | Q4 2018
The research and insights contained within this report, including IVT rates and
other such designations, represent Pixalate’s opinions (i.e., they are neither facts
nor guarantees). The data has not been audited or reviewed by a third party, but
the research and insights are grounded in Pixalate’s proprietary technology and
analytics, which Pixalate is continuously evaluating and updating.
Per the MRC, “‘Fraud’ is not intended to represent fraud as defined in various
laws, statutes and ordinances or as conventionally used in U.S. Court or other
legal proceedings, but rather a custom definition strictly for advertising
measurement purposes.” Also per the MRC, “‘Invalid Traffic’ is defined generally
as traffic that does not meet certain ad serving quality or completeness criteria,
or otherwise does not represent legitimate ad traffic that should be included in
measurement counts. Among the reasons why ad traffic may be deemed invalid
is it is a result of non-human traffic (spiders, bots, etc.), or activity designed to
produce fraudulent traffic.”
22
METHODOLOGY & DISCLAIMERMETHODOLOGY DISCLAIMER
Pixalate’s data science and analyst team analyzed billions of
programmatic advertising impressions across over 80 million
domains and over 1.5 million apps utilizing proprietary analytics
tools to compile this research. The research contained herein
represents data collected by Pixalate from June 1, 2018 through
September 30, 2018 (“Q3 2018”) and October 1, 2018 through
December 31, 2018 (“Q4 2018”).
Pixalate utilized its proprietary algorithms to measure invalid
traffic (“IVT”) levels across devices and channels, including
General Invalid Traffic (“GIVT”) and Sophisticated Invalid Traffic
(“SIVT”). Geography is based off of the User Pool (IP) and not the
region of the domain or app. App “category” data is derived from
the official Google Play Store and Apple App Store.