Download - Q3-21 Earnings Presentation
July 7, 2021
Q3-21 Earnings Presentation

Caution regarding forward-looking statements
2
This presentation contains "forward-looking information" within the meaning of applicable Canadian securities legislation. Such forward-looking
information includes, but is not limited to, information with respect to our objectives and the strategies to achieve these objectives, as well as information
with respect to our beliefs, plans, expectations, anticipations, estimates and intentions. This forward-looking information is identified by the use of terms
and phrases such as "may", "would", "should", "could", "expect", "intend", "estimate", "anticipate", "plan", "foresee", "believe", and "continue", as well as
the negative of these terms and similar terminology, including references to assumptions, although not all forward-looking information contains these
terms and phrases. Forward-looking information is provided for the purposes of assisting the reader in understanding the Company and its business,
operations, prospects and risks at a point in time in the context of historical and possible future developments and therefore the reader is cautioned that
such information may not be appropriate for other purposes.
Forward-looking information is based on a number of assumptions and is subject to a number of risks and uncertainties, many of which are beyond our
control, which could cause actual results to differ materially from those that are disclosed in, or implied by, such forward-looking information. These risks
and uncertainties include, but are not limited to, the following risk factors which are discussed in greater detail under "Risk Factors" in the Company’s
Annual Information Form for the year ended August 31, 2020 available on SEDAR: limited operating history, negative operating cash flow, food industry ,
COVID-19 pandemic as well as the impact of the vaccine rollout, quality control and health concerns, regulatory compliance, regulation of the industry,
public safety issues, product recalls, damage to Goodfood’s reputation, transportation disruptions, storage and delivery of perishable foods, product
liability, unionization activities, consolidation trends, ownership and protection of intellectual property, evolving industry, reliance on management, factors
which may prevent realization of growth targets, competition, availability and quality of raw materials, environmental and employee health and safety
regulations, online security breaches and disruption, reliance on data centers, open source license compliance, future capital requirements, operating risk
and insurance coverage, management of growth, limited number of products , conflicts of interest, litigation, catastrophic events, risks associated with
payments from customers and third parties, being accused of infringing intellectual property rights of others and, climate change and environmental risks.
Although the forward-looking information contained herein is based upon what we believe are reasonable assumptions, readers are cautioned against
placing undue reliance on this information since actual results may vary from the forward-looking information. Certain assumptions were made in preparing
the forward-looking information concerning the availability of capital resources, business performance, market conditions, and customer demand. In
addition, information and expectations set forth herein are subject to and could change materially in relation to developments regarding the duration and
severity of the COVID-19 pandemic as well as the impact of the vaccine rollout and its impact on product demand, labour mobility, supply chain continuity
and other elements beyond our control. Consequently, all of the forward-looking information contained herein is qualified by the foregoing cautionary
statements, and there can be no guarantee that the results or developments that we anticipate will be realized or, even if substantially realized, that they
will have the expected consequences or effects on our business, financial condition or results of operation. Unless otherwise noted or the context otherwise
indicates, the forward-looking information contained herein is provided as of the date hereof, and we do not undertake to update or amend such forward-
looking information whether as a result of new information, future events or otherwise, except as may be required by applicable law.

Key financial highlights – Q3-21
3
(in millions of Canadian $ except for percentage information and active subscribers) Q3-21 Q3-20 Y-o-Y
Active subscribers (1) 317,000 272,000 +17%
Revenues $107.8 $86.6 +24%
Gross profit $37.7 $24.9 +51%
Gross margin (%) 35.0% 28.8% +6.2pp
Adjusted EBITDA (1) $1.7 $6.0 -71%
Adjusted EBITDA margin (%) (1) 1.6% 6.9% -5.3pp
Net (loss) income ($2.0) $2.8 N/A
Cash flows provided by operating activities $1.0 $8.6 -88%
Cash, cash equivalents and restricted cash $157.1 $80.5 +95%
Goodfood delivers record quarterly revenues of $108M
(1) This is a Metric or non-IFRS measure. Please refer to page 11 of this presentation for more details.
4
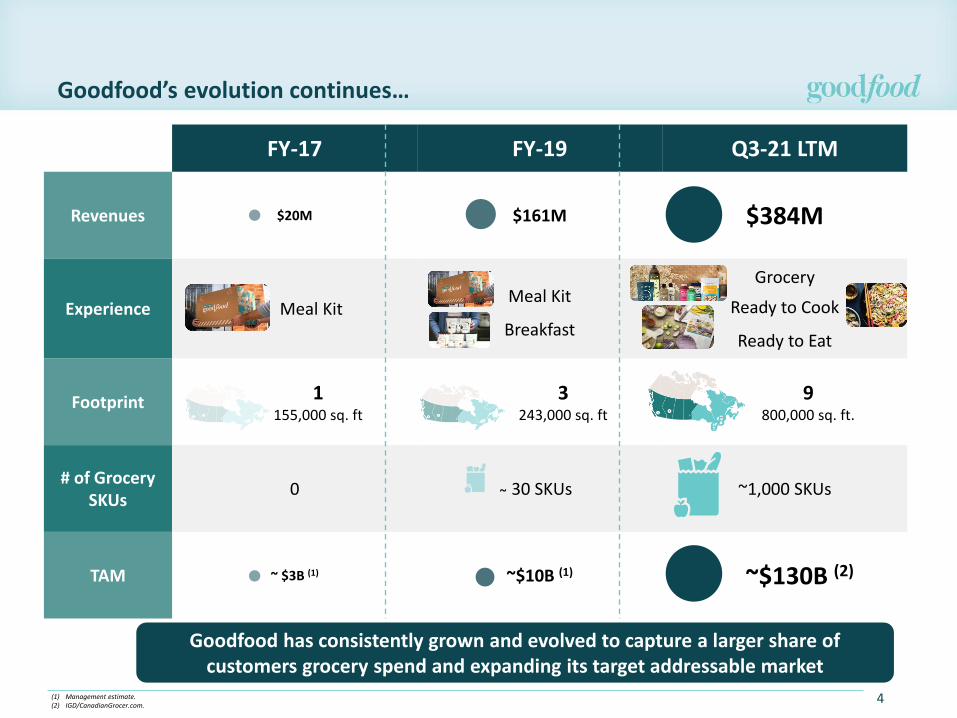
Goodfood’s evolution continues…
FY-17 FY-19 Q3-21 LTM
Revenues $20M $161M $384M
Experience Meal KitMeal Kit
Breakfast
Grocery
Ready to Cook
Ready to Eat
Footprint 1155,000 sq. ft
3243,000 sq. ft
9800,000 sq. ft.
# of Grocery SKUs
0 ̴ 30 SKUs ~1,000 SKUs
TAM ~ $3B (1) ~$10B (1) ~$130B (2)
Goodfood has consistently grown and evolved to capture a larger share of customers grocery spend and expanding its target addressable market
(1) Management estimate.(2) IGD/CanadianGrocer.com.
675
5
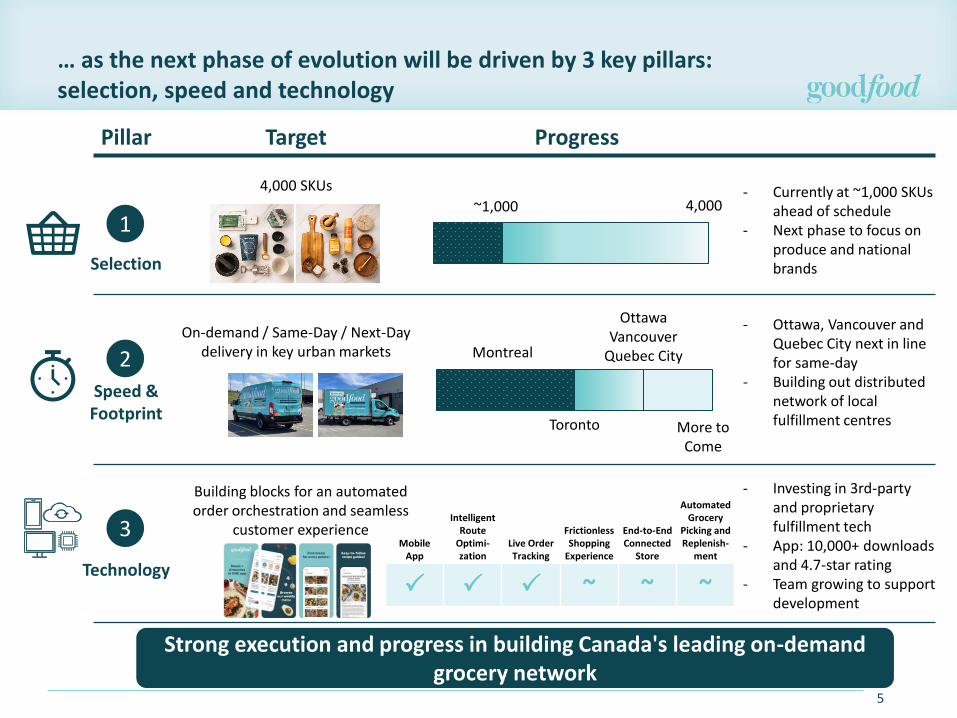
… as the next phase of evolution will be driven by 3 key pillars: selection, speed and technology
Pillar Target Progress
Selection
4,000 SKUs - Currently at ~1,000 SKUs ahead of schedule
- Next phase to focus on produce and national brands
Speed & Footprint
On-demand / Same-Day / Next-Day delivery in key urban markets
- Ottawa, Vancouver and Quebec City next in line for same-day
- Building out distributed network of local fulfillment centres
Technology
Building blocks for an automated order orchestration and seamless
customer experience
- Investing in 3rd-party and proprietary fulfillment tech
- App: 10,000+ downloads and 4.7-star rating
- Team growing to support development
1
2
3
~1,000 4,000
Montreal
Toronto
Ottawa Vancouver
Quebec City
More to Come
Strong execution and progress in building Canada's leading on-demand grocery network
Mobile App
Intelligent Route
Optimi-zation
Live Order Tracking
Frictionless Shopping
Experience
End-to-End Connected
Store
Automated Grocery
Picking and Replenish-
ment
~ ~ ~
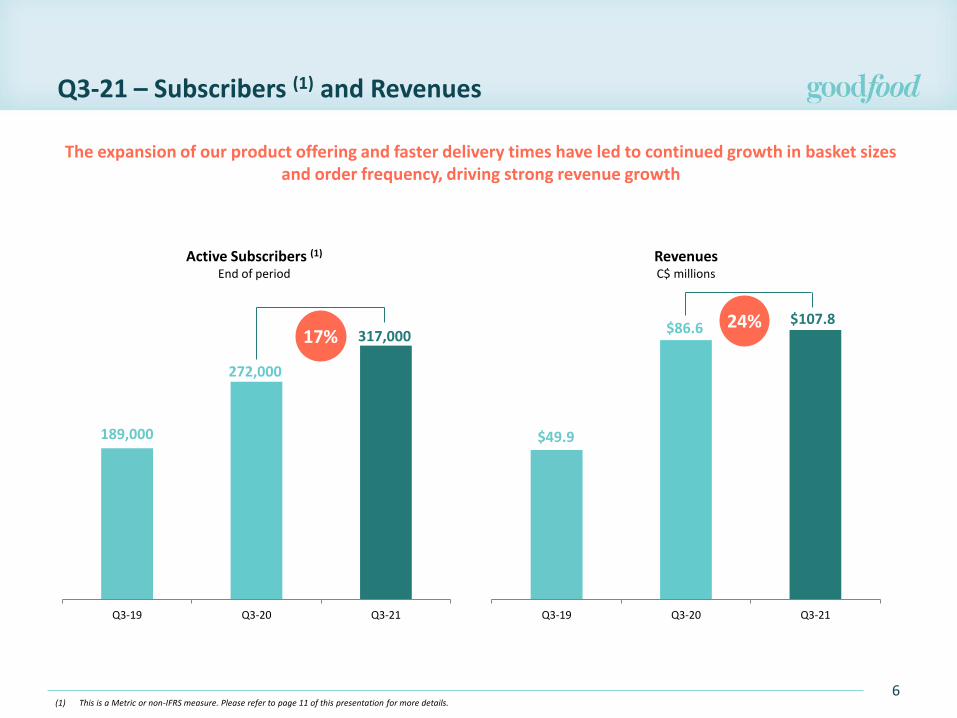
Q3-21 – Subscribers (1) and Revenues
6
The expansion of our product offering and faster delivery times have led to continued growth in basket sizes and order frequency, driving strong revenue growth
189,000
272,000
317,000
Q3-19 Q3-20 Q3-21
$49.9
$86.6$107.8
Q3-19 Q3-20 Q3-21
Active Subscribers (1)
End of period
RevenuesC$ millions
17%24%
(1) This is a Metric or non-IFRS measure. Please refer to page 11 of this presentation for more details.

-$2.4
$6.0
$1.7
-4.8%
6.9%
1.6%
-$7.5
-$5.5
-$3.5
-$1.5
$0.5
$2.5
$4.5
$6.5
$8.5
Q3-19 Q3-20 Q3-21
Adjusted EBITDA Adjusted EBITDA %
Gross Profit & Gross MarginC$ millions and %
$14.1
$24.9
$37.7
28.3% 28.8%35.0%
0.0%
5.0%
10.0%
15.0%
20.0%
25.0%
30.0%
35.0%
40.0%
$0.0
$5.0
$10.0
$15.0
$20.0
$25.0
$30.0
$35.0
$40.0
Q3-19 Q3-20 Q3-21
Gross Profit Gross Profit %
Q3-21 – Gross Profit, Adj. EBITDA (1) and Net Loss
7
Gross Profit increased to a record $37.7 million driven by operating leverage, cost-effective deliveryand automation investments leading in large part to positive Adjusted EBITDA (1) which continues to be impacted by
our ongoing investments in people, processes and technology
Adjusted EBITDA (1)
& Adjusted EBITDA Margin (1)
C$ millions and %
(1) (1)
-$3.6
$2.8
-$2.0
-$4.0
-$3.0
-$2.0
-$1.0
$0.0
$1.0
$2.0
$3.0
$4.0
Q3-19 Q3-20 Q3-21
Net IncomeC$ millions
EPS ($0.06) $0.05 ($0.03)
(1) This is a Metric or non-IFRS measure. Please refer to page 11 of this presentation for more details.

Q3-21 – CFO and CAPEX
8
Goodfood continues to generate strong growth while remaining cash flow from operations positive
Cash Flows Provided by Operating Activities
C$ millions
CAPEXC$ millions
$2.3
$8.6
$1.0
Q3-19 Q3-20 Q3-21
$1.9
$2.5
$5.03.8%
2.9%
4.7%
0.0 %
0.5 %
1.0 %
1.5 %
2.0 %
2.5 %
3.0 %
3.5 %
4.0 %
4.5 %
5.0 %
-$0.5
$0. 5
$1. 5
$2. 5
$3. 5
$4. 5
$5. 5
$6. 5
Q3-19 Q3-20 Q3-21
Capex As % of Revenue

Conclusion and outlook
9
Delivered record revenues and strong year-over-year growth
• Generated record revenues and gross profit
− 24% revenue growth and 51% gross profit growth in the context of last year’s significantly positively impacted quarter
Key developments and milestones achieved this quarter
• Reached nearly 1,000 SKU (1) well ahead of schedule
• Launched Goodfood mobile application rated at 4.7 stars out of 5
• Leased first Local Fulfillment Centre in Ottawa and Distribution Centre in Montreal as part of distributed network footprint strategy
After seasonally slower Q4, gearing up for Fiscal 22 growth
• Expect fourth quarter seasonality pattern to return as prior year's seasonality effect was partly muted by COVID-related commerce restraints
• Expanded selection combined with footprint and technology to help achieve faster deliveries and drive basket sizes and order frequency in Fiscal 2022
(1) Number of products currently available in Quebec.
Positioned for continued execution in 2022 as we are building Canada's leading on-demand grocery network

Q&A

Metrics and non-IFRS financial measures
The table below defines metrics and non-IFRS financial measures used by the Company throughout this presentation. Non-IFRS financial measures do not have standardized
definitions prescribed by IFRS and, therefore, may not be comparable to similar measures presented by other companies. They are provided as additional information to
complement IFRS measures and to provide a further understanding of the Company’s results of operations from our perspective. Accordingly, they should not be considered
in isolation nor as a substitute for analysis of our financial information reported under IFRS and should be read in conjunction with the financial statements for the periods
indicated. For a reconciliation of these non-IFRS financial measures to the most comparable IFRS financial measures, as applicable, see the "Metrics and Non-IFRS Financial
Measures – Reconciliation" of the Company’s latest Management Discussion & Analysis.
11
Metrics Definition
Active Subscribers
An account that is scheduled to receive a delivery, has elected to skip delivery in the subsequent weekly delivery cycleor that is registered to Goodfood WOW. Active subscribers exclude cancelled accounts. For greater certainty, anactive subscriber is only accounted for once, although different products might have been ordered in a given weeklydelivery cycle. While active subscribers is not an IFRS or non-IFRS financial measure, and, therefore, does not appearin, and cannot be reconciled to a specific line item in the Company’s consolidated financial statements, we believethat active subscribers is a useful metric for investors because it is indicative of potential future revenues. TheCompany reports the number of active subscribers at the beginning and end of the period, rounded to the nearestthousand.
Non-IFRS Financial Measures Definition
EBITDA EBITDA is defined as net income (loss) before net finance costs, depreciation and amortization and income taxes.
Adjusted EBITDA and Adjusted EBITDA margin
Adjusted EBITDA is defined as EBITDA excluding share-based payments and restructuring costs. Adjusted EBITDAmargin is defined as the percentage of adjusted EBITDA to revenues. EBITDA, adjusted EBITDA, and adjusted EBITDAmargin are non-IFRS financial measures.

Jonathan Roiter, Chief Financial Officer1 (855) [email protected]
COMPANY CONTACT – INVESTOR RELATIONS & MEDIA
Roslane Aouameur, Senior Director, Financial Planning & Investor Relations1 (855) [email protected]


