
Q1 FY2019 Performance Review
July 17, 2018
2
Industry Overview
Agenda
Financial Performance
Company Strategy

3
Industry Overview
Agenda
Financial Performance
Company Strategy
4
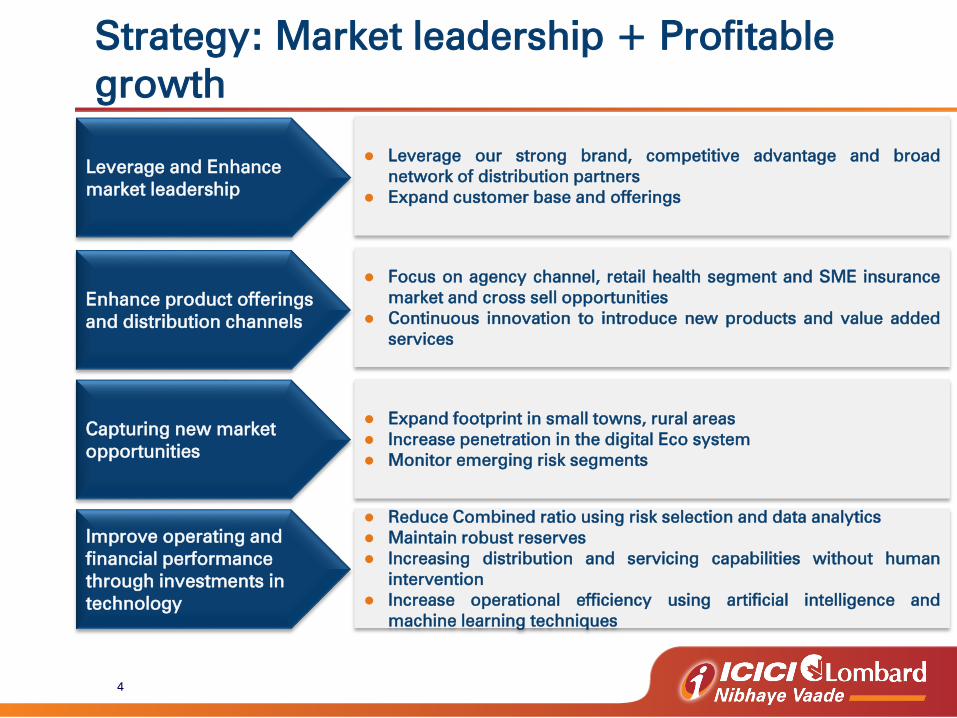
Strategy: Market leadership + Profitable
growth
Leverage our strong brand, competitive advantage and broad
network of distribution partners
Expand customer base and offerings
Focus on agency channel, retail health segment and SME insurance
market and cross sell opportunities
Continuous innovation to introduce new products and value added
services
Expand footprint in small towns, rural areas
Increase penetration in the digital Eco system
Monitor emerging risk segments
Reduce Combined ratio using risk selection and data analytics
Maintain robust reserves
Increasing distribution and servicing capabilities without human
intervention
Increase operational efficiency using artificial intelligence and
machine learning techniques
Leverage and Enhance
market leadership
Capturing new market
opportunities
Enhance product offerings
and distribution channels
Improve operating and
financial performance
through investments in
technology
5
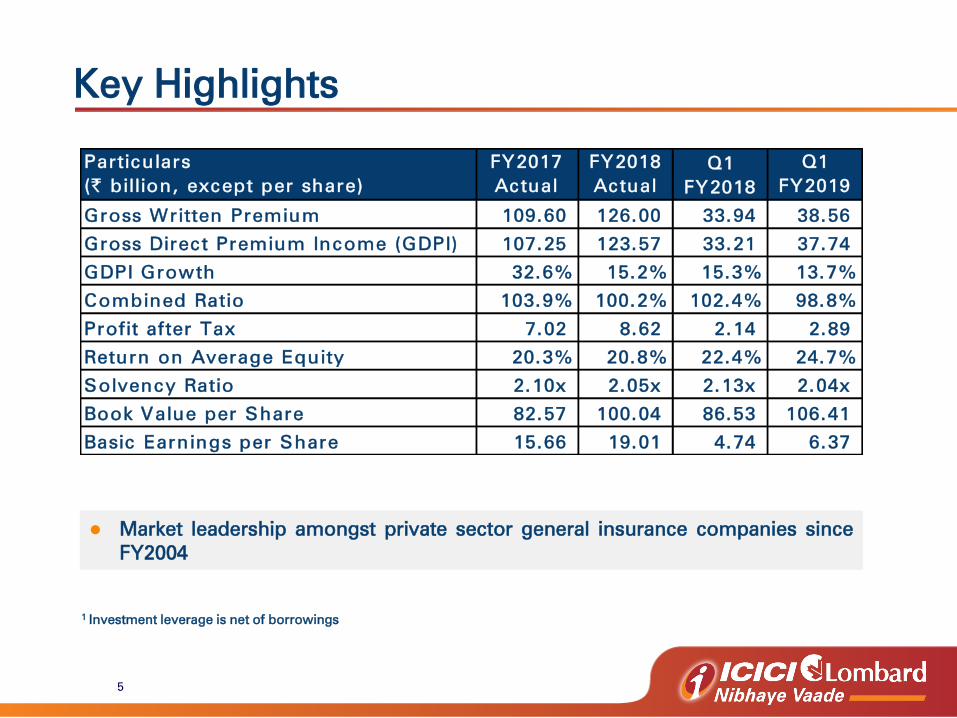
Key Highlights
Market leadership amongst private sector general insurance companies since
FY2004
1 Investment leverage is net of borrowings
Particulars
(` billion, except per share)
FY2017
Actual
FY2018
Actual
Q1
FY2018
Q1
FY2019
Gross Written Premium 109.60 126.00 33.94 38.56
Gross Direct Premium Income (GDPI) 107.25 123.57 33.21 37.74
GDPI Growth 32.6% 15.2% 15.3% 13.7%
Combined Ratio 103.9% 100.2% 102.4% 98.8%
Profit after Tax 7.02 8.62 2.14 2.89
Return on Average Equity 20.3% 20.8% 22.4% 24.7%
Solvency Ratio 2.10x 2.05x 2.13x 2.04x
Book Value per Share 82.57 100.04 86.53 106.41
Basic Earnings per Share 15.66 19.01 4.74 6.37
6
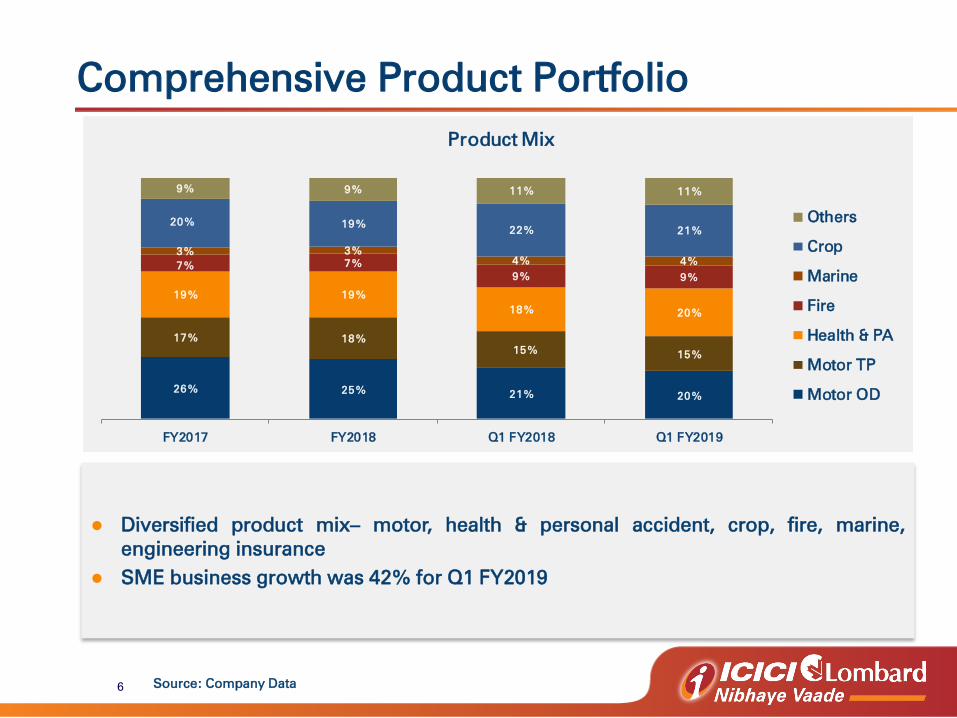
Comprehensive Product Portfolio
Diversified product mix– motor, health & personal accident, crop, fire, marine,
engineering insurance
SME business growth was 42% for Q1 FY2019
Source: Company Data
26% 25%21% 20%
17% 18%
15%15%
19% 19%
18%20%
7% 7%
9% 9%
3% 3%
4% 4%
20% 19%22% 21%
9% 9% 11% 11%
FY2017 FY2018 Q1 FY2018 Q1 FY2019
Product Mix
Others
Crop
Marine
Fire
Health & PA
Motor TP
Motor OD
7
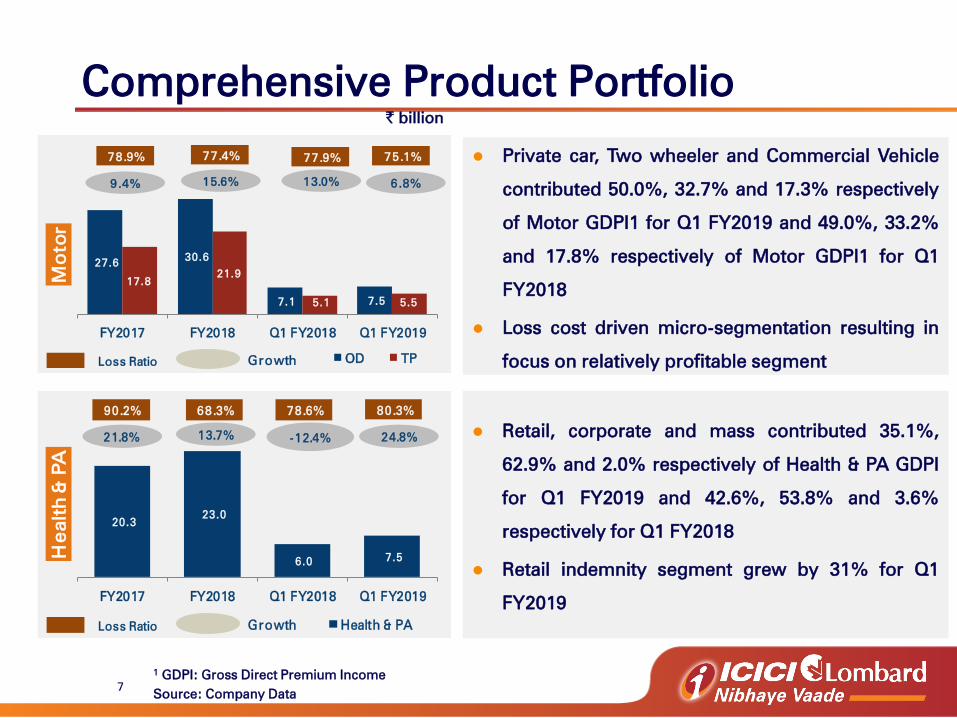
Comprehensive Product Portfolio
Private car, Two wheeler and Commercial Vehicle
contributed 50.0%, 32.7% and 17.3% respectively
of Motor GDPI1 for Q1 FY2019 and 49.0%, 33.2%
and 17.8% respectively of Motor GDPI1 for Q1
FY2018
Loss cost driven micro-segmentation resulting in
focus on relatively profitable segment
Retail, corporate and mass contributed 35.1%,
62.9% and 2.0% respectively of Health & PA GDPI
for Q1 FY2019 and 42.6%, 53.8% and 3.6%
respectively for Q1 FY2018
Retail indemnity segment grew by 31% for Q1
FY2019
1GDPI: Gross Direct Premium Income
Source: Company Data
` billion
27.6 30.6
7.1 7.5
17.8
21.9
5.1 5.5
FY2017 FY2018 Q1 FY2018 Q1 FY2019
Mo
to
r
Growth OD TP
13.0%
Loss Ratio
9.4% 15.6%
78.9% 77.4% 77.9% 75.1%
6.8%
20.3
23.0
6.0 7.5
FY2017 FY2018 Q1 FY2018 Q1 FY2019
He
alth
& P
A
Growth Health & PA
-12.4%
Loss Ratio
21.8% 13.7%
78.6%90.2% 68.3%
24.8%
80.3%
8
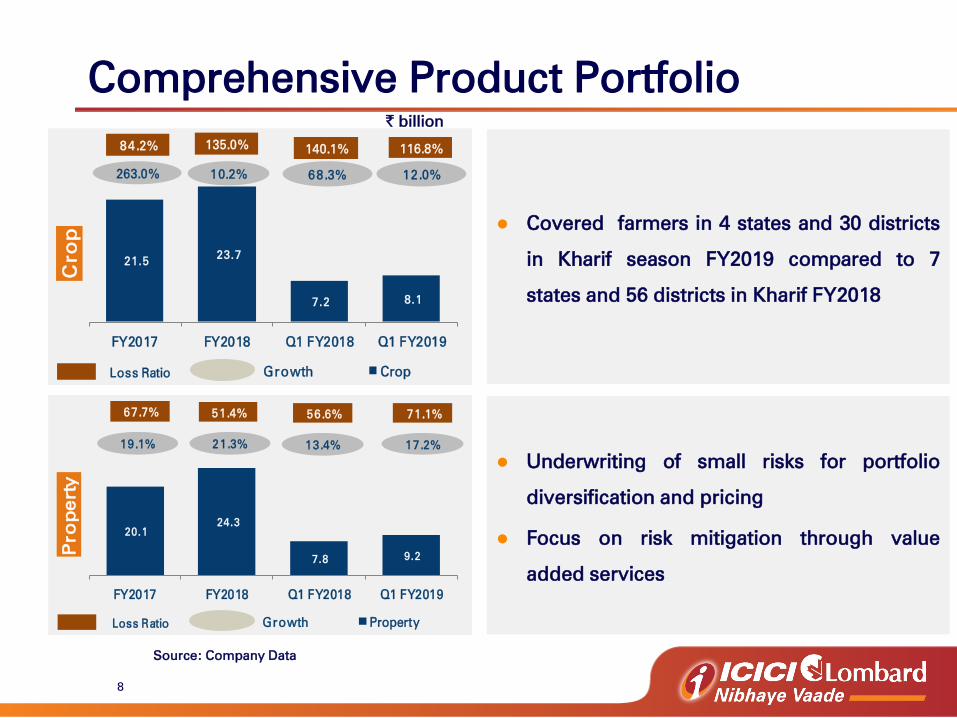
Comprehensive Product Portfolio
Covered farmers in 4 states and 30 districts
in Kharif season FY2019 compared to 7
states and 56 districts in Kharif FY2018
Underwriting of small risks for portfolio
diversification and pricing
Focus on risk mitigation through value
added services
Source: Company Data
21.5 23.7
7.2 8.1
FY2017 FY2018 Q1 FY2018 Q1 FY2019
Cro
p
Growth Crop
68.3%
Loss Ratio
263.0% 10.2%
140.1%84.2% 135.0%
12.0%
116.8%
20.1
24.3
7.8 9.2
FY2017 FY2018 Q1 FY2018 Q1 FY2019
Pro
pe
rty
Growth Property
13.4%
Loss Ratio
19.1% 21.3%
56.6%67.7% 51.4%
17.2%
71.1%
` billion
9
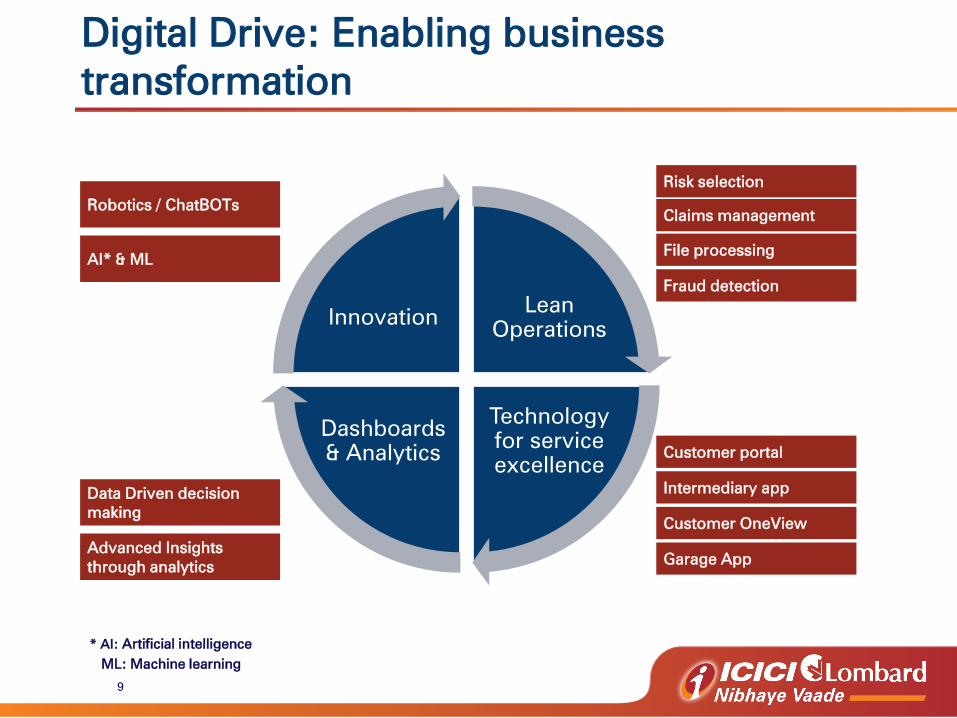
Digital Drive: Enabling business
transformation
Lean
Operations
Technology
for service
excellence
Dashboards
& Analytics
Innovation
Data Driven decision
making
Advanced Insights
through analytics
Robotics / ChatBOTs
AI* & ML
Risk selection
Claims management
File processing
Fraud detection
Customer portal
Intermediary app
Customer OneView
Garage App
* AI: Artificial intelligence
ML: Machine learning
10
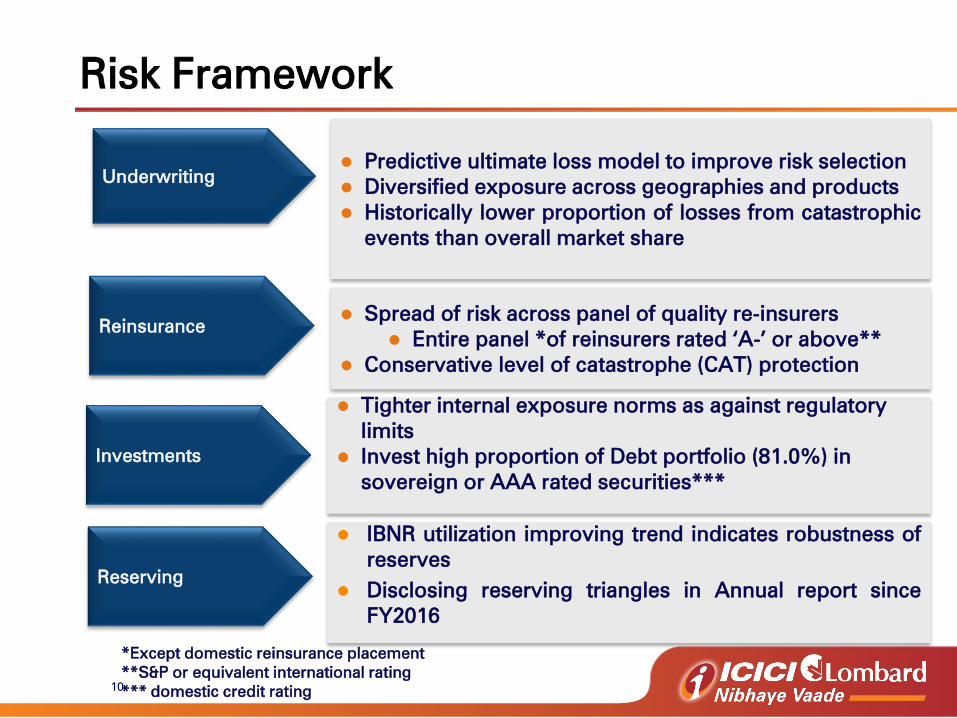
Risk Framework
Underwriting
Predictive ultimate loss model to improve risk selection
Diversified exposure across geographies and products
Historically lower proportion of losses from catastrophic
events than overall market share
Reinsurance Spread of risk across panel of quality re-insurers
Entire panel *of reinsurers rated ‘A-’ or above**
Conservative level of catastrophe (CAT) protection
*Except domestic reinsurance placement
**S&P or equivalent international rating
*** domestic credit rating
Tighter internal exposure norms as against regulatory
limits
Invest high proportion of Debt portfolio (81.0%) in
sovereign or AAA rated securities***
Investments
IBNR utilization improving trend indicates robustness of
reserves
Disclosing reserving triangles in Annual report since
FY2016
Reserving
11
Industry Overview
Agenda
Financial Performance
Company Strategy

12
149.50
181.93 198.73
FY2017 FY2018 Q1 FY2019
Investment Leverage
3.88X 3.90X
Investment Book (` bn)
4.01X
Robust Investment Performance
Investment portfolio mix2
at Q1 FY2019 : Corporate bonds (47.57%), G-Sec (29.94%) and
equity (15.32%)
Strong investment leverage
Unrealised Gains at ` 0.703
bn as on June 30, 2018
1Total investment assets (net of borrowings) / net worth
2Investment portfolio mix includes Equity & Mutual funds at market value
3 Impacted by rising interest yield on fixed income securities
Source: Company Data
1
10.0% 9.7%
3.0% 2.7%
FY2017 FY2018 Q1 FY2018 Q1 FY2019
Realised Return
13
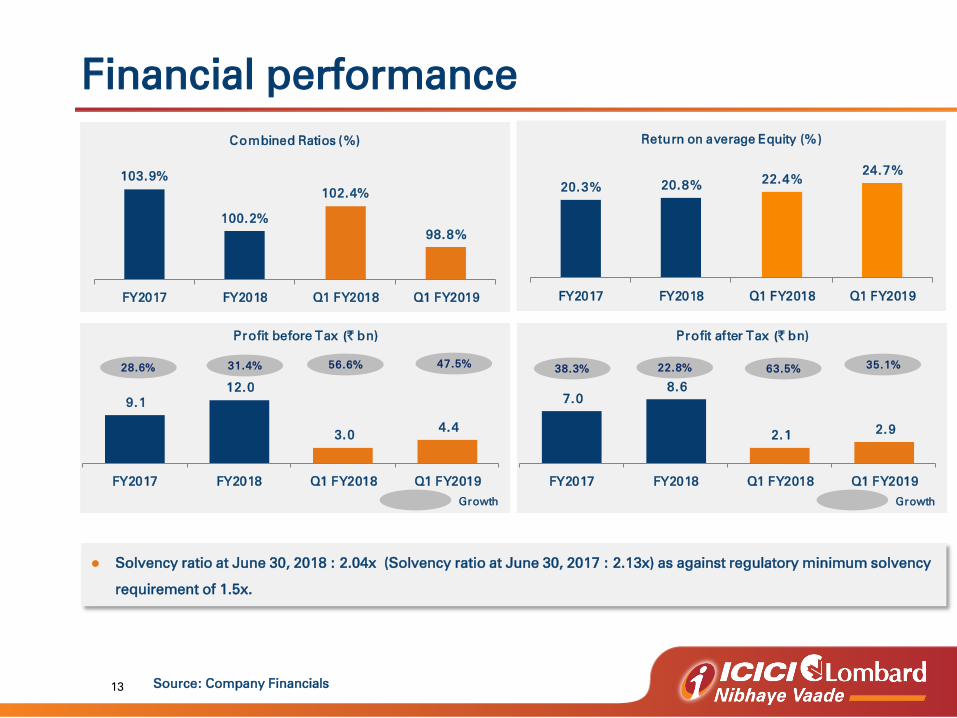
Financial performance
Solvency ratio at June 30, 2018 : 2.04x (Solvency ratio at June 30, 2017 : 2.13x) as against regulatory minimum solvency
requirement of 1.5x.
Source: Company Financials
20.3% 20.8%22.4%
24.7%
FY2017 FY2018 Q1 FY2018 Q1 FY2019
Return on average Equity (%)
9.1
12.0
3.0 4.4
FY2017 FY2018 Q1 FY2018 Q1 FY2019
Growth
28.6% 31.4% 47.5%56.6%
Profit before Tax (` bn)
7.0
8.6
2.1 2.9
FY2017 FY2018 Q1 FY2018 Q1 FY2019
Growth
38.3% 22.8% 63.5%
Profit after Tax (` bn)
35.1%
103.9%
100.2%
102.4%
98.8%
FY2017 FY2018 Q1 FY2018 Q1 FY2019
Combined Ratios (%)
14
Industry Overview
Agenda
Financial Performance
Company Strategy

15
Industry has witnessed steady growth
Industry has grown at CAGR of 17% in the last 16 years
` billion
Source: Latest IRDAI & GI Council report
261
469
1,507
333 373
FY2007 FY2011 FY2018 Q1 FY2018 Q1 FY2019
FY2007 FY2011 FY2018 Q1 FY2018 Q1 FY2019
Growth
16.7%
15.8%
18.1%
12.2%

16
5.00
4.28
2.74 2.36 2.34
1.89 1.77
1.04 0.93
0.46
Premium as a % of GDP (CY17)
2542
1523
938 901
174 159 167 113 18 18
Non-Life Insurance Density
(Premium per capita) (CY17)
India Non - life Insurance Market - Large
Addressable Market
(%)(US$)
4th
largest non-life
insurance market in Asia
GDPI growth at CAGR of
17% from FY 2001 to FY
2017
Non-life Insurance
penetration in India was
around 1/3rd
of Global
Average in 2017
Significantly underpenetrated
Source: Sigma 2017 Swiss Re
World: 2.80
(US$)

17
Thank you
18
Annexure

19
Loss ratio
Source: Company Financials
Particulars FY2017 FY2018 Q1 2018 Q1 2019
Motor OD 64.2% 53.7% 62.2% 62.9%
Motor TP 97.4% 107.1% 97.5% 90.6%
Health 97.9% 77.6% 86.0% 85.5%
PA 41.3% 23.9% 43.8% 56.5%
Crop 84.2% 135.0% 140.1% 116.8%
Fire 68.4% 43.1% 60.7% 115.2%
Marine 83.9% 54.2% 75.0% 81.1%
Engineering 53.3% 24.0% 52.3% 44.9%
Other 62.1% 57.3% 49.8% 60.8%
Total 80.4% 76.9% 78.1% 76.9%

20
Safe harbor
Except for the historical information contained herein, statements in this release
which contain words or phrases such as 'will', 'would', ‘indicating’, ‘expected to’
etc., and similar expressions or variations of such expressions may constitute
'forward-looking statements'. These forward-looking statements involve a number
of risks, uncertainties and other factors that could cause actual results to differ
materially from those suggested by the forward-looking statements. These risks
and uncertainties include, but are not limited to our ability to successfully
implement our strategy, our growth and expansion in business, the impact of any
acquisitions, technological implementation and changes, the actual growth in
demand for insurance products and services, investment income, cash flow
projections, our exposure to market risks, policies and actions of regulatory
authorities; impact of competition; the impact of changes in capital , solvency or
accounting standards , tax and other legislations and regulations in the jurisdictions
as well as other risks detailed in the reports filed by ICICI Bank Limited, our holding
company, with the United States Securities and Exchange Commission. ICICI Bank
and we undertake no obligation to update forward-looking statements to reflect
events or circumstances after the date thereof.


