
Property Taxation Guide
Property Taxation in Ontario:
A Guide for Municipalities
MFOAMFOAMUNICIPAL FINANCE
OFFICERS’ ASSOCIATIONOF ONTARIO

PROPERTY TAXATION
GUIDE
PROPERTY TAXATION IN ONTARIO: A GUIDE FOR MUNICIPALITIES
Municipal Finance Officers’ Association of Ontario


Property Taxation Guide Introduction
INTRODUCTION Of the many responsibilities of municipal finance departments in Ontario administering the property tax is certainly one of the most important—not least because the property tax is the single biggest source of revenue for municipalities.
Notwithstanding its importance as a revenue source, the property tax and its associated legislation continues to increase in complexity. Misconceptions about the tax abound and the reforms to the property tax system that began fifteen years ago have yet to be fully absorbed. For those who have been involved in property taxes since before the system was overhauled keeping pace with the changes has been an enormous challenge. For finance staff who are new to the field getting to grips with the system can be a daunting and frustrating exercise.
The purpose of this property tax guide is to provide a comprehensive description of the various aspects of the Ontario system as it now exists by chronicling the changes that have occurred and by providing practical advice on managing the property tax in the current climate.
Although comprehensive in scope this guide does not cover every facet of the property tax system. This is particularly the case in sections dealing with legislation as they focus on the major statutory provisions and do not necessarily provide a definitive
commentary. The reader should therefore treat the guide as a car owner’s manual rather than a mechanic’s technical manual.


Property Taxation Guide About Hemson Consulting
ABOUT HEMSON CONSULTING
This guide was prepared by Hemson Consulting Ltd., a consulting firm that combines municipal finance, taxation, and planning expertise. The firm undertakes assignments for a range of public sector clients, from federal and provincial governments to large cities, regional and county municipalities, and smaller rural towns and townships. Hemson’s municipal finance and taxation practice is extensive and is anchored by professionals who have considerable experience in the municipal sector. Key areas of the firm’s practice include development charges, asset management, tax policy, infrastructure financing and planning, fees and charges, water and sewer rates, and long-range financial planning. For more information please contact: Craig Binning, Partner Hemson Consulting Ltd. 416-593-5090 ext. 20 [email protected] www.hemson.com


Property Taxation Guide Table of Contents
TABLE OF CONTENTS
CHAPTER 1 HISTORY AND RATIONALE FOR PROPERTY TAXES ........................................................... 1
PROPERTY TAX BASICS .............................................................................................................................. 1
The Property We Tax ............................................................................................................................ 1
Property Classification .......................................................................................................................... 2
Assessment—Measuring Property Value ............................................................................................. 2
Tax Rates—Calculating Property Tax .................................................................................................... 3
Incidence of Property Tax ..................................................................................................................... 3
What Does Property Tax Pay For? ........................................................................................................ 4
EVALUATING THE PROPERTY TAX ............................................................................................................. 4
Equity .................................................................................................................................................... 4
Ability to Pay ......................................................................................................................................... 5
Benefits Received .................................................................................................................................. 5
Other Considerations ............................................................................................................................ 6
PROPERTY TAX HAS BEEN FOUNDATION OF LOCAL GOVERNMENT FINANCE SINCE 18TH CENTURY ..... 8
Early Days .............................................................................................................................................. 8
Push for Reform .................................................................................................................................... 9
Property Tax Reform ........................................................................................................................... 10
Aftermath—the Last Ten Years ........................................................................................................... 11
CHAPTER 2 ASSESSMENT LEGISLATION ........................................................................................... 13
What Property Is Assessed? ................................................................................................................ 13
Who Prepares the Assessment? ......................................................................................................... 13
How Is Property Assessed? ................................................................................................................. 14
Exemptions.......................................................................................................................................... 17
Property Classification ........................................................................................................................ 18
Assessment Roll .................................................................................................................................. 19
General Reassessments ...................................................................................................................... 20
Assessment Phase In ........................................................................................................................... 20

Property Taxation Guide Table of Contents
Supplementary and Omitted Assessments ......................................................................................... 21
Requests for Reconsideration ............................................................................................................. 21
Appeals ................................................................................................................................................ 22
Confidentiality ..................................................................................................................................... 22
CHAPTER 3 THE MUNICIPAL ACT ..................................................................................................... 23
PART VIII – MUNICIPAL TAXATION ......................................................................................................... 23
Section 307: Tax Rates and Tax Ratios ................................................................................................ 25
Section 308: Tax Ratio Rules for the Main Property Classes .............................................................. 25
Tax Ratios for Optional Property Classes ............................................................................................ 28
Section 308.1: Farm Properties .......................................................................................................... 28
Sections 311 and 312: Upper and Lower‐Tier Levies .......................................................................... 29
Section 313: Farmland Awaiting Development and Vacant and Excess Land
in the Commercial and Industrial Classes ........................................................................................... 29
Section 314: Graduated Tax Rates ...................................................................................................... 30
Sections 316 and 317: Interim Upper and Lower‐Tier Levies ............................................................. 30
Section 318: Phase‐in Tax Changes Resulting from Reassessments ................................................... 30
Section 320: Taxes on International Bridges and Tunnels .................................................................. 31
Section 326: Special Services Area Rating ........................................................................................... 31
PART IX – LIMITATION ON TAXES ........................................................................................................... 31
Background to Capping and Clawback ................................................................................................ 32
“Comparables” Based Treatment of New and “New to Class” Properties ......................................... 32
Municipal Capping Options ................................................................................................................. 33
PART X – TAX COLLECTION ..................................................................................................................... 33
CHAPTER 4 OTHER PROPERTY TAX LEGISLATION ............................................................................. 36
PUBLIC EDUCATION AND PROPERTY TAX ............................................................................................... 36
Education Funding .............................................................................................................................. 36
Education Property Taxes ................................................................................................................... 38
Business Education Property Taxes .................................................................................................... 38
Municipal Role as Education Property Tax Collector .......................................................................... 39

Property Taxation Guide Table of Contents
School Support .................................................................................................................................... 39
PAYMENTS IN LIEU OF TAXES ................................................................................................................. 40
Federal PILTs ....................................................................................................................................... 40
Provincial PILTs .................................................................................................................................... 42
“Heads and Beds” Levies ..................................................................................................................... 43
OTHER PROPERTY TAX LEGISLATION ...................................................................................................... 43
Provincial Land Tax Act ....................................................................................................................... 43
City‐Specific Acts ................................................................................................................................. 44
CHAPTER 5 UNDERSTANDING THE TAX BASE .................................................................................. 45
ASSESSMENT ROLL ................................................................................................................................. 45
HOW CVA IS DETERMINED ..................................................................................................................... 46
Residential Properties ......................................................................................................................... 46
Multi‐Residential Properties ............................................................................................................... 46
Commercial Properties ....................................................................................................................... 47
Industrial Properties ........................................................................................................................... 47
Farms, Managed Forests and Conservation Land ............................................................................... 47
Special Purpose Properties ................................................................................................................. 48
Renewable Energy Installations .......................................................................................................... 48
HOW PROPERTIES ARE CLASSIFIED ........................................................................................................ 49
Residential Class .................................................................................................................................. 49
Multi‐Residential Class ........................................................................................................................ 50
New Multi‐Residential Class ............................................................................................................... 50
Commercial Class ................................................................................................................................ 50
Industrial Class .................................................................................................................................... 50
New Construction Sub‐Class ............................................................................................................... 51
Pipeline, Farm, and Managed Forest Classes...................................................................................... 51
Mixed‐Use Property ............................................................................................................................ 51
REASSESSMENTS AND PHASE‐INS .......................................................................................................... 51
ANALYSING REASSESSMENT CHANGES .................................................................................................. 54
Inter‐Municipal Shifts .......................................................................................................................... 54
Property Taxation Guide Table of Contents
Inter‐Class Shifts.................................................................................................................................. 55
Within‐Class Shifts .............................................................................................................................. 57
NON‐REASSESSMENT YEARS .................................................................................................................. 60
CHAPTER 6 THE TAX POLICY FRAMEWORK ...................................................................................... 62
GENERAL OBJECTIVES AND OPTIONS ..................................................................................................... 62
TAX POLICY IS A ZERO SUM GAME ......................................................................................................... 63
DEVELOPING A POLICY STRATEGY .......................................................................................................... 63
Assessment Phase‐Ins ......................................................................................................................... 64
Linking Municipal Objectives To Tax Policies ...................................................................................... 65
CHAPTER 7 DEVELOPING TAX POLICIES ........................................................................................... 66
GETTING READY ...................................................................................................................................... 66
UNDERSTANDING THE KEY POLICY OPTIONS ......................................................................................... 67
Revenue‐Neutral Ratios ...................................................................................................................... 68
Alternative Class Level Ratios ............................................................................................................. 68
Optional Classes .................................................................................................................................. 68
Graduated CVA Bands ......................................................................................................................... 69
Tax Phase‐in Programs ........................................................................................................................ 69
IMPLICATIONS OF THE CVA PHASE‐IN PROGRAM FOR TAX POLICY PLANNING .................................... 70
How Does the CVA Phase‐In Program Work? ..................................................................................... 70
Reviewing the Reassessment Phase‐In Effects ................................................................................... 70
DEVELOPING AND TESTING TAX POLICY OPTIONS ................................................................................. 71
Prepare a List of Tax Related Municipal Objectives ............................................................................ 71
Identify Impacts That Could Warrant Tax Policy Intervention ............................................................ 72
Develop and Model Policy Scenarios .................................................................................................. 72
Maintain the Class‐Level Status Quo .................................................................................................. 72
Permit Class‐Level Reassessment Tax Shifts ....................................................................................... 73
Class‐Level Ratio Changes ................................................................................................................... 73
Within‐Class Policy Choices................................................................................................................. 73
Commercial Class Considerations ....................................................................................................... 73

Property Taxation Guide Table of Contents
Industrial Class Considerations ........................................................................................................... 77
Other Within‐Class Policy Considerations .......................................................................................... 77
CHAPTER 8 CLAPPING AND CLAWBACK ........................................................................................... 79
HOW DOES CAPPING AND CLAWBACK WORK? ..................................................................................... 80
Understanding the Characteristics of Affected Properties ................................................................. 82
The Mandatory Tax Capping Program ................................................................................................ 82
OPTIONAL TAX CAPPING AND CLAWBACK POLICIES .............................................................................. 84
Higher Tax Increases Phase‐in Rate .................................................................................................... 84
5% of CVA Tax Increase Option ........................................................................................................... 85
$250 Increase or Decrease Threshold ................................................................................................. 85
Treatment of “New Construction” and “New to Class” Properties .................................................... 86
The “Stay at CVA Taxes” Option ......................................................................................................... 86
The “Cross CVA” Option ...................................................................................................................... 86
Summary of Options ........................................................................................................................... 89
POST‐BILLING ADJUSTMENTS ................................................................................................................. 89
CHAPTER 9 ADMINISTERING THE PROPERTY TAX ............................................................................ 91
SETTING TAX RATES ................................................................................................................................ 91
Delegation of Tax Ratio Setting ........................................................................................................... 91
Calculation of Tax Rates ...................................................................................................................... 92
Accounting for PILTs ............................................................................................................... 92
PROPERTY TAX COLLECTION ................................................................................................................... 92
Tax Certificates .................................................................................................................................... 94
MANAGING THE ASSESSMENT ROLL ...................................................................................................... 94
ASSESSMENT APPEALS ........................................................................................................................... 95
Owner‐Initiated Appeals ..................................................................................................................... 96
Municipality‐Initiated Appeals ............................................................................................................ 97
TAXATION‐RELATED APPLICATIONS ..................................................................................................... 100
TAX REBATES ........................................................................................................................................ 100
Low Income Seniors and Disabled .................................................................................................... 100

Property Taxation Guide Table of Contents
Charities and Non‐Profit Organizations ............................................................................................ 101
Optional Relief from Hardship .......................................................................................................... 102
Heritage Properties ........................................................................................................................... 102
Brownfield Sites ................................................................................................................................ 102
Vacancy Rebates ............................................................................................................................... 103
DIVISION OF RESPONSIBILITIES IN TWO‐TIER JURISDICTIONS ............................................................. 104
USING CONSULTANTS ........................................................................................................................... 104
CHAPTER 10 DEALING WITH STAKEHOLDERS ................................................................................ 106
MUNICIPAL STAKEHOLDERS ................................................................................................................. 106
Council............................................................................................................................................... 106
Other Municipal Stakeholders .......................................................................................................... 107
EXTERNAL AGENCY STAKEHOLDERS ..................................................................................................... 108
Working with MPAC .......................................................................................................................... 108
Ministry of Finance ........................................................................................................................... 109
Ministry of Municipal Affairs and Housing ....................................................................................... 109
Ministry of Education ........................................................................................................................ 109
TAXPAYERS ........................................................................................................................................... 109
Residential Taxpayers ....................................................................................................................... 110
Business Community ......................................................................................................................... 110
Major Taxpayers ............................................................................................................................... 110
Customer Service .............................................................................................................................. 111
APPENDIX A Annual Tax Cycle
APPENDIX B Sample Presentation Materials

Property Taxation Guide List of Tables
LIST OF TABLES Table 1.1 Reassessment Schedule ........................................................................................ 12
Table 2.1 Property Classification .......................................................................................... 19
Table 2.2 Assessment Phase‐in ............................................................................................. 21
Table 2.3 Supplementary Assessment .................................................................................. 21
Table 3.1 Municipal Act – Part VIII Municipal Taxation ........................................................ 24
Table 3.2 Ranges of Fairness ................................................................................................ 25
Table 3.3 Optional Average Class Ratio Based on Existing Ratios ........................................ 29
Table 3.4 Optional and Average Class Ratios with New Ratios ............................................ 29
Table 3.5 Municipal Act – Part IX Limitations on Taxes (Capping and Clawback) ................ 31
Table 3.6 Municipal Act – Part X Tax Collection .............................................................. 34‐35
Table 4.1 Schedule of PILT Remittance to Upper‐tier and School Boards .......................... 42
Table 4.2 Schedule of PILT Remittance to Energy Corporations .......................................... 43
Table 5.1 Example of the Four‐Year Reassessment Cycle ................................................... 52
Table 5.2 Illustration of Inter‐Municipal Reassessment Shift .............................................. 55
Table 5.3 Unweighted CVA Inter‐Class Reassessment Shift ................................................. 56
Table 5.4 Weighted CVA Inter‐Class Reassessment Shift ..................................................... 57
Table 5.5 Residential Unit Types – Average Assessment Changes Pre and Post‐ Reassessment .............................................................................................. 59
Table 5.6 Single Family Detached Average Reassessment Increases by Ward .................... 59
Table 6.1 Matching Municipal Objectives and Tax Policies .................................................. 65
Table 7.1 Example of Impact of Broad Class Ratio Change (Applied to Industrial Class) ..... 74
Table 7.2 Example of Reassessment Impacts with No Ratio Change ................................... 75
Table 7.3 Example of Reassessment Impacts with Revenue Neutral Ratios ........................ 76
Table 8.1 Illustration of How Capping and Clawback Works ................................................ 80
Table 8.2 Illustration of Capping and Clawback Calculations ............................................... 81
Table 9.1 Tax Rate Calculation Process ................................................................................ 93
Table 9.2 Schedule of Tax Remittances to Counties ............................................................ 94
Table 9.3 Division of Tax Responsibilities ........................................................................... 104

Property Taxation Guide List of Textboxes
LIST OF TEXTBOXES The Long History of Property Tax ................................................................................................... 7
Special Assessments ..................................................................................................................... 15
Getting Assessments Right Is Not Easy ......................................................................................... 16
Exempt Properties ........................................................................................................................ 17
The Origin of Transition Ratios ..................................................................................................... 27
Fees v. Taxes ............................................................................................................................... 37
City of Montreal v. Montreal Port Authority ................................................................................ 41
The “Cat Hospital” and the Evolution of Tax Impact Mitigation Measures ................................. 88
Beware Major Appeals! ................................................................................................................ 99


Property Taxation Guide 1
CHAPTER 1
HISTORY AND
RATIONALE FOR
PROPERTY TAXES This chapter describes the basic characteristics of the property tax in Ontario. A brief history of the tax in the province in also provided.
PROPERTY TAX BASICS
For readers who are new to property tax matters, it will be useful to set out some basic information about how the property tax works. The terms and concepts described below are fundamental to the discussion ahead and also help understand property tax issues.
Terminology surrounding the property tax does, however, differ. While Canadians usually refer to it as property tax, it is sometimes called real estate tax, realty tax, millage tax, ad valorem tax, or real property tax. Regardless of the label, all property tax systems share a number of important characteristics and tend to function in similar ways. The best way to understand how the tax works is to review some basic terms and features such as the tax base, property classes, assessment, tax rates, the incidence of the property tax, and what the property tax pays for.
The Property We Tax
The property tax is an indirect tax imposed on wealth. The form of wealth being taxed is the value of property owned. Property does, however, come in various forms. Land, and improvements constructed on the land, are referred to as real property while moveable items such as machinery and equipment are termed personal property. Most property tax systems target both land and improvements. However, in a few places only the land

2 Chapter 1
component is taxed (a system commonly referred to as a land or site value tax). Another option is to tax land, improvements and tangible personal property such as machinery, equipment, and other personal possessions (a comprehensive ad valorem tax.). The current property tax in Ontario focuses on real property—land and improvements—but also includes items such as heating and ventilation equipment that are permanently attached to improvements.
Property Classification
In structuring the property tax system, classes of property are often established based upon usage. Property is typically classified as residential or non-residential. Within these two classes are more specific categories. For example, property in the residential class is often categorized as either single-family residential or multi-family. In the non-residential class several categories may be used such as industrial (heavy and light), utility, commercial, retail, forestry, farm or agricultural, mining, and recreational. Systems of property classification differ widely between jurisdictions, typically turning on the degree of specificity by which property is classified. The major divisions in Canadian property tax systems tend to include single-family residential, multi-family residential, farm, industrial, and commercial.
Assessment—Measuring Property Value
The basis of the property tax is not strictly the market value of property but rather “assessed value” which is determined by taking account of rules, assumptions and criteria established by legislation. Assessed value may also often be influenced by precedent decisions of boards and courts. A key component of the Ontario property tax system is therefore the process by which the monetary value of a property is established for purposes of taxation.
Two expressions of value underlie most assessment systems—rental value and capital value. Under the first, assessed values of properties reflect the annual rents that could be expected. In comparison, capital value assessments equate to the amount for which properties sell in an open market. Capital value is the basis of most assessments in Ontario.
Many property tax systems provide for variations in the portion of assessed value that is taxed. Some systems tax all properties at 100% of assessed value while others employ fractional assessments. This enables properties of different types or values to be treated differently.
A final consideration is who will carry out the assessment function. Options include professional assessors employed by the local taxing authority, an independent assessment authority or agency (as in Ontario), provincial
Property Taxation Guide 3
staff, or private valuation organizations operating under contract.
Tax Rates—Calculating Property Tax
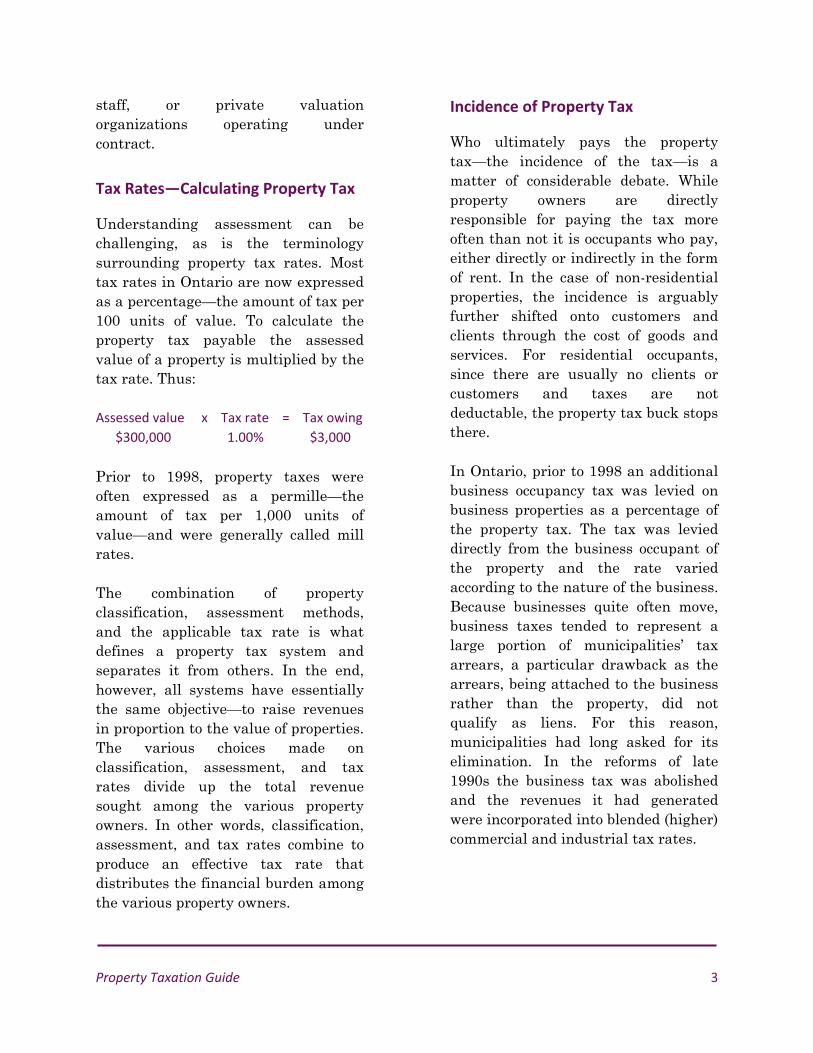
Understanding assessment can be challenging, as is the terminology surrounding property tax rates. Most tax rates in Ontario are now expressed as a percentage—the amount of tax per 100 units of value. To calculate the property tax payable the assessed value of a property is multiplied by the tax rate. Thus:
Assessed value x Tax rate = Tax owing
$300,000 1.00% $3,000
Prior to 1998, property taxes were often expressed as a permille—the amount of tax per 1,000 units of value—and were generally called mill rates.
The combination of property classification, assessment methods, and the applicable tax rate is what defines a property tax system and separates it from others. In the end, however, all systems have essentially the same objective—to raise revenues in proportion to the value of properties. The various choices made on classification, assessment, and tax rates divide up the total revenue sought among the various property owners. In other words, classification, assessment, and tax rates combine to produce an effective tax rate that distributes the financial burden among the various property owners.
Incidence of Property Tax
Who ultimately pays the property tax—the incidence of the tax—is a matter of considerable debate. While property owners are directly responsible for paying the tax more often than not it is occupants who pay, either directly or indirectly in the form of rent. In the case of non-residential properties, the incidence is arguably further shifted onto customers and clients through the cost of goods and services. For residential occupants, since there are usually no clients or customers and taxes are not deductable, the property tax buck stops there.
In Ontario, prior to 1998 an additional business occupancy tax was levied on business properties as a percentage of the property tax. The tax was levied directly from the business occupant of the property and the rate varied according to the nature of the business. Because businesses quite often move, business taxes tended to represent a large portion of municipalities’ tax arrears, a particular drawback as the arrears, being attached to the business rather than the property, did not qualify as liens. For this reason, municipalities had long asked for its elimination. In the reforms of late 1990s the business tax was abolished and the revenues it had generated were incorporated into blended (higher) commercial and industrial tax rates.
4 Chapter 1
What Does Property Tax Pay For?
Property tax raises revenue to fund local government expenditure and is the major source of funding for Ontario municipalities. As such, it is primarily used to fund municipal services. However, a significant portion of all property tax in Ontario—about 25 percent—is used to fund education.
EVALUATING THE PROPERTY TAX
Since it was introduced in Ontario the property tax has been widely disliked. Property owners complain that it is unfair while academics and politicians criticize it as regressive. Municipalities express concern about their over-dependence on the tax. All agree that the current system is complicated and difficult to understand. Yet the property tax continues to be the single most important source of revenue for local governments, and is arguably more important now than ever in its two hundred year old history. Like democracy there is a consensus that the property tax is the worst system possible—except for all the others.
This guide does not provide a detailed evaluation of the strengths and weaknesses of the property tax. However, a brief review of the key principles is useful to an understanding of the recent changes to the property tax system. The review describes the criteria for evaluating taxes and examines how the property tax stacks up against them.
Equity
Equity or fairness is critically important when evaluating a tax. There is widespread agreement that taxes should treat everyone “fairly.” At the same time, the concept of equity is not straightforward. The matter itself is multi-faceted and what is considered fair is subjective. Achieving absolute equity in taxation is impossible given our limited ability to measure the effects of all taxes on all individuals. But within this constraint how does the property tax measure up?
Broadly speaking, there are two basic (but competing) principles of tax equity—the benefits principle and the ability to pay principle. Under the benefits principle those who benefit from a service that is paid for by a tax should be responsible for paying the tax. Further, the tax paid by an individual should approximate the cost of the benefits received. The ability to pay principle ignores these considerations and instead judges equity based on the degree to which the amount of tax a person pays is aligned with their ability to pay. In other words, those with higher income or wealth should pay more tax while those with lower income or wealth should pay less tax. Each principle is discussed below in more detail.
Property Taxation Guide 5
Ability to Pay
The property tax is often defended based on ability to pay considerations. This defence is based on the underlying assumption that the value of property a person owns correlates reasonably well with their wealth, and therefore, the ability to pay. In many instances this may well be the case, but in others it is clearly not. For example, a family might purchase a modestly-priced home with correspondingly affordable property taxes only to see the taxes increase and eventually outpace their income because gentrification of the neighbourhood has made their property more valuable. The fact that property taxes may increase while incomes remain stable or shrink makes the tax especially difficult for some to deal with. Senior citizens and those with fixed or low incomes are frequently affected by this problem.
It is conventional wisdom that the property tax is regressive and it is often criticized for this reason. However, the degree to which this is the case depends on many factors such as the type of property, the assessment practices, and the availability of tax credits, rebates, refunds, deferrals and other relief for those with low incomes. Also, effective tax rates may be varied across property classes with the aim of addressing ability to pay inequities. Ultimately therefore, the regressivity of the property tax depends on local circumstances. For this reason there is no broad consensus on the matter.
Benefits Received
The property tax usually fares better under the benefits measure of equity for three reasons. First, the tax supported services that are provided by a municipality clearly benefit local residents and employees. Second, the property tax that pays for the services is broadly applied: all residents and employees in a municipality pay property taxes either directly or indirectly. Finally, since most municipal services are property-related—the need for services being driven by property characteristics—a taxation method based on property is particularly appropriate. However, there are weaknesses in the link between taxes and benefits:
The property tax payable does not always reflect the cost of using services or the cost of providing infrastructure. These costs are likely to vary based on factors such as the number of residents/employees or location rather than assessed value.
As the property tax seldom applies uniformly across all properties the usage or cost of municipal services and infrastructure is even less likely to reflect the benefits received.
A number of government services
that are paid for from property taxes are unrelated to property. This is particularly prevalent in Ontario where the property tax is

6 Chapter 1
used to fund education and a wide range of social services.
The beneficiaries of local
government services are not limited to local property owners and residents. Some municipalities, especially large cities, attract visitors who use services for which they do not pay property taxes.
Because of these shortcomings the property tax does not always match up with the benefits received principle in terms of the practical realities of who is paying for and benefitting from municipal services.
Other Considerations
The fact that the property tax does not fare well under either the ability to pay principle or the benefits received principle tends to support the argument that the tax lacks fairness and equity. But despite these criticisms the property tax has been remarkably resilient. This is because, although equity is important, there are other characteristics that make the property tax attractive as a revenue source. Other considerations include:
Flexibility – how easily can the tax be changed to meet changing budgetary requirements. In this respect, the property tax is quite practical since the mechanism for increasing the tax is relatively straightforward. However a drawback is that, unlike income or sales taxes, the tax does not adjust
automatically to changes in income and prices. Instead new tax rates must be set annually. Certainty – is the amount of tax, and the time and manner of payment, predictable (from the perspective of those who pay the tax as well as those who rely on the revenue). Certainty is perhaps the most appealing aspect of the property tax from the municipal perspective as tax amounts are highly dependable. Also of great benefit to municipalities is that property tax avoidance remains low compared to other forms of tax and property tax revenues are relatively immune to economic circumstances. Finally, the time and manner of payment of the property tax is predictable for municipalities and taxpayers. The one shortcoming for taxpayers is a perception that the amount payable can be very uncertain since it is dependent on shifts in market values. Simplicity – how easy is the tax to administer. In theory the property tax is easy to calculate; in practice it is extremely complicated. This is especially true in Ontario in the case of non-residential properties where complex capping and clawback rules apply. Even the tax rate structure of a municipality can be surprisingly involved because of the numerous combinations of property classes. When coupled with upper-tier and education taxes or area

Property Taxation Guide 7
ratings it is quite possible for tax rates to number in the hundreds. Accountability – how sure can taxpayers be that their taxes are being used appropriately. For taxpayers, the amount to be paid in taxes is very clear (unlike income taxes which are deducted at source or sales taxes which are paid in small amounts on many transactions). This means that the property tax is highly visible and municipalities face close scrutiny for how it is spent.
The strengths and weaknesses of the property tax are magnified because of the degree to which municipalities have come to rely upon it to pay for services. Unlike in other places, especially the United States where there is access to many sources of revenue, Canadian municipalities rely heavily on the property tax. Almost 70% of local government’s own source revenue in Ontario was generated by the tax in 2008.1
1 Statistics Canada, CANSIM, Table 385-0003
The Long History of Property Tax
In Europe, the benefits of a property tax
has long been recognized given that
“real” property has always generally
been immovable, was the primary source
of wealth under the feudal system that
developed during the medieval period,
and was relatively easy to assess for
valuation purposes. Once central
governments were able to maintain
records of who owned what land –
something English governments had
done successfully from the eleventh
century “Domesday” survey onwards – a
system of taxation on property owners
was possible.
Medieval systems were often
sophisticated enough to estimate
property income as a basis for calculating
taxes. This worked as long as the number
of properties being assessed remained
low and the government was able to
coordinate the activities of assessors
over its jurisdiction. The rise in
population and urbanization of Europe
made this type of assessment more
complicated. From the seventeenth
century onwards assessment began to be
done on the basis of what could be
valued by examining property
characteristics quickly and from afar: the
number of hearths, windows, or (much
later) bricks in the buildings for example.

8 Chapter 1
PROPERTY TAX HAS BEEN FOUNDATION OF LOCAL GOVERNMENT FINANCE SINCE 18TH CENTURY
The property tax has a history going back to ancient times. Not only is it one of the oldest known taxes, it is one of the most enduring. Governments worldwide employ some form of property tax. This section provides a very short history of the property tax in Ontario with a view towards understanding the current tax regime and how it might change in the future. The history can be divided into three periods:
Early Days – from its adoption in the eighteenth century to the 1960s. Push for Reform – a thirty year period starting in the 1960s that largely matched Ontario’s post-war boom. Problems with the tax system were identified and (through numerous reviews) various attempts to change the system were started but never fully implemented. Reform and Aftermath – initiated in the 1990s and still ongoing.
Early Days
The first assessment legislation in Upper Canada was enacted in 1793, though governments in British North
America and New France before it had been taxing property for many years prior. Under the Assessment Act of 1793 taxable property included “real or personal property, goods or effects” which were to be valued by local Justices of the Peace reporting directly to the Provincial government. The real beginning of municipal government in Ontario is usually dated from the Municipal Act of 1849 (commonly known as the Baldwin Act). It instituted a municipal structure in Ontario that is familiar today—cities, towns, villages, and townships, and the county system for southern Ontario. The Act made provision for the levying of property taxes by the local municipalities and for the requisitioning of tax funds by the counties (as today). The new municipalities were also required to provide property tax support for schools. As a corollary to the Baldwin Act, the Assessment Act was reformed. Many of the concepts and much of the wording in the present-day Assessment Act can be found in this piece of legislation. It included a definition of land and of taxable properties. It set out exemptions (Crown properties, churches, schools, charities and public libraries). Property taxes constituted a lien on land, and in the event of default land could be sold for taxes, subject to a right of redemption by the former owner within three years.

Property Taxation Guide 9
In 1866 an income component was added to the definition of personal property. This was removed in 1904 when all personal property was itself removed from the property tax base. From then on only land plus fixed improvements were treated as assessable. The 1904 reform also introduced a graduated business tax based on a specified percentage of assessment, depending on the activity occurring in the property. Other than these changes, over the 100 years between the 1850s and the 1950s the property tax system in Ontario experienced steady growth and incremental change but no major restructuring.
Push for Reform
Despite being part of the municipal finance framework for over 150 years, the property tax had never been popular in Ontario. Criticisms of assessment methods, particularly discrepancies in valuations between municipalities, were common. Of greater concern was the growing sense that the system was not able to respond to increasing urbanization and industrialization that was having a profound effect on the value of real property in many parts of the province. In 1967, as part of a comprehensive review of taxation in Ontario, the Smith Committee released a report that was highly critical of the property tax system. Amongst its main findings were that the assessment system was inaccurate and unfair. In some
municipalities assessments were 50 years out of date; in others they were virtually up to date. Aside from a generally regressive impact, this was creating many inequities between individual taxpayers, classes of taxpayers, and municipalities. Among the many recommendations of the Smith Committee was that a standardized method of assessment be adopted and that real property be valued according to “actual” (i.e. market) value. Thus began a thirty year effort to reform the system. The first step was taken in 1969 when responsibility for assessment was transferred to the Province (though valuation years still varied from municipality to municipality). However, it was quickly realized that a sudden change to market value based assessment would result in significant shifts in the tax burden from previously overvalued properties to those that had been undervalued. How to mitigate those shifts, even when there exists broad consensus that they are required in order to achieve a fairer system, has been the challenge of policymakers ever since the Smith Committee issued its report. The thirty years following the Smith report were marked by a series of delays and legislative tinkering as politicians searched without success for a comprehensive reform that would avoid unpalatable tax shifts. These efforts were interspersed by further study: the Blair Commission in 1977; the Provincial-Local Government
10 Chapter 1
Committee in 1978; David Goyette in 1985; and the Ontario Fair Tax Commission in 1993. Each report reinforced the same message: the existing assessment and property tax system was archaic, inequitable and needed wholesale reform.
Property Tax Reform
In 1995 a Conservative government was elected in Ontario on a “Common Sense Revolution” platform. While the platform did not explicitly mention property taxation or municipal government the government’s goal of reforming education inevitably led to changes in the structure of municipal finance. As a result, municipal reform took on a life of its own. The funding of schools through property taxes had been a fact in Ontario since the Baldwin Act. The result was that education funding varied greatly from municipality to municipality depending on the size of the assessment base. In 1996, the new government began a review of provincial-municipal service delivery arrangements known as “Who Does What” with the aim of taking direct control of education, including responsibility for most (though not all) of its funding. In exchange for relieving municipalities of a portion (50%) of the cost of school funding the Province “downloaded” new responsibilities to municipalities (such as Provincial roads, social and paramedic services). A further significant change was that municipalities became much more
reliant on property taxes and user charges as Provincial transfer payments (grants) were reduced. At the same time the government implemented a province-wide market value based system of assessment termed “current value.” For the first time the assessed values of all properties across Ontario were to be on a common and understandable basis. Properties were initially assessed using June 30, 1996 values and were to be updated annually. At the same time, assessment functions were transferred to a Crown corporation, the Ontario Property Assessment Corporation (now the Municipal Property Assessment Corporation or MPAC), which was funded by municipalities. Equally significant was the associated changes made to tax rates and the considerable autonomy given to municipalities on tax policy matters. Prior to the reforms only two tax rates applied: residential or commercial, with the difference between the two being 15%. The two rates were expressed as “mills.” This simple structure was however very misleading since, because of substantial inequities in assessed values, the effective tax rates for different types of properties varied widely. Under the new system mill rates were replaced with tax rates representing the percentage of assessed value to be paid as tax. Far more substantial however was the change in the number of rates. Instead of two rates municipalities now required at least seven rates reflecting
Property Taxation Guide 11
the basic (new) classes of property (including, in a later reform, vacant status). In municipalities with complex tax policies and properties subject to special treatment the rates could number into the hundreds. The Province also designated optional classes for office towers, shopping centres, parking lots, and large industrial properties to address potentially major tax shifts in a number of municipalities, particularly in the newly-amalgamated City of Toronto. The need for this more complex property classification structure stemmed from the ever present challenge of property tax reform—the need to mitigate excessive tax shifts. For this reason, above and beyond the mitigating effect of variable tax rates for different property classes, the Province introduced restrictions—“ranges of fairness”—on municipalities’ ability to change tax rates by class.
Aftermath—the Last Ten Years
“A small degree of uncertainty is a much greater evil than a very considerable degree of
inequality” (Adam Smith)
The last ten years of the property tax in Ontario has been a period of contrast: on the one hand a continued drive to implement the basic reforms; on the other a series of measures designed to minimize the shifts in tax burdens that come with reform.
Soon after the new system came into effect it became apparent that the mitigation measures provided in the new legislation were insufficient to offset some tax shifts, particularly in the non-residential sectors. To address this, the Province introduced a mandatory program of “capping and clawbacks.” Under the program (referred to as the 10-5-5 program until it was later modified) tax increases on commercial, industrial, and multi-residential properties were capped. To fund the tax caps “clawbacks” were applied to properties entitled to tax reductions. While the capping program remains in place many adjustments have since been made to it to address anomalies that have arisen. Most notable was the change in the treatment of new properties (see Chapter 8). The Province also began to extend the schedule for assessment updates. The original reforms had planned for assessment updates to occur annually after a transition period. In the last ten years the schedule has been postponed on several occasions and is now set on a four year basis (see Table 1.1).

12 Chapter 1
Table 1.1
REASSESSMENT SCHEDULE
Taxation Year Valuation Date
1998 – 2000 June 30, 1996
2001 – 2002 June 30, 1999
2003 June 30, 2001
2004 – 2005 June 30, 2003
2006 – 2008 January 1, 2005
2009 – 2012 January 1, 2008
2013 – 2016 January 1, 2012
Moreover, in 2007, the Province introduced a mandatory phase-in of assessment increases on residential, farmland and managed forest properties. Under the new provisions assessment increases were phased-in equally over the four years of the reassessment cycle. The 2008 Provincial Budget extended the phase-in of assessment increases to all property classes. In contrast, for properties which have lower assessments the full decrease applies in the first year. While this provision does favour decreasing properties, in reality they are still subsidizing the increasing properties since their taxes continue to be higher than they would be without the phase-in for increasing properties.

Property Taxation Guide 13
CHAPTER 2
ASSESSMENT
LEGISLATION There are more than 4.7 million properties in Ontario; which in 2009 were valued at more than $1.7 trillion. This chapter discusses the rules for how these properties are assessed for property tax purposes.
There are a number of Acts and Regulations dealing with assessment in Ontario. Most important is the Assessment Act. The Act sets out the rules defining what is assessable property, how values are to be determined, and the process for challenging assessments. While municipalities are not responsible for assessments it is essential that municipal finance staff have a sound understanding of assessment legislation and how the Municipal Property Assessment Corporation undertakes its work.
What Property Is Assessed?
Property taxes in Ontario are based on the value of real property—land and improvements. Included in the definition of real property under the Assessment Act is land covered with water, trees and underwood growing on the land, natural resources in and under the land, and all buildings, structures and items permanently fixed to either the land or the improvements. Of importance to municipalities is that, while all real property is assessed, not all of it is liable for property taxation.
Who Prepares the Assessment?
As part of the reforms of the late 1990s responsibility for assessment functions was transferred on December 31, 1998 to an independent assessment authority: the Ontario Property

14 Chapter 2
Assessment Corporation (OPAC), later renamed the Municipal Property Assessment Corporation (or MPAC). The role of MPAC is to: determine which properties are
entitled to be exempt from property taxation;
determine the assessed values of properties;
classify properties according to the regulations;
prepare and deliver an annual assessment roll to municipalities; and
defend assessment appeals. MPAC is a non-profit crown corporation funded by Ontario’s municipalities. The formula used to calculate the share of funding for each municipality is based 50% on the number of properties on its assessment roll and 50% on the value of its assessment base. Payments to MPAC are made by upper and single-tier municipalities. All Ontario municipalities are members of MPAC. The corporation is governed by a Board of Directors comprising five taxpayers, eight municipal representatives, and two provincial appointees. Assessment functions are carried out through regional offices and sub-offices.
How Is Property Assessed?
“Current value” is the measure of property value prescribed by the Assessment Act. Under the Act, current value (commonly referred to as CVA) is defined as “the amount of money the fee simple, if unencumbered, would realize if sold at arm’s length by a willing seller to a willing buyer.” Most of the time CVA reflects the actual price a property sells for. However, this is not necessarily always the case. A property may be sold in a hurry or because it was encumbered with a long-term below mortgage lease. Property valuation, or appraisal, has become increasingly sophisticated with the advent of better training for assessors and computer programs that can track sales and market data. Today, complex regression analysis is a key tool in valuing properties. Very broadly, the three approaches used for valuation are: sales comparison approach income approach cost approach Residential properties are assessed using the sales approach which compares the value of the subject property to the sale prices of similar and surrounding properties.

Property Taxation Guide 15
The income approach, used for properties such as rental apartments, retail centres, and office buildings, capitalizes an income stream using a standardized rate of return to produce an estimate of the value of the property. The cost approach, used mainly for industrial properties where much of the value is on improvements to the land, involves estimating the cost of replacing the improvements on a property (less any depreciation that has occurred) and adding the land value. In using the three approaches, a range of factors that influence property value are taken into account. For example, in addition to sale prices, MPAC looks at up to 200 factors when assessing residential properties including the age of the house, building area, location, lot dimensions, and quality of construction. Other factors considered under the three approaches include the highest and best use of the property and market rents. Approaches to valuation are discussed in more detail in Chapter 5.
Special Assessments
Establishing current value can be difficult. Much
of the Assessment Act and its Regulations
therefore prescribe detailed methods for a
number of special property types.
One example is Regulation 282/98 section 45.3
which deals with the current value of hotels. It
requires that when MPAC uses a “pro‐forma”
income approach to estimate current value no
more than 5% for a management fee allowance
and 15% for the value of “personal property”
(furniture fixtures and equipment) can be used
unless another percentage can be justified.
While seemingly rather obscure, these
requirements stem from a series of assessment
appeals in the 1970s concerning the “correct”
approach of valuing hotels.
The central issue in most of these appeals was
the concept of “enterprise value.” Hotels are
properties where the real estate component and
the enterprise value of running the business are
very closely connected. Since assessments are
restricted to real property considerable
judgment is needed to avoid incorporating
enterprise values into assessments. The
legislation, as it is now, reduces some of the
judgment from the assessment process.
Issues around enterprise value have also arisen
in connection with the valuation of golf courses.
Because of this, some appeals against
assessments from 1998 remain unresolved.
Other types of property for which specific
assessment approaches are prescribed include
farm lands and buildings, managed forests,
woodlands, orchards, pipeline and utilities,
certain large commercial theatres in the City of
Toronto, convention centres, bridges and
tunnels, and railway lands and infrastructure.

16 Chapter 2
Getting Assessments Right Is Not Easy
Among the most positive outcomes of
moving to Current Value Assessment is that
assessed values generally correspond to
something most property owners
understand: the value of their property. This
is in sharp contrast to the pre‐1998 reform
situation where, in many municipalities,
homes had assessments of less than $10,000
but a market value in the hundreds of
thousands. At the same time this new
transparency places MPAC under broad
scrutiny as well as individual challenges from
property owners who think their assessment
is wrong.
For the sake of equity, it is important that
similar properties in the same locale have
similar assessments even if the sale prices of
individual properties vary widely.
Discrepancies between CVAs and sale prices,
and the manner in which MPAC has
addressed them, has led to complaints about
the fairness and transparency of the
assessment system.
In response to such complaints the
Ombudsman of Ontario conducted a review
of MPAC in 2005. Among the
recommendations in his subsequent report,
entitled “Getting it Right“, were that:
MPAC provide more information to taxpayers on how assessments were determined (for example, by providing the average increase in assessed value of a home in the particular neighbourhood rather than just the average for the municipality and by providing details of its computerized appraisal methods);
MPAC accept the importance of the sale price of a home in determining current value; and
the burden of proof of current value in an assessment appeal lie with MPAC rather than the property owner.
Given the complexity and subjectivity
involved, it is probably inevitable that there
will continue to be disagreements about
assessments.

Property Taxation Guide 17
Exemptions
Although all real property in Ontario is assessed not all of it is subject to taxation. Some of the exemptions have constitutional roots, in particular the exemption for properties owned by governments which cannot be taxed because they represent the Crown. There is also a long tradition of exempting from taxation properties associated with organizations and activities that fulfill a public interest. However, such exemptions often come with strict conditions (for example land at battle sites is exempt provided it is “kept open to the public in order to promote the spirit of patriotism”). The text box that follows summarizes the long list of exemptions under the Assessment Act. More details can be found in sections 3 to 6 of the Act and the associated regulations. While there are a large number of properties that are exempt from property taxes many of them generate other forms of revenue. The most important are the Payments in Lieu of Taxes (PILTs) that are paid in respect of properties owned by the Provincial and Federal governments. Other forms of payment include “Heads and Beds” levies on facilities such as colleges, universities, and hospitals which are determined by, amongst other measures, student enrollment or numbers of hospital beds. Separate legislation regulates how PILTs and Heads and Beds are calculated and administered (see Chapter 4).
Exempt Properties
Crown lands (land owned by Canada or any
province) | cemeteries, burial sites, and
crematoriums, as well as land owned by a
religious organization or municipality for
“bereavement related activities”| churches (and
associated land) | schools, colleges, and
universities | non‐profit philanthropic, religious,
and education seminaries (up to 50 acres) |
public hospitals | children’s treatment centres
that receive Provincial aid (owner‐occupied
portions only) | care homes with charitable
status | highways and toll highways | municipal
property | Boy Scouts and Girl Guides property |
houses of refuge | charities | children’s aid
societies | scientific, literary, agricultural, and
horticultural institutions | battle sites |
exhibition buildings of companies | machinery
and equipment | one acre of forestry for every
ten acres of farmland up to 20 acres (and subject
to several other conditions) | mineral land,
minerals, and associated machinery and
equipment | certain property of telephone and
telegraph companies | improvements on land
with residential units for seniors and persons
with disabilities (subject to conditions) |
additional residential units for seniors (subject to
conditions) | amusement rides | airports |
conservation land | large non‐profit theatres
(subject to conditions) | hydro‐electric
generating stations | poles and wires |
international bridges and tunnels (including duty‐
free stores) | land owned by religious
organizations used for recreation | land owned
by the Navy League of Canada | land used by
veterans

18 Chapter 2
Property Classification
A second key task that the Assessment Act requires MPAC to undertake is the classification of properties for taxation purposes. The Act prescribes seven main property classes which are used as the primary basis for dividing the tax levy between properties. These main property classes are: residential, multi-residential, commercial, industrial, pipeline, farm, and managed forest. Each class is assigned a Realty Tax Class (RTC) code by MPAC. In addition, there are a number of additional “optional” classes municipalities may adopt for the purposes of further refining the division of the tax levy requirement. The optional classes include: new multi-residential buildings, office buildings, shopping centres, parking lots and vacant land, large industrial properties, professional sports facilities (added in 2000), resort condominiums (added in 2005), and residual commercial (added in 2008). The residual commercial optional class contains those properties within the commercial class that do not fall in one of the other optional classes together with the first 25,000 square feet of properties in the office building and shopping centre optional classes. For the purpose of providing tax reductions for underutilized land, the Assessment Act also prescribes the following property sub-classes:
farmland awaiting development (for residential, multi-residential, commercial and industrial property classes);
vacant land (for the commercial and industrial classes); and
excess land (for the commercial and industrial classes).
The farmland awaiting development sub-class is further divided into two sub-classes based on whether a building permit has been issued for the property. There is also a sub-class for newly constructed commercial and industrial properties. These properties are eligible for special treatment for capping purposes (see Chapter 8) and may be entitled to reduced business education tax rates (see Chapter 4). MPAC assigns a Realty Tax Qualifier (RTQ) code to each sub-class. Altogether, there are more than 70 different combinations of property classes and sub-classes that may be specified (see Table 2.1 below). The full list of RTC and RTQ designations is provided in the file FIR2010 Tables on the FIR website. http://csconramp.mah.gov.on.ca/fir/welcome.htm

Property Taxation Guide 19
Table 2.1
PROPERTY CLASSIFICATION
Classes Optional Classes Sub‐Classes
Residential Farmland Awaiting
Development (2 sub‐classes) Multi‐Residential New Multi‐Residential
Commercial Office Building
Shopping Centre
Parking Lot / Vacant Land
Residual Commercial
Farmland Awaiting
Development (2 sub‐classes)
Vacant Land
Excess Land
New Construction Industrial Large Industrial
Pipeline
Farm
Managed Forests
Professional Sports Facility
Resort Condominium
Note: The Professional Sports Facility class includes only the Corel Centre in the City of Ottawa and the Air Canada Centre, Maple Leaf Gardens, and the Rogers Centre in the City of Toronto.
The effective date for the classification of land for assessment purposes is June 30 of the previous year.
Assessment Roll
Key among MPAC’s responsibilities is the preparation of the annual assessment roll for every jurisdiction in the province (municipal and non-municipal) (see section 14 of the Assessment Act). The roll contains information about property characteristics, ownership, classification, and current value (including the value of the land liable for taxation). The assessment roll must be submitted to municipalities by the
second Tuesday after December 1 in preparation for the upcoming tax year (though MPAC can, under section 36 of the Act, extend this deadline). For municipalities, the assessment roll, in addition to its key property tax function, is important as an enumeration list for elections, a jury list, a list identifying school board support (for education funding purposes), and a list of those who qualify for special rights or privileges (for example, French-language rights). The assessment roll is managed by MPAC and is different from the tax roll, which is a municipal responsibility

20 Chapter 2
under the Municipal Act. Thus, when a change in the assessment roll—a change in property classification or tax liability for example—triggers the need to make a corresponding change in the tax roll it is the responsibility of the municipality (usually the municipal Clerk or Treasurer) to make the change as well as associated adjustments to property taxes. The Clerk of a municipality is, however, responsible for making the assessment roll available for public inspection after it has been delivered to the municipality by MPAC.
General Reassessments
The periodic province-wide updates of assessments are called general reassessments. Since the 1998 reforms general reassessments have taken place at various intervals and are currently on a four-year cycle that began in the 2009 taxation year. For the four year period 2009 to 2012 assessments are based on a valuation day of January 1, 2008. Interestingly, provincial elections are also on a four-year cycle, the dates of which fall in the middle of the general reassessment cycle. MPAC is responsible for notifying property owners of certain changes to how their property is described on the assessment roll.
Assessment Phase In
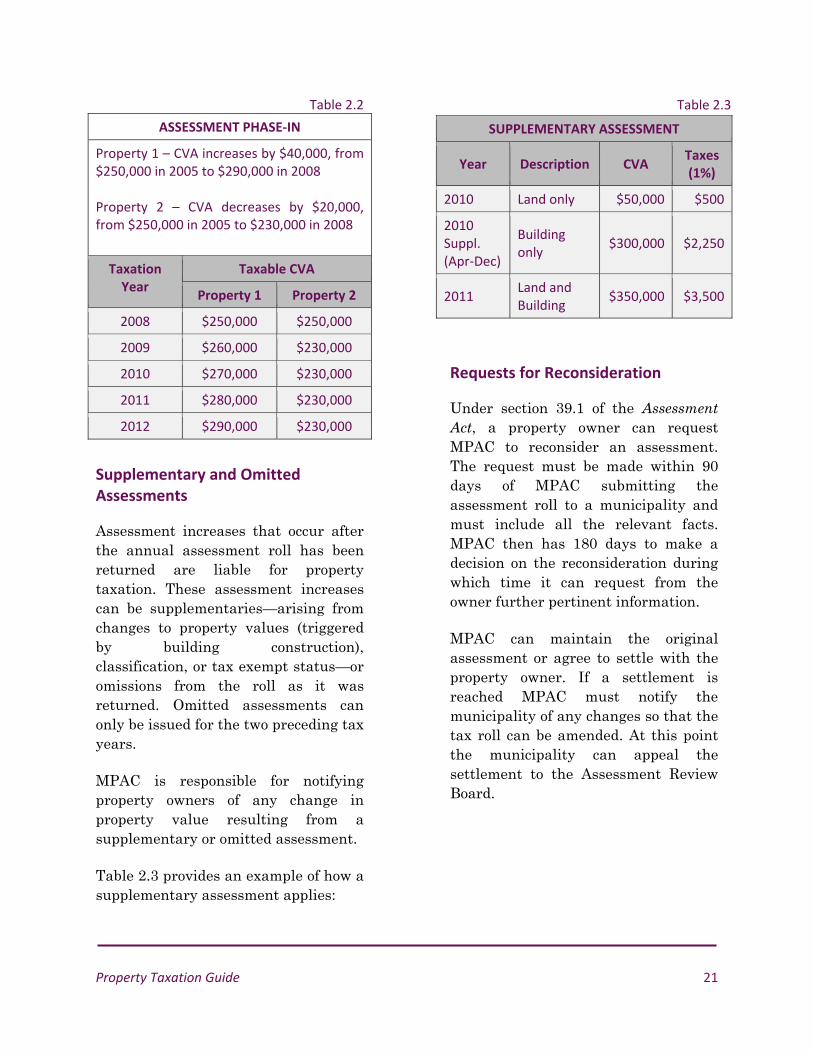
An important amendment to the Assessment Act affecting the results of general reassessments was made in 2007 when a mandatory four-year phase-in of assessment increases on residential, farm, and managed forest property classes was implemented (the amendment was expanded in 2008 to included the commercial, industrial, and multi-residential classes). Under the amendment, if the CVA of a property increases as a result of a general reassessment, the CVA is to be reduced by 75% of the eligible increase in the first year, 50% in the second year, and 25% in the third year. On the other hand, if the CVA of a property declines the full decrease is to take effect immediately. MPAC is not required to notify property owners of changes resulting from the assessment phase in. The effect of the phase in on the taxable assessment of two properties—one where the CVA increases as a result of a general reassessment and one where the CVA decreases—is shown below in Table 2.2. For a more detailed discussion of property classification, the contents of the assessment roll, and assessment phase in, see Chapter 5.
Property Taxation Guide 21
Table 2.2
ASSESSMENT PHASE‐IN
Property 1 – CVA increases by $40,000, from $250,000 in 2005 to $290,000 in 2008 Property 2 – CVA decreases by $20,000, from $250,000 in 2005 to $230,000 in 2008
Taxation Year
Taxable CVA
Property 1 Property 2
2008 $250,000 $250,000
2009 $260,000 $230,000
2010 $270,000 $230,000
2011 $280,000 $230,000
2012 $290,000 $230,000
Supplementary and Omitted Assessments
Assessment increases that occur after the annual assessment roll has been returned are liable for property taxation. These assessment increases can be supplementaries—arising from changes to property values (triggered by building construction), classification, or tax exempt status—or omissions from the roll as it was returned. Omitted assessments can only be issued for the two preceding tax years. MPAC is responsible for notifying property owners of any change in property value resulting from a supplementary or omitted assessment. Table 2.3 provides an example of how a supplementary assessment applies:
Table 2.3
SUPPLEMENTARY ASSESSMENT
Year Description CVA Taxes (1%)
2010 Land only $50,000 $500
2010 Suppl. (Apr‐Dec)
Building only
$300,000 $2,250
2011 Land and Building
$350,000 $3,500
Requests for Reconsideration
Under section 39.1 of the Assessment Act, a property owner can request MPAC to reconsider an assessment. The request must be made within 90 days of MPAC submitting the assessment roll to a municipality and must include all the relevant facts. MPAC then has 180 days to make a decision on the reconsideration during which time it can request from the owner further pertinent information. MPAC can maintain the original assessment or agree to settle with the property owner. If a settlement is reached MPAC must notify the municipality of any changes so that the tax roll can be amended. At this point the municipality can appeal the settlement to the Assessment Review Board.

22 Chapter 2
Appeals
The CVA, property classification, school support, as well as other information such as misrepresentation can be appealed to the Assessment Review Board (ARB). However, there is no right of appeal for a property in the residential, farm or managed forest property classes unless a request for reconsideration has already been made (though the Board can allow it under extenuating circumstances). An appeal must be filed within 90 days of MPAC’s notice of a decision on a request for reconsideration being mailed. An ARB appeal may be made not only by a property owner but by “any person” including a municipality. In all cases the appellant, the property owner, MPAC, and the municipality are parties to an appeal. The appeal process is regulated by statute (the Assessment Review Board Act) and the Assessment Review Board Rules of Practice and Procedure. The ARB has broad powers over assessment matters and its decisions are final. However, as with its sister organization the Ontario Municipal Board, errors in law can be appealed within 30 days to the Divisional Court. A separate appeal process to the Superior Court of Justice is available to property owners, MPAC, and municipalities, for assessment-related matters outside the jurisdiction of the ARB.
MPAC and municipalities share the responsibility for making the required changes to the assessment and tax rolls arising from ARB decisions. For a more detailed discussion of assessment appeals see Chapter 9.
Confidentiality
Information used in connection with the assessment process can be sensitive. The Assessment Act accordingly places tight restrictions on how this information is to be used (and penalties if it is misused). In general staff at MPAC, municipalities, and school boards who use the assessment roll are prohibited from sharing information with people outside those organizations. Exceptions are made for witnesses who are involved in an assessment appeal. Moreover, municipalities and school boards may only use assessment roll information “sufficient to meet their planning requirements.” That said, the Municipal Freedom of Information and Protection of Privacy Act provides property owners the right to access certain information about theirs and other properties. The extent of such access, and the process by which information can be obtained, is contained in MPAC’s Guidelines for Release of Assessment Data at:
http://www.mpac.ca

Property Taxation Guide 23
CHAPTER 3
THE MUNICIPAL ACT This chapter describes the rules set out in the Municipal Act for how property tax is to be applied by Ontario municipalities.
For Finance departments, the Municipal Act is the legislation that has the most influence on property taxes. The Act has a dual role. It sets out what municipalities are required to do in regard to taxation and what they can do if they wish to establish their own tax policies. Since the reforms of the late 1990s the tax rules that municipalities are obliged to deal with have increased substantially in number and complexity. These rules are set out within the Municipal Act itself but also in a number of regulations. This chapter reviews in detail the sections of the Act that prescribe how municipalities implement property taxation. It also examines the related regulations. Later chapters examine how municipalities can use the legislation to achieve specific tax outcomes through the powers provided through the Act and its regulations. The Act is divided into 18 parts containing more than 540 sections. Property taxation is addressed by three of the parts which in turn contain some 70 sections. This chapter reviews each of these three parts separately. Subsequent chapters deal with how municipalities implement and administer the legislation.
PART VIII – MUNICIPAL TAXATION
The 19 sections in part VIII of the Act address how general and special tax rates are to be established for the different property classes defined in
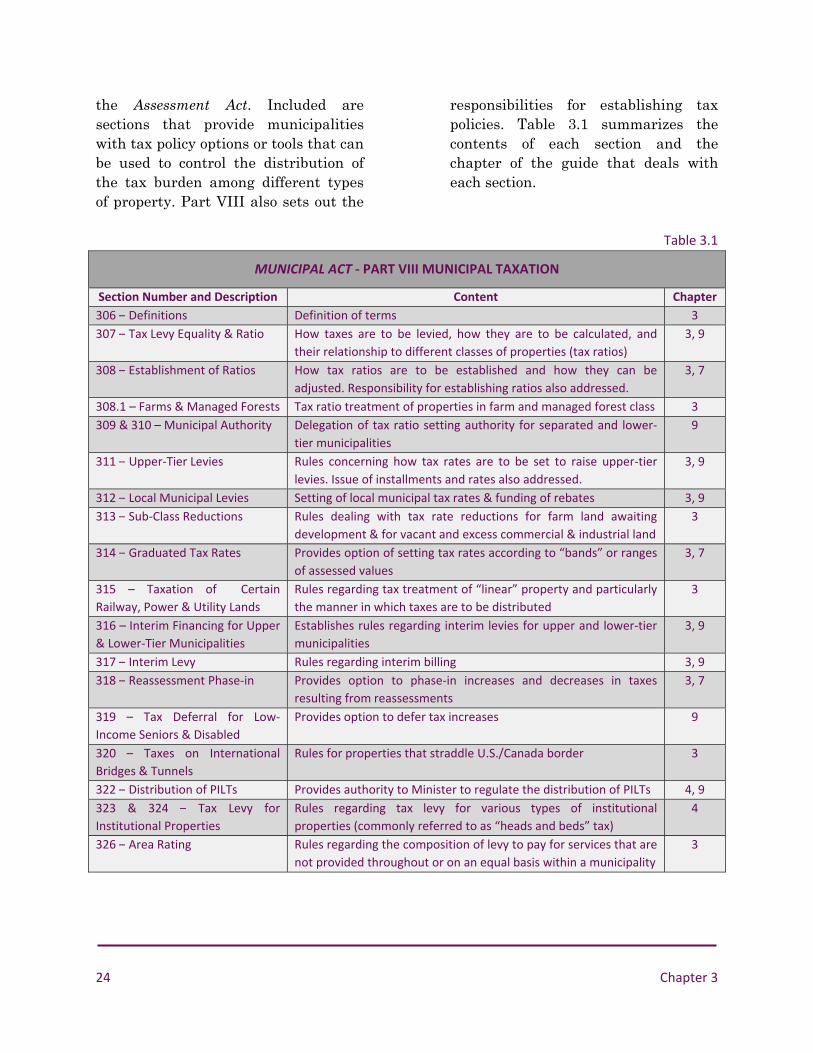
24 Chapter 3
the Assessment Act. Included are sections that provide municipalities with tax policy options or tools that can be used to control the distribution of the tax burden among different types of property. Part VIII also sets out the
responsibilities for establishing tax policies. Table 3.1 summarizes the contents of each section and the chapter of the guide that deals with each section.
Table 3.1
MUNICIPAL ACT ‐ PART VIII MUNICIPAL TAXATION
Section Number and Description Content Chapter
306 – Definitions Definition of terms 3
307 – Tax Levy Equality & Ratio How taxes are to be levied, how they are to be calculated, and
their relationship to different classes of properties (tax ratios)
3, 9
308 – Establishment of Ratios How tax ratios are to be established and how they can be
adjusted. Responsibility for establishing ratios also addressed.
3, 7
308.1 – Farms & Managed Forests Tax ratio treatment of properties in farm and managed forest class 3
309 & 310 – Municipal Authority Delegation of tax ratio setting authority for separated and lower‐
tier municipalities
9
311 – Upper‐Tier Levies Rules concerning how tax rates are to be set to raise upper‐tier
levies. Issue of installments and rates also addressed.
3, 9
312 – Local Municipal Levies Setting of local municipal tax rates & funding of rebates 3, 9
313 – Sub‐Class Reductions Rules dealing with tax rate reductions for farm land awaiting
development & for vacant and excess commercial & industrial land
3
314 – Graduated Tax Rates Provides option of setting tax rates according to “bands” or ranges
of assessed values
3, 7
315 – Taxation of Certain
Railway, Power & Utility Lands
Rules regarding tax treatment of “linear” property and particularly
the manner in which taxes are to be distributed
3
316 – Interim Financing for Upper
& Lower‐Tier Municipalities
Establishes rules regarding interim levies for upper and lower‐tier
municipalities
3, 9
317 – Interim Levy Rules regarding interim billing 3, 9
318 – Reassessment Phase‐in Provides option to phase‐in increases and decreases in taxes
resulting from reassessments
3, 7
319 – Tax Deferral for Low‐
Income Seniors & Disabled
Provides option to defer tax increases 9
320 – Taxes on International
Bridges & Tunnels
Rules for properties that straddle U.S./Canada border 3
322 – Distribution of PILTs Provides authority to Minister to regulate the distribution of PILTs 4, 9
323 & 324 – Tax Levy for
Institutional Properties
Rules regarding tax levy for various types of institutional
properties (commonly referred to as “heads and beds” tax)
4
326 – Area Rating Rules regarding the composition of levy to pay for services that are
not provided throughout or on an equal basis within a municipality
3

Property Taxation Guide 25
Many of the sections in part VIII are easy to understand and therefore need little explanation. Others, however, are complex and can have a significant bearing on a municipality’s tax structure. They deserve close scrutiny.
Section 307: Tax Rates and Tax Ratios
One of the most important elements of Ontario's current property tax system is the authority to apply differential taxation rates to different property classes through the use of tax class ratios. These rates are set within an overall framework that is implemented through the use of “tax ratios.” Tax ratios represent the relationship between the tax rate applicable to the residential property class and the rates for other property classes. Tax rates are required (s.307) to be expressed as a percentage of the assessment for properties in each property class. Municipalities have a considerable amount of flexibility regarding tax ratios but are restricted from setting ratios that diverge further from “target” ranges of ratios prescribed in provincial tax policy. With the exception of farms, managed forests, and multi-residential properties, the ranges are between 0.60 and 1.10 relative to the residential class ratio. These are referred to as the “ranges of fairness.” They are summarized in Table 3.2.
Table 3.2
RANGES OF FAIRNESS
Property Class Range
Residential 1.00
Multi‐Residential 1.00 – 1.10
New Multi‐Residential 1.00 – 1.10
Commercial 0.60 – 1.10
Office 0.60 – 1.10
Shopping Centre 0.60 – 1.10
Parking Lots/Vacant Land 0.60 – 1.10
Professional Sports Facility 0.001 – 1.10
Industrial 0.60 – 1.10
Large Industrial 0.60 – 1.10
Pipeline 0.60 – 0.70
Farm up to 0.25
Managed Forests 0.25
Section 308: Tax Ratio Rules for the Main Property Classes
When the reforms to the property tax were introduced in the late 1990s, the Province prescribed transition ratios for each municipality based on the pre-existing relationship in effective tax rates for the various classes of property. In most municipalities, ratios tended to fall outside the prescribed (or target) ranges of fairness. As a mechanism to enable municipalities to bring ratios towards and ideally within the ranges of fairness, section 308 provides municipalities with the authority to alter ratios on an annual basis. Two rules apply: If existing ratios are outside the
ranges of fairness, they may only be brought closer to the range.

26 Chapter 3
If existing ratios are within the ranges of fairness they may be moved either up or down but not beyond the limits of the ranges.
As with other tax policies, the responsibility for establishing ratios in two-tiered municipalities rests with the upper tier unless authority is delegated to lower-tier municipalities (see Chapter 9). Importantly, the Minister has wide authority to make regulations concerning ratios.

Property Taxation Guide 27
The Origin of Transition Ratios
A key element of the property tax system
introduced in 1998 was tax ratios. Tax ratios
represent the relationship between tax rates
for all non‐residential property classes and the
rate for the residential class. The Act contains a
number of tax ratio‐related terms but perhaps
the least understood are the “transition ratios”,
which refer to the ratios that were prescribed
at the time of the changeover to the new
system.
How were these mysterious ratios established?
The answer, with very few exceptions, is that
they were the ratios between effective tax rates
that applied to the other classes of properties
in the year immediately prior to the
introduction of the reforms. As such they
perpetuated the inequities that existed under
the pre‐reform system, albeit in a much more
transparent form.
In the pre‐reform era there were only two tax
rates—residential and commercial—and the
residential rate was set at 85% of the
commercial rate. In addition, properties
occupied by businesses paid what amounted to
a surcharge in the form of a business tax. The
surcharge rate varied according to the type of
business. As a result, commercially classified
properties paid proportionally more taxes than
properties subject to the residential rate. For
example, a commercially taxed property
occupied by a business to which a 30% business
tax rate applied would have been subject to an
effective tax ratio of 1.53 compared to 1.00 for
a residentially taxed property.
Commercial Tax Rate (1.00) + Business Tax Rate (0.30) = Overall Tax Rate (1.30) Residential Tax Rate 0.85 Effective Tax Ratio 1.30/0.85 = 1.53
The second major reason for the difference
between the effective rate applied to
residential properties compared to other
classes of property was the assessments.
Unlike under today’s system where all
properties are assessed on a common current
market value basis (CVA) prior to the reforms
there was very little consistency between
assessments and market value. As a general
rule residential properties were assessed for
much less relative to their market value than
was the case for other classes of properties.
This was especially true for commercial and
industrial properties. When this factor was
combined with the mill rate and business tax
difference described above the result was an
even larger differential (ratio) between the
effective tax rates applied to residential
properties compared to the rates for other
classes of property. It is these ratio
differences between the taxation of
residential properties and other types of
property immediately prior to the
introduction of the CVA‐based tax system in
1998 that were the basis of the transition
ratios that were calculated by the Ontario
Ministry of Finance.
The transition ratios were the essential link
which enabled municipalities to move to the
new world of CVAs and tax rates while at the
same time roughly maintaining the tax
burdens of each property class at pre‐reform
levels. Importantly, however, while the
transition ratios facilitated a broad status quo
situation at the class level it did not prevent
property‐by‐property tax shifts arising from
the reforms. These shifts proved to be very
substantial and led to the introduction of the
mandatory capping program.

28 Chapter 3
Tax Ratios for Optional Property Classes Within the overall commercial and some industrial classes, properties may fall within what are referred to as optional classes. In the commercial class the optional classes are: shopping centres office buildings parking lots Within the industrial class is an optional large industrial class which can apply to properties with buildings larger than 125,000 square feet. The rules regarding tax ratios for optional classes are different than those for the broad classes. If optional classes are adopted the tax ratios for the optional classes may within certain restrictions be adjusted up or down as long as the overall average ratio for the broad class does not increase. In this way taxes on properties within an optional class can be reduced (by applying a lower tax ratio) while the overall tax on the broad class is maintained through a balancing tax ratio increase on one or more of the other optional classes. The constraint is that if an optional class is above the class average it cannot be increased nor can one below the average be moved up beyond the class average.
In practice, however, most municipalities that reduce ratios on one or more optional classes usually leave the ratios on the other optional classes alone. As a result of doing so the ratio for the broad class declines. The effect of this is that, overall, combined tax revenues from properties within the class are lower. A simple illustration based on the industrial class is shown below in Tables 3.3 and 3.4. In the example, as a result of lowering the ratio for the large industrial optional class from 1.8 to 1.6, the average tax ratio for the broad class is lowered to 1.3333. The tax ratio applicable to other industrial properties (comprising the residual industrial class) is not changed. As a consequence of the industrial class change, other classes are required to absorb the additional tax burden. As the term implies municipalities do not have to adopt optional classes in which case all properties within the broad class are taxed using the tax rate calculated based on the average tax ratio for the class.
Section 308.1: Farm Properties
The long standing practice in Ontario of giving preferential tax treatment to agricultural properties was maintained in the 1998 tax reforms. Specifically, farm properties have tax ratios of 0.25 (or less if a municipality chooses).

Property Taxation Guide 29
Table 3.3
OPTIONAL AVERAGE CLASS RATIO BASED
ON EXISTING RATIOS
Property
Class
Total
Assessment
Tax
Ratio
Weighted
Assessment
Industrial
(Residual) $2.0 million 1.2000 $2.4 million
Large
Industrial $1.0 million 1.8000 $1.8 million
Industrial $3.0 million 1.40001 $4.2 million
(1) Average ratio $4.2 million/$3.0 million =
1.4000
Table 3.4
OPTIONAL AND AVERAGE CLASS RATIOS
WITH NEW RATIOS
Property
Class
Total
Assessment
Tax
Ratio
Weighted
Assessment
Industrial
(Residual) $2.0 million 1.2000 $2.4 million
Large
Industrial $1.0 million 1.6000 $1.6 million
Industrial $3.0 million 1.33331 $4.0 million
(1) Average ratio $4.0 million/$3.0 million =
1.3333
Sections 311 and 312: Upper and Lower‐Tier Levies
These two sections provide the authority to pass tax rate by-laws. The sections contain similar provisions regarding the establishment of both general rating by-laws, which apply to all assessment, and for special rating by-laws generally used for area rating (for which see section 326).
In the case of section 311 dealing with upper-tier levies there are sub-sections requiring lower-tier municipalities to levy for upper-tier tax. It also specifies how installments are to be paid. Rules regarding County levy installments differ from those for other upper-tier municipalities. Section 311 also contains rules dealing with interest on pre-payments of installments and on defaults by lower-tier municipalities. Both sections 311 and 312 permit the Minister to allow upper and lower-tier municipalities to set rates higher than those required to raise the approved levy amounts in order to fund charitable rebates.
Section 313: Farmland Awaiting Development and Vacant and Excess Land in the Commercial and Industrial Classes
A number of special sub-classes of properties are granted tax reductions under section 313 of the Act. In the case of farmland awaiting development the scale of reduction depends upon the stage of development. In the pre-building permit stage taxes can be reduced to between 25% and 70% of the applicable residential rate. For land in the post-permit stage the rate can be between 25% and 100% of the applicable class rate. The special treatment of farmland undergoing development was put in place in order to offset potentially very large tax increases that would otherwise apply as properties worked their way through the development
30 Chapter 3
process and after farmland tax rules ceased to apply. Vacant commercial and industrial and excess land portions of commercial and industrial are also granted reduced tax rates. Section 313 sets the reductions at 35% for industrial properties and 30% for commercial properties. Alternatively, municipalities may, if they choose, apply a single percentage to both classes no less than 30% and no more than 35% (for more see Chapter 9).
Section 314: Graduated Tax Rates
One of the more innovative tax policies introduced as part of the 1998 reforms was the authority to establish graduated tax rates. This authority enables single and upper-tier municipalities to tax commercial and industrial properties at different rates depending upon their CVA. Up to three ranges of values may be established together with specified tax rate relationships. Municipalities can use this tax tool to mitigate, for example, the impact of the tax reforms on small businesses that are located on small lower-value properties. However, because there is never a clear match between the targeted groups and the types of property they occupy the distribution of benefits inevitably lacks precision. For example, if small lower-value properties were targeted in an effort to help small businesses, inevitably some of the benefits would go to large organizations because they too may
occupy small spaces—cell phone company retail outlets are a good example. Graduated tax rates are discussed in more detail in Chapter 7.
Sections 316 and 317: Interim Upper and Lower‐Tier Levies
These two sections are complimentary to sections 311 and 312 which deal with annual levies. They provide the authority and rules concerning interim levies for upper and lower-tier municipalities. Among the items they address are amounts, installments, interest payments, treatment of defaults, and refunds.
Section 318: Phase‐in Tax Changes Resulting from Reassessments
A key mitigation measure that was provided in conjunction with assessment reforms was the provision in section 318 for phasing-in the tax impacts resulting from reassessments. Importantly, the section does not apply to properties in the so called capped classes (multi-residential, commercial and industrial) which are subject to different rules. To some extent the usefulness of the tax impact phase-in provisions of this section has been superseded by the introduction of the prescribed assessment phase-in program under section 19.1(1) of the Assessment Act. The optional phase-in program is discussed in more detail in Chapter 7.

Property Taxation Guide 31
Section 320: Taxes on International Bridges and Tunnels
This section sets out the basis for taxing international bridges and tunnels (except those used exclusively for railway purposes). The tax to be charged is the higher of the amount determined in the usual manner in Ontario or the equivalent American municipal and school taxes. The section also establishes how the taxes are to be shared with the upper-tier municipality.
Section 326: Special Services Area Rating
Some municipal services, such as transit, are only provided in part of the municipality. Other services are provided at different service levels
within the municipality. Under section 326 a municipality may establish levies to pay for services that are not provided uniformly in its jurisdiction.
PART IX – LIMITATION ON TAXES
Part IX of the Act provides rules governing tax increases for individual multiple residential, commercial, and industrial properties. It also sets out how municipalities can recover taxes to pay for the forgone tax increases. Collectively these rules control what has become to be known as “capping and clawback.” The rules are set out in 14 sections which are summarized in Table 3.5 and described in the accompanying text. A detailed discussion of how municipalities can use capping and clawback is provided in Chapter 8.
Table 3.5
MUNICIPAL ACT – PART IX LIMITATION ON TAXES (CAPPING AND CLAWBACK)
Section Number and Description Content
327 – Interpretation Provides specific information regarding application of the provisions of part IX
328 – Determination of Taxes Specifies how taxes addressed by part IX are to be determined
329 – Maximum Taxes Specifies how maximum tax amount to be levied is to be calculated. Includes
rules regarding properties affected by changes in their assessed values
329.1 – Municipal Options Provides authority to adopt alternative capping/phase‐in provisions
330 – Recoveries Rules regarding tax decrease/clawbacks. Clawbacks are used to fund shortfalls
between the maximum “capped” taxes and “destination” uncapped taxes
331 – Treatment of Comparable
Properties
Provisions for setting taxes on “new” (eligible) properties in relation to taxes
on comparable properties
223‐333 – Tenants & Landlords Rules regarding application of capping and clawback provisions as they affect
tenants and landlords
334 – Application for
Cancellations, etc.
Establishes applications for cancellations, reductions and refunds to be dealt
with
335 & 336 Technical issues relating to restructuring and boundary adjustments
337 – Undercharging How undercharged taxes under part IX are to be dealt with
337.1 – Adjustment Treatment of payments to other bodies
338 – Regulations Authority for Minister to make regulations
32 Chapter 3
Background to Capping and Clawback
The capping and clawback program was introduced shortly after the initial 1997 tax system reforms when it became evident that the tax impacts within the multiple residential, commercial and industrial classes could not be adequately mitigated using the tax tools that were already available. The cause of the significant tax shifts that, in the absence of the program, would arise stemmed partly from disparities in the former assessments of many properties compared to their CVAs and partly because of the variability from property to property of business taxes that applied under the former system. To address the tax increase, limits were placed on the amounts by which taxes could increase each year. The initial program covered three years and was known as the “10:5:5” program referring to the percentage increases permitted. Annual level increases were permitted in addition to these percentage increases. Section 329 provides the primary set of rules relating to the program in order to limit the impact of the cost of the program (capping costs) to properties within the affected classes. Municipalities were empowered to hold back as much of the tax reductions that, but for the capping program, other properties in the class, would have been entitled to in order to fund the caps. This part of the program is addressed in section 330.
Notwithstanding the mixed reaction to the program from taxpayers (depending on whether they gained or lost) it was on the surface quite straightforward. Foregone revenues from capped properties were evenly balanced by the sum of the clawed back reductions. While the basics of the program are relatively straight-forward, the necessity to make adjustments to account for the many types of changes that properties are subject to complicated matters considerably. The legislative rules and regulations required to address the many types of charges are contained in part IX and associated regulations. Since the program was first introduced a number of important changes have been made.
“Comparables” Based Treatment of New and “New to Class” Properties
When the capping program was first introduced new properties or properties that changed property class were required to pay CVA taxes, that is to say taxes were neither capped nor clawed back. Subsequently, the Act was amended to provide relief to owners of new and new-to-class properties if taxes on comparable properties benefitted from capping and therefore effectively lower taxes. The original provisions were subsequently modified to permit municipalities to set the percentage at which newly constructed and new-to-class properties could be taxed. From 2008 the percentage could be set as high as 100% of uncapped tax. Since then the

Property Taxation Guide 33
program has had limited applicability since almost all municipalities have set the level at 100%.
Municipal Capping Options
The more significant changes that have been made to the program since its inception provide municipalities with options to move properties more quickly towards “uncapped” status. The mandatory 5% base increase requirement remains in place but municipalities have the authority to increase the rate to 10%. As well, the choice of using a dollar minimum increase is provided. Perhaps most important, municipalities are provided with the option of keeping properties out of capping and clawback once they reach the “uncapped” tax point. This option has significantly reduced the number of properties that continue to be subject to capping and clawbacks. Importantly, however, the newer phase-in program to some extent fulfills a similar role by dampening the impact of tax increases and decreases resulting from reassessments.
PART X – TAX COLLECTION
Part X of the Municipal Act contains the “meat and potatoes” sections affecting the administration of the property tax. Although it is the largest tax-related section of the Act, containing some 40 sections, its provisions are for the most part not complicated. The first 16 sections address basic issues such as form and content of the tax roll and tax bills,
rules regarding installments, penalties, interest and discounts and obligations regarding matters such as tax settlements and write-offs. Also included are important sections setting out rules concerning the circumstances under which refunds may be provided, how to account for errors, and how to deal with extra billings. Several of the sections address the provision of tax rebates relief and reductions. These include rebates for charities, relief of taxes that are unduly burdensome, and reductions for heritage properties undergoing environmental rehabilitation. Particularly important is section 364 which requires municipalities to provide tax rebate for vacant industrial and commercial properties. This section is augmented by Ontario's Regulation 325/01 which sets out more detailed provisions regarding the administration of rebates. Details on tax collection, administration, and rebate and relief programs are provided in Chapter 9.

34 Chapter 3
Table 3.6
MUNICIPAL ACT ‐ PART X TAX COLLECTION
Section Number and Description Content
339 – Definitions Definitions
340 – Tax Roll Tax roll content
341 – Roll Adjustments Requirement to adjust roll for changes and to make tax adjustments
342 – Instalment By Law Sets rules regarding tax instalments
343 & 344 – Tax Notices & Bills Rules regarding content and form of tax notices and tax bills
345 – Late Payment Charges Rules regarding penalties, interests and advance payment discounts
346 – Payment Rules regarding payments and receipts
347 – Allocation of Payments Treatment of payments relative to overdue amount, interest, penalties &
current taxes
348 – Determination of Tax Status Requirement to establish December 31 position for each account by
following February 28 together with notice requirements
349 – Recovery of Taxes Status and priority of taxes relative to other claims
350 – Obligation of Tenant Authority to require tenants to pay rent to municipal treasurer if there are
arrears in taxes and costs
351 – Seizure Rules regarding seizure and disposal of personal property to recover unpaid
taxes and costs
352 – Tax Statement Requirement to issue tax statement when requested. Statement is binding
on municipality.
353 – Taxes Collected on Behalf of
Other Bodies
Obligations and rules regarding payment to others of taxes collected on
their behalf
354 – Tax Write‐offs Rules governing how taxes may be written off
354.1 – Refunds on Cancelled
Assessments
Requirement to pay refund to properties covered by a regulation under
section 33(1.1) of Assessment Act
355 – Minimum Tax Authority to pass a minimum tax by‐law, together with by‐law requirements
356 – Division into Parcels Rules regarding division of blocks of land into parcels including provision for
appeal to Assessment Review Board
357 – Cancellation, Reduction &
Refund of Taxes
Rules regarding circumstances under which taxes may be cancelled,
reduced or refunded including application and appeal provisions. Applies to
taxes in the year in which the application is made
358 – Overcharges Rules regarding circumstances under which an application for tax
cancellation, reduction or refund in respect of up to two years prior may be
granted, together with application and appeal provisions
359 – Increase of Taxes Provisions allowing for municipal treasurers to apply for an increase in
taxes. Applies to the year in which the increase is applied for and does not
cover errors in judgement regarding assessments. The section provides
rules, applications and appeal process
360 – Regulation Authorizes Minister to regulate definition of “gross or manifest error“
361 – Rebates for Charities Sets out rules regarding the mandatory tax rebate program for charities
362 – Tax Reductions Authorizes by‐laws to provide reductions in the tax difference between
capped taxes under part IX and CVA taxes

Property Taxation Guide 35
364 – Vacant Unit Rebate Requires municipalities to provide rebates regarding vacant commercial and
industrial units. Also sets out rules, the authority for ministerial regulations
and an appeal process
365 – Cancellation, Reduction or
Refund of Taxes
Allows municipalities to provide relief in circumstances where taxes are
considered by Council to be unduly burdensome
365.1 – Cancellation –
Rehabilitation & Development
Contains provisions relating to the cancellation of taxes for properties for
which Phase 2 environmental site assessments have been undertaken and
which are in the rehabilitation and development process (brownfields)
365.2 – Tax Reduction for Heritage
Properties
Contains provisions relating to the reduction in taxes that municipalities
may provide in respect of properties designated under the Ontario Heritage
Act
365.3 – Change of Assessment Requires recalculation of tax relief under various sections of the Municipal
Act in the event of changes resulting from reconsiderations or appeals
under the Assessment Act
366 – Federal Crown Land Authority for the Crown to make payments in lieu of taxes that a tenant or
user would be required to pay
367 & 368 – Property Taxes
Business Improvement Area
Charges
Complex sections dealing with tax changes arising from the 1998 tax
reforms as they affected cross leases of commercial and industrial
properties
369 – Offence Specifies that it is an offence not to perform the duties required under part
X of the Act
370 – Holidays Requirements relating to specified dates that occur when offices are closed
to be moved back

36 Chapter 4
CHAPTER 4
OTHER PROPERTY TAX
LEGISLATION As well as being the principle revenue source for municipalities, the property tax is also a major funding source for public education in Ontario. This chapter briefly describes how education tax rates are set under the Education Act. The chapter also covers other legislation that specifically relates to the administration of the property tax.
PUBLIC EDUCATION AND PROPERTY TAX
Public education in Ontario is overseen by the Provincial government, which controls the funding. Local school boards are responsible for delivering the service. School boards are either public (i.e. secular and non-denominational) or separate (Catholic and, in one case, Protestant) and English or French. The role of municipalities in the education system is limited to that of property tax collector.
Education Funding
Public education is funded through a combination of Provincial grants and property taxes. Each year the Province establishes the total education funding requirement (called the Grants for Student Needs or GSN) for each school board. The GSN considers four elements: a per pupil grant for the basic
elements of classroom education (e.g. teachers salaries and programs). The per pupil grant, or Pupil Foundation Grant, is designed to be equal across the Province and is the largest component of overall funding;
a School Foundation Grant provided to school boards for the costs of school administration and supplies;
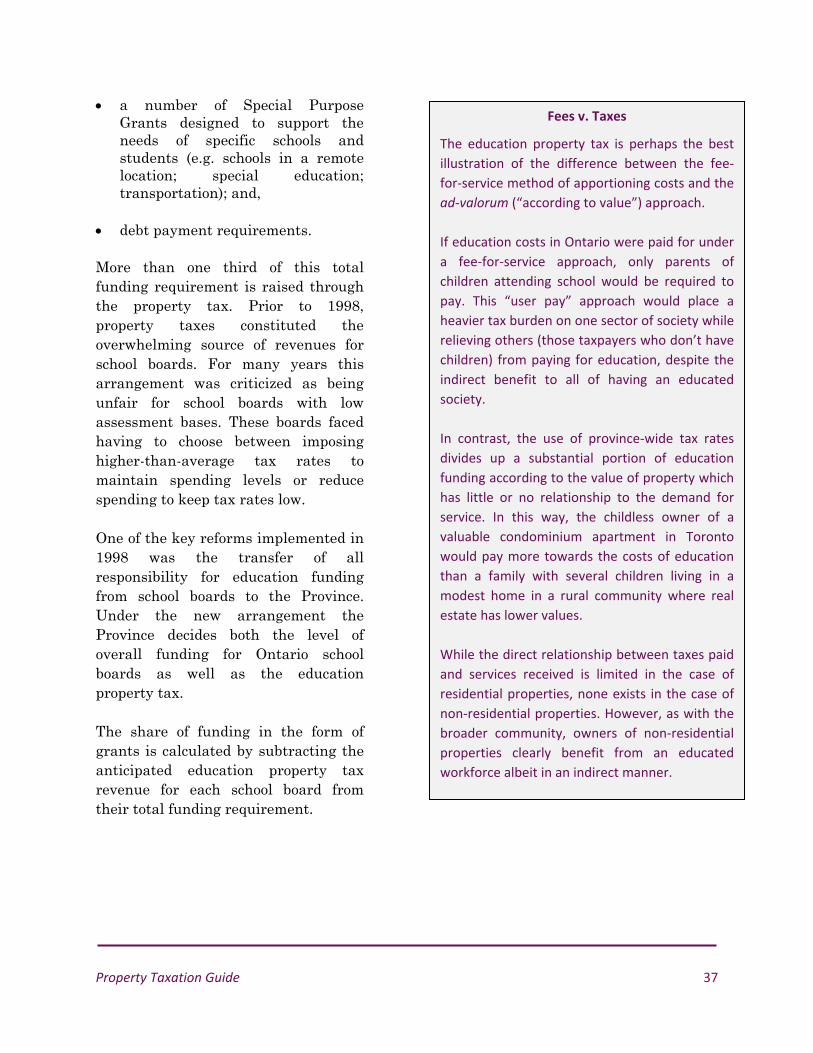
Property Taxation Guide 37
a number of Special Purpose Grants designed to support the needs of specific schools and students (e.g. schools in a remote location; special education; transportation); and,
debt payment requirements. More than one third of this total funding requirement is raised through the property tax. Prior to 1998, property taxes constituted the overwhelming source of revenues for school boards. For many years this arrangement was criticized as being unfair for school boards with low assessment bases. These boards faced having to choose between imposing higher-than-average tax rates to maintain spending levels or reduce spending to keep tax rates low. One of the key reforms implemented in 1998 was the transfer of all responsibility for education funding from school boards to the Province. Under the new arrangement the Province decides both the level of overall funding for Ontario school boards as well as the education property tax. The share of funding in the form of grants is calculated by subtracting the anticipated education property tax revenue for each school board from their total funding requirement.
Fees v. Taxes
The education property tax is perhaps the best
illustration of the difference between the fee‐
for‐service method of apportioning costs and the
ad‐valorum (“according to value”) approach.
If education costs in Ontario were paid for under
a fee‐for‐service approach, only parents of
children attending school would be required to
pay. This “user pay” approach would place a
heavier tax burden on one sector of society while
relieving others (those taxpayers who don’t have
children) from paying for education, despite the
indirect benefit to all of having an educated
society.
In contrast, the use of province‐wide tax rates
divides up a substantial portion of education
funding according to the value of property which
has little or no relationship to the demand for
service. In this way, the childless owner of a
valuable condominium apartment in Toronto
would pay more towards the costs of education
than a family with several children living in a
modest home in a rural community where real
estate has lower values.
While the direct relationship between taxes paid
and services received is limited in the case of
residential properties, none exists in the case of
non‐residential properties. However, as with the
broader community, owners of non‐residential
properties clearly benefit from an educated
workforce albeit in an indirect manner.

38 Chapter 4
Education Property Taxes
The property tax portion of education funding is based on tax rates that are set by the Province. For the residential, multi-residential, farm, and managed forest property classes province-wide rates are set by regulation. For 2012 the rates were: 0.221 percent of CVA for residential
and multi-residential; and
0.05525 percent of CVA for farms and managed forests.
Education tax rates are established in essentially the same way as the municipal rates. First, the assessed values of properties in each class across Ontario are summed. Then, in the case of farms and managed forests a 25% class ratio is applied to determine the total weighted assessment. The amount to be raised from the residential portion of the education tax is then divided by the total weighted assessment to determine the residential and multi-residential rate. Finally, the 0.25 ratio is applied to the residential rate to calculate the rates for the farm and managed forest classes. One of the effects of having province-wide tax rates for residential properties has been a relatively consistent shift in the shares of education taxes away from properties in Northern Ontario, rural areas and smaller urban centres towards the urban centres in southern Ontario, and
especially the Greater Toronto Area. This shift reflects the relative differences in the rate at which property values have changed over the years. Municipalities where property values have increased at a slower rate than the Provincial average—generally more rural and semi-urban areas—have benefitted from lower education taxes. Conversely, in municipalities where property values have increased at faster-than-average rates, taxes dedicated to education have also increased. In areas where the provincial education taxes have been declining municipalities have had the opportunity to occupy the tax room that has been created. In these situations, municipalities have been able to increase municipal tax revenues but without necessarily raising the overall tax bill of the average residential taxpayer. However, in areas where education taxes are increasing it is much more difficult for tax rates to be raised since owners then face a double “hit.”
Business Education Property Taxes
Education tax rates on business and pipeline properties are also set by the Province. However, unlike the other property classes, the tax rates vary by upper or single-tier municipality. The reason for this is that, at the time of the 1998 reforms, moving to uniform business education tax (BET) rates

Property Taxation Guide 39
would have been very difficult to implement because of the extremely large differences in effective tax rates between municipalities. Uniform rates would have created equivalently large differences between “winners” and “losers.” Up until very recently the variation in rates between municipalities reflected differences that existed across the province prior to the provincial takeover of education funding in 1998. However, the ongoing disparity in BET rates was criticized because the education property taxes raised from businesses in one municipality have no direct relationship to the amount of education funding provided to the municipality’s school boards. In 2007, in partial response to this criticism, the Province initiated a program to cut BET rates over seven years. Higher than average BET rates were to be lowered over seven years to a target maximum rate of 1.60 percent of CVA. The target rate was updated to 1.26% in 2012 to compensate for the 2008 general reassessment and assessment phase in provisions. The 1.26% percent maximum rate is also being applied to commercial and industrial properties in the new construction property sub-classes provided the CVA of the property (or of the business portion of the property in the case of a mixed use property) increases by a minimum of 50% over a period of five taxation years. Provincial funds are being used to cover the revenue shortfall arising from the cuts.
The lower rate has already been fully implemented for northern Ontario businesses. The 2012 budget halted the declines until balanced budgets are achieved. However, adjustments to account for reassessment changes will be made.
Municipal Role as Education Property Tax Collector
The education property tax system is administered by lower-tier and single-tier municipalities as part of their tax system. Billing and collection occurs in the context of the municipal property tax bills received by taxpayers. Municipalities are obligated to remit the taxes collected for education purposes to local school boards.
School Support
Taxpayers can select the local school board they wish to support through education property taxes. MPAC collects school support data from property owners and tenants to help the Province determine the number of elected trustee positions for each school board. Designating school support enables qualifying property owners to vote for school trustees. To request a change in school support, property owners and tenants must apply to their local school boards. Applications may be filed at any time during the year and the change becomes effective the following taxation year.

40 Chapter 4
PAYMENTS IN LIEU OF TAXES
Property belonging to the Government of Canada is exempt from taxation under the Assessment Act (in accordance with section 125 of the constitution). However, for many years the Federal Government and Province of Ontario have paid grants to municipalities on Crown properties in lieu of property taxes. The principle behind these payments (generally known as PILTs, PILs or sometimes PILOTs) is that as Crown properties benefit from municipal services they should share in paying for the cost. The amount of PILTs paid to a municipality is generally equivalent to the amount of taxes that would have been payable were the property to be taxable. However, there are subtle differences in the way in which PILTs apply to Federally and Provincially owned land, Crown corporations, and other institutions.
Federal PILTs
The Government of Canada, through its federal departments and Crown corporations and agencies, owns thousands of properties including office buildings, ports, prisons, and post offices. The federal PILTs program for these properties is administered by Public Works and Government Services Canada which makes annual PILTs to municipalities. Crown corporations such as the Canada Post Corporation and the Canadian Broadcasting Corporation make PILTs
for their property directly to municipalities. Unlike other government transfers PILTs are only paid when municipalities apply for them. Most municipalities apply to the federal government for PILTs on an annual basis. The payment amount is calculated based on MPAC’s property classification and assessed values and the relevant tax rates. The authority to make Federal PILTs is derived from the Payments in Lieu of Taxes Act and its regulations.2 Very important, however, is that the Act does not obligate the government or the heads of Crown corporations to make payment: PILTs are always discretionary. With some exceptions, the Act sets the amount of the PILT as an amount that “in the opinion of the Minister” would apply using the appropriate tax rate and property value were the property to be taxable. In setting the property value, the Minister is to consider the CVA that would be assigned by MPAC. Because of this latitude, in some cases the actual PILT amounts fall short of the amounts calculated by municipalities.
2 And, as with Provincial PILTs, more generally under sections 321 and 366 of the Municipal Act.
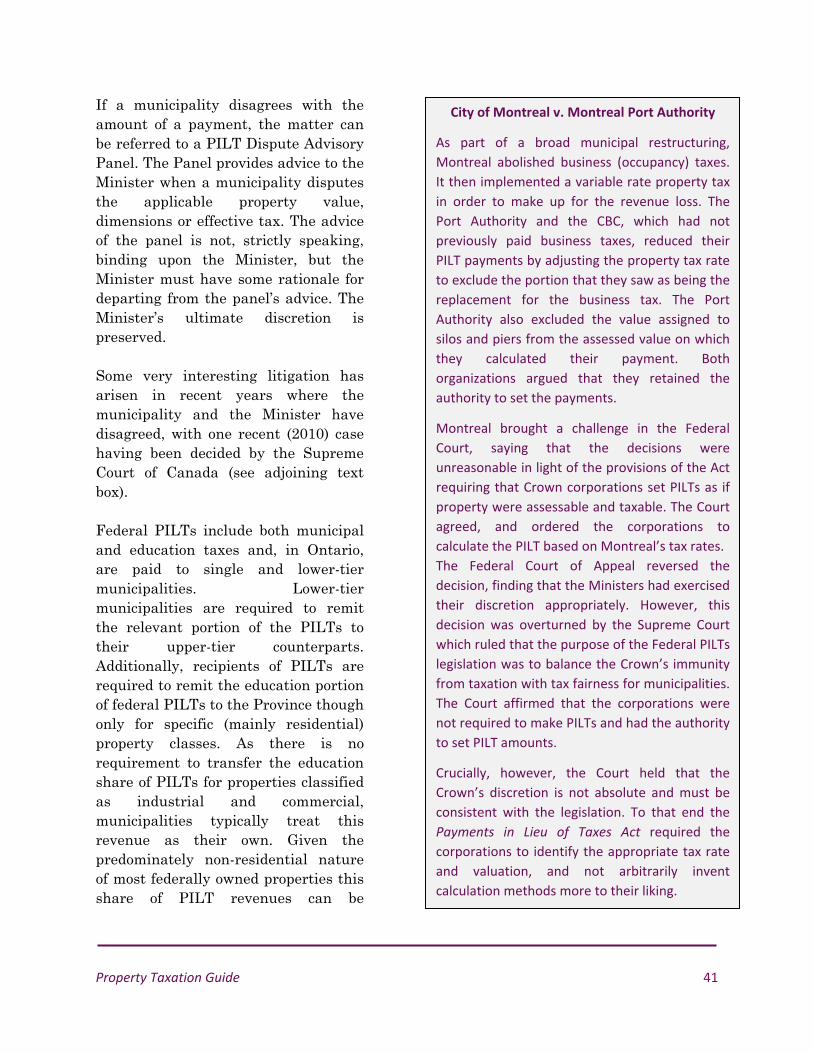
Property Taxation Guide 41
If a municipality disagrees with the amount of a payment, the matter can be referred to a PILT Dispute Advisory Panel. The Panel provides advice to the Minister when a municipality disputes the applicable property value, dimensions or effective tax. The advice of the panel is not, strictly speaking, binding upon the Minister, but the Minister must have some rationale for departing from the panel’s advice. The Minister’s ultimate discretion is preserved. Some very interesting litigation has arisen in recent years where the municipality and the Minister have disagreed, with one recent (2010) case having been decided by the Supreme Court of Canada (see adjoining text box). Federal PILTs include both municipal and education taxes and, in Ontario, are paid to single and lower-tier municipalities. Lower-tier municipalities are required to remit the relevant portion of the PILTs to their upper-tier counterparts. Additionally, recipients of PILTs are required to remit the education portion of federal PILTs to the Province though only for specific (mainly residential) property classes. As there is no requirement to transfer the education share of PILTs for properties classified as industrial and commercial, municipalities typically treat this revenue as their own. Given the predominately non-residential nature of most federally owned properties this share of PILT revenues can be
City of Montreal v. Montreal Port Authority
As part of a broad municipal restructuring,
Montreal abolished business (occupancy) taxes.
It then implemented a variable rate property tax
in order to make up for the revenue loss. The
Port Authority and the CBC, which had not
previously paid business taxes, reduced their
PILT payments by adjusting the property tax rate
to exclude the portion that they saw as being the
replacement for the business tax. The Port
Authority also excluded the value assigned to
silos and piers from the assessed value on which
they calculated their payment. Both
organizations argued that they retained the
authority to set the payments.
Montreal brought a challenge in the Federal
Court, saying that the decisions were
unreasonable in light of the provisions of the Act
requiring that Crown corporations set PILTs as if
property were assessable and taxable. The Court
agreed, and ordered the corporations to
calculate the PILT based on Montreal’s tax rates.
The Federal Court of Appeal reversed the
decision, finding that the Ministers had exercised
their discretion appropriately. However, this
decision was overturned by the Supreme Court
which ruled that the purpose of the Federal PILTs
legislation was to balance the Crown’s immunity
from taxation with tax fairness for municipalities.
The Court affirmed that the corporations were
not required to make PILTs and had the authority
to set PILT amounts.
Crucially, however, the Court held that the
Crown’s discretion is not absolute and must be
consistent with the legislation. To that end the
Payments in Lieu of Taxes Act required the
corporations to identify the appropriate tax rate
and valuation, and not arbitrarily invent
calculation methods more to their liking.

42 Chapter 4
substantial. As a result, municipalities get a greater benefit from having federal properties than they would if these properties were fully taxable.
Provincial PILTs
The Municipal Tax Assistance Act provides authority for the Minister of Municipal Affairs and Housing and for Crown agencies to make PILT payments to a municipality in respect of provincial land located within the municipality. Similar to the federal PILTs the payments are to be equivalent to the amount of taxes for municipal purposes that would have been payable in respect of the property had the property been taxable. As a practice, municipalities base their PILT calculations on MPAC’s CVA of the affected properties and the relevant tax rates. An important distinction is made in respect of the education portion of the PILT. If the property is owned by the Province and not occupied by a Crown agency, or is owned or occupied by a Crown agency, the PILT amount is restricted to the municipal portion of property taxes otherwise payable. However, where a Crown property is occupied by taxable tenants, the PILT should include both the municipal and education components. For tenanted properties (whether classified as residential, commercial or industrial) the education portion of the PILT is remitted to the Province.
Unlike for federal PILTs, there is no appeal mechanism regarding Provincial PILTs. However, with a few notable exceptions, the Province and its agencies generally accept the assessments of MPAC on their own properties. Provincial PILTs are paid to lower-tier municipalities. Ontario Regulation 382/98 establishes a formula for sharing the grants between upper-tier municipalities and school boards. Remittance is required to be made in four installments:
Table 4.1
SCHEDULE OF PILT REMITTANCE TO UPPER‐TIER AND SCHOOL BOARDS
Timing Amount
31 March 25% of taxes that would have been paid in previous year
30 June 50% of amount payable in current year less amount of first installment
30 September 25% of amount payable in current year
15 December Balance of PILT payable in current year
Ontario Power Generation, Hydro One, and their subsidiaries, as well as municipal electricity utilities, are also covered by Provincial PILTs though only for the lands containing generating or transformer station structures. Hydro-electric generating stations and, more recently, wind

Property Taxation Guide 43
turbines are not subject to PILTs (though the former are required to pay taxes and charges to the Province under the Electricity Act). The remittance schedule for hydro properties is as follows:
Table 4.2
SCHEDULE OF PILT REMITTANCE TO ENERGY CORPORATIONS
Hydro One Inc.
By 16 April 50% of taxes that would have been paid in previous year
By 16 October Balance of PILT payable in current year, along with annual return
Ontario Power Generation Inc.
By 16th of every month for first nine months
1/12 of taxes that would have been paid in previous year
By 16th day of remaining three months
1/3 of total PILT payable in current year, less payments made in first nine months (annual return due 16 Oct)
All PILTs paid by hydro properties in Ontario are currently sequestered to pay off the stranded debt of the former Ontario Hydro.
“Heads and Beds” Levies
The Municipal Tax Assistance Act does not apply to provincial institutions such as public hospitals, universities, community colleges, and correctional
facilities. However, under section 323 of the Municipal Act municipalities can levy annual PILTs (a “heads and beds” levy) on these properties. The maximum payment amount is regulated by the Minister and is currently $75 per hospital bed, full time student enrolled, or resident place. This amount has not changed since 1987, when it was increased from $50, meaning that these payments have not kept pace with the cost of providing municipal services to these institutions.
OTHER PROPERTY TAX LEGISLATION
There are a number of other acts and regulations that specifically relate to the administration of the property tax.
Provincial Land Tax Act
The Provincial Land Tax (PLT) is a property tax imposed on land located in the unorganized territories of Ontario which do not have municipal representation. The taxes collected fund the cost of provincial services in these areas, including education. The Province collects all PLTs and administers the program. Beginning with the 2009 tax year properties in the unincorporated territories are assessed using the same CVA methods as have been used in the rest of the province since 1998. The manner of calculating and collecting

44 Chapter 4
PLTs is set out in the Provincial Land Tax Act and its Regulations 224/09 (which sets the tax rates by property class, including special per acre rates for property owned by railway companies and power utilities) and 229/09 (which establishes a semi-annual PLT collection).
City‐Specific Acts
There are acts that regulate the powers of specific municipalities. However, the only city-specific act that comprehensively addresses assessment and taxation matters is the City of Toronto Act. This Act grants broad revenue raising authority to the City of Toronto, including the power to tax alcohol, tobacco, admissions to places of amusement, land transfer, vehicle registration, roads (through tolls and cordon charges), parking, and outdoor advertising. With respect to property taxation the Act largely mirrors the provisions of the Municipal Act.

Property Taxation Guide 45
CHAPTER 5
UNDERSTANDING THE
TAX BASE There are three fundamental components that shape each municipality’s property tax structure: the tax base, the levy requirement and tax policies. This chapter focuses on the tax base the details of which are contained in the assessment roll.
ASSESSMENT ROLL
As discussed in Chapter 2 the assessment roll lists the number and class of properties in the municipality as well as the values which are placed on them. And although the roll is a fundamental element of the property tax structure, municipalities have no control over its contents. MPAC is responsible for determining the current value assessment (CVA) of properties. Dates for general reassessments are established by the Province and the Assessment Review Board is responsible for hearing assessment appeals. The municipality’s only direct responsibility regarding the assessment roll is to make the changes that arise as a result of reconsiderations and appeal decisions. Because of the limited involvement the Finance department does not need to have an in-depth knowledge of the assessment roll or how the CVAs it contains are established. However, it is important to have a basic understanding of these elements in order to be able to discuss their implications for tax issues such as reassessment shifts, phase-ins and major appeals. The assessment roll contains a variety of information about each property. Some of it, such as the property code, the CVA, and the parcel dimensions, relate directly to the property characteristics. Other information relates to ownership. For taxation

46 Chapter 5
purposes the key elements of the roll are the CVAs, the property classifications, and the taxable status of each property.
HOW CVA IS DETERMINED
MPAC uses a variety of methods to value properties. These methods are well-established and are chosen based on the characteristics of each type of property and most importantly the type of factors that buyers and sellers consider.
Residential Properties
In most municipalities around 90% of properties are residential. In most locations and for most types of units the sales comparison approach is used. Using this approach the value of a property is estimated by comparing it to sales of similar properties. Because of the large number of properties that must be valued, MPAC uses multiple regression analysis, a well-known statistics-based technique that is ideally suited to mass appraisal applications. Application of the technique produces what in simple terms amounts to a formula in which dollar values are assigned to various property characteristics. The dollar values are derived from sales which are analyzed in relation to property characteristics. Many characteristics are considered such as building size, date and type of construction, and lot frontage. Neighbourhood factors are also considered. Once the regression
formula has been developed and tested for accuracy it is applied to the specific characteristics of each property. The result of this calculation is the property specific CVA estimate. While the technique is efficient and effective for the type of mass appraisal exercise that municipal appraisal involves it is difficult to explain to the average homeowner since it requires a good knowledge of statistics and a computer in order to carry out the analysis. As is discussed in Chapter 10 MPAC does its best to address the issue by using explanations and examples. In a more practical and direct way MPAC also provides information about the assessments of other properties so that homeowners can check how their houses have been valued compared to other houses.
Multi‐Residential Properties
Generally, rental multi-residential properties are assessed using the income approach. This is the preferred approach for valuing properties that are owned for investment purposes. In simple terms CVAs are calculated by converting annual income of a property (net of operating expenses) into the estimate of value using a capitalization rate (or rate of return) that reflects the return on the investment that investors would expect to earn over time given the risks and potential of the property.
Property Taxation Guide 47
Commercial Properties
Commercial properties encompass an extremely wide range of building forms and uses from office buildings and shopping centres to corner stores and automotive repair shops. Since most properties of this type are usually leased the income approach is the approach most commonly used by MPAC. Notwithstanding that most property owners accept that this is the appropriate approach, many appeals arise concerning details of its application. A frequent point of disagreement is the rental value that should be used. MPAC tends to estimate rents based on surveys of comparables while owners often argue that actual (usually lower) rents from the subject property should be used. For the municipality, assessment disputes can be very problematic, particularly if, as happens from time to time, a point of principle with Province-wide implications is involved. Disputes of this type—golf courses were a recent example—drag on for many years. This creates a financial planning dilemma for the Treasurer in terms of the appropriate way to deal with potential losses should MPAC’s position not be sustained. Not all commercial properties are valued using the income approach. In some cases the replacement cost approach is a common alternative.
Industrial Properties
Like commercial properties, industrial properties also encompass a wide spectrum of building types from simple warehouses to complex highly specialized manufacturing facilities. For the types of property that are commonly leased, such as those found in business parks and industrial areas, MPAC usually applies the income approach to determine CVA. For more complex and special purpose facilities for which there is only a limited market the cost approach is generally used. Under this approach the CVA of a property is taken to be the sum of the value of land and the cost of replacing the buildings and other improvements. The appeals that arise with properties valued in this way often involve questions concerning both physical and economic obsolescence. The latter can be a particular problem in small communities that house a large single industrial operation. If the facility closes not only are jobs lost but more often than not the assessed value of what is likely the highest value property is brought into question.
Farms, Managed Forests and Conservation Land
For assessment purposes farm properties are not valued in the way that normal buyers and sellers would treat them. Instead farm residences (together with an acre of land) are valued in the same way as single family residences. Outbuildings are

48 Chapter 5
valued on a replacement cost basis. Farmland is valued based on its use for farm purposes with sales of farms to non-farmers not being considered. This is a very important factor in urbanizing areas where farms usually sell for high amounts reflecting potential future non-farm use for the land rather than the value that could be justified based solely on farming activities. Managed forests and conservation lands are also given special treatment with values per acre being regulated.
Special Purpose Properties
The Assessment Act and its associated regulations, particularly O.Reg. 282/98, specify how various special purpose properties are to be valued. Among the types of properties that are affected by these rules and regulations are: pipelines airports hotels (see text box in Chapter 2) railway lands
Renewable Energy Installations
In a 2012 amendment to O.Reg. 282/98, new assessment rules were introduced regarding the assessment of solar energy, wind energy and anaerobic digestion facilities. Under the amendment assessments and classifications will not change for rooftop mounted installations or small ground-mounted installations where
generation is not performed by a corporate power producer. Medium and large facilities will be taxed based on the surrounding land use. For the proportion of assessment at large facilities over 500kW, as well as the entire assessment of ground-based facilities operated by corporate power producers, the industrial tax rate will apply. Anaerobic digestion facilities located on a farm and operated by the farmer will be taxed at the farm rate. Wind turbines will continue to be assessed at the rate of $40,000 per MW of installed capacity, except where the assessment would not be affected by rooftop installations and small ground-based installations.
______________
Even from the brief descriptions above it is very evident that the process by which CVAs are estimated is complex and technical in nature. The task of MPAC’s assessors is in some ways more difficult than that of the private appraiser since they are required to value almost every property in the Province, a substantial number of which are exceptionally complex. They are then required to defend their CVA estimates against highly trained experts and property appraisers who very often have more knowledge and expertise regarding the specific properties under appeal. The task is made even more difficult because, as has often been stated, “valuation is an art not a science.” As a result, for any

Property Taxation Guide 49
given property, there is no absolute “correct” value. This creates difficulties for the assessor when, in pursuit of equity between like properties, estimates the CVA of a property at more than an actual sale price. While reducing the CVA down to the sale price may well satisfy its owners the reduced amount would be inconsistent and therefore inequitable with the CVAs of other like properties. Issues of this type are clearly important and arise quite frequently with reassessments. However, they are not something that the Finance department should become involved with unless there is a significant prospect that the outcome of an appeal will have a material impact on the municipality’s finances.
HOW PROPERTIES ARE CLASSIFIED
The various property classes established by the Assessment Act, including optional and sub-classes, are set out in Table 2.1 of Chapter 2. This section deals with how MPAC classifies properties for tax purposes. There are seven main property classes: residential multi-residential commercial industrial pipeline farm managed forests There are also a number of optional classes (such as shopping centres, office
buildings and large industrial properties) that municipalities can choose to adopt subject to the decision of municipal council. Finally there are three sub-classes—farmland awaiting development, vacant land and excess land. For all the various classes, MPAC’s assessors are required to follow quite specific rules for classification (set out in Assessment Act regulations). Because significant tax consequences can arise from both the initial classification and from subsequent reclassifications they are not infrequently the subject of appeals. As with the process by which CVAs are estimated, while the Finance team needs to have a basic understanding of how properties are classified it does not need to delve more deeply unless a challenge arises regarding a property or properties the result of which could have significant financial ramifications for the municipality.
Residential Class
Although the bulk of the properties will usually be single-family housing units, there are several other forms of housing—such as townhouses, condominiums, apartments, and rooming houses—that are included in the residential property class. The residential class also includes land for:
50 Chapter 5
group homes land owned by a co-operative or a
corporation without share capital “life lease” units non-profit recreation facilities
within developments retirement homes various types of non-profit
organizations land used for residential uses on a
seasonal basis such as cottages and campgrounds
golf courses, driving ranges, and ski resorts
private aircraft storage horse tracks and riding lessons The class also includes lands not used for residential purposes, such as farmland that does not fit into the farm property class.
Multi‐Residential Class
Land with buildings containing seven or more self-contained residential units falls into the multi-residential property class.
New Multi‐Residential Class
This optional property class comprises multi-residential classed land where the units on the land have been built or converted from a non-residential use as a result of a building permit being issued after the by-law adopting the new multi-residential class was passed. Land ceases to be in the new multi-residential class after it has been classified in that class for 35 taxation years.
Commercial Class
The commercial property class is, in effect, the default class for any property that is not included in one of the other classes. Where optional commercial classes are adopted the first 25,000 square feet of building space within the property maintains the commercial classification. Examples of commercial properties are hotels, motels, stores, office buildings, shopping malls, homes for the aged, homes for special care, retirement homes and nursing homes operating as commercial ventures.
Industrial Class
To qualify for the industrial class a property must be used for, or in connection with, manufacturing, producing or processing. The classification also encompasses space used for associated research, storage and on site retail sales. This use-based classification rule can be confusing since there are many properties that appear industrial in physical form but do not qualify for industrial classification because their use does not meet the criteria. This can have significant tax consequences since in many municipalities, for historical reasons relating to infrequent reassessments, the tax ratio for the industrial class is much higher than for the commercial class. As a result, industrial classified properties generate higher taxes.

Property Taxation Guide 51
Also captured within the industrial classification is land for electricity facilities, mines, oil and gas aggregates, and sewage and water treatment facilities. Interestingly, office or administrative buildings are not classified industrial unless they are attached to an industrially classified building or structure.
New Construction Sub‐Class
These sub-classes consist of property in the commercial and industrial property classes that have undergone improvements that: result in an increase in the
assessment equal to or greater than 50% of the assessment prior to the improvements; and
result from a building permit that was applied for after March 22, 2007.
Pipeline, Farm, and Managed Forest Classes
The managed forest property class consists of land that is subject to a managed forest agreement. The land can be reclassified if it is used for other purposes; reclassification can be made up to four years after the change in use. The farm property class includes land used for farming as well as outbuildings but excludes farm residences (and one acre of associated
land) which fall into the residential class. The Minister of Finance prescribes assessment rates for pipeline and managed forest property through regulations to the Assessment Act.
Mixed‐Use Property
MPAC is required to divide the assessment of mixed-use properties among different classes according to use. The municipality will then apply the appropriate tax rate to the assessed value of each property class associated with the property identified on the assessment roll. For example, a building with a commercial business on the main floor and a residential unit above will have assessment in both these property classes.
REASSESSMENTS AND PHASE‐INS
For those involved with property taxes reassessments are necessary but not especially welcome events. Aside from the cost and effort involved, they generate complaints from all quarters: both from property owners who face tax increases and from those who believe the new assessments are inaccurate. Even property owners whose taxes are likely to decline sometimes complain on the basis that they should not have been paying so much before. Not surprisingly, therefore, there is a long history of postponed reassessments and of

52 Chapter 5
taxation measures designed to soften impacts once reassessments are implemented. In fact, in some Ontario municipalities, notably the City of Toronto, more than 50 years had elapsed before the Province implemented the comprehensive reassessment in the late 1990s as part of the general reform to the tax system. While the new legislation provided for a gradual move to annual
reassessment, subsequent decisions scaled back the frequency to a more manageable four-year cycle. This cycle is also coupled with a mandatory phase-in of value increases. As a result, as is illustrated in Table 5.1, in any given year the assessments to which the tax rate is applied is always less than the current value of the property (as represented by the CVA).
*
Year 1
CVA ($000s)
340
330
320
310
300
290
280
270
260
250
240
Year 4Year 3Year 2
EXAMPLE OF THE FOUR YEARREASSESSMENT CYCLE
ExistingCVA
FutureReassessed
CVA
Reassessed CVA
Phased-In CVA
*
*
Table 5.1
**
*

Property Taxation Guide 53
In the illustration, the example property has an existing CVA prior to the reassessment of $250,000. With the reassessment the CVA increases to $290,000. In the first year of the four year cycle the property is taxed on the basis of $260,000. By the fourth year, the taxable value of the property reaches $290,000, the full reassessed value. At this point a new four year reassessment cycle begins with the full CVA now being $350,000. Thus, over the subsequent four years the CVA will move up by $15,000 per year, from $290,000 to the full CVA of $350,000. The four-year assessment cycle with phase-ins has the advantage of providing taxpayers with a greater degree of predictability than under annual reassessment. It does not however provide as much shelter from tax increases as some taxpayers may perhaps believe since nearly all properties are on the same value “escalator.” As matters now stand, reassessments will occur in 2012 and every subsequent fourth year based on a valuation date of January 1. The classification of properties is based on their status as of June 30 of the prior year. Properties will begin to be taxed in relation to the 2012 CVA in the 2013 tax year. For increasing properties the taxable assessments will reflect 25% of the CVA increases between their prior CVA (2008 values) and the new CVA (2012 values). For those properties that
have decreased in value between reassessments the taxable amounts will reflect the fully reduced CVAs. For the municipal Finance department reassessments create challenges for reasons such as: inter-class shifts in values that give
rise to tax policy questions;
reconsiderations and assessment appeal losses that create greater need for tax loss provisions; and
additional taxpayer questions that add to the department’s work load.
The types of comments that illustrate why reassessments are problematic are statements such as: “With this assessment my taxes will be so much I will have to sell” or “This assessment is crazy. I didn’t pay nearly that much when I bought the property.” These and the many other types of questions that arise with reassessment (and to some degree each year as phase-ins occur) explain why reassessments are, at the least, challenging. They are nonetheless essential for maintaining the credibility and equity of a tax that uses property values as the basis for apportioning the costs of providing municipal services among taxpayers. Chapter 10 provides information on dealing with the stakeholders in this respect.

54 Chapter 5
ANALYSING REASSESSMENT CHANGES
Given the amount of discussion and debate that is inevitable with each reassessment it is good practice for the Finance team to get an early start on analysis of the assessment changes and their potential impact on tax distributions. The focus of the analysis should be less on the scale of increases and decreases and more on the relative shifts in value. If in the highly unlikely event that all properties were to have increased by 50%, excluding possible changes in education taxes, there would be no relative shifts and therefore no impacts.
Inter‐Municipal Shifts
In two-tier structures, the first step in the review of reassessment results should examine how the distribution of aggregate assessment between municipalities has changed. The information is crucial to understanding of how upper-tier levies will be distributed in the post-reassessment environment. The shifts in the relative shares between municipalities should be considered both in terms of total shares and at a class level. Comparison of total shares will show how at the municipal level taxes will shift as a result of a reassessment. However, between classes of property the shifts may be different with shares increasing and others decreasing depending upon how property taxes have changed between reassessments.
For lower-tier municipalities the practical significance of these shifts is that they can in effect create “tax room” if their share of the upper-tier levy will decline. Conversely, in lower-tier municipalities where the shift will result in higher upper-tier taxes, there would be pressure to constrain any increase in the local tax levy. Table 5.2 illustrates in a simplified manner how shifts can be measured between three municipalities. In the illustration values rise more significantly in the largest municipality. The table is based on weighted assessment numbers which reflect the taxable value of each class. Weighted assessment is calculated by multiplying current value assessment by the applicable tax ratios. The result is that its share of upper-tier levy increases by 1%. In Pine Township which benefits from the shift, the decline represents 3%. No change occurs in Beech Township. The 3% decline in Pine Township might be significant enough to allow its Council to “occupy” this tax room by increasing the local levy.

Property Taxation Guide 55
Table 5.2
ILLUSTRATION OF INTER‐MUNICIPAL REASSESSMENT SHIFT
Pine Township Beech Township Larch Township Total
Weighted CVA Pre‐General Reassessment ($000s)
Residential $40.2 $15.9 $100.7 $151.8
Commercial $0.8 $0.4 $20.2 $21.4
Industrial $1.8 $0.4 $5.2 $7.4
Pipeline $2.0 $6.0 $0.2 $8.2
Total $44.8 $17.7 $126.3 $188.8
Share of Levy $0.66 $0.26 $1.87 $2.79
Weighted CVA Post‐General Reassessment ($000s)
Residential $46.4 $12.5 $125.9 $184.8
Commercial $0.9 $0.5 $23.2 $24.6
Industrial $2.2 $0.5 $4.0 $6.7
Pipeline $2.6 $7.8 $0.3 $10.7
Total $52.1 $21.3 $153.4 $226.8
Share of Levy $0.64 $0.26 $1.89 $2.79
Inter‐Class Shifts
The second step in a reassessment review should be an examination of the shifts at the lower-tier municipal level in the relative weighting of the various property classes. For this the comparative CVA file containing the pre- and post-reassessment values provided by MPAC is required. For the analysis a simple table setting out the pre- and post-reassessment amounts by class together with their share of total CVA is normally sufficient. It provides a clear picture of how values have changed between reassessments by class. Most importantly, it also shows
the changes that have affected the overall share of assessment. In the example shown in Table 5.3 the overall change in values between reassessments is 13%. However, the table also shows that values in the residential class rose by 15% while in the industrial class the increase was only 4%. As a result, the share of CVA for the industrial class declined from 8.2% to 7.5% which equates to a proportional reduction of 8.5%. In contrast the residential class, with its share increasing from 58.8% to 59.5%, experienced a proportional increase of only 1.2%.

56 Chapter 5
Table 5.3
UNWEIGHTED CVA INTER‐CLASS REASSESSMENT SHIFT
Pre‐Reassessment CVA Post‐Reassessment CVA % Shift1
$ (millions) % Share $ (millions) % Share
Residential $650.3 58.8 $747.8 59.5 +1.2
Multi‐Residential $70.2 6.3 $77.2 6.1 ‐3.2
Commercial $120.6 10.9 $135.1 10.8 ‐0.9
Industrial $90.5 8.2 $94.1 7.5 ‐8.5
Pipeline $4.1 0.4 $4.7 0.4 0
Farm/Managed Forest $170.5 15.4 $197.8 15.7 +1.9
Total $1,106.2 100.0 $1,256.7 100.0
1. Pre‐reassessment share / post‐reassessment share.
A second level of analysis should examine the effect of tax ratios on the results. Again a simple table is the best illustration (see Table 5.4). The results taking account of tax ratios, while not changing the overall pattern of shifts, do change the specific amounts. In the example municipality, assuming no changes in tax policy and before allowing for any levy change, the residential and farms/managed forest classes would experience a tax increase as a result of the reassessment. Other classes would benefit, especially the industrial class.

Property Taxation Guide 57
Table 5.4
WEIGHTED CVA INTER‐CLASS REASSESSMENT SHIFT
Tax
Ratio
Pre‐Reassessment CVA Post‐Reassessment CVA % Shift1
$ (millions) % Share $ (millions) % Share
Residential 1.00 $650.3 55.8 $747.8 57.1 +2.3
Multi‐Residential 1.40 $98.3 8.4 $108.1 8.3 ‐1.2
Commercial 1.55 $186.9 16.1 $209.4 16.0 ‐0.6
Industrial 2.00 $181.0 15.5 $188.2 14.3 ‐7.7
Pipeline 1.30 $5.3 0.5 $6.1 0.5 0
Farm/Managed Forest 0.25 $42.6 3.7 $49.5 3.8 +2.7
Total $1,164.4 100.0 $1,309.1 100.0
1. Pre‐reassessment share / post‐reassessment share.
There are two additional factors that should be taken into account when considering reassessment impacts. Firstly, under current legislation the total impacts of reassessment will not be felt immediately since there is a mandatory four-year phase-in. The effect of the phase-in program can be analysed by substituting the year 1 phase-in CVA values for the full CVA values. The second factor to be considered is the effect on residential property owners of changes in education taxes. Experience has shown that slow-growth municipalities tend to benefit from the province-wide method of calculating education tax rates whereas in fast growth municipalities, where house prices are increasing quickly, education taxes tend to rise.
Within‐Class Shifts For the individual property owners, within-class shifts usually have more significant implications than between class shifts since the variation in the scale of CVA changes from property to property can be much larger. The values of individual properties change at different rates over the years depending on factors such as neighbourhood, type of building and size to name just a few. Scattergrams (for example, plotting individual properties percentage increases compared to CVA) are sometimes good for illustrating general trends. Bar graphs are however better for displaying the type of analytical results that members of Council need to understand.

58 Chapter 5
Since residential properties far outnumber other types of property it is worth focusing on this class. The following are the types of bar graph tables that should be prepared: 1. CVA change by ward – often
requested by Council members. 2. Change by pre-reassessment CVA
price ranges – by dividing, for example, all single detached units (identified using MPAC property codes) into 6 or 8 groups using pre-reassessment CVAs.
3. Change by housing type – e.g.
single family detached, freehold townhouse, or condominium.
4. Change by neighbourhood – using GIS to define boundaries and property codes to identify housing.
To develop the comparisons the total pre and post-reassessment CVA amounts for the properties in each group must first be summed. Then the difference between the two amounts can be displayed as bars on the graph. The amounts can be expressed in various ways – in absolute dollars, as percentages, or as average per unit CVA amounts. The average CVAs can be calculated by dividing the sum of the pre and post-reassessment CVA totals for the group by the number of properties. Tables 5.5 and 5.6 show examples of the two approaches.
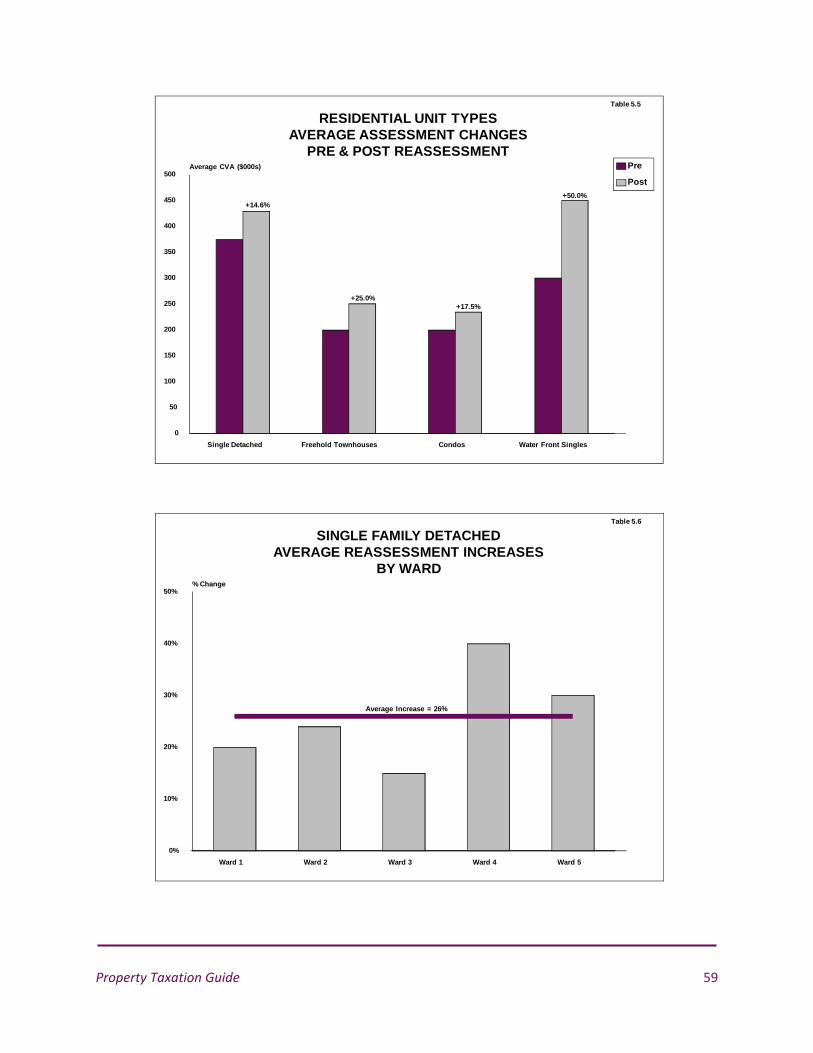
Property Taxation Guide 59
Freehold Townhouses
Post
Pre
RESIDENTIAL UNIT TYPESAVERAGE ASSESSMENT CHANGES
PRE & POST REASSESSMENTAverage CVA ($000s)
500
450
400
350
300
250
200
150
100
50
0
Water Front SinglesCondosSingle Detached
Table 5.5
+14.6%
+25.0%+17.5%
+50.0%
Ward 2
% Change50%
40%
30%
20%
10%
0%
Ward 5Ward 4Ward 3Ward 1
SINGLE FAMILY DETACHEDAVERAGE REASSESSMENT INCREASES
BY WARD
Table 5.6
Average Increase = 26%

60 Chapter 5
For other classes with fewer and less homogeneous properties analytical results of the reassessment changes are not as well suited to graphic data displays. Instead simple numerical tables showing pre- and post-reassessment changes at a class level is usually sufficient. In larger municipalities where the numbers of properties in the various optional commercial and industrial classes can be substantial it is worthwhile examining the relative changes at this level. If the analysis shows reassessment changes for any of the optional classes differ significantly from the change for overall class, consideration may then be given to their adoption when tax policy decisions are being made. Attention should also be paid to changes by price levels in the commercial and industrial classes in order to identify particular groups of properties that may have been differentially affected by the reassessment compared to the class as a whole. Small commercial properties in older downtown areas are often affected in this way and may warrant tax policy support in the form of graduated tax bands. One of the most important components of the reassessment review process is the examination of any properties that are of key importance to the municipality because of their significance as a source of property taxes. Shopping centres, office
buildings and major industrial facilities are prime examples. If unusually large or small value changes are identified for these major properties a call to MPAC may be warranted in order to understand the reason behind the changes. In instances where the new value seems especially anomalous there may perhaps be reason to consider lodging an appeal against the assessment. However, as is discussed in Chapter 9, such a step should generally be avoided unless there is a clear problem with the assessment and a strong likelihood of achieving a successful result.
NON‐REASSESSMENT YEARS
In non-reassessment years there is less need for comprehensive analysis of the assessment roll. Nevertheless, it is probably important to update Council on the changes that occur from year to year. The key changes to be examined are: increases in the taxable assessment
resulting from the mandatory reassessment phase-in. These increases should be examined at the class level as some classes may be affected more than others.
increases in the tax base as a result of growth. Not only does this growth provide additional potential revenues, it is also a key indicator of the municipality’s economic performance.

Property Taxation Guide 61
Importantly, most of this information should be available to the Finance team prior to finalizing the annual budget.
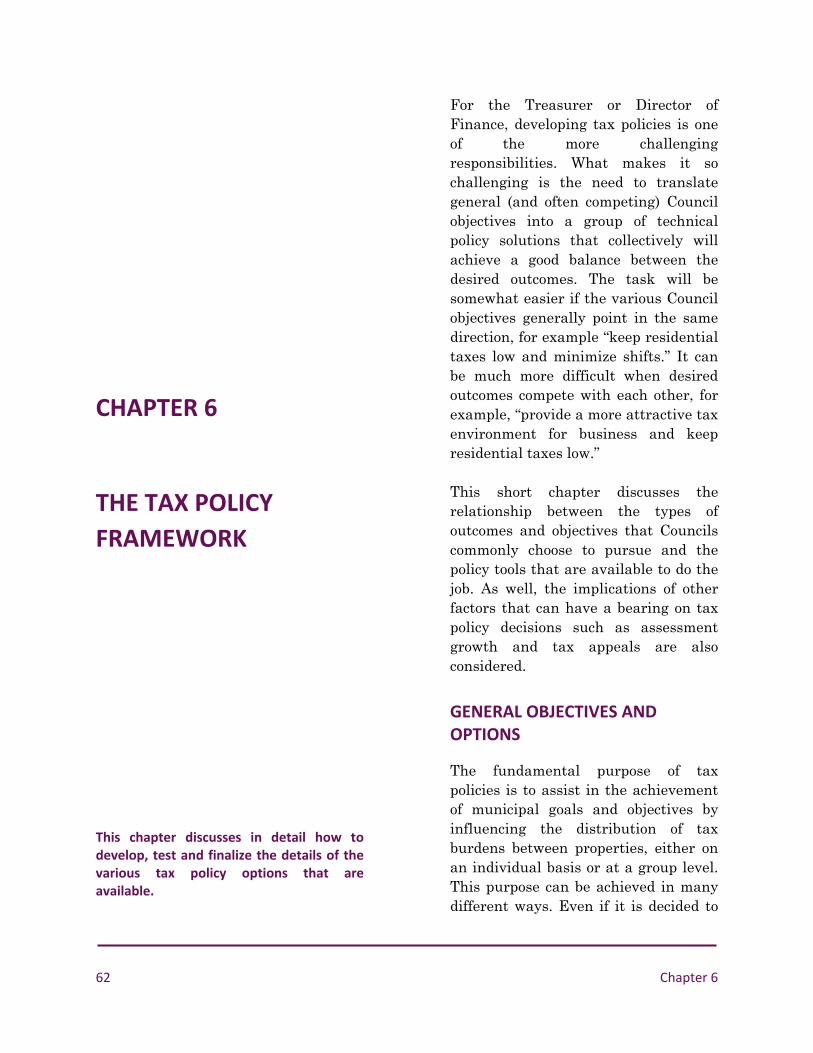
62 Chapter 6
CHAPTER 6
THE TAX POLICY
FRAMEWORK This chapter discusses in detail how to develop, test and finalize the details of the various tax policy options that are available.
For the Treasurer or Director of Finance, developing tax policies is one of the more challenging responsibilities. What makes it so challenging is the need to translate general (and often competing) Council objectives into a group of technical policy solutions that collectively will achieve a good balance between the desired outcomes. The task will be somewhat easier if the various Council objectives generally point in the same direction, for example “keep residential taxes low and minimize shifts.” It can be much more difficult when desired outcomes compete with each other, for example, “provide a more attractive tax environment for business and keep residential taxes low.” This short chapter discusses the relationship between the types of outcomes and objectives that Councils commonly choose to pursue and the policy tools that are available to do the job. As well, the implications of other factors that can have a bearing on tax policy decisions such as assessment growth and tax appeals are also considered.
GENERAL OBJECTIVES AND OPTIONS
The fundamental purpose of tax policies is to assist in the achievement of municipal goals and objectives by influencing the distribution of tax burdens between properties, either on an individual basis or at a group level. This purpose can be achieved in many different ways. Even if it is decided to

Property Taxation Guide 63
continue existing policies some tax redistribution will occur since every municipality’s property tax base and levy requirement change every year. At the opposite end of the spectrum, if there is a desire for strong policy intervention, there are many tools and options that can be employed to aggressively reduce or increase taxes on properties of different types or values.
TAX POLICY IS A ZERO SUM GAME
There are two fundamental points that must always be kept in mind when developing policies: property taxes are a “zero sum
game”—policies do not change the overall amount of the levy to be collected; and
for every tax reduction there must be an equivalent tax increase.
These two points are directly linked. As a municipality’s levy requirement is determined independently it is not changed by tax policy. Because the levy is fixed, the only effect that policies have is to shift the incidence of taxes between various taxpayers. Thus, if a tax policy causes a reduction in the taxes for one property there must be an increase in the tax bill for one or more other properties in order that the overall levy requirement is met. Given this fundamental point, objectives must always be considered not only in relation to the beneficiaries but also
from the perspective of the properties that will take on an added burden.
DEVELOPING A POLICY STRATEGY
Perhaps the most practical way of developing and presenting a policy strategy is first to establish the general policy objective(s) and then to identify in detail proposed policies and their potential result in relation to the objectives. Finally, since negative impacts will occur as a consequence of the requirement to “balance the books” (i.e. maintain the same levy requirement) should be identified. The underlying objective of Ontario’s property tax system is, over time, to have all properties treated relatively equally. Because historically non-residential classes were taxed more heavily many of the tax policy tools tend to result in higher taxes for residential properties. For this reason, if a municipality’s broad objective is to keep taxes down on residential properties, use of property class-based policy changes should be avoided. In contrast, in municipalities where a need is seen to reduce taxes for properties in non-residential classes, tax policy tools can easily achieve the desired result. The policy tools that are available enable changes to be relatively focused. For example, through the use of a combination of optional classes, tax bands and tax ratio reductions it is quite feasible to bring down the taxes for relatively specific groups of
64 Chapter 6
commercial and industrial properties. Where policy objectives are more property than class-specific—for example, to generally dampen the impacts of reassessments—other types of policies can be employed such as phase-ins and tax capping. With policies of this type positive and negative impacts can be contained within classes. Although some tax policies have class level impacts while others are more property-specific there is no reason why they cannot be combined if the desired outcomes combine both characteristics. For example, Council could have a specific desire to reduce taxes on large industries but also a more general objective of softening the impacts of reassessment. Both these objectives could be addressed with a combination of a tax ratio reduction on the optional “larger industrial” class and a phase-in program for residential properties. A final but crucial consideration that should always be part of the decision-making process is tax equity. While there is almost always an interest in influencing the tax burden of one type of property or another, it is crucial not to lose sight of the fact that by applying tax policies that have an advantageous effect on some properties, many other property owners will be required to pay taxes that are either higher or lower than they should be paying in relation to the “equitable” amount that the Province's tax system is designed to achieve—namely, equal taxes for
properties of equal value—at least within a given class. The objective of equity should therefore always be borne in mind when considering the use of tax policies that counteract movement to more equitable treatment.
Assessment Phase‐Ins
A backdrop to the development of tax policy strategy is the role played by the mandatory assessment phase-in program. As discussed in the previous chapter, as the Province’s tax system reforms have evolved the original objective of moving to annual reassessment based on market values in the prior year has been replaced with a four reassessment cycle combined with a phase-in. As a result, except for properties that have declined in value between reassessments, the assessments on which owners are taxed reflect property values of four years ago. The advantage of this approach is that property owners know from the outset what their taxable assessments will be over the four-year cycle until the next reassessment. This leaves only the tax rate as an unknown. For Finance staff, the four-year phase-in is also helpful as it provides a clear, year-by-year picture of the basic assessment increases that will be coming into effect. This information can be very helpful in shaping tax policy decisions by showing whether, for example, future assessment
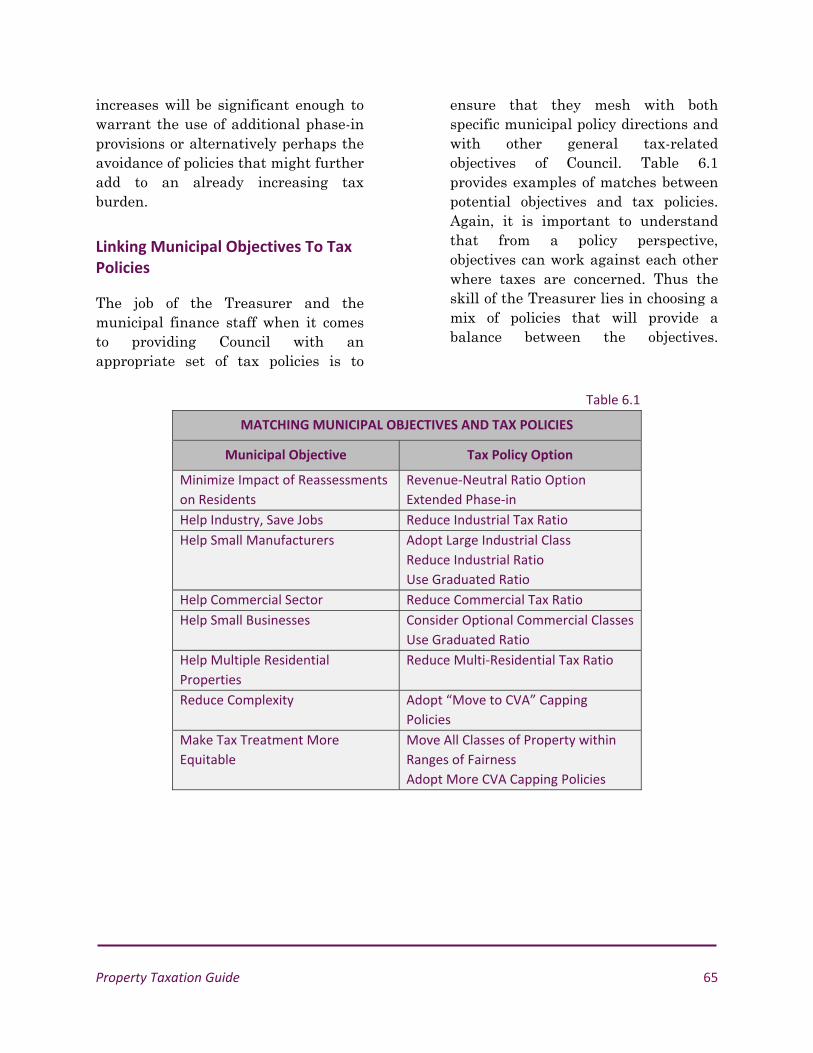
Property Taxation Guide 65
increases will be significant enough to warrant the use of additional phase-in provisions or alternatively perhaps the avoidance of policies that might further add to an already increasing tax burden.
Linking Municipal Objectives To Tax Policies
The job of the Treasurer and the municipal finance staff when it comes to providing Council with an appropriate set of tax policies is to
ensure that they mesh with both specific municipal policy directions and with other general tax-related objectives of Council. Table 6.1 provides examples of matches between potential objectives and tax policies. Again, it is important to understand that from a policy perspective, objectives can work against each other where taxes are concerned. Thus the skill of the Treasurer lies in choosing a mix of policies that will provide a balance between the objectives.
Table 6.1
MATCHING MUNICIPAL OBJECTIVES AND TAX POLICIES
Municipal Objective Tax Policy Option
Minimize Impact of Reassessments
on Residents
Revenue‐Neutral Ratio Option
Extended Phase‐in
Help Industry, Save Jobs Reduce Industrial Tax Ratio
Help Small Manufacturers Adopt Large Industrial Class
Reduce Industrial Ratio
Use Graduated Ratio
Help Commercial Sector Reduce Commercial Tax Ratio
Help Small Businesses Consider Optional Commercial Classes
Use Graduated Ratio
Help Multiple Residential
Properties
Reduce Multi‐Residential Tax Ratio
Reduce Complexity
Adopt “Move to CVA” Capping
Policies
Make Tax Treatment More
Equitable
Move All Classes of Property within
Ranges of Fairness
Adopt More CVA Capping Policies

66 Chapter 7
CHAPTER 7
DEVELOPING TAX
POLICIES This chapter discusses how to go about developing a set of tax policies using the various tools that are available to shape the distribution of taxes from the property class level down to the individual property. Decision‐making concerning tax capping policies are dealt with in Chapter 8.
Developing a municipality’s tax policies is an important undertaking since they have direct implications for individual property owners and indirect consequences for the community as a whole. Depending on the choices made they can, for example, help keep down the costs of homeownership or support the small business community. The treasurer has the key role in the policy-making process being responsible for turning general objectives of council into a cohesive and balanced set of technical policies that will achieve the desired results. The process can be very time consuming especially in a two-tier structure and even more so in a reassessment year. However, if the task is approached using a good step-by-step plan and the necessary technical support a final report can be brought to council in plenty of time to get the necessary by-laws passed and the tax bills out on time.
GETTING READY
The tax policy setting process requires a sound understanding of the options that are available and some experience in interpreting assessment data. In larger municipalities the Treasurer usually has the support of an analyst with knowledge of the various assessment files and the modeling skills necessary to develop policy scenarios. In smaller municipalities the Treasurer may have little or no as no support to draw upon. This need not be a problem since smaller municipalities

Property Taxation Guide 67
will typically be less complex to analyse. As well there are plenty of external resources to draw upon for advice and analytical support. The most widely available policy resource is the Online Property Tax Analysis (OPTA) system which is operated on behalf of the Ministry of Finance. It provides a very comprehensive range of services, in particular the maintenance and upkeep of data and tax calculations arising from the numerous assessment changes, for individual municipalities. There are also a number of highly experienced private consultants who provide support to municipalities regarding all aspects of tax policy and billing.
UNDERSTANDING THE KEY POLICY OPTIONS
The reforms to the property tax system of the 1990s granted municipalities authority to develop their own tax policies, albeit within provincially defined parameters that dictate overall direction. Municipalities have some latitude over the distribution of taxes between classes of property. The major limitation is that, except for the residential class, proportionate shares of taxes cannot be increased on a broad class unless the class ratio is within the provincially mandated ranges of fairness. Within this constraint, municipalities have the ability to control the distribution of taxes in the following ways:
maintain tax shares by class at the previous year’s level (except in restricted classes when tax ratios are above provincial averages), by choosing revenue neutral transition ratios;
reduce tax share for specific property classes (generally excepting the residential class), by reducing class tax ratios;
redistribute the class share of taxes within the commercial and industrial classes by adopting optional classes and varying tax ratios;
redistribute the class share of taxes within the commercial and industrial classes by using graduated banding based on selected CVA ranges; and
further slow the effect of reassessments on individual properties through use of phase-in beyond the mandatory four year program.
In addition, municipalities have a number of less significant policy options available regarding the treatment of new construction and new-to-class properties; the choice of class reduction factors for vacant and excess land; and how land awaiting development is to be treated. The following are the five main policy options:

68 Chapter 7
Revenue‐Neutral Ratios
Because values for different classes of property seldom change by a uniform rate, the relative shares of assessment shift between classes each time a reassessment occurs. If the residential class experiences increases at a rate greater than the municipality as a whole a tax shift onto the residential class will result. The increase would become even greater for those properties within the residential class that experienced above class average increases. Not surprisingly there is usually a desire by Council to soften the tax impacts of such shifts, especially if a municipal levy increase is required in the same year. Under the legislation, municipalities do not have the authority to alter this result because they are not permitted to increase non-residential tax ratios3 which would be necessary in order to counteract the shift. However, since 2009, a municipality may adopt transition (tax) ratios that enable a revenue neutral result to be achieved. Alternatively a municipality may instead adopt ratios that only partly offset impacts.
Alternative Class Level Ratios
In municipalities where a need is seen to reduce the tax burden on a particular class (excluding the
3 Unless the non-residential class ratios are with the ranges of fairness (which few are).
residential class), the class tax ratio can be reduced. While this does result in the share of taxes increasing on other classes, the amount of the increase need not be significant if the shift is distributed over a large base. Because of the difficulties that the industrial sector has been experiencing and because tax ratios have tended to be high for historic reasons, the industrial class is often selected for this treatment. Special rules apply in municipalities that have “restricted classes” (classes with ratios above provincial averages). In these situations the new transition ratios enable 50% rather than 100% of a levy impact to be passed onto restricted classes. To a certain extent, in municipalities that have restricted classes, legislation forces at least some ratio reductions to balance tax increases that would otherwise occur as municipal levies are raised. In other municipalities where class ratios are within the range of fairness both upward and downward adjustments can be made.
Optional Classes
Municipalities have more flexibility to shift tax burdens betweens groups of properties within classes than between classes. This applies to the commercial and the industrial classes where several optional classes may be used. In the commercial class they are shopping centres, office buildings and parking lots. Any combination of the

Property Taxation Guide 69
options may be adopted with all other properties remaining in the commercial class. As well, the first 25,000 square feet of each shopping centre and office building remains in the residual commercial class. In the industrial class one optional class, large industrial can be used. It applies to properties of at least 125,000 square feet with the first 25,000 square feet remaining in the residual industrial class. Flexibility is granted to adjust the ratios of the residual commercial and industrial class and each optional class that has been adopted. However, unless the broad class ratio is also adjusted, any change to either the ratio for the residual class ratio or an optional class will have a balancing positive or negative impact on the other classes. In short, within-class ratio changes are a zero sum game. As well, there are limitations on the upper limits for optional classes. Those with ratios already above the class average ratio cannot be moved up. Those below the class average can only be raised as far as the class average. Although consideration of optional classes tends to focus on how they work when adopted, it should not be forgotten that where optional classes have already been adopted they can also be cancelled. If this choice is adopted, all properties revert to the broad class tax ratio resulting in some being taxed more and others less depending on the optional class they were in previously.
Graduated CVA Bands
Graduated CVA bands are similar to optional classes but instead of being based on types of commercial or industrial properties the sub-groups are defined by CVA ranges. Either two or three bands may be chosen with no limits being placed on where the CVA boundaries between bands are set. Municipalities also have full flexibility to choose the relative tax levels for each band although the band with the highest value properties is always set at 100%. This policy tool is therefore designed to assist lower value properties within their respective classes. While banding is effective for helping owners of small properties it does not target small businesses as efficiently as they may be tenants within large properties with CVAs that fall within a higher band. For this reason banding is rarely used in Ontario. As with optional classes, graduated banding is a within class redistributive tool and thus is also a zero sum game. Councils can cancel banding at will.
Tax Phase‐in Programs
The option of providing a tax phase-in program was one of the original tax policy tools provided as part of the tax system reforms of the 1990s. While it remains an option for municipalities its usefulness has largely been diluted with the subsequent introduction of mandatory programs. The first was the capping program which effectively

70 Chapter 7
imposed a long term tax phase-in arrangement on properties in the multi-residential, commercial, and industrial classes. More recently the four year CVA phase-in program has extended phase-ins to other classes. Municipalities can still institute their own supplementary phase-in program which must be started concurrent with a reassessment. The term of the program can be up to seven years. As reassessments now occur every four years, with a phase-in based on more than four years not all of the tax impacts will have been phased-in before the reassessment occurs. As a result, the remaining impacts will be applied in the first tax year following reassessment. The complexities of such results could be very confusing for taxpayers and therefore makes such programs impractical. A further drawback is the additional administrative complexity that would be involved. As has been found with the capping program, in the case of properties that undergo a change, the work required to account for the effects on taxes when a phase-in program is in place can be very time consuming.
IMPLICATIONS OF THE CVA PHASE‐IN PROGRAM FOR TAX POLICY PLANNING
The four year reassessment cycle coupled with mandatory CVA phase-in program provides municipalities with a
substantial degree of certainty as to the size and distribution between property classes of the tax base. In a reassessment year when it makes most sense to undertake a full review of tax policies the only question marks are how much additional assessment from new development will be generated and how much will be lost as a result of appeals and other factors. Although the Treasurer can bring forward new tax policy proposals to council every year to respond to issues that may emerge such as the risk of a major plant closure, it is good practice to take account of the year-by-year impacts of the phase-in program from the outset.
How Does the CVA Phase‐In Program Work?
The way the program works is very straightforward. Properties that have declined in value since the previous reassessment are immediately taxed based on the new CVA amounts. Properties that have increased in value are taxed in the first year based on the amount of the previous CVA plus 25% of the increase. In the second year 50% of the CVA increase is added; in the third, 75%. In the fourth year the full CVA reassessment value is used.
Reviewing the Reassessment Phase‐In Effects
One way of thinking about the different year-by-year CVA amounts is

Property Taxation Guide 71
as if they are equivalent to the results of annual reassessments. As with reassessments, the CVAs of groups and individual properties will increase at different rates and by different amounts. The result is that their positions will change with some increasing their relative share of the overall total while shares of others decline. A key first task for the Treasurer or the tax policy analyst is to understand how these reassessment driven changes will develop over the four years of the reassessment cycle. The review can vary in the level of detail depending on the size and complexity of the municipality or, in the case of two-tier structures, the municipalities involved. Analysis along the lines of that discussed in Chapter 5 would provide the information needed to have a solid understanding of the full reassessment cycle. Two key types of change should be looked for in the data: general shifts at the class level and shifts at the sub-class level as between properties in the optional classes and by price level. Again, the level of detail that is warranted will depend upon the municipality or group of municipalities. Once the Treasurer and others who are involved in the tax policy process have gotten a clear understanding of the new assessment base and how it relates to the previous base, the policy objectives, options and evaluation can be undertaken.
DEVELOPING AND TESTING TAX POLICY OPTIONS
The key component in the tax policy process is the development and testing of options. For this, a systematic approach is essential in order to avoid wasted effort in the examination of incompatible options. The following is a suggested step-by-step process:
Prepare a List of Tax Related Municipal Objectives
The starting point in the policy development stage should be the identification of municipal objectives that have a direct or indirect implication for tax policies. The starting point will usually be the objectives that are embodied in the existing policies. Many municipalities now operate in accordance with strategic plans and these documents often provide general principles that can be helpful. Obviously, feedback from Council or Finance Committee can be crucial particularly if it is informed by prior briefings from finance staff on the reassessment results. Generally the types of policy direction that need to be considered are objectives such as: “Pineville strives to remain a
community where housing is affordable“

72 Chapter 7
“Retaining existing industries and attracting new ones is a key objective and is essential to the long-term economic health of the community“
The objectives should be listed and, as far as possible, ranked in order of importance.
Identify Impacts That Could Warrant Tax Policy Intervention
The second step in the process is to flag the reassessment impacts that are potentially significant enough to be given policy attention. The information should be drawn from the analysis of the reassessment files previously undertaken.
Develop and Model Policy Scenarios
Taking account of municipal objectives and reassessment impacts that may warrant attention, several tax policy options should be selected for scenario testing. The selection and testing should follow a logical progression starting at the broad class level and proceeding through consideration of optional classes, graduated CVA bands and, very occasionally, additional phase-ins. Throughout the analysis it is generally better to initially use the full reassessed CVA amounts rather than the year 1 phase-in amounts in order to see the reassessment impacts more clearly. Once a preferred set of policies has been selected, year-by-year summaries can be developed as supplementary information.
The first level of consideration should focus on three basic options:
Maintain the Class‐Level Status Quo
The status quo option maintains the same relative distribution of taxes between classes that existed in the prior year. To achieve this objective the revenue neutral ratio option must be adopted with the municipality applying for new transition ratios. This option makes stability the primary objective at the expense of tax equity. As a result, classes that, relatively speaking, have increased less in value than other classes will not get the benefit of the shift and instead will continue to pay at the previous level. Conversely, for classes that have made relative gains in value, taxes would be less than they should be from a tax equity standpoint. This option requires little analysis since the results will not differ greatly from the situations in the previous year except for overall growth. What should be calculated are the before and after differences by class attributable to the application of revenue neutral ratios. These amounts represent the tax equity “cost” of providing tax stability. An example of a revenue-neutral option is shown in Table 7.1. If a midway option is favoured between status quo and allowing the impacts of the reassessment to occur, a modified option can also be selected. As with the

Property Taxation Guide 73
status quo option, this would require new transition ratio which must be requested.
Permit Class‐Level Reassessment Tax Shifts
This option is the converse of the revenue neutral ratio option. Under this option, existing tax ratios are maintained thereby enabling interclass tax shifts resulting from the reassessment to occur. Greater tax equity is the result of this option. The same class level tax impact information required to understand the status quo option should be prepared in order to show the amount of the inter-class tax shifts that result. Table 7.2 shows an example of the impacts.
Class‐Level Ratio Changes
The third broad class level policy choice available is to directly control the distribution of taxes between classes. This is achieved by making changes to broad class ratios. Other than the legislative restrictions, there are no rules about how to shift tax distributions between classes. Instead this decision is for Council to make. However, broad municipal objectives as well as the results of the reassessment impact analysis should act as a guide to which classes warrant attention. If, for example, properties in the industrial class are subject to a disadvantageously high class ratio or if farmland has been adversely affected by the reassessment, tax ratio
reductions could have merit. An example of adjusting the industrial ratios is shown on Table 7.3.
Within‐Class Policy Choices
Once policy scenarios affecting the broad class level have been developed, within-class policy options for the commercial and industrial classes should be considered. Again, a systematic approach should be followed by developing scenarios that help further municipal objectives or address reassessment based impacts that have particularly negative tax impacts. In considering within-class scenarios, it is important that the analysis be layered on top of the scenarios being considered for the broad classes in order that the cumulative effects are accounted for. It is also essential that the analysis start from the “base case” represented by the class structure that was used in the prior year. Thus, if optional classes or graduated tax bands had been adopted previously, they should also be used in the base case for comparative purposes.
Commercial Class Considerations
The first step in the process should be to identify which if any of the “sub-groups”—either in optional class or properties defined by CVA ranges—warrant attention because of specific tax objectives or by reassessment impacts. Once identified, the next step is to decide on the degree of support

Table 7.1
EXAMPLE OF REASSESSMENT IMPACTS WITH REVENUE NEUTRAL RATIOS
Class CVA
(millions)
Ratio Weighted
CVA
(millions)
Tax Share of
Tax
(%)
Reassessed
CVA
(millions)
Revised
Neutral
Ratios
New
Weighted
Assessment
(millions)
Revised
Taxes
Revised
Share
(%)
Change in
Taxes
%
Change
Residential $2,400 1.00 $2,400 $48,000,000 42.55 $3,000 1.00 $3,000 $48,019,802 46.56 $19,802 0.04
Multi-Res $220 1.80 $396 $7,920,000 7.02 $264 1.87 $495 $7,920,000 7.02 $0 0.00
Commercial $600 2.20 $1,320 $26,400,000 23.40 $750 2.20 $1,649 $26,400,000 23.40 $0 0.00
Industrial $500 3.00 $1,500 $30,000,000 26.59 $450 4.16 $1,874 $30,000,000 26.59 $0 0.00
Farm $100 0.25 $25 $500,000 0.44 $120 0.25 $30 $480,198 0.43 ($19,802) (3.96)
Total $3,820 $5,641 $112,820,000 $4,584 $7,048 $112,820,000

Table 7.2
EXAMPLE OF REASSESSMENT IMPACTS WITH NO RATIO CHANGE
Class CVA
(millions)
Ratio Weighted
CVA
(millions)
Tax Share of
Tax
(%)
Re Assessed
CVA
($ millions)
Ratio New
Weighted
Assessment
(millions)
Revised Taxes Revised
Share
(%)
Change in
Taxes
%
Change
Residential $2,400 1.00 $2,400 $48,000,000 42.55 $3,000 1.00 $3,000 $52,029,146 46.12 $4,029,146 8.39
Multi-Res $220 1.80 $396 $7,920,000 7.02 $264 1.80 $475 $8,241,417 7.30 $321,417 4.06
Commercial $600 2.20 $1,320 $26,400,000 23.40 $750 2.20 $1,650 $28,616,030 25.36 $2,216,030 8.39
Industrial $500 3.00 $1,500 $30,000,000 26.59 $450 3.00 $1,350 $23,413,116 20.75 ($6,586,884) (21.96)
Farm $100 0.25 $25 $500,000 0.44 $120 0.25 $30 $520,291 0.46 $20,291 4.06
Total $3,820 $5,641 $112,820,000 $4,584 $6,505 $112,820,000

Table 7.3
EXAMPLE OF IMPACT OF BROAD CLASS RATIO CHANGE (APPLIED TO INDUSTRIAL CLASS)
Class Weighted
CVA
(millions)
Ratio Re-Assessed
CVA
(millions)
Tax Share of
Tax (%)
Ratio New
Weighted
Assessment
(millions)
Revised Taxes Revised
Share
(%)
Change in
Taxes
%
Change
Residential $2,400 1.00 $2,400 $48,000,000 42.55 1.00 $2,400 $52,668,352 46.68 $4,668,352 9.73
Multi-Res. $220 1.80 $396 $7,920,000 7.02 1.80 $396 $8,690,278 7.70 $770,278 9.73
Commercial $600 2.20 $1,320 $26,400,000 23.40 2.20 $1,320 $28,967,594 25.68 $2,567,594 9.73
Industrial $500 3.00 $1,500 $30,000,000 26.59 2.00 $1,000 $29,945,147 19.45 ($8,054,853) (26.85)
Farm $100 0.25 $25 $500,000 0.44 0.25 $25 $548,629 0.49 48,629 9.73
Total $3,820 $5,641 $112,820,000 $5,141 $112,820,000
Property Taxation Guide 77
that should be provided. This proposed outcome is achieved either by lowering the tax ratio for the targeted optional class or by defining graduated tax band parameters. Once this has been done the tax saving for the targeted group is reallocated among the balance of the class in order to maintain the overall tax yield for the broad class. Because there is such a wide variety of property types within the commercial class, the degree to which focussed tax treatment can be applied is quite limited. It is recommended that several scenarios involving different ratios or banding parameters be tested in order to strike an acceptable balance between the tax reduction for the benefitting group and the added burden that shifts to the remaining properties in the class. In municipalities where optional classes or graduated banding is already being used the policy option of reverting back to having only the broad class can be considered. In this case the impact on the various sub-groups is modelled by applying the broad class ratio for the residual class and each optional class or, if banding is being used, by applying 100% to all bands. In this way, before and after tax results can be seen.
Industrial Class Considerations
Within-class policy choices for the industrial class are more straightforward than for the commercial class as there is only one
optional class—large industrial—to consider. For graduated CVA bands the same choice of two or three bands is available. In general terms, the two policy tools achieve quite similar results as larger properties tend to have higher CVAs. As a first step it is recommended that the CVAs of properties in the large industrial class be examined to identify whether CVAs or property size would be the better factor for differentiating between properties. Of the two policy options, graduated banding is much more flexible as either two or three bands can be used and as boundaries between bands can be selected. By comparison, the size criterion for the large industrial class is rigid. Several alternative policy scenarios should be modelled in order to establish the best fit between furthering policy objectives (e.g. enhancing the tax environment for small industry) but not imposing too heavy a burden on existing large industries that support many jobs. In the event that consideration is given to rescinding an existing optional class or banding arrangement, a similar evaluation as discussed for the commercial class should be made.
Other Within‐Class Policy Considerations
There are two other considerations for the policy team to bear in mind when developing within-class policies for either the commercial or the industrial class. First, if an acceptable outcome is
78 Chapter 7
difficult to achieve because of the impacts that would have to be absorbed by the increasing properties, consideration should be given to applying a tax ratio reduction for the broad class. While properties in other classes would then be sharing the off-loaded taxes the impact could be relatively modest as it would be spread across a broad base. The second thought to bear in mind concerning the impact of policy choices is that the capping and clawback will dampen the impact on any properties that are subject to the program by limiting increases and clawing back some of the decreases that the policies create. For this reason capping and clawback reports should also be considered in conjunction with the evaluation of policy options. The final major step in the tax policy process is to test and finalize the preferred set of options. This step should involve firstly, the preparation of a comprehensive set of reports showing the projected tax outcomes for each scenario at both the broad class level and by optional class and/or graduated band. These results should be compared to the results under the base case reflecting the policy position for the previous year. Secondly, the
results should be evaluated in terms of their success in addressing the policy objectives established at the beginning of the process. If necessary, modifications can be made to the preferred scenario to establish “best fit.” Finally, revised reports incorporating the final modifications should be prepared. Before concluding the process, minor policy matters over which municipalities have control should be reviewed to confirm that existing policies should be continued. These include matters such as the reduction factor for vacant and excess land, the tax percentage factor for stage 2 farmland awaiting development, and the policies regarding brownfield sites (per section 365.1) and heritage properties (see Chapter 9). Once the Treasurer and other members of the team responsible for developing the strategy are satisfied with the combination of policies, a presentation should be prepared for Finance Committee or Council. In two tier structures a more complex reporting process will likely be required. An example of a tax policy presentation is provided in Appendix B.

Property Taxation Guide 79
CHAPTER 8
CAPPING AND
CLAWBACK Of all the elements associated with the tax reforms of the 1990s none were as complex as the requirement to phase in tax increases on multiple residential, commercial, and industrial properties.
This chapter addresses the requirements of part IX of the Municipal Act which are generally known as the Property Tax Capping Program. This program affects properties in the multi-residential, commercial and industrial classes. The capping program originated in 1998 once it was realized that as a result of the introduction of Current Value Assessment (CVA) and the elimination of the business occupancy tax, the impacts on many properties would be difficult for owners to absorb. In response, municipalities were required to cap increases; in the first year at 10% of the prior year’s amount and in the next two years at 5% per year. Levy increases were allowed on top of these increases. Subsequently, the basic 5% annual increase was mandated for future years. To pay for the cost of the caps most municipalities chose the option of clawing back some or all of the decreases that other properties in the capped classes were to have received as a result of the new CVA-based system. A few municipalities opted to pay for the caps using reserves or by increasing the general levy. This chapter explains how the capping process works and examines the other capping options and the pros and cons for adopting them. It also addresses the important aspect of post-billing adjustments.

80 Chapter 8
HOW DOES CAPPING AND CLAWBACK WORK?
The calculation of the cap and clawback is quite straightforward. The steps are set out in Table 8.1 below and are illustrated in simplified form in Table 8.2.
Table 8.1
ILLUSTRATION OF HOW CAPPING & CLAWBACKS WORK
Column Reference in Table 8.2
Step Actions in Each Step
C Step 1 Calculate the current year’s CVA taxes for all properties within the capped class
E Step 2 Subtract the component attributable to the annual levy change
E vs. B Step 3 Compare the current year CVA tax (e.g. levy change) with the prior year taxes to identify whether the taxes are increasing or decreasing
F Step 4 For increasing properties, apply the capping provisions to each property to determine the maximum tax
G Step 5 Identify all increasing properties with CVA taxes (e.g. levy change) higher than the maximum tax. The difference represents the capping requirement for the property
Total Capping Column G
Step 6 Sum the individual capping amounts to determine the total capping requirement for the class
Total Decreases Column G
Step 7 For decreasing properties, sum the individual decrease amounts to determine the total decrease amount for the class available to fund the capping requirement
Total Step 6/Total Step 7
Step 8 Divide the total capping requirement by the total decrease amount to determine the clawback percentage 72.42%
G Step 9 For each decreasing property, apply the clawback percentage to the available decrease to determine the clawback amount
H Step 10 Add the clawback amount to the prior years’ taxes
I Step 11 For increasing and decreasing properties, apply the levy change percentage. The result represents the current year’s billable tax.
Note: The illustration in Tables 8.1 and 8.2 is based on the mandatory capping program requirement of a 5%
increase for capped properties. The results would change if alternative provisions were applied.

Table 8.2 ILLUSTRATION OF CAPPING AND CLAWBACK CALCULATIONS
Increasing Properties
A B C D E F G H I
Property Prior Year Tax Current Year CVA Tax
Levy Change (2%)
Current Year Tax (excluding levy change)
Permitted Increase
Capping Requirement
Adjusted Tax Adjusted Tax Including Levy
Change
C / 1.02 C – D < B x 1.05 OR E ‐ B
E – (B + F) B + F H x 1.02
1 $4,000 $6,000 ($118) $5,882 $200 $1,682 $4,200 $4,284
2 $16,000 $12,000 ($235) $11,765 $500 $1,265 $10,500 $10,710
3 $6,000 $6,400 ($125) $6,275 $275 $0 (1) $6,275 $6,400
Total $20,000 $24,400 ($478) $23,922 $975 $2,947 $20,975 $21,394
(1) No capping required as increase less than 5% limit.
Decreasing Properties
A B C D E F G H I
Property Prior Year Tax Current Year CVA Tax
Levy Change (2%)
Current Year Tax (excluding levy change)
Available Decrease
Clawback Requirement
Adjusted Tax Adjusted Tax Including Levy
Change
C / 1.02 C – D B ‐ E F x 0.7242 (2) E + G H x 1.02
1 $5,000 $4,500 ($88) $4,412 ($588) $426 $4,838 $4,934
2 $3,000 $2,750 ($54) $2,696 ($304) $220 $2,916 $2,974
3 $12,000 $9,000 ($176) $8,824 ($3,176) $2,300 $11,124 $11,346
Total $20,000 $16,250 ($318) $15,932 ($4,068) $2,946 $19,878 $19,254
(2) Clawback percentage = 72.42%. Represents capping requirement as share of available decreases ($2,947 / $4,068).
Note. Totals may not add due to rounding.

82 Chapter 8
Understanding the Characteristics of Affected Properties
Before considering which set of capping policies to recommend, the finance team should become familiar with the impacts that the program is intended to address. The types and locations of properties that are facing tax increases and those that should be decreasing need to be understood. It is especially important to identify those properties which have particularly large influence on the overall requirements. A small town’s major industrial facility or perhaps a large shopping centre are examples of these types of properties. While the capping and clawback program is aimed at helping individual properties, the pattern of impacts is seldom random. It is more often the case that similar properties are affected in similar ways. For example, older industrial buildings, which tend to steadily decline in value, generally end up on the clawback side of the ledger following a reassessment as their taxes should decline in response to declines in value. From a policy point of view, this could well be a concern particularly if Council has as one of its economic development objectives the retention of manufacturing jobs that are often located in such facilities. Conversely, following a reassessment, successful shopping centres often become eligible for capping. If the cap is funded from within the commercial class, the cost often falls in part on older properties in a municipality's downtown core. As a
result, they may be subsidizing the shopping centre. Because of situations like this it is very important to understand the characteristics both of the properties that benefit from capping and of those that may be required to pay more.
The Mandatory Tax Capping Program
As a matter of practice, most capping policy decisions will be made in the first year of a reassessment cycle and then maintained with limited modifications until the next reassessment. As the legislation (section 329(1)) currently stands annual tax increases on properties in the three protected classes are restricted to 5% plus the change (if any) in the municipal levy. Municipalities can choose to recover the shortfall caused by the tax caps from other properties in the same class that are eligible for tax decreases (section 330). The amount to be recovered—the clawback—is calculated as a percentage of the potential tax decreases. This decrease percentage can be as much as 100% of the available decreases. Although municipalities must cap the taxes for increasing properties, they are not obligated to impose clawbacks on decreasing properties to pay for the tax capping. Instead, they can increase the general level or use funds from other sources. In light of this, how caps are to be funded is the first policy decision that should be made.

Property Taxation Guide 83
At one end of the policy spectrum, funding can come entirely from decreasing properties in the same class through clawbacks (subject to the 100% decrease limit). At the other end of the spectrum municipalities can pay for the cap though the general levy or other revenue sources. The third option is to take a middle course with some of the funding coming from decreasing properties as a clawback with the balance being funded in other ways. This result is achieved by setting the clawback percentage on clawed-back properties below the level required to fully fund the cap. There are a number of factors that should be considered in making the cap funding decision: How significant is the cap funding
requirement?
How many and what types of properties will be affected by clawbacks?
What alternative funding approach would be used to pay for the cap if not clawbacks?
After more than a decade of capping and clawbacks, many properties no longer qualify for capping assistance. At the same time the number of decreasing properties has declined significantly to the point that in some cases the decrease pool available to fund caps may not be sufficient to support the capping requirement.
In some municipalities, the capping cost may now be so small that the extra time and effort involved in using clawback funding is no longer warranted. Instead, caps can be funded from the levy or from reserves with limited impacts on other taxpayers. This approach has the clear advantage of: allowing the full amount of tax
savings to be passed on to decreasing properties. This helps avoid the taxpayer criticisms that often arise when clawbacks are applied.
reducing the work involved in making tax capping adjustments for decreasing properties when changes occur.
However, in municipalities where the capping requirements remain large and where Council is reluctant to fund the cap from outside the class, clawbacks will need to continue. There is no precise rule for deciding which approach to take. Instead, it is for the tax policy team to develop options, examine their impacts and to then make a recommendation based on an assessment of the relative advantages and disadvantages, all within the context of their council's broad framework of financial policies and other objectives.

84 Chapter 8
OPTIONAL TAX CAPPING AND CLAWBACK POLICIES
Since the early years of the capping and clawback program both municipalities and property owners have sought amendments to the program in order to speed up the rate at which tax changes are phased in. In response to these requests five new legislative options have been introduced which help municipalities achieve this objective. Most importantly, section 8.02 of O.Reg. 73/03 permits municipalities to keep properties out of the capping and clawback program once they begin to pay full uncapped taxes. Also now available to municipalities is the option to require “new” properties to pay full uncapped taxes rather than taxes based on the level for comparable properties. The policy decisions regarding the five options will differ depending on the characteristics of the properties within each capped class and the effect of the specific options. These options are discussed below.
Higher Tax Increases Phase‐in Rate
The mandatory annual rate at which tax increases for capped properties must be phased in is 5% based on the prior year’s annualized taxes. In addition, levy increases can also be added (Municipal Act s.329.1(1)1). Under the optional provision, municipalities have the choice of increasing the rate at which tax
increases are phased in up to a maximum of 10%. This change adversely affects properties that benefit from the cap but helps those that are required to forgo part or all of their decreases. To put this option into context, if a property is protected to the extent of 50% of its full taxes it would take almost 15 years to reach full CVA taxes if the 5% basic capping parameter were maintained. As well, several changes to the property are likely to arise. For each change, complex tax adjustments will be required. During the same period, owners of the properties that fund the cap will continue to be overtaxed in relation to their CVA taxes. Balanced against these arguments for a faster phase-in are the impacts on properties that would experience larger increases. To understand these impacts, reference should be made to the profile of affected properties within the class that was discussed at the beginning of this chapter. It would be important to know if a significant number of properties that benefit from capping are, for example, within an area such as downtown that Council is seeking to support. A more general consideration is that, while steps taken towards achieving tax equity more quickly (which, under the current system, is defined as CVA taxes) are in theory desirable, during difficult economic periods, higher tax increases can be especially difficult to

Property Taxation Guide 85
absorb. For this reason, there may be times when maintaining a slow pace towards CVA tax equity is the better policy. Again, the recommended approach for decision-making is to develop options to determine the impacts and then to weigh the advantages and disadvantages.
5% of CVA Tax Increase Option
The second “fast track” tax increase option that municipalities may choose is to phase in increases at up to 5% of CVA taxes (i.e. uncapped taxes). This option achieves the fastest of the three phase-in options for those properties where the starting point taxes are at or below 50% of CVA taxes. Unless there are some properties with very low taxes that warrant particular protection there is little reason not to adopt this option assuming the 5% to 10% option is also being adopted. With the two options in place, properties with starting tax levels at or below 50% of CVA tax will increase at 5% of CVA taxes (plus levy change). Those properties with starting points higher than 50% will increase by 5% of the prior year’s annualized taxes (plus levy change).
$250 Increase or Decrease Threshold
A third “fast track” option which municipalities may choose is based on dollar amounts rather than percentages. The option allows
municipalities to set thresholds on both increases and decreases at up to $250 per year. For properties where the remaining change to be phased in is no greater than $250, then full CVA tax is applied. The biggest impact of this policy option is felt by smaller properties where $250 is likely to represent a significant share of either the cap or clawback. If this option is adopted, capped properties can quickly be moved out of the capped group. For the finance department this is desirable in terms of efficiency and effectiveness. Nevertheless, imposing the increase threshold can give rise to very vocal complaints where $250 may equate to a very large percentage tax increase. Applying a threshold to properties for which taxes are decreasing has clear advantages and few potential drawbacks. The option shifts the properties with decreases below the threshold level to the uncapped tax position irrespective of the class clawback percentage. This is obviously popular with the affected property owners. It also helps reduce the administrative burden on the finance department. The factor that can deter municipalities from adopting this option is if the remaining clawback capacity is reduced below the amount required to fund the cap or if the clawback percentage would have to rise significantly thus placing a greater burden on the remaining properties subject to clawbacks. For policy
86 Chapter 8
decision-making purposes the key is to run scenarios using various threshold levels. The final choice as to which, if any, threshold to adopt can then be based on the balance between the number of properties that would move out of capping compared to the impact on the clawback percentage.
Treatment of “New Construction” and “New to Class” Properties
One of the most important changes that was made to the original capping and clawback provisions concerned the treatment of newly constructed properties and of properties that, because of a change, became eligible for capping or moved from one capped class to another. When capping was first involved, these types of properties had been dealt with “neutrally” by being taxed at their full uncapped amount. Subsequently, however, new rules were introduced requiring these properties be treated on an equivalent basis to “comparable” properties if, on average, the comparables were paying less than CVA taxes. This “comparable” based program is time-consuming to administer. Although MPAC has the job of identifying the comparable properties, municipalities are required to defend the result. In response to requests to eliminate the option, the capping legislation has been amended to allow municipalities to phase out the “new construction, new to class” provisions. By 2008,
municipalities were allowed to return to the original position with “eligible” properties being required to pay 100% of uncapped CVA taxes. Today there is very little reason not to adopt the option particularly as, given the many years of phase-ins, the number of comparables with low taxes has diminished significantly.
The “Stay at CVA Taxes” Option
Perhaps the most significant of the municipal options relating to properties in the capped classes is the provision allowing municipalities to exempt a property from capping and clawback if the property had begun to pay on the basis of the uncapped CVA taxes. The obvious appeal of this option is that once properties qualify they will no longer be affected by the complex administrative requirements of the program. This is appealing both to taxpayers and the finance department.
The “Cross CVA” Option
This option affects properties that are on the borderline between being capped and clawed back. Under the option, municipalities can choose to have properties that from one year to the next would move from being clawed back to being capped instead to pay CVA taxes. Municipalities may also choose to have CVA taxes apply to properties that move in the opposite direction from a capped to a clawback situation. Like the stay at CVA option,

Property Taxation Guide 87
this reduces the administrative work load and makes tax bills more understandable for others.

88 Chapter 8
The “Cat Hospital” and the Evolution of Tax Impact Mitigation Measures
From the point when the decision was made
to undertake fundamental reforms to
Ontario’s Property Tax system in 1997 it was
evident that there would be a need for
measures to help mitigate the tax impacts
on properties that would “lose” as a result of
the changes. The first set of measures that
municipalities could use to dampen the
impacts were phase‐ins, optional classes,
ratio changes and tax rate banding according
to property values.
However, once it became evident that
municipalities were either reluctant to make
use of these tax “tools” or that the tools
were not sufficiently effective to satisfy
angry tax payers, a mandatory tax capping
program was instituted. More than any of
the tax tools this program was very effective
at dampening property specific tax changes.
Inevitably, special rules were required to
deal with properties that did not fit the
norm. In particular, properties that were
“new” to the capped classes—in the form of
new construction or “new to class”
properties—were treated in a neutral
fashion. That is to say, their taxes were set at
the uncapped level—neither capped nor
clawed back.
However, some owners of new properties
discovered that a “neutral” tax treatment in
reality put them at a disadvantage compared
to their competitors whose properties had
capping protection. While fast food
restaurants were particularly prone to this
outcome, a new veterinary clinic became a
particularly well‐known victim of the system.
The response to the criticisms was the
introduction of the comparable tax
treatment test. Under its rules, “new”
properties were required to pay on the
lower of the level uncapped taxes or the tax
level of six comparable properties. With this
change control of tax impacts became close
to universal for properties multi‐residential,
commercial, and industrial classes. Since
then, changes to the capping program have
begun to reverse the process by allowing
municipalities more latitude to bring
properties to uncapped status more quickly
and then to exempt them entirely.

Property Taxation Guide 89
Summary of Options
As this review of the various options available to municipalities shows the capping program has evolved considerably since it was first introduced. The three major changes that have occurred are: the scale of the tax increases and
decreases has reduced significantly through the application of the mandatory annual increases or optional 5% to 10%.
municipalities now have options for phasing-in increases more rapidly.
the four-year assessment phase-in program has reduced the importance of the capping and clawback program.
While potentially the program may continue for quite some time, its financial significance to municipalities is declining to the point that it is becoming increasingly more practical to fund the cap from the general levy or other sources than to rely on clawbacks. Eliminating clawbacks reduces administrative requirements and removes an irritant for those owners whose properties are subject to clawbacks. At what point this step should be taken depends on circumstances, first at the class level in terms of the amounts involved and the number of properties affected and, second, at the municipal level where impacts of alternative funding for the cap on the other taxpayers will need to be considered.
POST‐BILLING ADJUSTMENTS
While for many taxpayers and others the basic workings of the capping and clawback program are difficult enough to understand, the complexities of post-billing adjustments are even more daunting. This is especially true when adjustments involve several taxation years and multiple change events. With the introduction of the four-year assessment phase-in program further complexity has been added to the adjustment process. The main types of change that give rise to post-billing adjustments are: supplementary and omitted
assessments;
assessment reconsiderations; Assessment Review Board
decisions; change events associated with
Section 357; and adjustments for tax calculation
errors under sections 358, 359, and 359.1 of the Municipal Act.
In a very general sense, all that post-billing adjustments involve is recalculating the taxes on the affected property using new assessment and/or classification information and then adjusting for the difference between these recalculated amounts and the amounts previously billed. Depending on the nature of the change, the calculations may affect the starting or
90 Chapter 8
prior year's tax, the CVA tax for the current year or both. For example, an Assessment Review Board decision concerning a previous year will certainly affect the previous year’s taxes but not necessarily the current CVA tax. Alternatively, a physical addition to a property that leads to a supplementary assessment will add CVA tax for the current year but will also require an adjustment to the starting point taxes to account for the difference. If no adjustment were made, the tax increase attributable to an addition could end up being capped. For municipalities, especially those with a substantial number of properties subject to capping and clawback, the work involved in tax billing adjustments can be very substantial. Except for a few large municipalities that have in-house resources, most municipalities rely on the Ministry of Finance’s OPTA system to provide the correct changes. Some municipalities use outside consultants for the calculations of the adjustment amounts. The services relieve municipalities of the highly technical and, in the case of OPTA, financial burden of calculating adjustments.
They also help ensure a high level of constancy in the application of the complex legislation from one municipality to another.
______________ The capping and clawback program has, for many municipalities, been the most challenging element of the property tax reforms. However, today, as a result of the underlying phase-in requirement and the more recent speed-up options available to municipalities, many properties are no longer affected either by caps or clawbacks. While there is no “sunset” provision in the legislation it is not unreasonable to speculate that the program could eventually be eliminated or made optional, particularly given the protection against sudden increases that the assessment phase-in program provides. However, as assessment appeals can take many years to get resolved it will be an equally protracted period before all capping and clawback adjustments could be finalized.

Property Taxation Guide 91
CHAPTER 9
ADMINISTERING THE
PROPERTY TAX Previous chapters have dealt with how taxes are calculated and how tax policy is formulated. This chapter describes key aspects of the annual property tax cycle and the responsibilities municipal finance staff have in the administration of the property tax.
The administration of the property tax for the most part follows an annual cycle. This is a function of its relationship with the requirement of Ontario municipalities to prepare annual budgets and the annual updates to the assessment roll.
SETTING TAX RATES
The mechanism for setting tax rates is relatively straightforward. For single and two-tier municipalities the first step is to evaluate tax policy options—tax ratios, optional tax classes, graduated tax rates, phase ins, tax reductions, and tax capping—in the context of the tax levy requirement, the assessment roll, and tax policy objectives. Each year, single and upper tier municipalities are required to pass by-laws setting their tax ratios (even if tax ratios do not change from the previous year). The tax ratios set by an upper-tier municipality also apply to the lower-tier municipalities. The deadline for passing the by-law is April 30.
Delegation of Tax Ratio Setting
Under sections 309 and 310 of the Municipal Act the authority to set tax ratios can be delegated from upper-tier municipalities to lower-tier municipalities. Delegation must be done by by-law at the upper-tier and through consenting resolutions by all the lower-tier municipalities by February 28 and must be received by the Minister of Finance by March 15. A regulation authorizing the delegation
92 Chapter 9
of authority must also be passed by April 1. Upper-tier municipalities that choose to delegate tax ratio setting authority must develop a methodology to determine the amount of the upper-tier levy that each of the lower-tier municipalities would be required to raise.
Calculation of Tax Rates
Once the tax ratio by-law has been passed municipalities can calculate tax rates and pass the required rating by-law. The adoption of tax ratio by-laws also allows lower tier municipalities to prepare the final bills for properties in the non-capped property classes. Table 9.1 illustrates the tax rate calculation process.
Accounting for PILTs
In calculating tax rates some municipalities treat their PILT assessment as equivalent to taxable assessment. Under this approach PILT revenues are excluded from the calculations to determine the levy requirement. Other municipalities prefer to treat PILTs as non-tax revenue. Accordingly the levy requirement is reduced to reflect the anticipated PILT revenue. However, to adjust for this the PILT assessment is excluded when calculating tax rates. While the difference in the two approaches is not significant, assuming that the PILT assessment is reflective
of the basis on which PILTs will be paid (not always the case), the PILT-inclusive rate calculation method is more accurate. The PILT estimate-based method is often preferred as it enables some leeway to be built in if the prior year’s payment is used as the estimated amount for the current year.
PROPERTY TAX COLLECTION
Under section 340 of the Municipal Act the Treasurer of a local municipality is responsible for preparing an annual tax roll setting out the characteristics, CVA, and taxes payable for every property in the municipality. The tax roll forms the basis for property tax collection. Rules regarding payment of taxes by installments are contained in section 342 of the Municipal Act. Sections 343 and 344 of the Act establish the rules regarding the content and form of tax notices and tax bills. Property tax billing can place significant demands on staff resources even though most municipalities use billing software. In smaller municipalities tax bills can be managed in house. In larger municipalities, where thousands of tax bills must be printed and mailed, it may be more efficient to outsource the billing function to an external service provider. The situation is similar for processing tax payments: economies of scale in large municipalities may justify contracting the work out and may allow a range of payment options

TAX RATE CALCULATION PROCESS Table 9.1
Expenditures TaxableAssessment
xStep 1: Establish Step 2: Calculate
Non‐TaxRevenues
LevyRequirement
WeightedAssessment
Tax Ratios
_
=
x=
Levy Requirement Weighted Assessment
Levy Requirement
Weighted Assessment
=Residential
Tax Rate
Step 3: Calculate Residential Tax Rate
xTax Rate
=
Tax Ratios
Step 4: Apply Tax Ratios toEstablish Class andSub Class Rates
Class andSub-ClassTax Rates
Sub‐Class Rates

94 Chapter 9
to be available to taxpayers (e.g. flexible installment schedules, direct withdrawal options). The portions and timing of remittance of upper-tier taxes by lower-tier municipalities can be set by the upper-tier Council. The schedule for the remittance of property taxes to Counties is prescribed under section 311 (13) of the Municipal Act:
Table 9.2
SCHEDULE OF TAX REMITTANCE TO COUNTIES
Remittance Deadline
Amount
March 31 25% of amount to be raised by lower tier for County purposes in prior year
June 30 50% of amount to be raised by lower tier for County purposes in current year, less previous installment
September 30 25% of such current amount
December 15 Balance of entitlement for the year
Note: County governments may by agreement establish an alternative installment schedule (section 311 (15)).
A full list of the dates and deadlines for billing, collection, and remittance of property taxes is provided in Appendix B.
Tax Certificates
Under section 352 of the Municipal Act the Treasurer is required, upon written request, to provide a statement (or certificate) of taxes owing on any rateable property. The statement is binding on the municipality. Tax certificates are usually requested by lawyers at the closing of a real estate transaction and municipalities typically charge a fee to cover the cost of processing a request.
MANAGING THE ASSESSMENT ROLL
Since it is the basis of the largest single source of revenue, the assessment roll is one of a municipality’s most important records. While the Finance department has no control over the roll’s content, it should monitor it carefully. It is also good practice for the Treasurer and at least one other member of the Finance department to have a solid understanding of how the CVAs are established. In this way they will be better able to brief Council on the effects of key changes from reassessments and major appeals. This does not mean that the Treasurer needs to understand the intricacies of a cost estimate of an industrial building or of the statistics underlying a multiple regression analysis. However, it is important that at least one member of the Finance team understand the techniques that the assessors use and to be able to give a

Property Taxation Guide 95
simple description of them when questions arise. In large municipalities where there is a significant volume of assessment-related issues, there can be merit in having an assessment specialist on staff or a consultant on permanent retainer. There is much that municipalities can do to help keep the assessment roll up to date. The extent to which municipalities assign staff to this activity will depend upon the level of activity causing change in the assessment roll as well as the availability of resources. Generally, in municipalities where development is stable changes in the assessment roll are relatively gradual and predictable. Other than the changes arising from assessment phase-ins, few significant tax shifts occur. Conversely, in municipalities where substantial development is occurring it is important that new assessment is added to the tax roll quickly and accurately. When pursuing a proactive approach to managing the assessment roll the finance department should: coordinate with planning and
building staff to ensure that information on new building construction is regularly updated (especially building occupancy) and sent to MPAC. For new properties to make their way on to the assessment roll the flow of information to and from MPAC must be prompt.
ensure that MPAC is made aware of any changes to existing properties that would affect property values—rezoning or registration of draft plans of subdivision for example. This is particularly important for the calculation of supplementary and omitted assessments. Coordination between finance and building departments is critical in this regard.
forecast the tax revenue
implications of anticipated development—this is especially important in municipalities in which large non-residential development is to be constructed.
analyze the assessment roll to
identify where potentially under-assessed properties as well as errors and omissions exist.
Some municipalities may choose to rely entirely on MPAC for maintaining the assessment roll. While this is a perfectly reasonable approach it should be made with the understanding that miscalculations that work to the disadvantage of the municipality are less likely to be picked up, at least, in a timely manner.
ASSESSMENT APPEALS
Under the Assessment Act, municipalities are always party to an assessment appeal. However, since MPAC is responsible for valuing and classifying properties, municipalities have only a limited involvement in the assessment aspects of property

96 Chapter 9
taxation. Nevertheless, because the tax base is the most important source of revenue, municipalities should take an interest in knowing that the values are accurate. If assessments are too high, owners are likely to appeal. If assessments are too low, tax rates will be higher than they should be. For the most part, a municipality does not need to get actively involved with assessment appeals that are initiated by property owners since MPAC has the responsibility for defending its decisions. However, from time to time situations may arise when a municipality will want to be more directly involved in monitoring an appeal. Very occasionally it may wish to initiate an appeal of its own. Knowing when and how to go about getting involved is important. This will depend on the nature of the circumstances.
Owner‐Initiated Appeals
The first is when an appeal is initiated by a property owner. For a municipality to get involved in this type of appeal it must represent a potential loss significant enough to materially affect revenues. Typically this occurs with an appeal of a municipality's largest property and when the reduction being sought is very substantial. In these circumstances the municipality should undertake the following steps: 1. Ask MPAC for an evaluation of the
appeal in terms of:
the scale of potential losses and chances of various outcomes;
the likelihood for reaching a settlement; and,
the key appeal issues and the potential impact on other properties.
2. Prepare a financial analysis based
on various appeal loss scenarios. 3. Depending upon the loss scenario
results, develop a suggested settlement position.
4. Consider retaining an assessment
expert to provide advice if the scale of potential losses is such that council is likely to warrant an independent opinion in addition to one from MPAC.
5. If significant legal issues are involved, consider retaining an assessment lawyer to provide advice and, if necessary, to represent the municipality during the hearing.
6. Liaise closely with MPAC in order
to keep abreast of the appeal stages and especially to provide municipal input concerning settlement proposals.
It must always be recognized that as MPAC does not take its direction from municipalities, it will make its own decisions concerning appeals. Furthermore, should a municipality disagree with MPAC it may find itself opposed at the Assessment Review Board by both the owner and MPAC.

Property Taxation Guide 97
For this reason, it is generally far better to work with MPAC than to take an independent direction. Municipalities can often be helpful during appeals by providing useful information about issues such as municipal planning and servicing.
Municipality‐Initiated Appeals
From time to time it may be necessary for a municipality to appeal an assessment. In municipalities that have a staff person or a consultant on retainer responsible for systematically reviewing assessment appeals this may be more common. If the municipality initiates an appeal there are more exacting requirements to fulfill. Depending upon the size of the municipality and the availability of legal assistance the Finance department and, more specifically, the Treasurer may be required to take the first step in the appeal process. In such cases it is advised that the ARB Rules of Procedure and Practice be reviewed. In this regard, there are a number of points to be remembered: Date of appeal: 90 days following
return of the roll or March 31.
Notice of appeal: must be sent to Assessment Review Board and to the property owner(s). As a practical matter it is also advisable to send a copy to MPAC.
Fees: the appeal notice must include the stipulated fees.
Request for higher assessment or higher rate property class: if a higher assessment or of a change to a class with a higher value ratio class is the intention of the appeal, the notice of appeal must give details of the proposed value or class change.
Most importantly, prior to submitting a notice of appeal, Council should pass a resolution endorsing the appeal. While recent court decisions suggest that Council authority is not required to initiate an appeal the courts have also made clear that getting such authority should be considered best practice. Unless the municipality has an assessment expert on staff, it is advisable to retain one before or soon after initiating an appeal. As well, it will usually be necessary to engage a lawyer. Since legal and assessment expertise can be costly, it is prudent to understand right from the start what is the objective of the appeal in terms of potential “return“, what are the chances of success and what are the potential costs for lawyers and experts. By approaching appeals in this way realistic budgets can be established thus avoiding the “cold feet” that often arises if costs have not been estimated in advance and if the objectives have not been properly analyzed. In short, appeals are serious business and should not be entered into without careful consideration. If it is decided to proceed with an appeal, it is prudent to retain the necessary expertise rather

98 Chapter 9
than relying on the hope that the property owner will want to reach a settlement. As with owner-initiated appeals, it is important to work closely with MPAC. However, it should be anticipated that MPAC may well not be supportive of the municipality's appeal since fundamentally it is a challenge to MPAC’s position. If this is the case, the municipality should expect to be treated by MPAC in much the same manner as the property owner.

Property Taxation Guide 99
Beware Major Appeals! Although the legislature largely dictates the
way in which properties are assessed
through the Assessment Act, from time‐to‐
time the courts play a key role in the
process. Very occasionally issues have been
regarded as so significant that appeals have
been taken as far as the Supreme Court of
Canada. What constitutes real property or
what is meant by the term “market value”
are the types of questions that these
precedent setting appeals address.
For a number of years hotel valuations were
the subject of many hearings. Because the
business of operating a hotel is so closely
tied to the physical real estate it is difficult
separate the two components. As a result
hotel owners and MPAC litigated matters
back and forth until a set of principles had
been established through various board and
court decisions. Interestingly one
component of the hotel valuation process—
the allowance to be made for the
management fee—has been regulated;
perhaps in order to discourage still more
appeals. For municipalities, long running
appeals are nothing but a headache. Not
only do they usually involve large amounts
of taxes—otherwise owners wouldn’t bother
to pursue the appeals so vigorously—they
also create uncertainty that can extend for
many years. An example of this problem
concerned golf courses. It was close to ten
years before a large group of appeals
involving properties in several municipalities
were resolved. In an echo of the earlier hotel
appeals, one of the key issues was the
separation between business value and real
estate.
Another “cause celebre” concerned the
valuation of the “Bank Towers”, a group of
prestige office buildings in Toronto’s
financial district. Of the various issues in
dispute the key one was the meaning of the
term “without encumbrances” which is part
of the wording of the Assessment Act
relating to current value. Encumbrances are
obligations such as leases or mortgages
taken on by owners and tenants.
In the appeal the owner’s experts
interpreted the term to mean that the
buildings should be valued as if vacant.
MPAC’s view was that building occupancy
should be assumed but that leases should
reflect market rents for space at the date of
valuation (not necessarily actual lease rents
which might be at non‐market rates as they
would represent encumbrances). Difficult as
it may be to imagine, the annual tax
implication of this issue was in the tens of
millions of dollars.
After a very long hearing the Assessment
Review Board issued a detailed and carefully
argued decision that endorsed the owner’s
position. MPAC and the City of Toronto (with
a number of other municipalities in support)
appealed and obtained a successful decision
that now stands. However, even after more
than ten years, the Bank Tower appeals have
not yet been fully resolved as some aspects
of the decision have yet to be resolved.
For municipalities, the conclusion to be
drawn from these examples is to hope that
none of their major properties becomes the
subject of a precedent setting appeal.

100 Chapter 9
TAXATION‐RELATED APPLICATIONS
There are a significant number of tax-related issues under the Municipal Act which potentially involve Assessment Review Board hearings. These include: division of taxes among parcels reclassification land becoming vacant or excess exemption fire and demolition repairs and renovations overcharges due to gross or
manifest errors vacancy rebates For most of these issues Council is required to hold a meeting and to make decisions concerning the various applications. Alternatively, it may authorize the Assessment Review Board to make decisions on its behalf. If Council does not make a decision, applicants can appeal to the Assessment Review Board. In either situation it will generally be necessary for a representative from the Finance department to put forward the municipality's position. In most but not all situations this responsibility should not require the services of a lawyer. However, the financial calculations that may be involved could be complex.
TAX REBATES
There are several programs that provide relief from property tax to specific properties types or property owners. Although some of the
programs are mandatory most provide municipalities with broad discretionary powers over eligibility criteria, the amount of relief provided, and program administration. Under most of the programs tax relief applies to all elements of taxes paid—education and municipal. In such cases the Province will fund the education portion of the reduction or rebate. Given the potential scale of the programs, their cost should be analyzed and funding identified in municipal budgets.
Low Income Seniors and Disabled
This is a mandatory program under section 319 of the Municipal Act to provide relief from property tax increases to homeowners who are, or whose spouses are, low income seniors or disabled. Program eligibility criteria are set out by by-laws passed by single and upper-tier municipalities. The program is administered by lower-tier municipalities. The program must set out the definition of low-income seniors and low-income disabled persons. Eligibility for relief is typically determined based on applications for senior supplement benefits (the federal Guaranteed Income Supplement or benefits under the Ontario Disability
Property Taxation Guide 101
Support Program for example).4 Municipalities must also decide whether relief is to take the form of a cancellation of the tax increase, a rebate or a deferral. A municipality that chooses to defer taxes may specify a rate of interest to be charged on the deferred tax amounts. However, the rate cannot exceed the market rate as determined by the municipality. Any payment made toward deferred taxes must first be applied to any interest which has accrued on account of the deferral. If a lower-tier municipality levies a tax rate for upper-tier or school purposes in respect of which there is a deferral or cancellation of tax increases or other relief, the amount of taxes that the lower-tier municipality pays the upper-tier municipality or school boards will also be reduced accordingly. The lower-tier must pay the upper-tier and school boards their share of any deferred taxes and interest when they are repaid. Tax certificates issued by the Treasurer must show the amount of deferred/cancelled tax and any interest accrued.
4 Guidelines on how to define a low income senior are provided in the Ontario Guaranteed Annual Income Act and federal Old Age Security Act. For low income disabled definitions the Provincial Income Support Plan for People with Disabilities is a useful guide.
Note that, under the Assessment Act, alterations and additions made to residential properties to accommodate seniors and disabled persons are exempt from property taxation. It is the responsibility of property owners—not the municipality—to inform MPAC of the improvements and MPAC’s responsibility to indicate the exempt status on the assessment roll.
Charities and Non‐Profit Organizations
Under section 361 of the Municipal Act charities that have a valid registration number issued by the Canada Revenue Agency are eligible for a rebate of a minimum of 40% of total property taxes payable. Charities that own property in the commercial or industrial property classes or that are tenants of a business property are eligible for the rebate (though the program can be extended to properties in other classes). Rebates of between 0% and 100% can also be provided to organizations deemed to be similar to a charity (i.e. a non-profit). Eligibility is determined by single and upper-tier municipalities and is administered by lower-tier municipalities. Applications for a tax year are accepted after January 1 until February 28 of the following tax year, but municipalities may accept applications after this deadline if the applicant encounters justifiable extenuating circumstances.

102 Chapter 9
Optional Relief from Hardship
Municipalities may, under section 365 of the Municipal Act, create a program offering property tax relief for properties in the residential, farmland, or managed forest property classes if the taxes that would otherwise be imposed are “unduly burdensome.” Municipalities have the authority to define what is meant by this term as well as the amount of relief and the eligibility criteria. The cost of the relief program is automatically shared by school boards in respect of the education portion of the property tax. Upper-tier municipalities have the option of sharing the cost with respect to the upper-tier tax portion but need to pass a by-law in such cases. Because of the very subjective nature of the term “unduly burdensome” and the general reluctance of Councils to become involved in issues better dealt with by other agencies this program is not widely used.
Heritage Properties
Under section 365.2 of the Municipal Act, municipalities may provide tax reductions or refunds of between 10% and 40% to properties (or portions of properties) that are designated as heritage under the Ontario Heritage Act. As with the optional relief from hardship program the cost of the relief
program is automatically shared by school boards in respect of the education portion of the property tax. Upper-tier municipalities have the option of sharing the cost with respect to the upper-tier tax portion but in such cases need to pass a by-law to agree to share the program. MPAC is required to provide information concerning the portion of a property’s total assessment that is designated heritage property within 90 days after receiving a request from a municipality.
Brownfield Sites
During the rehabilitation and development of a brownfield (i.e. contaminated) property a municipality can, under section 365.1 of the Municipal Act, cancel some or all of the municipal property taxes. Similarly, education property taxes can be cancelled or reduced with the approval of the Minister of Finance. An upper-tier municipality is permitted to participate in the program by cancelling some or all of its portion of property taxes provided it has been asked to do so by its lower-tier municipalities. The total tax relief is limited to the cost of reducing the concentration of contaminants on the property so that a Record of Site Condition under the Environmental Protection Act can be filed. The duration of assistance is also limited to a maximum of 18 months; however, eligible costs remaining once

Property Taxation Guide 103
the time limit expires are eligible for other (non-property tax related) financial assistance programs.
Vacancy Rebates
One of the more straightforward administrative issues is the requirement for the municipality to provide tax rebates for vacant industrial and commercial units. This requirement is set out in section 364 of the Municipal Act and Ontario Reg. 325/01. There are a number of points to be borne in mind in administering the program. For example: space must be vacant and unusable.
If the owner is using the space for storage but has the space available to rent it does not qualify as vacant.
if space is leased it is not eligible
for a rebate even if it is not occupied by the tenant.
space must be clearly delineated or
separated physically from other parts of the building. This can be a difficult issue in industrial facilities. It is recommended that owners be required to have such areas cordoned off with, at a minimum, plastic tape. If a rebate is sought for individual offices within a larger space, consideration should be given to requiring the applicant to demonstrate that the space truly should be treated as separate by producing, for example, rental advertisements for the space.
The level of scrutiny that may need to be given to each application may vary from municipality to municipality. In larger municipalities containing large complex properties that have many units, physical inspections and documentary support (e.g. expired leases and rent rolls) will generally be essential. These evidentiary requirements should be specified by the municipality as part of the rebate program details. Inevitably, there are likely to be instances where an application is not approved and the owner appeals to the Assessment Review Board. In these circumstances it will probably be necessary for a member of the Finance staff to appear before the Assessment Review Board to explain why the application was not accepted. Having a clear set of notes explaining the basis for the refusal is usually all that would be required. In some cases, the application may be only partially defective—the number of days may be wrong or the part of the space may not qualify. In these situations it is reasonable to adjust the rebate rather than reject the application. However, it is probably not necessary to accept applications to increase the amount of space for which a rebate is being claimed. The vacancy rebate program is an important element of the Finance department responsibilities particularly since it requires the verification of the details of each application.

104 Chapter 9
DIVISION OF RESPONSIBILITIES IN TWO‐TIER JURISDICTIONS
The division of tax responsibilities in two-tier municipal jurisdiction is shown in Table 9.3.
Table 9.3
DIVISION OF TAX RESPONSIBILITIES
Upper‐Tier Lower‐Tier
Tax ratio setting (or
delegation to lower‐
tiers)
Tax ratio setting (if
delegated by upper‐
tier)
Optional property
classes
Property tax billing
and collection
Graduated tax rates Tax bill adjustments
Phase‐in of property
tax changes
Tax relief from
hardship
Funding of
mandatory caps for
multi‐residential,
commercial, and
industrial properties
Tax
reductions/rebates
for heritage
properties
Charity and non‐
profit rebates
Low income senior
and disabled
homeowner relief
USING CONSULTANTS
Municipalities often use consultants either when they lack the expertise or resources to undertake specific tasks or for special one-time projects that are more efficiently outsourced. For ongoing work in managing the tax roll municipalities often employ consultants on contract. These internal
consultants are usually trained assessors—former Provincial or MPAC employees—and the tasks they are normally responsible for are: reviewing the tax roll to identify
errors or omissions; working with MPAC to update
assessments; undertaking real estate analysis to
“ground truth” assessments; reviewing applications and inspect
buildings regarding application for commercial and industrial vacancy property tax rebates; and
reviewing supplementary and
omitted assessments. Municipalities will occasionally require external assessment, property tax, and legal assistance on specific, or one-time issues such as: tax policy analysis and advice;
tax capping and clawback
calculations;
printing and mailing tax bills;
tax payment processing; and
appeals. In fast growing municipalities, where new development needs to be quickly identified to MPAC in order to be placed on the roll and then taxed, consultants can be of particular assistance. They can work seasonally
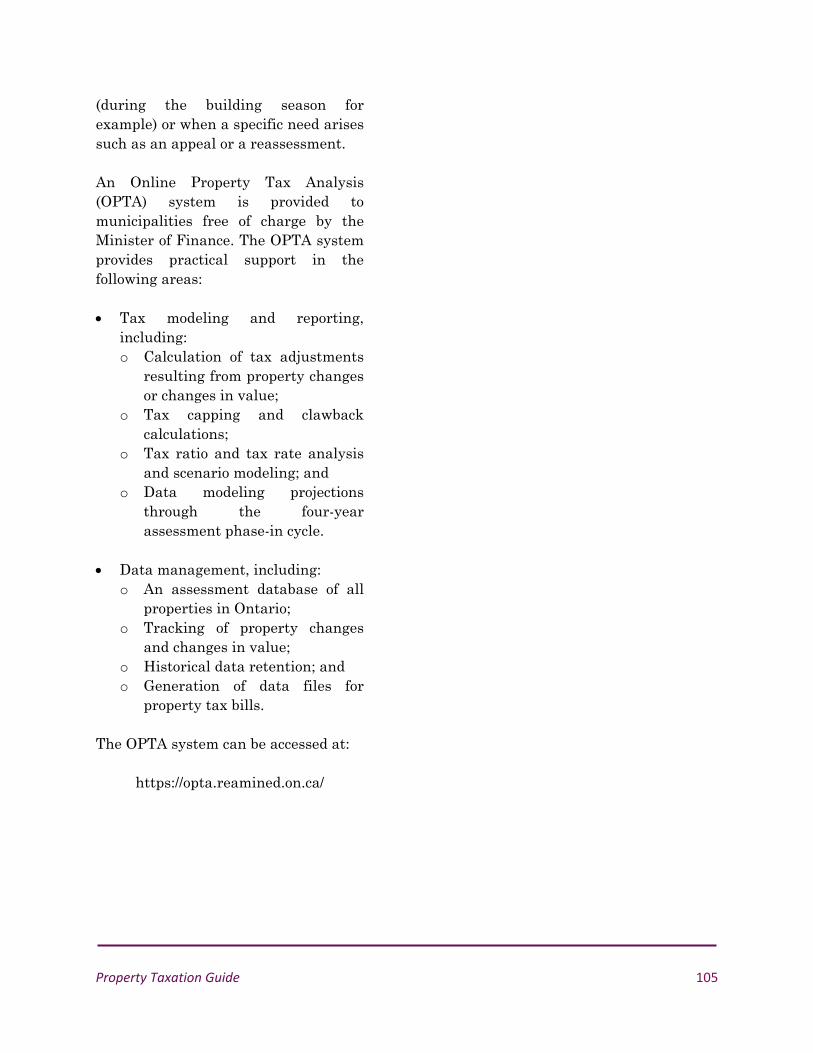
Property Taxation Guide 105
(during the building season for example) or when a specific need arises such as an appeal or a reassessment. An Online Property Tax Analysis (OPTA) system is provided to municipalities free of charge by the Minister of Finance. The OPTA system provides practical support in the following areas: Tax modeling and reporting,
including: o Calculation of tax adjustments
resulting from property changes or changes in value;
o Tax capping and clawback calculations;
o Tax ratio and tax rate analysis and scenario modeling; and
o Data modeling projections through the four-year assessment phase-in cycle.
Data management, including: o An assessment database of all
properties in Ontario; o Tracking of property changes
and changes in value; o Historical data retention; and o Generation of data files for
property tax bills. The OPTA system can be accessed at:
https://opta.reamined.on.ca/
106 Chapter 10
CHAPTER 10
DEALING WITH
STAKEHOLDERS Not surprisingly, given the amount of money involved and its importance as a revenue source, property tax is a “hot button” issue both for municipal stakeholders as well as those who pay the tax. Finance officials play an important role in communicating how property tax works. How best to carry out that role is the subject of this chapter.
MUNICIPAL STAKEHOLDERS
In the municipal environment the most important stakeholders for municipal finance staff are Councils. Although Council members focus perhaps more on the municipal budget they are nevertheless very interested in the effects tax legislation, tax policy, and reassessments will have on the taxpayers they represent.
Council
Once the annual budget is set and the tax levy requirement determined Finance staff have an important role in advising Council about the related property tax policy implications. In particular, Council needs to be informed about: the tax policy options available;
tax shifts that have occurred as a
result of assessment growth and phase-ins;
how tax rates will change given the revised assessment roll values and tax policy proposals; and
the impact of legislative change. Above all remember that tax policy choices are numerous, complicated and need to be made under Council direction. Choosing the right metrics and benchmarks is crucial when discussing the tax burden with Council. Appendix B contains some sample presentation

Property Taxation Guide 107
materials that can be used for these discussions. In general: select benchmark comparators
carefully. Include municipalities of similar size, assessment distribution, and vicinity.
be careful about the metrics you
use. Tax rate comparisons do not necessarily provide information about the tax burden in a municipality (taxpayers are not interested in the tax rate or the complicated formula that goes into calculating it). Better metrics are the tax payable per average household5 or the tax payable per average household as a percentage of average household income.
ensure that when discussing the
tax property owners will actually pay you include the total tax burden (lower and upper tier as well as education components).
Finance staff should always make sure to identify the effects of reassessments and any policy changes or proposals on
5 Average residential CVA and taxes can be calculated in different ways. A common method is to divide the fully taxable residential CVA on the assessment roll by the number of private dwelling units. This method does not take account of any specific type of unit. Alternatively the analysis can be based on typical examples of single family, townhouses, and condominium apartments to provide a more rounded picture. As well, the year-by-year changes that occur as a result of the phase in program should be identified both in terms of annual changes but also by area.
the residential taxpayer, recognizing that they are both the largest property owner group as well as (by far) the largest group of voters. Also to be remembered is that factors other than economic and financial will be considered when Councils consider tax impacts on businesses. Discussions on how businesses should be taxed should therefore include information on: what services businesses use in the
community; the number of jobs associated with
large properties;
the degree to which businesses are prone to relocation;
the relative competitiveness of the
municipality in terms of tax rates; and
tax incentive programs (for
example the reduction or cancellation of taxes on brownfields under section 365.1 of the Municipal Act) the municipality could offer to promote growth.
Very importantly, Finance staff need to keep Council informed of the status of major appeals on a regular basis, particularly those appeals with a significant financial liability.
Other Municipal Stakeholders
In two-tier municipal jurisdictions both levels of government must work closely together on property tax matters. In particular:
108 Chapter 10
although tax policy is the responsibility of upper-tier municipalities, support for tax policy choices requires effective and transparent consultation with lower-tier municipalities on both policy options and impacts. This is especially true in cases where the impact of tax policy is not uniform at the local level.
the statutory inter-municipal
transfers of taxes require coordination of administrative procedures and tax records.
even though upper-tier
municipalities are not a statutory party to an appeal they can be added as a party in order to coordinate a collective municipal response on an issue that has relevance in other jurisdictions or that might set a precedent.
Within a municipality, effective coordination between Finance and other departments is important when managing the assessment roll. In particular, Finance staff should regularly liaise with: Building Code staff—so that the
assessment roll can be updated as new development occurs.
Planning staff—so that anticipated
new assessment arising from land use changes (e.g. rezonings, subdivision registrations) can be tracked.
EXTERNAL AGENCY STAKEHOLDERS
Given the central role assessment plays in property taxation a municipality needs to have a good working relationship with MPAC. In addition to MPAC, there are three Provincial ministries involved in assessment and property tax matters.
Working with MPAC
The relationship between municipalities and MPAC is deliberately designed to be arms length. Municipalities have no control over property assessment and MPAC is required to take an independent position on its work. Having good relations with MPAC, especially with the staff and manager of the local MPAC field office, is of great help to municipalities. Particular activities to foster this relationship can include: having regular discussions with
MPAC to ensure that the flow of information that is required to keep the roll current, such as permit occupancy data, is efficient;
asking MPAC officials to make
regular presentations to Council on how the assessment roll is changing, which tax classes are growing or declining, and the status of appeals; and

Property Taxation Guide 109
liaising regularly with MPAC staff about the active appeals and when to launch appeals.
It is important for municipalities to recognize the difficult job that MPAC has, the professional opinions and judgments that assessors must make, and the impartiality that is required.
Ministry of Finance
The Ministry of Finance is the principal ministry involved in establishing the legal framework for both assessment and property taxation. The Ministry also has an ongoing responsibility to provide transition ratios and set annual education tax rates. Municipalities may request from the Minister of Finance revisions to deadlines under the Municipal Act.
Ministry of Municipal Affairs and Housing
The Ministry of Municipal Affairs (MMAH) is responsible for some of the regulations under the Municipal Act and the Residential Tenancies Act relating to property tax policy.6 Its importance from the municipal perspective is its role as the main liaison with municipalities on the implementation of tax policies and the 6 Under section 131 of the Residential Tenancies Act rent reductions for residential properties may be required if municipal property taxes are reduced.
collection and administration of the property tax. Keeping up to date with changes to assessment and property tax legislation, and evaluating its impact at the local level, involves regular contact with MMAH.
Ministry of Education
Although not responsible for setting the education tax rates, the Ministry of Education is responsible for determining the education tax funding requirement and allocating the funds to school boards. Of importance to municipalities is the Ministry’s role in establishing the deadlines for education tax installment payments. Municipalities are also responsible for remitting education taxes to Boards of Education and making tax adjustments as changes to property assessment occur.
TAXPAYERS
For people who directly pay the property tax finance staff have a special responsibility to effectively communicate tax information. Moreover, given that the municipal office is often the first place taxpayers call after receiving a reassessment notice, finance staff must be ready to respond to assessment questions. Being able to deal with basic assessment questions, and knowing when to refer calls to MPAC, improves

110 Chapter 10
the level of service provided to taxpayers and may help reduce the volume of appeals.
Residential Taxpayers
Aside from issues about what taxes are spent on, the average residential taxpayer wants to know how their property is assessed and how their taxes are calculated. They also want to be informed of the basis of any change to the amount of property tax they are required to pay (through a supplementary assessment for example). The main vehicles for making this information available will be through: tax bills; information pamphlets
accompanying the tax bills; having available financial
information (financial information returns, performance measures, financial statements, and budget documents) and tax policy reports in the municipal office and on the municipal website; and
customer service staff to deal with
queries on specific properties. Special meetings and/or information bulletins should be developed and sent to residential ratepayer groups.
Business Community
Commercial and industrial property owners are generally better informed about assessment and property tax than residential taxpayers. Municipalities should therefore be prepared for a more sophisticated dialogue with the business community on property tax matters. Dealing with the businesses will almost inevitably involve discussions about phase-ins and capping and clawbacks. Municipalities therefore need staff who understand how the programs work, and who are capable of explaining how tax adjustments have been calculated in response to changes in a property.
Major Taxpayers
Major taxpayers—the large manufacturing plant in a small town for example—can play a special role in the economic structure of a municipality. Often the revenue generated by such properties is so significant to the municipal bottom line that the organization is essentially a partner with the municipality in providing services. Finance staff who deal with major taxpayers should recognize the sensitive nature of this relationship and should be prepared to deal with tax agents, lawyers, and senior executives on a regular basis. It should also be understood that from time to time tough decisions regarding

Property Taxation Guide 111
assessment appeals may need to be made where, for example, the potential closure or relocation of the operation of the major taxpayer occurs. The relationship between the municipality and a major taxpayer can become strained during the process of a major appeal. As well as the issues being potentially very complex the financial stakes involved can be high for both sides.
Customer Service
Municipalities should designate staff members to deal with tax queries. These staff members should be ready to deal with common misconceptions, answer basic questions about assessment and taxation and, if necessary, refer taxpayers to other agencies who can assist them. It is good practice for staff to have prepared answers to frequently asked questions such as: How are my taxes calculated? My assessment went down—why
are my taxes going up?
My neighbor and I both had assessment increases—why did my taxes go up but not hers?
I don’t have children—why do I pay
an education tax? I think my assessment is wrong.
What should I do? How do I challenge my assessment?
Owners should certainly be directed to MPAC which provides a number of tools to assist them in evaluating their assessment. On the MPAC website www.mpac.ca, through “AboutMyProperty”, owners can access assessment roll information (e.g. CVA, lot size, legal description) and obtain assessment roll values on comparable properties (up to 12 properties). The information is provided free of charge and a user ID and password to access “AboutMyProperty” is provided on assessment notices. As well, information is available on the Assessment Review Board’s website at:
www.arb.gov.on.ca

APPENDIX A ANNUAL TAX CYCLE


Part A: Municipal Tax Cycle
Deadline Activity Legislation/Regulation
January 1 Notification of adjustments to municipal wards Municipal Act: 222(9.1)
January 1 Retroactive time limit for regulations under s. 308. s. 309 and s. 310 Municipal Act: 308(20), 309(4). & 310(12)
February 28
Delegation of authority for tax ratios to lower‐tier municipalities Municipal Act: 310(1)
Lower‐tier resolution consenting to delegation of authority Municipal Act: 310(3)
Deadline to amend or repeal by‐law establishing tax ratios Municipal Act: 310(5)
Overcharge resulting from error In tax calculation Municipal Act: 334
Determination of status of every tax account as of December 31 of preceding year
Municipal Act: 348
Cancellation, reduction, or refund of taxes: except 357(1) (F) & (G) Municipal Act: 357
March 1‐Dec 31 (or 61 days after return of assessment roll)
Overcharge caused by gross/manifest error in the preparation of the assessment roll (applies for up to two tax years preceding the application)
Municipal Act: 358
March 15 Delegation of authority for tax ratios to lower‐tier municipalities and consenting resolutions to be provided to Minister
Municipal Act: 310(3.1)
March 31 Itemized statement of remuneration and expenses paid in previous year to members of Council and of municipal bodies, e.g. local boards
Municipal Act: 284(1)
April 1 Regulation to designate upper‐tier required to allow delegation to lower‐tier
Municipal Act: 310(4)
Prior To Adoption of 308(4) & 308(5) by‐laws
Set transition ratios for capped property classes (upper‐tier/single‐tier municipality) New transition ratios for capped property classes for a reassessment year or a subsequent tax year set by Ministry of Finance Prescribe transition ratios for optional classes
Municipal Act: 308(6) Municipal Act: 308(10) Municipal Act: 308(15)
April 30 Cancellation, reduction, or refund of taxes initiated by municipal Treasurer under sections 357(1) (F) & (G)
Municipal Act: 357(4)
In the tax year Set tax ratios: single and upper‐tier Municipal Act: 306 (4) & (5)
Set tax ratios: delegated lower‐tier Reduction of farm property class tax ratio of .25
Municipal Act: 310(7) Municipal Act: 308.1 (4) & (5)
Enact municipal by‐laws to adopt or opt out of optional classes Good Government Act 2009 O. Reg. 17/10
Set tax rate for general and special upper‐tier levies Municipal Act: 311 (2) & (4)
Graduated tax rates Municipal Act: 314(1)
Capping parameters Municipal Act: 329.1 (2)
Stay at CVA/cross CVA O. Reg. 160109
Tax reductions for capped properties Municipal Act: 362 (1)
Before estimates for tax year adopted (Re: Municipal Act 289)
Interim levy Interim financing by upper‐tier (requisition or prescribed percentage if reassessment tax year)
Municipal Act: 316

Deadline Activity Legislation/Regulation
Before estimates for tax year adopted (re: Municipal Act 290) During the tax year or November
By‐law to specify levy amounts Timing for interim levy by‐law
Municipal Act: 317 (1) Municipal Act: 317 (2)
Dates specified by upper‐tier: or 1. March 31 2. June 30 3. Sept 30 4. Dec 15
Payments to upper‐tier Municipal Act: 311 (13) & (15)
Investments and due dates Municipal Act: 342
County, with agreement of majority of lower‐tier municipalities, may pass by‐law to designate an alternative number of installments and due dates
Municipal Act: 311 (15)
Minimum tax Municipal Act: 355
Adjustments to prescribed tax rate reductions for sub‐classes Municipal Act: 313
Set tax rate for general [312(2)] and special local municipal levies [312(4)] Municipal Act: 312(2) &(4)
Date 312(2) by‐law passed
For single‐tier, assessment adjustments applied if tax roll changed prior to by‐law under 312(2)
Municipal Act: 312(3) (A)
Date 312(2) by‐law passed
For lower‐tier, assessment adjustments applied if tax roll changed prior to by‐law under 311(2)
Municipal Act: 312(3) (B)
Date 312(2) by‐law passed
Last day for by‐law between upper‐tier and majority of lower‐tier municipalities to extend legislated deadline for including adjustments [i.e. past April 30 as set out in 311(2)]
Municipal Act: 312(3.1) & (3.3)
Date 312(4) lower‐tier by‐Law passed Date 312(2) upper‐tier by‐law passed
For purposes of raising special lower‐tier levy, assessment adjustments included if tax roll changed prior to passing of by‐laws set out in 312(4) or 311(4)
Municipal Act: 312(4) & (5)
Recovery / clawback for properties subject to capping Municipal Act: 330
Taxes to be collected after roll certification
Preparation and certification of tax roll (estimated to be June) Municipal Act: 340
Form and contents of approved tax bill Municipal Act 344
“At least 21 days before the due date” shown on the tax bill
Tax billing Municipal Act: 343
Late payment charges, interest for overpayments and advance payments Municipal Act: 345
September 30 Deadline for Council to review and make decisions regarding applications
Division into convertible parcels Municipal Act: 356(4)
Cancellation, reduction, refund of taxes Municipal Act: 357(5)
Overcharges Municipal Act: 358(9)

Deadline Activity Legislation/Regulation
October 21 Applicant may appeal to the Assessment Review Board if Council fails to make a decision by September 30 of the year following the year of an application under S.357
Municipal Act: 357(8)
December 1 For reassessment year, deadline for Regulation prescribing the percentage (if not 50%) for calculating interim levy
Municipal Act: 317 (10) & (11)
December 1 Commencement of term of office for appointed head of upper‐tier Council and for elected lower‐tier Councilors (i.e. 4 years beginning December 1 of the election year)
Municipal Act: 235(1)
December 31 Undercharge of capped taxes Municipal Act: 337
December 31
Discretionary phase‐in of tax increases or decreases resulting from general reassessment for up to 7 years. Note: this option is available in addition to the mandatory 4‐year phase‐in program set out in 19.1 of the Assessment Act & O.Reg. 282/98
Municipal Act: 318
December 31 Preparation of end of year statement by local municipality regarding its payments in lieu of taxes to each municipality and school board to which it makes payments
Municipal Act: 322(10)
December 31 of year by‐law passed
Effective date of by‐law repealing creation of business improvement area by‐law must have come into force on or before December 31 of the year in which it is passed
Municipal Act: 211(5)
December 31 of year of application
Error in calculation of capped taxes (adjustments not applicable to previous tax years)
Municipal Act: 359.1
December 31 of year after the year of application
Increase of taxes for undercharge resulting from gross or manifest error Municipal Act: 359
As changes received Adjustments to tax roll after tax roll prepared Municipal Act: 341
Source: based on tables available on OPTA website.
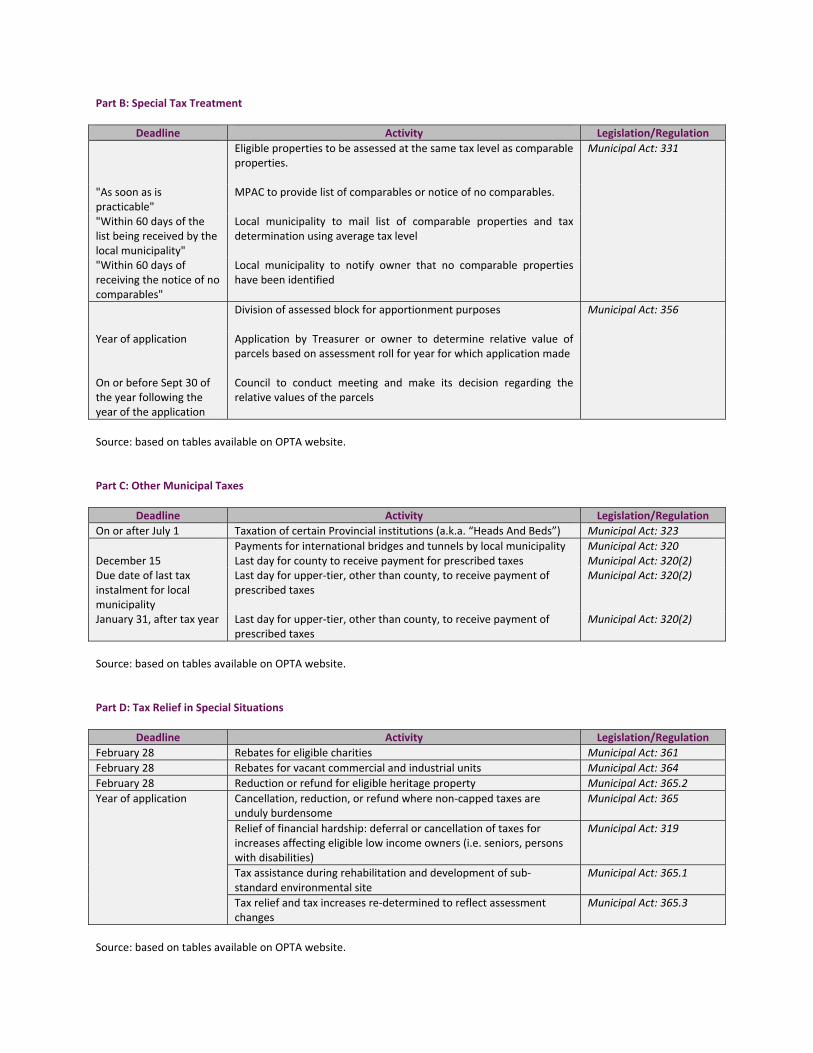
Part B: Special Tax Treatment
Deadline Activity Legislation/Regulation
Eligible properties to be assessed at the same tax level as comparable properties.
Municipal Act: 331
"As soon as is practicable"
MPAC to provide list of comparables or notice of no comparables.
"Within 60 days of the list being received by the local municipality"
Local municipality to mail list of comparable properties and tax determination using average tax level
"Within 60 days of receiving the notice of no comparables"
Local municipality to notify owner that no comparable properties have been identified
Division of assessed block for apportionment purposes
Municipal Act: 356
Year of application Application by Treasurer or owner to determine relative value of parcels based on assessment roll for year for which application made
On or before Sept 30 of the year following the year of the application
Council to conduct meeting and make its decision regarding the relative values of the parcels
Source: based on tables available on OPTA website. Part C: Other Municipal Taxes
Deadline Activity Legislation/Regulation
On or after July 1 Taxation of certain Provincial institutions (a.k.a. “Heads And Beds”) Municipal Act: 323
Payments for international bridges and tunnels by local municipality Municipal Act: 320 December 15 Last day for county to receive payment for prescribed taxes Municipal Act: 320(2) Due date of last tax instalment for local municipality
Last day for upper‐tier, other than county, to receive payment of prescribed taxes
Municipal Act: 320(2)
January 31, after tax year Last day for upper‐tier, other than county, to receive payment of prescribed taxes
Municipal Act: 320(2)
Source: based on tables available on OPTA website. Part D: Tax Relief in Special Situations
Deadline Activity Legislation/Regulation
February 28 Rebates for eligible charities Municipal Act: 361
February 28 Rebates for vacant commercial and industrial units Municipal Act: 364
February 28 Reduction or refund for eligible heritage property Municipal Act: 365.2
Year of application Cancellation, reduction, or refund where non‐capped taxes are unduly burdensome
Municipal Act: 365
Relief of financial hardship: deferral or cancellation of taxes for increases affecting eligible low income owners (i.e. seniors, persons with disabilities)
Municipal Act: 319
Tax assistance during rehabilitation and development of sub‐standard environmental site
Municipal Act: 365.1
Tax relief and tax increases re‐determined to reflect assessment changes
Municipal Act: 365.3
Source: based on tables available on OPTA website.

APPENDIX B SAMPLE PRESENTATION MATERIALS


Property Taxation Guide
INTRODUCTION
This appendix contains a sample presentation by a Treasurer to a municipal Council. The presentation is based on a “typical” small municipality in Ontario—the Town of Pinewater—with the following characteristics:
a population of 12,000; 4,400 residential properties; a significant agricultural base; mostly rural development; a small shopping mall, and
some traditional main street commercial properties in a main urban area; and
some older industrial properties, including several large vacant and contaminated industrial sites.
The presentation covers the following topics:
the results and impact of a general reassessment;
tax policy; tax ratio strategy and impacts;
and tax capping.
Individual slides are annotated with speaker notes to assist the reader in understanding the purpose of the information being presented. A simplified tax base structure has been used for illustrative reasons. The presentation could be augmented by a separate presentation from an MPAC representative providing more
detailed information on the assessment base.


Town of Town of PinewaterPinewaterReassessment & Tax Policy ReviewReassessment & Tax Policy Review
Presentation to CouncilPresentation to Council
A il 2013A il 2013April, 2013April, 2013
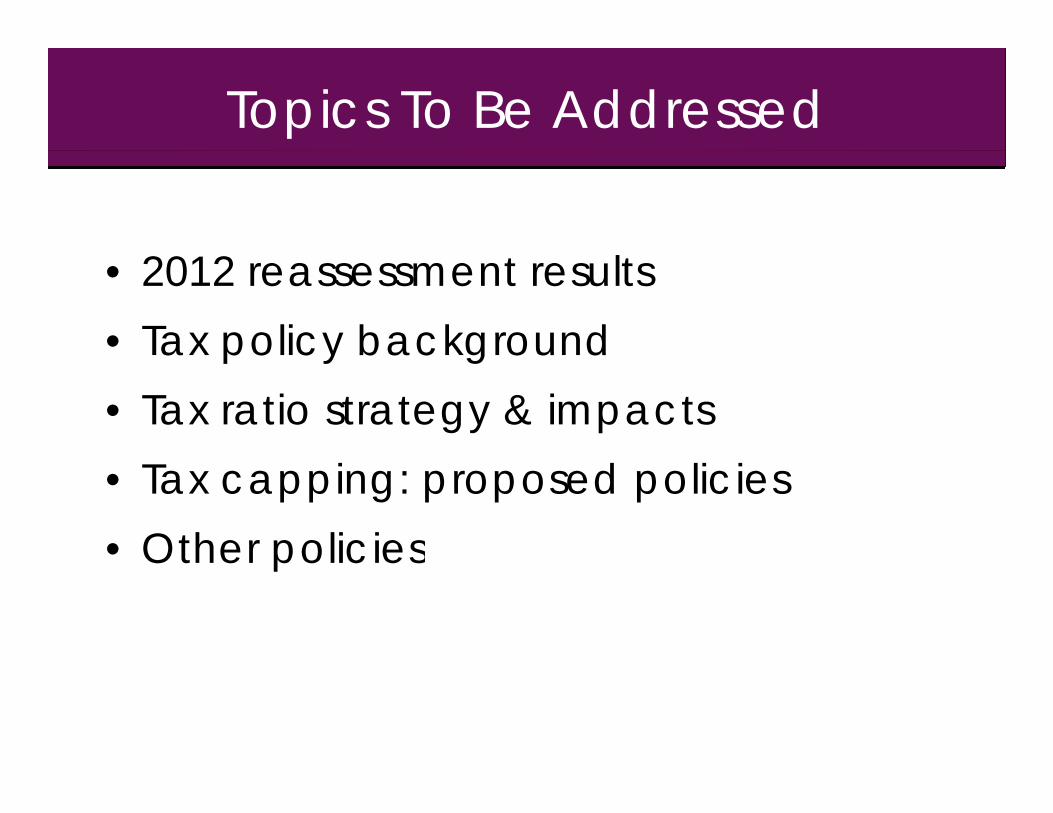
Topics To Be Addressed
• 2012 reassessment results• Tax policy backgrounda po cy bac g ou d• Tax ratio strategy & impacts• Tax capping: proposed policies• Other policiesOther policies

Reassessment Background
• Reassessments occur every 4 yearsReassessments occur every 4 years
• Under mandatory phase-in:– Decreasing properties are taxed immediately on new CVAg p p y
– CVAs of increasing properties phased-in over next 4 years
• Reassessment does not change overall tax revenue
• However, taxes on individual properties will be affected
Notes
Describe how a reassessment & assessment phase-in works and who will be affected Remind Describe how a reassessment & assessment phase in works and who will be affected. Remind Council that the reassessment will significantly increase interest and questions from taxpayers this year.

2012 Reassessment Results
Pre‐Reassessment CVA Post‐Reassessment CVA % CVA Change
Property Tax Class (2008 Base Year) (2012 Base Year) Jan 1 2008 ‐ Jan 1 2012
Residential 71,111,000$ 91,378,000$ 28.5%
Multi‐Residential 11,996,000$ 13,375,000$ 11.5%
Commercial 19,287,000$ 25,323,000$ 31.3%
Industrial 9,757,000$ 11,143,000$ 14.2%
Farmland 23,486,000$ 32,528,000$ 38.5%
Overall 135,637,000$ 173,747,000$ 28.1%
Notes
Table shows aggregate change in CVA for each property class Emphasize that CVA Table shows aggregate change in CVA for each property class. Emphasize that CVA increases vary for individual properties do not equate to tax changes. Tax changes depend on (a) CVA change relative to the average and (b) the levy requirement.

Reassessment Impacts
• Overall average increase of 28.1% in the 4 years since last reassessment
• CVAs in residential class have increased slightly more than average for all propertiesthan average for all properties
• Commercial and farmland properties have increased well above average
• Changes in multi-residential and industrial values are below average
Notes
Comment on figures shown in previous slide. Emphasize that assessment increases will be phased-in over 4 years in equal amounts.

Inter-Class Shifts From ReassessmentFrom Reassessment
Pre‐ReassessmentWeighted ReassessmentWeighted
$ Share $ Share
Residential 1.00 71,111,000$ 41.6% 91,378,000$ 42.7% 2.5%
Pre Reassessment Weighted
Assessment
Reassessment Weighted
Assessment (Fully Phase‐In)
Shift (%)Property Tax Class
Class
Ratio
Multi‐Residential 1.60 19,193,000$ 11.2% 21,400,000$ 10.0% ‐11.0%
Commercial 2.40 46,288,000$ 27.1% 60,776,000$ 28.4% 4.8%
Industrial 2.90 28,296,000$ 16.6% 32,314,000$ 15.1% ‐8.9%
Farmland 0 25 5 871 000$ 3 4% 8 132 000$ 3 8% 10 5%Farmland 0.25 5,871,000$ 3.4% 8,132,000$ 3.8% 10.5%
Total 170,759,000$ 100.0% 214,000,000$ 100.0%
Note. Shift % = (Reassessment Share ‐ Pre‐Reassessment Share)/Pre‐Reassessment Share
Notes
Table sets out the pre- and post-reassessment weighted assessment by class, the tax ratio foreach class and share of total weighted CVA. The table also illustrates shifts in relativeweighting of property classes based on a comparative CVA file containing pre- and post-reassessment values provided by MPAC. Most importantly, table shows (per shift %) howchanges affect the overall distribution of assessment and potentially taxes (subject to taxpolicy intervention).

Distribution of Tax Changes On Residential Properties (Fully Phased-In)Residential Properties (Fully Phased In)
Tax Increases Tax Decreases
% $ % $
Less than 10% 2,162 54.1% +0.5% +$16 342 8.6% ‐0.2% ‐$72
Average Tax Impact Average Tax Impact# of
Properties
% of
Properties
# of
Properties
% of
Properties
% Change in CVA
of Properties
10% ‐ 20% 756 18.9% +1.2% +$38 53 1.3% ‐0.5% ‐$181
20% ‐ 30% 438 11.0% +1.8% +$58 12 0.3% ‐1.2% ‐$432
Greater than 30% 233 5.8% +2.4% +$77 4 0.1% ‐2.1% ‐$761$ $
Note. Tax calculated based on current levy requirement.
Notes
This table shows that most residential properties will experience a tax increase averaging $16.About 10% of properties will receive decreases—mostly averaging $72.
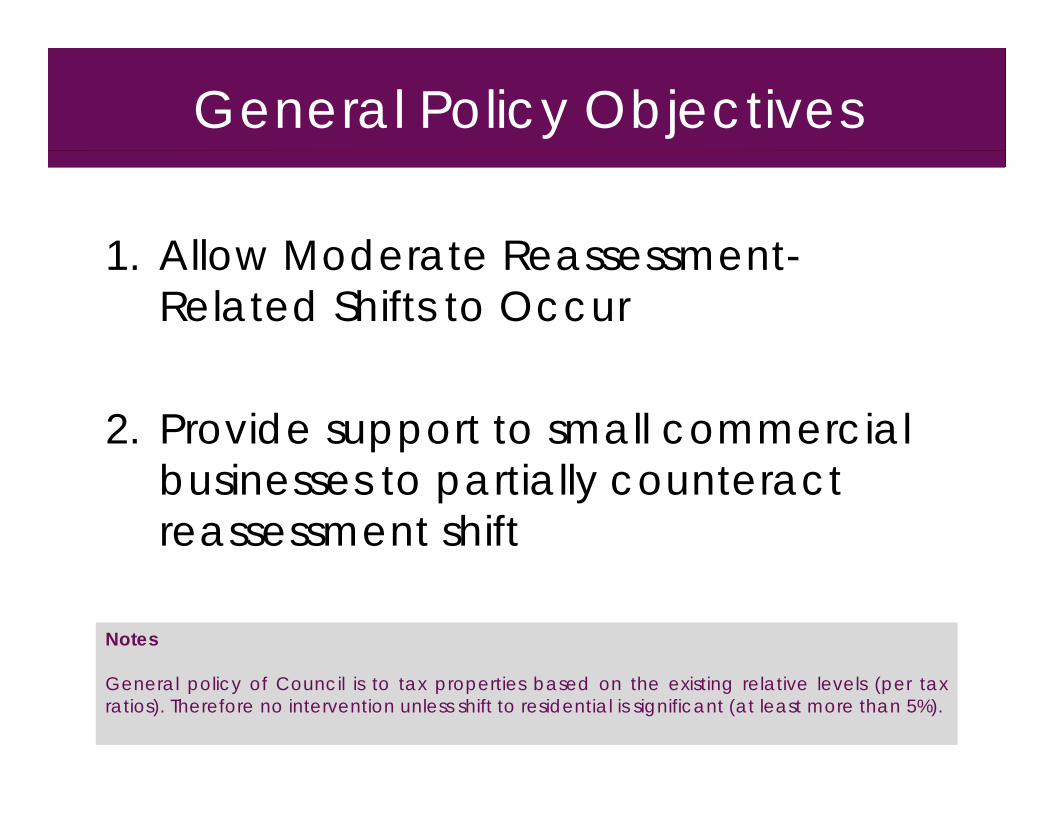
General Policy Objectives
1 Allow Moderate Reassessment1. Allow Moderate Reassessment-Related Shifts to Occur
2. Provide support to small commercial businesses to partially counteract reassessment shift
Notes
General policy of Council is to tax properties based on the existing relative levels (per taxratios). Therefore no intervention unless shift to residential is significant (at least more than 5%).

Tax Ratio Background
• Tax ratios control distribution of taxes between property lclasses
• Residential ratio always set at 1.0000
Other ratios are set in relation to residential ratio • Other ratios are set in relation to residential ratio
• Ratios can be moved up or down in “ranges of fairness”
• If outside ranges ratios can usually only be moved towards • If outside ranges, ratios can usually only be moved towards the ranges
• However, municipality can set revenue neutral transition i hifratios to counteract reassessment tax shifts
Notes
Briefly set out municipality’s options for changing tax ratios (i.e. shifting the tax burden between property classes) as prescribed by legislation.
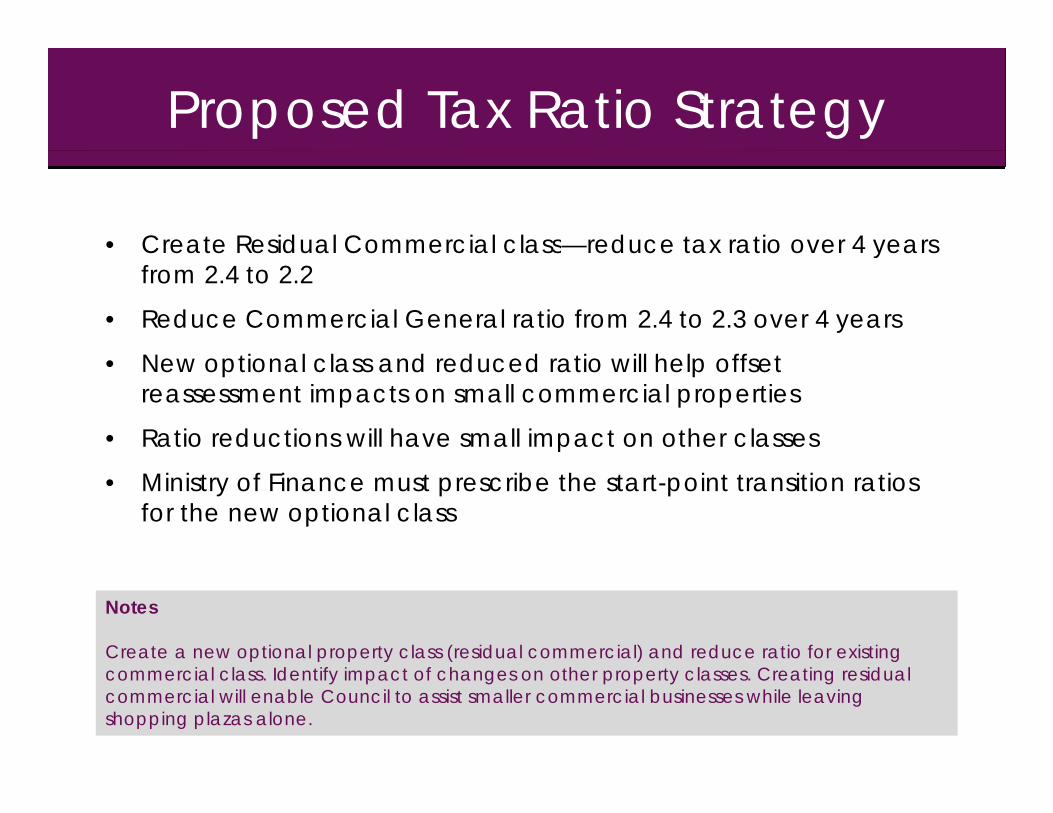
Proposed Tax Ratio Strategy
• Create Residual Commercial class—reduce tax ratio over 4 years Create Residual Commercial class reduce tax ratio over 4 years from 2.4 to 2.2
• Reduce Commercial General ratio from 2.4 to 2.3 over 4 years
N ti l l d d d ti ill h l ff t • New optional class and reduced ratio will help offset reassessment impacts on small commercial properties
• Ratio reductions will have small impact on other classes
• Ministry of Finance must prescribe the start-point transition ratios for the new optional class
Notes
Create a new optional property class (residual commercial) and reduce ratio for existing commercial class. Identify impact of changes on other property classes. Creating residual commercial will enable Council to assist smaller commercial businesses while leaving shopping plazas alone.

Tax Shift Resulting FromCommercial Ratio ChangeCommercial Ratio Change
$ Share $ Share ($) (%)Property Tax Class
Tax Levy Without Ratio Change Tax Levy With Ratio Change Shift
$ Share $ Share ($) (%)
Residential 5,687,275$ 42.7% 5,755,380$ 43.2% 68,105$ 1.2%
Multi‐Residential 1,331,915$ 10.0% 1,347,864$ 10.1% 15,950$ 1.2%
Commercial 3,782,637$ 28.4% 3,668,437$ 27.5% (114,200)$ ‐3.0%
Property Tax Class
Industrial 2,011,191$ 15.1% 2,035,275$ 15.3% 24,084$ 1.2%
Farmland 506,128$ 3.8% 512,188$ 3.8% 6,061$ 1.2%
Total 13,319,145$ 100.0% 13,319,145$ 100.0%
Note Residential shift represents an average increase of $17 03 per property Note. Residential shift represents an average increase of $17.03 per property.
Notes
Compare distribution of municipal tax burden (excluding education taxes) by property class under existing and proposed tax ratio strategies.

Key Impacts of Commercial Ratio ChangeCommercial Ratio Change
• Average increase of $17 03 per residential • Average increase of $17.03 per residential property by 2016 ($4.26 per year)
• Average decrease of $2,460 for each small commercial property by 2016 ($616 per year)
Notes
Compare impact of proposed tax ratio strategies on “typical” residential and “small commercial” properties.
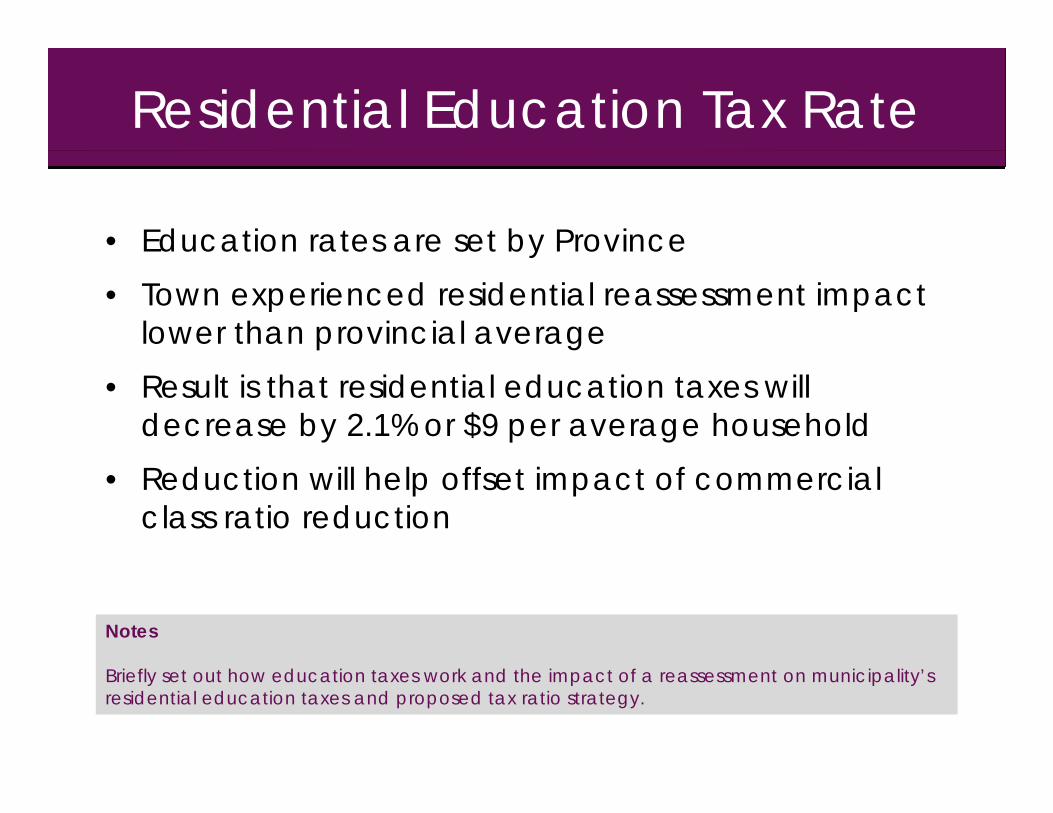
Residential Education Tax Rate
• Education rates are set by Provincey• Town experienced residential reassessment impact
lower than provincial average• Result is that residential education taxes will
decrease by 2.1% or $9 per average household• Reduction will help offset impact of commercial
class ratio reduction
Notes
Briefly set out how education taxes work and the impact of a reassessment on municipality’s residential education taxes and proposed tax ratio strategy.

Phased-In Average Residential TaxesResidential Taxes
2012 2013 2014 2015 2016
Average PropertyAverage Property
Municipal Taxes 1,422$ 1,440$ 1,440$ 1,440$ 1,440$
Education Taxes 427$ 418$ 418$ 418$ 418$
Total Taxes 1,848$ 1,858$ 1,858$ 1,858$ 1,858$
Average Increasing Property
Municipal Taxes 1,403$ 1,408$ 1,413$ 1,418$ 1,423$
Education Taxes 421$ 409$ 410$ 412$ 413$
Total Taxes 1,824$ 1,817$ 1,823$ 1,829$ 1,836$
Average Decreasing Property
Municipal Taxes 1,564$ 1,550$ 1,536$ 1,522$ 1,508$
Education Taxes 470$ 450$ 446$ 442$ 438$
Total Taxes 2,034$ 2,000$ 1,982$ 1,964$ 1,946$
Notes
,$ ,$ ,$ ,$ ,$
Note. Municipal taxes based on 2012 levy amount. Education taxes assume constant education tax rate from 2013.
Shows the impact of proposed tax policy strategy and the education rate changes on residential properties over the four year CVA phase-in period.

Tax Capping
• Tax capping applies to multi-residential, commercial and industrial classesindustrial classes
• Minimum increase is 5% of prior year tax plus any annual levy change
• In 2012 several optional policies were adopted:– $250 threshold on increasing properties
– “Stay at CVA taxes” option. Applies to properties that come out of Stay at CVA taxes option. Applies to properties that come out of capping or cross from capping to clawback
– “100% CVA taxes”. Applies to new construction and new to class properties
• Capping requirements are funded by clawbacks
NotesNotes
Briefly summarize tax capping legislation and municipality’s current capping policies.

Proposed Tax Capping Policies
• Apply optional increase policy. Permits increase of 10% of prior year or 5% of CVA tax – higher result appliesyear or 5% of CVA tax higher result applies
• Continue $250 increase threshold
• Continue with “Stay at CVA Taxes” option
• Continue “100% CVA Taxes” for new construction and new to class properties
Eliminate clawbacks cost is small ($8 350) and clawbacks are • Eliminate clawbacks – cost is small ($8,350) and clawbacks are irritants for owners
• Fund capping requirement from reserves this year; from levy in future years
Notes
Evaluate overall approach and emphasize how it is designed to minimize capping and clawback.
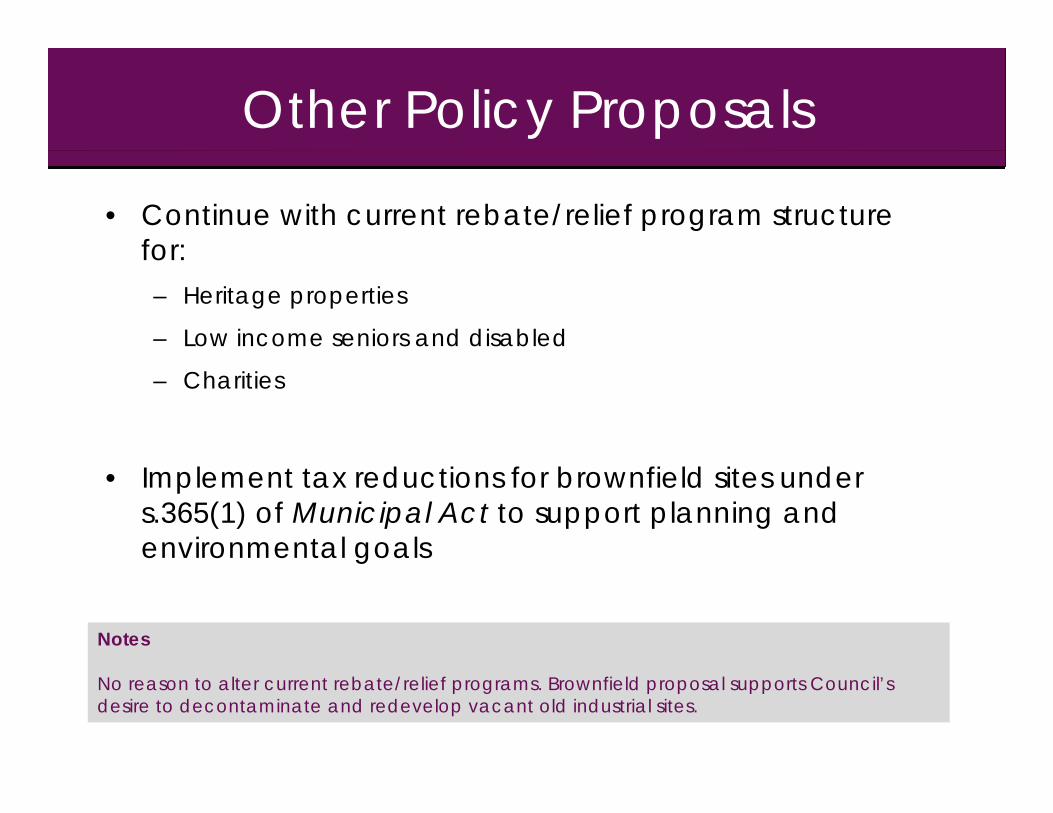
Other Policy Proposals
• Continue with current rebate/relief program structure for:for:– Heritage properties
– Low income seniors and disabled
– Charities
• Implement tax reductions for brownfield sites under s.365(1) of Municipal Act to support planning and environmental goalsg
Notes
No reason to alter current rebate/relief programs. Brownfield proposal supports Council’s desire to decontaminate and redevelop vacant old industrial sites.


