
Presented at
Air & Waste Management Association Louisiana Section
2013 Fall Conference
By
Yousheng Zeng, PhD, PE and Jon Morris
Providence Photonics, LLC
Mark Dombrowski
Surface Optics Corporation
October 30, 2013
PROOF OF CONCEPT TEST
FOR A REAL-TIME FLARE COMBUSTION
EFFICIENCY MONITOR
1

A BRIEF REVIEW OF THE CONCEPT
PRESENTED AT 2012 FALL CONFERENCE
2
Ref.: Zeng and Morris, “A New Method to Measure Flare Combustion Efficiency in Real-Time”, presented
at AWMA Louisiana Section 2012 Fall Conference, Baton Rouge, Louisiana, October 30-31, 2012
2

𝐶𝐸(%) =𝐶 𝐶𝑂2
𝑖 𝑛𝑖 𝐶 𝐻𝐶𝑖+ 𝐶 𝐶𝑂2+ 𝐶 𝐶𝑂Eq. (1)
Flare Combustion Efficiency (CE):
Flare CE – Very difficult to measure
Source: TCEQ/UT
3
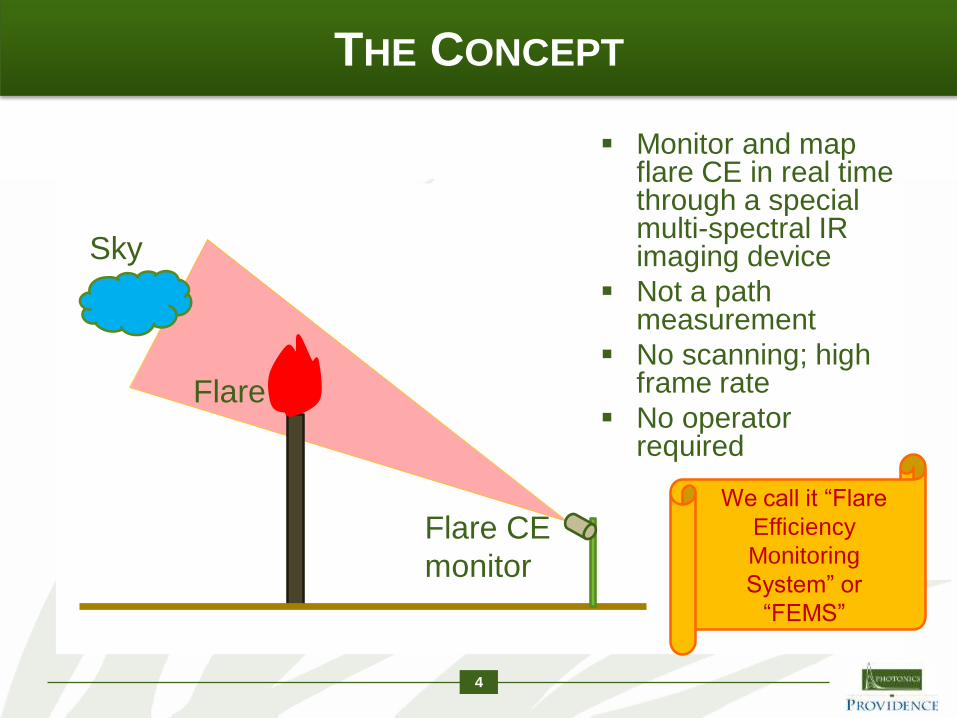
THE CONCEPT
4
Sky
Flare
Flare CE
monitor
Monitor and map flare CE in real time through a special multi-spectral IR imaging device
Not a path measurement
No scanning; high frame rate
No operator required
We call it “Flare
Efficiency
Monitoring
System” or
“FEMS”

VISION
5
98 98 989898
98
9595
9292
92
95 95 95
98
98
70
Monitor flare CE in real-time
Image the full flare flame; measure both overall CE and CE at a pixel level (CE mapping)
Industrial grade device, suitable for integration with PLC or DCS
One monitor covers multiple flares on site (step and stare)

WORKING PRINCIPLE
6
0.00
0.10
0.20
0.30
0.40
0.50
0.60
0.70
0.80
0.90
1.00
3.0 3.2 3.4 3.6 3.8 4.0 4.2 4.4 4.6 4.8 5.0
α
λ(µ)
CO2COPropaneMethaneH2OCh1Ch4Ch2Ch3
HC CO2 CO

PROOF OF CONCEPT TEST
7 7
The proof of concept test was partially funded by EPA
SBIR Phase I grant.

Nitrogen
Scale
model
flare
SOC750
ImagerFlue
CO2 and CO
Analyzer
HC Analyzer
Datalogger
Propane
Steam
TEST SETUP
8
Temperature
Measurement

SOC750
Hyper-Spectral
Imager
Scale model flare,
Flue w/ Sampling Probe, and
Analyzers
Distance from
the scale model flare
to the Imager: 23 ft.
9
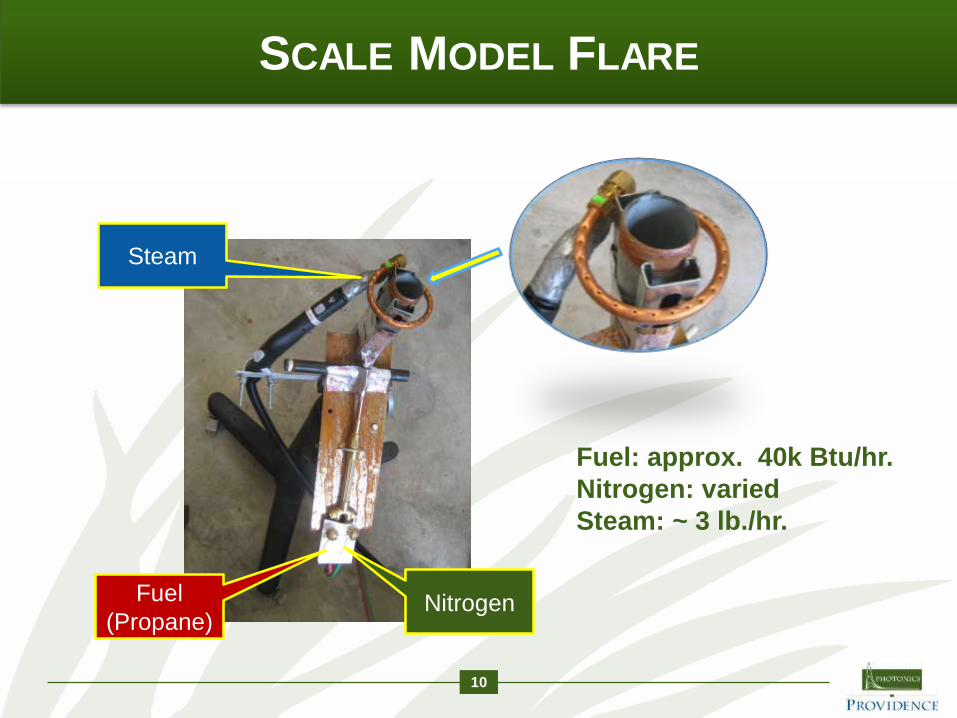
SCALE MODEL FLARE
10
NitrogenFuel
(Propane)
Steam
Fuel: approx. 40k Btu/hr.
Nitrogen: varied
Steam: ~ 3 lb./hr.
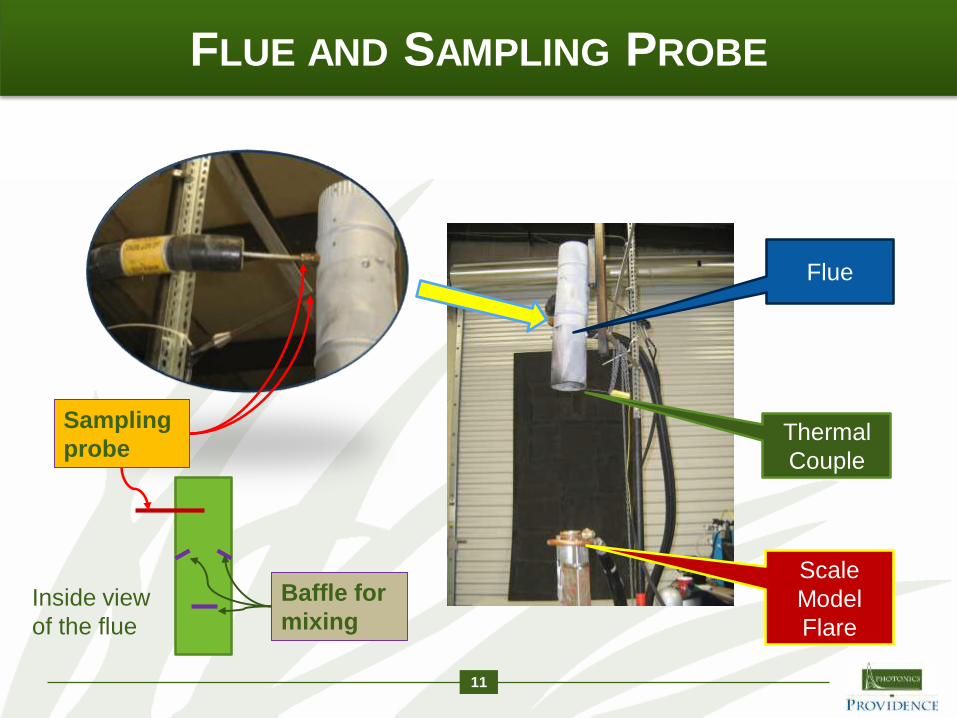
FLUE AND SAMPLING PROBE
11
Thermal
Couple
Scale
Model
Flare
Flue
Sampling
probe
Baffle for
mixingInside view
of the flue

ANALYZERS AND IMAGER
12
Testo 350 XL
(CO2 using NDIR,
CO, O2, NOx, H2,
Temp, etc.)
3010 Mini
FID
Calibrated
to
Propane
SOC750 Hyper-
spectral imager
42 spectral channels,
operated at 22 cubes
per sec.

TEST RUNS
13

PRELIMINARY RESULTS
- WITHOUT CALIBRATION
14
15
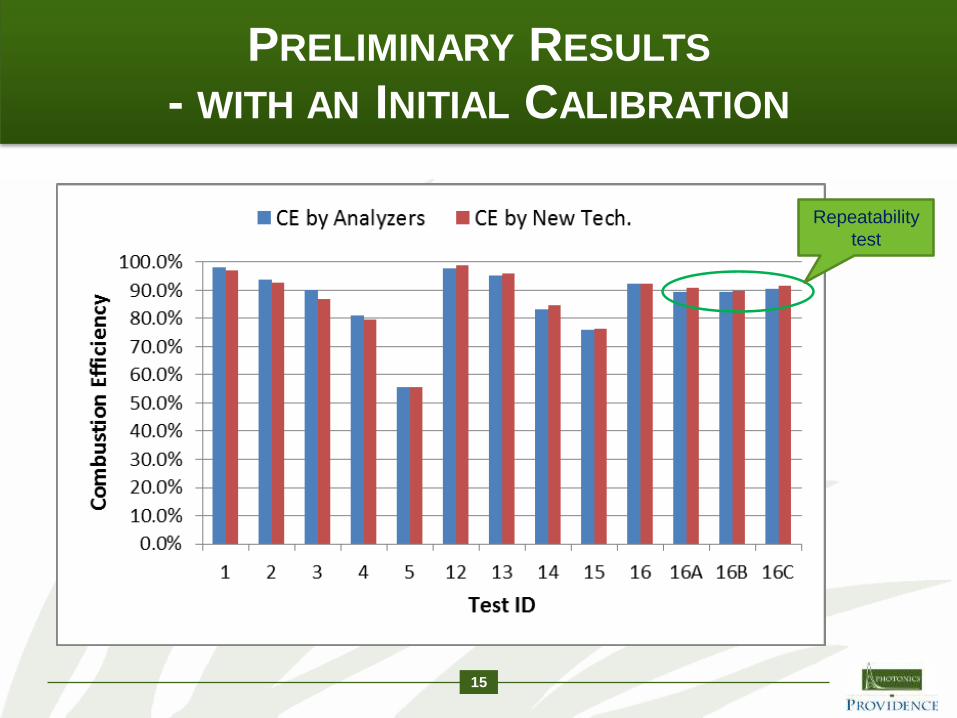
PRELIMINARY RESULTS
- WITH AN INITIAL CALIBRATION
Repeatability
test

16
PRELIMINARY RESULTS
- INITIAL METHOD TO MEASURE TEMPERATURE

17
PRELIMINARY RESULTS – CE MAP
ROI #1:
CE=89%
ROI #2
CE=89%
ROI #3
CE=75%
ROI #4
CE=50%
ROI #1:
CE=82%
ROI #2
CE=79%
ROI #3
CE=69%
ROI #4
CE=60%
30 sec.
average
(670
frames)
1 frame
(~0.045
sec.)

18
Extractive Sampling
- Point measurement
FEMS
- 2-D mapping/
measurement
Three Types of Measurement
PFTIR
- Path measurement

COMPARISON WITH PFTIR
PFTIR
“Scanning” - >1 sec/scan
– assuming that flare is
static during that time
Path measurement –
aiming required
Human operation
FEMS
Staring – 20-30 data
cubes/sec – match the
flare dynamics
2-D mapping of CE – no
aiming required
Automatic
19

CONCLUSION
The CE determined by the new technology correlate well with the CE measured by conventional analyzers
With a further developed calibration method, real-time CE monitoring and feedback for flare optimization is feasible
The new technology can determine CE at a pixel level, generating a CE map for the entire flare flame. No aiming issue.
As a side benefit, it can also provide temperature mapping of the flare flame
20
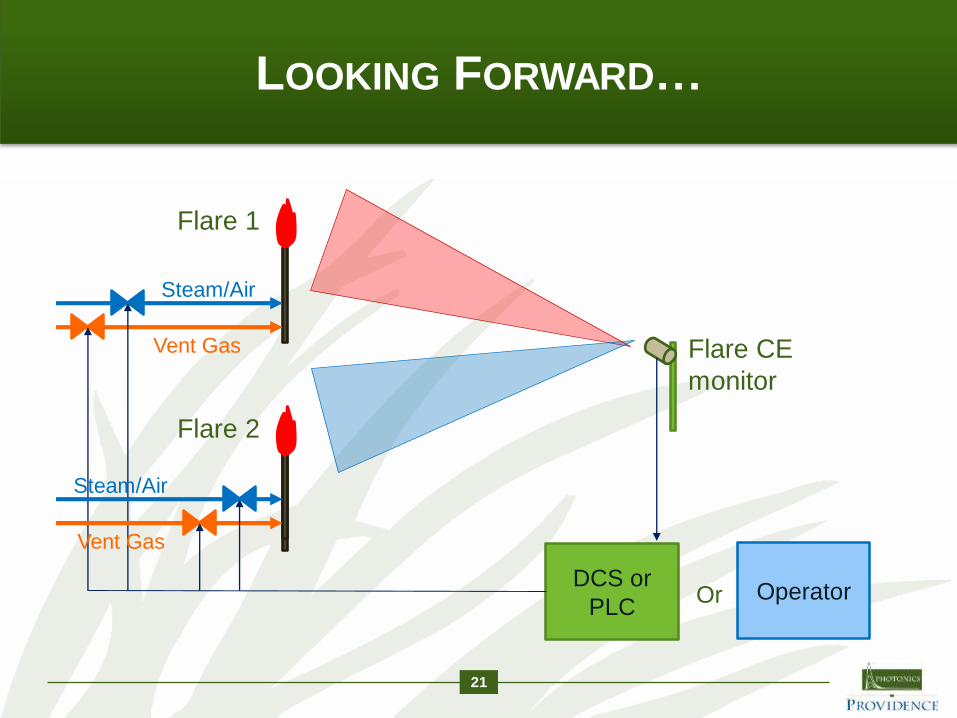
LOOKING FORWARD…
21
Flare 1
Flare CE
monitor
Flare 2
DCS or
PLC
Vent Gas
Steam/Air
Vent Gas
Steam/Air
OperatorOr

OPTICAL GAS IMAGING WORKSHOP
22


