
Harpur Hill, Buxton Derbyshire, SK17 9JN T: +44 (0)1298 218000 F: +44 (0)1298 218590 W: www.hsl.gov.uk
Review of Network Rail’s All Level Crossing Risk
Model (ALCRM)
RSU/08/16
Project Leader: Dr Shane Turner
Author(s): Dr Shane Turner
Science Group: Human Factors
DISTRIBUTION David Whitmarsh Office of Rail Regulation (ORR) David Bestwick ORR Julie Chadwick ORR
© Crown copyright (2008)
HSL report approval: Sandra Gadd Date of issue: 15 August 2008 Job number: JC9100026
PRIVACY MARKING: RESTRICTED: COMMERCIAL The work described in this report was undertaken by the Health and Safety Laboratory under contract to the Office of Rail Regulation (ORR). Its contents, including any opinions and/or conclusions expressed or recommendations made, do not necessarily reflect policy or views of the Health and Safety Executive.

iii
ACKNOWLEDGEMENTS The author would like to thank the input of Julie Chadwick of the Office of Rail Regulation in carrying out the review of the All Level Crossing Risk Model. Julie has been an integral part of the review presented in this report.
In addition, the cooperation of Network Rail throughout the review, and input from the Rail Safety & Standards Board and Arthur D Little are acknowledged.

iv
CONTENTS
1 INTRODUCTION......................................................................................... 1 1.1 Objectives................................................................................................ 1 1.2 Scope ...................................................................................................... 2 1.3 Methodology ............................................................................................ 2 1.4 Context of the review and findings........................................................... 2 1.5 Purpose of the report ............................................................................... 3 1.6 Structure of the report.............................................................................. 3
2 BACKGROUND.......................................................................................... 4 2.1 Review of the ALCRM ............................................................................. 4
3 PURPOSE AND SCOPE OF THE ALCRM ................................................ 7 3.1 Purpose of the ALCRM............................................................................ 7 3.2 Scope of the ALCRM............................................................................... 9
4 ALCRM APPROACH TO MODELLING RISK.......................................... 11 4.1 Modelling approach ............................................................................... 11 4.2 Comments on the modelling approach .................................................. 14 4.3 Summary ............................................................................................... 16
5 REVIEW OF THE ALCRM’S TREATMENT OF PEDESTRIAN RISK ...... 17 5.1 Protected level crossings....................................................................... 17 5.2 Passive level crossings.......................................................................... 24 5.3 Pedestrian risk summary and recommendations................................... 33
6 REVIEW OF THE ALCRM’S TREATMENT OF USER WORKED CROSSINGS.................................................................................................... 34 6.1 Calculation of risk at user worked crossings.......................................... 34 6.2 Summary ............................................................................................... 42
7 REVIEW OF THE ALCRM’S TREATMENT OF STATION FOOTPATH CROSSINGS.................................................................................................... 43 7.1 Calculation of risk at station footpath crossings..................................... 43 7.2 Risk drivers............................................................................................ 46 7.3 Risk drivers within the ALCRM .............................................................. 47 7.4 Summary ............................................................................................... 47
8 REVIEW OF GENERIC ASPECTS OF THE ALCRM............................... 49 8.1 Census data .......................................................................................... 49 8.2 Risk drivers............................................................................................ 51 8.3 Calibration ............................................................................................. 52 8.4 Quality assurance.................................................................................. 53
9 CONCLUSIONS........................................................................................ 54
10 RECOMMENDATIONS ......................................................................... 57

v
10.1 Recommendations on Network Rail....................................................... 57 10.2 Recommendations on ORR................................................................... 58
11 APPENDICES ....................................................................................... 59 11.1 Appendix A Generic level crossings in ALCRM ..................................... 59 11.2 Appendix B The ALCRM modelling approach ....................................... 62 11.3 Appendix C Risk factors for station crossings........................................ 66 11.4 Appendix D ALCRM risk ranking categories.......................................... 68
12 REFERENCES ...................................................................................... 69
13 ACRONYMS AND GLOSSARY............................................................ 73 13.1 Acronyms............................................................................................... 73 13.2 Glossary of level crossing base events.................................................. 74

vi
EXECUTIVE SUMMARY Network Rail have recently introduced a new risk modelling tool, the All Level Crossing Risk Model (ALCRM), and toolkit, the Level Crossing Risk Management Toolkit (LXRMTK), to aid decision making on level crossing protection.
As part of building confidence in Network Rail’s decisions and proposals for protection at each level crossing, the Office of Rail Regulation (ORR) need to understand whether the ALCRM is capable of delivering all that it has been introduced to achieve. As part of this, ORR commissioned the Health & Safety Laboratory to carry out a review of the ALCRM.
Objectives
The overall aim of the review was to determine whether the ALCRM is capable of fulfilling the role given to it within Network Rail’s level crossing risk management process.
In order not to duplicate work previously carried out and in response to recent work by ORR, the Rail Accident Investigation Branch and Coroners’ Inquests, the following three key areas of level crossing risk have been identified by ORR where particular assurance of the suitability of the ALCRM for modelling the level of risk is required:
• station foot crossings (SFCs);
• user-worked crossings (UWCs); and
• pedestrian risk in general at level crossings. The scope of this work was limited to the model as applied to the above three areas. Implementation of the ALCRM was outside the scope of this work. For the purposes of this review it has been assumed that the model had been implemented, and data collected and entered in accordance with Network Rail’s standards and procedures.
Main Findings
The development of the ALCRM is a significant step forward in many respects, for example:
• it is recognised that the model is more sophisticated than models used in many other countries worldwide;
• the development of a single model for application across all level crossings aids consistency in the management of risk at level crossings, especially in terms of prioritising effort; and
• hosting the model on Network Rail’s Intranet with all results stored in a single database enables Network Rail to be consistent in its management of risk in this area and provides an excellent source of intelligence on level crossings.
Although there appears to be nothing fundamentally wrong with the modelling approach, there are a number of limitations that users need to be aware of, which make the model particularly sensitive to the number of users and number of trains and less sensitive to other local crossing factors. Indeed, if anything, the model is possibly over sophisticated as it takes account of many factors that have little influence on the estimated level of risk.
Notwithstanding some of the limitations and detailed comments presented in the main report, the ALCRM appears fit for the purpose intended by Network Rail, as one input to a wider risk assessment and risk management process, although there are a number of improvements that

vii
could be made as summarised in the recommendations and as recommended in an earlier review by Sotera1.
In terms of ORR, it is important that:
• inspectors are under no illusions about the model – it is one tool and is not the whole answer; and
• taken with other parts of Network Rail’s processes, the overall approach has the potential to be fit for purpose.
Recommendations
Recommendations on Network Rail
Recommendations on Network Rail have been prioritised by importance as follows:
• A – short term resolution required. This is an area that potentially could undermine confidence in the model;
• B – medium term resolution required;
• C – longer term resolution or minor issue; and
• D – suggestion for development.
Number Priority Recommendation
1 A The number of generic level crossing models should be reviewed. In
particular, consideration should be made for separating the station crossing models (STATION and STATIONmwl) into separate station crossing and barrow crossing models (both with and without miniature warning lights), thus increasing the number of models from 14 to 16.
2 B The scope of the model should be made clear in all publications describing the model. This is in addition to that contained in the Enhanced Functional Specification, for example in Network Rail’s Operations Manual.
3 C The inclusion and exclusion of events across the different level crossing risk models is not intuitive and consistent in all cases. These should be reviewed by Network Rail taking account of the comments and observations stated throughout the report. The description of each event should also be made clear.
4 D Statistical techniques should be considered to estimate event frequencies for those events currently assigned a zero.
5 D Pedestrian risk modelling at automatic and manual crossings should be developed and made consistent with the approach adopted for vehicle risk and pedestrian risk at passive crossings.
1 Sotera Risk Solutions Ltd, Independent review of the All Level Crossing Risk Model J1093/Doc001, Issue 2, 2 October 2006, Report for Network Rail.

viii
Number Priority Recommendation
6 C The choice of traffic adjustment factors should be reviewed to ensure the factors applied to each event are intuitive in all cases. The detailed comments raised throughout the report should be considered as part of this review.
7 C The consequences assumed for staff shock should be made consistent with latest Rail Safety & Standards Board advice.
8 C Inputs to the ALCRM that influence risk estimates should be made more explicit to ALCRM users.
9 B Specific incident data should be collected for the station events as use of the event profiles from footpath crossings and user worked crossings with miniature warning lights appears to have little basis.
10 C The comments raised throughout the report relating to the crossing feature adjustment factors should be addressed.
11 B Given that the ALCRM outputs are very sensitive to the census data, particularly where counts are low, the quick census appears to be used in wider circumstances than it was originally developed for and this does not appear to have been revisited for some time, it is recommended that a review is carried out of the quick census approach, especially applied to pedestrian crossings and user worked level crossings.
Recommendations on ORR Number Recommendation
12 ORR should examine the adequacy of NR’s level crossing files to support
a suitable and sufficient risk assessment.
13 The level crossing risk files appear to be an integral part of the risk assessment of a level crossing. It is, therefore, recommended that instead of requesting a risk assessment, ORR Inspectors should request the relevant level crossing file from the duty holder/NR.
14 ORR should take this report as the basis for briefing inspectors on what the ALCRM is, its boundaries and limitations. In particular, ORR should ensure that relevant inspectors understand the scope of the model, particularly those areas not included.

ix
Number Recommendation
15 In order to use the ALCRM outputs to prioritise where to spend effort on reducing risk it is important that all outputs are used; this includes individual risk ranking, collective risk ranking and the detailed risk outputs. These should be utilised along with other intelligence, for example near misses, incidents and judgement and experience of Network Rail staff. It is important that ORR are satisfied that such a balanced approach is taken. Using just one measure of risk, just the rankings or indeed just the ALCRM output would not be appropriate.
16 It is recommended that ORR make their inspectors aware as to the importance of the census data in driving the risk estimates and the potential uncertainty in this area, dependent on the crossing circumstances and number of users (especially where low).

1
1 INTRODUCTION
Level crossings are the main source of train accident risk (i.e. risk from collision between trains and road vehicles) on the main line railway and a significant source of other public risk. It is, therefore, vital that these risks are properly managed.
Although established principles and standards, e.g. Railway Safety Principles and Guidance part 2 section E[1] (RSPG 2E), are in place to guide the selection and design of each level crossing, successful control of risk requires that guidance to be properly applied. The starting point at each of the 7,700, or so, level crossings should be the risk assessment process, which in turn forms part of a robust decision making process.
During 2005-07 Network Rail (NR) introduced a new risk modelling tool, the All Level Crossing Risk Model (ALCRM), and toolkit, the Level Crossing Risk Management Toolkit (LXRMTK), to aid decision making on level crossing protection. The changes have been presented to the regulator (the Office of Rail Regulation (ORR)) as a major step towards addressing recent concerns arising from inspection, investigation and research work by ORR and others.
ORR’s confidence in NR’s decisions and proposals for protection at each level crossing will be enhanced if they have confidence in the underlying process. Some of the assurance ORR needs on whether the ALCRM is capable of delivering all that it has been introduced to achieve will come from examining the way in which it was developed and reports from assurance work carried out for NR.
ORR, therefore, commissioned the Health & Safety Laboratory (HSL) to carry out a focussed review of the ALCRM.
1.1 OBJECTIVES
The overall aim of this work was to determine whether the ALCRM is capable of fulfilling the role given to it within Network Rail’s level crossing risk management process.
The overarching aim has been taken to mean:
1. What is the purpose/scope of the ALCRM?
2. Is the purpose met with respect to the three areas identified below?
In order not to duplicate work previously carried out and in response to recent work by ORR, the Rail Accident Investigation Branch (RAIB) and Coroners’ Inquests, the following three key areas of level crossing risk have been identified by ORR where particular assurance of the suitability of the ALCRM for modelling the level of risk is required:
• station foot crossings (SFCs);
• user-worked crossings (UWCs); and
• pedestrian risk in general at level crossings.

2
1.2 SCOPE
The scope of this work was limited to the model as applied to the above three areas. Implementation of the ALCRM was outside the scope of this work. For the purposes of this review it has been assumed that the model had been implemented, and data collected and entered in accordance with NR’s standards and procedures.
The review was focussed on those aspects of the model relating to calculating the level of safety risk at station crossings, user worked crossings and pedestrian risk in general. The following areas of the model were not considered as part of this review:
• the cost benefit analysis module;
• operational risk; and
• the train derailment model (only relevant where a train hits a vehicle), which generally gives only a small contribution to collective risk.
1.3 METHODOLOGY
The approach taken is summarised by the following tasks:
1. Determine the role of the ALCRM, through review of documentation and discussion with NR;
2. Familiarisation with the model, based on a review of documentation, demonstration of the ALCRM by NR and discussion with NR;
3. Review the model to determine whether relevant ‘risk-influencing factors’ are appropriately taken into account (based on consideration of the plethora of previous research, incident reports, other documentation and discussion with ORR);
4. Investigate sensitivity of the model to changes in risk factors;
5. Review the risk assessment approach within the model; and
6. Report findings.
1.4 CONTEXT OF THE REVIEW AND FINDINGS It is emphasised that the review is based on the model as described in the Functional Specification[2, 3] and other supporting documentation, supported by discussion with NR, the Rail Safety & Standards Board (RSSB) and Arthur D Little (ADL). Full access to the model was not provided by NR for the purpose of this review. However, aspects of the model were recreated in Microsoft Excel, based on that described in the Functional Specification, to aid understanding. In terms of the findings presented in this report, it is important to note that they are based on the uncalibrated version of the model. At the time of this review (January to May 2008) NR were in the process of applying the model across all level crossings. It is only after all level crossings have been assessed that full calibration of the model can be carried out.

3
1.5 PURPOSE OF THE REPORT
The purpose of this report is twofold:
• firstly its purpose is to present the findings of the review in order to address the aims and objectives presented in Section 1.1; and
• secondly its purpose is to give information to ORR to help ensure that their inspectors fully appreciate the basis of the ALCRM, its purpose and limitations.
1.6 STRUCTURE OF THE REPORT
The remainder of the report is structured as:
• Section 2 provides background to the ALCRM;
• Section 3 explores the purpose and scope of the ALCRM;
• Section 4 discusses generically the approach taken by the ALCRM to calculate the level of risk;
• Section 5 explores how pedestrian risk is modelled;
• Section 6 explores how risk at user worked crossings is modelled;
• Section 7 explores how risk at station footpath crossings is modelled;
• Section 8 explores some generic issues, including census data, risk drivers, calibration of the model and quality assurance;
• Section 9 presents overall conclusions;
• Section 10 presents recommendations;
• Section 11 contains appendices;
• Section 12 provides a list of references; and
• Section 13 contains a list of the acronyms used throughout the report.

4
2 BACKGROUND
The All Level Crossing Risk Model (ALCRM)[2, 3] is a tool that allows the level of collective risk2 and individual risk3 to be estimated at an individual level crossing. It estimates the levels of risk to the following key groups:
• train staff and passengers; and
• level crossing users (pedestrians; cyclists/motorcyclists; and occupants of the following vehicles: tractor/farm vehicles, buses, heavy goods vehicles (HGVs), van/small lorries, and cars.
The model considers three accident scenarios:
• collisions between trains and level crossing users;
• collisions between level crossing users and level crossing equipment; and
• other incidents, such as slips, trips and falls of pedestrians on the level crossing.
The ALCRM can also be used to estimate the level of operational risk posed by a specific crossing. However, as this is outside the scope of the current work it is not discussed further.
The scope of the model is explored in Section 3.2.
The ALCRM is a development of the Automatic Level Crossing Risk Model (the Automatic Model), which was used by Network Rail from around 1997. That particular model was limited to automatic level crossings and NR utilised a different risk assessment approach for other level crossings, for example passive level crossings. Therefore, in terms of consistency the development of a single model for all level crossings is a significant step forward. In addition to expanding the scope of the Automatic Model, a number of refinements were made to the risk modelling such as taking account of:
• the fact that HGVs are more likely to be involved in collisions than other vehicles;
• the fact that heavy vehicles (e.g., HGVs and farm vehicles) are more likely to increase the likelihood that a collision with a train would result in derailment;
• improvements to traffic flow modelling, taking account of work by Stott[4]; and
• enhancements to the derailment model following the level crossing collision at Ufton Nervet in 2004[5].
These refinements and further background to the development of the ALCRM are discussed in the ADL report: Development of the All Level Crossing Risk Model, A History, 1993-2007[6].
2.1 REVIEW OF THE ALCRM
NR commissioned Sotera Risk Solutions Limited to review the ALCRM functional specification and software implementation to ensure it was suitable for assessing the risk at level crossings and for the assessment of possible crossing upgrades. This was done in mid-2006, prior to implementation of the model.
2 Collective risk is the total risk across all those (defined group or groups) exposed to the hazards. 3 Individual risk relates to the probability of fatality per year to which an individual is exposed.

5
The Sotera review[7] acknowledged the context in which the ALCRM was to be applied to level crossing risk management and reviewed the general application of the model across all crossing types. Their report contains 16 key issues and recommendations and makes 56 suggestions for improvement with timescales for resolution. The report indicates a thorough study, and ORR has not challenged the findings.
The report includes comment on the relative levels of calibration for active and passive crossings, highlighting the low level of calibration for the latter. This reflects history and availability of data and is likely to persist, albeit to a diminishing degree until the model is fully populated in 3 years time.
Notwithstanding that review, ORR wished to have a further review carried out in three specific, and focussed, areas. The choice of these areas is discussed below.
It is important to stress that the further review, which is the subject of this report, has attempted not to repeat the Sotera review, but to build upon it. However, some overlap is inevitable, although an attempt has been made to minimise this wherever possible.
2.1.1 Station foot crossings
Station foot crossings (SFCs) are typically characterised by high levels of use that by their nature occur at times when trains are in the area. These crossings are typically passive, though in some cases miniature red/green warning lights may be provided to indicate whether it is safe to cross. Some crossings are linked directly to the platforms, others require users to leave the platform to access the crossing. Risks are increased by the peak times of use necessarily coinciding with times when trains are in the area, by potential distraction as passengers focus on getting to a waiting train, increased noise from train engines and, where more than one running line is crossed, the failure to take into account the possibility of ‘another train coming’.
There have been a number of fatal accidents and near-misses at these crossings in recent years, most notably a double fatality at Elsenham station, Essex in December 2005[8].
Risk at SFCs was assessed qualitatively until the introduction of the ALCRM. The suitability of quantified risk assessment and the capability of the ALCRM to handle the complex issues at these locations has not been scrutinised by ORR. After the Inquest into the Elsenham incident, at which concerns were raised over the risk assessments that had been carried out, the Coroner directed ORR to audit the ALCRM.
2.1.2 User-worked crossings
User-worked crossings (UWCs), despite their relatively low levels of use, contribute a significant proportion of level crossing risk. The characteristics of UWC use are very different from other level crossing types. The mode of operation requires up to four pedestrian traverses for each vehicular traverse. This, together with the need to open and close the gates each time increases the potential for misuse. Risk is also often seasonal and involves a higher proportion of large and possibly slow moving vehicles than at other crossing types as many such crossings are on agricultural land.

6
2.1.3 Pedestrian risk at all crossings
The Automatic Model’s focus was mainly on the risk to vehicle occupants. Therefore, with the development of the ALCRM, which covers the risk to pedestrians across all types of level crossings, opportunity has been taken to consider how well the ALCRM models risk to pedestrians.
2.1.4 Summary
Each of the above areas has given rise to specific concern within ORR as a result of recent investigations of incidents or through ORR proactive level crossing work. A detailed review of the application of the model to these areas will enable ORR to:
• respond to the Coroner’s Direction from the Elsenham Inquest; and
• assess issues of concern from level crossing risk assessment interventions.
Review of issues relating to the implementation of the model by NR are outside of the scope of this work and, hence, are not addressed.

7
3 PURPOSE AND SCOPE OF THE ALCRM
In order to address whether the ALCRM is fit for its intended purpose it is first necessary to consider its purpose and scope. Section 3.1 discusses the purpose and Section 3.2 discusses the scope of the ALCRM. The scope and purpose is revisited in Section 9 after consideration of the detailed modelling approach, to consider the question posed by ORR: is the ALCRM fit for its intended purpose?
3.1 PURPOSE OF THE ALCRM
The purpose of the ALCRM is stated in various documents. For example the Functional Specification[2, 3] and the ALCRM User Guide[9] state that the main purpose of the ALCRM is to provide a method for assessing safety risks to crossing users, train passengers and train staff at level crossings on NR controlled infrastructure. It is further stated in the Functional Specification[2, 3] that the model will be a key tool to assist NR to manage risks to levels that are as low as is reasonably practicable (ALARP). It is also emphasised that the model should be viewed as a tool where model outputs inform the decision-making process and that the model should not be viewed as a decision making tool itself. It is encouraging to see these statements emphasised, as a common pitfall in the application of such risk tools across all industries is the reliance on the numbers to make the decision, which would clearly be inappropriate.
The Research Brief for the “Design and implementation of the all level crossings risk model”[10] states that the ALCRM is being used by NR in their safety decision-making process. It also goes on to state that it is helping to optimise the targeting of risk expenditure to reduce the level of risk. These statements again can be inferred to mean that the ALCRM is part of a wider process, but also that the tool is being used to rank level crossings in terms of risk.
The NR standard NR/SP/OPS/100[11], and Operations Manual Procedures 5-24[12] and 5-25[13] provide further written statements as to the purpose of the ALCRM.
Paragraph 5.2.3 of the NR standard NR/SP/OPS/100 states that the ALCRM should be used to assess risk at existing level crossings, to be supported as necessary by expert judgement or additional risk assessment processes where appropriate. The essence of this is inferred to mean that the ALCRM is part of the overall risk assessment process, but this is not clear based on this statement alone. However, through discussion with NR it was made clear that the intention is for the ALCRM to form part of a much wider risk assessment process.
Section 5.4 of the Operations Manual Procedure 5-24 discusses the process for what happens following completion of the risk assessment using the ALCRM. Essentially this focuses on looking for reasonably practicable measures to reduce risk further. It is stated that the Level Crossing Risk Management Toolkit (LXRMTK)[14-16], and the Level Crossing Risk Control Coordinator (LCRCC) knowledge and expertise should be used to identify reasonably practicable options. The LXRMTK contains a wealth of information that appears able to support this process.
It is further stated in this procedure (at Paragraph 5.4.4) that an option shall be completed to record that no further reasonably practicable options have been identified so that a record is maintained of the decision making process. It is encouraging to see this emphasised. However, it is not clear based on this statement whether all the options that are considered, but ruled out as not reasonably practicable, including the reasons, are recorded. Through discussion with NR it was stated that the purpose of this requirement was to record in the ALCRM that although optioneering had been considered there was nothing further considered reasonably practicable.

8
The intention was not to record everything that had been considered. However, a record of the key decision making should be contained in the level crossing files that exist for each crossing. Based on discussion with NR it appears that the level crossing files form a key part of the record of a risk assessment for a level crossing. However, as this is part of implementation and, therefore, outside the scope of this work and NR are still in the process of going through the optioneering process, the decision making process and the adequacy of the level crossing files are not explored further here. It is recommended, however, that ORR examine the implementation of the decision-making process and the adequacy of the level crossing files to support a suitable and sufficient risk assessment.
Paragraph 5.4.3 of the Operations Manual Procedure 5-24 discusses trigger points where more effort should be put into looking for reasonably practicable risk reduction measures. These trigger points are based on individual risk, collective risk and the proportion of risk that relates to train accident risk. The use of the model in this way indicates that one of its purposes is to prioritise more effort at those crossings that have the highest risk (either individual or collective) or where train accident risk dominates the risk profile. This would appear to be appropriate.
Paragraph 4.1.1 of the Operations Manual Procedure 5-25 states that the ALCRM provides a collective risk result that permit a CBA to be undertaken as a support to decision making.
The training given by NR[17] emphasises that the model’s purpose is to help evaluate risk reduction options and that it is part of NR’s broader risk management of level crossings. It is also emphasised that the model should be used to support and inform, not make, decisions and that the results of the model must be used alongside sound engineering judgment and local knowledge. In terms of the results the following are stated:
“Results of CBA from optioneering is one input to be used to support the decision making process;
Qualitative factors should also be identified and included in the decision making process;
Do not blindly rely on the results from the ALCRM;
Use your expertise and knowledge to include qualitative factors in your decision-making;
However, remember that demonstrating that risk has been managed to a level that is so far as is reasonably practicable requires more than just cost-benefit analysis;
There is an increasing focus on making use of good practice, controlling of hazards, and consideration of societal/ethical concerns.”
Again the procedures and training material examined all appear consistent in emphasising that the ALCRM is to be used as part of a wider process.
3.1.1 Discussion with Network Rail
Through discussion with NR it was again emphasised that the ALCRM forms one tool in the decision making process.

9
At a strategic level one of the key outputs was stated to be the ‘patio graph’, which shows the position of each assessed level crossing on a matrix of collective risk versus individual risk ranking. This allows users to see at a glance those crossings where effort should be focussed for risk reduction, i.e. to support prioritisation. It is also used as a way of easily communicating information about crossings, which can be broken down in various ways, e.g. across the country, in an area or across a type of level crossing. The collective risk ranking also, at a glance, allows a rough and ready estimate of the amount it would be worth spending to reduce risk further, assuming all risk to be removed.
It is clear that the ALCRM output alone is not expected to be a suitable and sufficient risk assessment. Instead, the ALCRM along with all the information contained within the level crossing risk files form part of an overall risk assessment. The files were said to contain the following types of information (not exhaustive):
• relevant level crossing orders;
• plans;
• photographs;
• ALCRM outputs;
• all previous risk assessments;
• correspondence relating to risk reduction measures;
• general correspondence;
• list of authorised users, where relevant;
• relevant incidents; and
• a record of key decisions. Although not examined as part of this work, the level crossing risk files appear to be an integral part of the risk assessment of a level crossing. It is, therefore, recommended that instead of requesting a risk assessment that ORR should request to see the relevant level crossing file. The adequacy of the files to support a suitable and sufficient risk assessment should be ascertained by ORR as part of their normal activity.
3.2 SCOPE OF THE ALCRM
The ALCRM applies to all types of level crossings, of which there are over 60[18] different types, on NR controlled infrastructure, including both automatic and passive crossings. The ALCRM contains risk models for 14 crossing types. Therefore, the 60 or so different crossings on the network have to be represented by one of these 14 crossing types. Appendix A summarises the generic crossing models and how these relate to the crossing types. While this appears to be generally reasonable as a pragmatic approach to risk modelling, there is a concern that the generic crossing in some cases may be too coarse. As an example, consider the generic station crossing. This is used to model both staff crossings and station footpath crossings. However, the underlying risk profile is likely to be very different for these types of crossings due to the different types of users (staff or passengers only accompanied by staff compared with unaccompanied passengers).
It is recommended that NR review the mapping of level crossings to the generic crossing types and consider the need to expand the number of generic level crossing types modelled by the ALCRM.

10
Each generic level crossing within the ALCRM models the following scenarios:
• collision between level crossing users and trains;
• collision between level crossing users and level crossing equipment; and
• other accidents, which includes events such as injuries from slips, trips and falls not resulting in any collision with a train.
The model incorporates a wide range of hazards associated with the above scenarios. From discussion with NR there are a number of exceptions, however, which include:
• risks to staff that operate crossings – level crossing keeper;
• electrical hazards associated with overhead electrification equipment;
• signals passed at danger leading to a collision;
• signalling wrong side failures;
• animals on the hoof (horses are included because they are assumed to be guided);
• staff error, e.g. a signaller giving wrong advice to a user at a UWC with a telephone about a train being in the section; and
• dangerous goods (train or vehicle).
NR have stated that although the above issues are not captured by the ALCRM they are covered elsewhere by NR in its overall risk management processes and that these issues would be picked up where relevant. This would appear acceptable as long as their overall processes are coherent. No further discussion of this specific issue is made as it is outside the scope of the current work.
As the majority of the risk is to users of level crossings, which is captured in the model, the limitations in the scope do not generally appear to be an issue. Notwithstanding this it would be prudent for the following to be done:
• ORR should ensure that inspectors understand the scope of the model, and particularly those areas not included; and
• NR should ensure that the boundaries to the model are clear in any publications describing the model. This is in addition to that contained in the Enhanced Functional Specification, for example in Network Rail’s Operations Manual.

11
4 ALCRM APPROACH TO MODELLING RISK
This section examines how the ALCRM estimates the level of risk. A more detailed summary of the modelling approach is provided in Appendix B to aid the reader. Details of the modelling approach are provided in the ALCRM Functional Specification[2, 3]. It is noted that the description presented is a high level overview of the modelling approach and does not refer to some of the detailed subtleties, for example the impact of HGVs and potential derailment of a train following collision with a vehicle, that are modelled. However, these details generally do not have a significant impact on the level of risk estimated by the ALCRM.
4.1 MODELLING APPROACH
The approach taken by the ALCRM is to start with a generic model of risk for a given crossing type (the ALCRM considers 14 generic crossing types). This generic model is made crossing specific by adjusting the frequency and, to some extent, consequence components of risk to account for the local situation.
Each generic model is essentially representative of the average level of risk over the crossings represented by that generic crossing type. This generic model consists of a number of events, for example pedestrian fails to stop, look and listen, that lead to one of three accident scenarios that are modelled:
• collisions between trains and level crossing users;
• collisions between level crossing users and level crossing equipment; and
• other incidents, such as slips, trips and falls of pedestrians on the level crossing.
Each event has a frequency of occurrence assigned to it that is representative of the average situation across a specific crossing type. This frequency has been assigned by analysis of historical accidents.
To estimate the level of risk for a specific crossing, this generic model of risk is adjusted by increasing or decreasing each event frequency by a factor that is dependent on inputs to the ALCRM.
Two key adjustments are carried out:
• a local crossing feature adjustment factor – which takes account of crossing features and user behaviour that may influence risk; and
• a traffic adjustment factor – to account for the number of users and trains compared to the average.
The first factor is event specific in that some events are not adjusted, and the others are adjusted by different factors. Generally factors between 0.3 and 3 are applied to any one event. Indeed, with the exception of the manual and automatic crossings, it is only some of the events that lead to a train-user collision that are adjusted. For the manual and automatic crossings some events that lead to a user-equipment collision are also adjusted. Therefore, as not all events are adjusted and the adjustment factors are limited in size, the overall change to the frequency of one of the three accident scenarios for a specific level crossing compared to the average situation is generally going to be much smaller than 3. The exact change in the scenario frequency is dependent on the base event frequencies; these vary across the level crossing models.

12
The second factor is applied across all events and changes the base frequency by an amount dependent on either the number of users or the traffic moment (frequency of users multiplied by the frequency of trains). The factor applied is the ratio of use or moment compared to the average number of users or traffic moment, respectively, for the crossing type. As this factor is generally a simple proportion of actual use compared to the average then this can vary much more than the crossing feature adjustment factor varies.
Consequences per event are generally assumed to be independent of level crossing type; this appears to be a reasonable assumption.
4.1.1 Risk measures
The ALCRM estimates the level of risk using the following two risk measures:
• collective risk; and
• individual risk of a regular user. Collective risk, which is the total risk across all those exposed to the hazards, is estimated for a number of defined groups, where relevant4:
• on-board staff;
• passengers;
• car occupants;
• van/small lorry occupants;
• HGV occupants;
• bus occupants;
• tractor/farm vehicle occupants;
• cyclists/motorcyclists; and
• pedestrians. The total collective risk across all these groups is also estimated. In addition to the absolute level of risk the ALCRM also categorises the overall level of risk into one of 13 risk categories, 1 to 13. The boundaries between the risk categories are shown in Table 16 in Appendix D. This category is useful in that it allows crossings to be ranked in terms of collective risk very easily, but potentially could distract from the groups that are dominating the risk. From discussion with NR, they are aware of this potential issue and stated that they are emphasising in training and continually with users that the focus of attention should not be just on the risk category, but also on the detail. The level of collective risk estimated by the ALCRM is very sensitive to the number of users and to a lesser extent the number of trains. Indeed the sensitivity is such that the crossing feature adjustment factors have little effect on the level of risk. The crossing moment and number of users drive the collective risk estimate.
4 Risk is not estimated for groups that would not use the crossing. For example, risk to vehicular users would not be estimated at a pedestrian crossing.

13
The level of individual risk of fatality is estimated for relevant users of the crossing (not passengers or onboard staff). This is estimated for a regular user, defined as a user who makes 250 return crossings per year (500 crossings per year in total). Individual risk is calculated as the fraction of the total collective fatality risk that this hypothetical regular user is exposed to, and is calculated from the following:
useruser
user CRNumber
IR ××
=365
500
(1)
where
• IRuser is the individual risk of fatality for a specified user group, e.g. pedestrian;
• CRuser is the collective risk of fatality for the specified user group; and
• Numberuser is the number of crossings per day by the specified user group. As a measure of the level of individual risk of fatality the approach taken is reasonable, as long as it is recognised that it is the individual risk of a hypothetical regular user. There may be occasions where an actual user’s level of risk is much higher due to more frequent use of a crossing. For example, this may occur at user worked crossings where the user could make many crossings per day. Additionally, this measure takes no account of variations in any group. For example, a vulnerable user may have a higher level of risk, even with the same exposure. However, it would not be appropriate, or sensible, to calculate a level of individual risk for all the different types of user group. This should be addressed outside the model by consideration of all groups that use a specific crossing (including subgroups) and asking the question what else can be done to reduce risk? As long as the limitations in this risk measure are understood, its use is not a concern. Network Rail, in discussion, indicated that such issues are understood and communicated to users of the model and its outputs. In addition to the absolute level of individual risk of fatality to users, the ALCRM also categorises the highest individual risk (from the user groups assessed) into one of 13 risk categories A to M. The boundaries between the risk categories are shown in Figure 17 in Appendix D. This category is useful in that it allows crossings to be ranked in terms of maximum individual risk very easily, but potentially could distract from the groups that are dominating the risk. From discussion with NR, they appear to be aware of this potential issue and stated that they are emphasising in training and continually with users that the focus of attention should not be just on the risk category, but also on the detail. Also, emphasis appears to be on using both risk measures and not one in isolation. The level of individual risk estimated by the ALCRM is insensitive to the number of users, which is as expected. The number of trains is still an important driver, however. Individual risk of a user increases quite strongly as the number of trains increases. On one hand this feels intuitive in that an individual has more chances of interacting with a train on any crossing, thus increasing the level of risk, but on the other hand may be too strong a driver and mask the deliberate abuse adjustment factor (discussed further in Sections 5.1.2 and 5.2.2.1) which increases the frequency of abuse at some crossings as the number of trains reduce. Generally, however, individual risk is more sensitive (compared to collective risk) to the crossing features and should highlight crossings, with a high individual ranking, where the important risk drivers exist.

14
Emphasis in NR’s Operations Manual Procedures (5.24[12]) is to utilise both the collective risk and individual risk ranking to prioritise which crossings to visit to consider further additional control measures. It is noted, however, that additional control measures are still considered for other crossings, having lower collective or individual risk. Use of the ALCRM outputs in this way would appear sensible, as long as other factors outside the model are also considered in order to prioritise which crossings to prioritise effort on. It is noted that there is nothing to suggest that this is not the case, although the specific issue has not been explored as it is outside the scope of the current review. In order to use the ALCRM outputs to prioritise where to spend effort on reducing risk it is important that all outputs are used; this includes individual risk ranking, collective risk ranking and the detailed risk outputs. These should be utilised along with other intelligence, for example near misses, incidents and judgement and experience of NR staff. It is important that ORR are satisfied that such a balanced approach is taken. Using just one measure of risk, just the rankings or indeed just the ALCRM output would not be appropriate.
4.2 COMMENTS ON THE MODELLING APPROACH
The overall approach of starting with a generic average model of risk and adjusting the event frequencies to account for the local situation appears, on the face of it, to be a reasonable approach. However, the approach is dependent on the analysis of accident records and being able to determine the cause of these accidents from the analysis. This is likely to be very dependent on the quality of the narratives, which can vary tremendously. Given that different crossing feature adjustment factors are applied to different events, the way in which the historic accidents are classified is important. Any uncertainty here will have a direct bearing on the uncertainty in the estimated level of risk.
In addition, as the frequency of some of the generic events is based on relatively little data, this introduces uncertainty into the modelling approach. Table 1 summarises the population of train-user collision events that currently drive the ALCRM frequency estimate. These populations are based on analysis of accident and incident data over, generally, a nine year period5. The total number of pedestrian and vehicle events are shown, and also the number of incidents allocated to two base events, Unknown and Deliberate abuse.
The greatest uncertainty is going to be introduced where absolute numbers are small or where the Unknown event forms a significant proportion of the events. Based on the above, least uncertainty will be present when modelling the level of risk at automatic crossings for collisions involving vehicles. Areas of greatest concern in relation to uncertainty because of low numbers or significance of the number of unknown events is at closed circuit television protected crossings (CCTV), manually operated crossings and pedestrian risk across most crossings. In addition, the distribution in events for automatic barrier locally monitored crossings (ABCL), footpath crossings protected with miniature warning lights (FPmwl), station footpath crossings (STATION) and station footpath crossings protected with miniature warning lights (STATIONmwl) have been based on other crossings without justification. It is noted that the ongoing calibration of the ALCRM may improve the current situation.
5 For the open crossing model the Enhanced Functional Specification[3] states the period is 10 years.

15
Table 1 Summary of recorded events used as basis of base data[3]
Vehicle Pedestrian Crossing6
All Unknown Deliberate All Unknown Deliberate CCTV 1 0 0 6 2 4
MCB MCG7
3 1 1 5 2 2
AHB 19 1 8 9 4 5
ABCL Based on AHB (3.6% of AHB incidents)
AOCL 32 3 23 1 1 0
UWC 14 4 7 7 2 3
UWCt 11 1 7 12 4 3
UWCmwl 12 4 10 10 4 3
OC 9 4 4 0 0 0
FP 47 34 9
FPmwl Based on UWCmwl (78% of UWCmwl pedestrian incidents)
STATION Based on FP (7% of FP incidents)
STATIONmwl Based on UWCmwl (26% of UWCmwl pedestrian incidents)
In addition to the uncertainty that categorisation of historic accident data can introduce, another potential issue with the modelling approach can arise because of possible different relative sizes of the crossing feature adjustment factor and the traffic adjustment factor. As discussed above, the crossing feature factor is limited in size whereas the traffic adjustment factor is generally8 not limited and applies across all events. Therefore, when the model is applied to crossings that have a significantly higher or lower frequency of users and/or traffic moment than the average for that crossing type, the effect of the traffic moment will dominate any effect that the crossing feature adjustment factor is having on collective risk. This may have the effect of masking the risk from bad actor crossings, which present high individual risk but have low usage. Indeed crossings such as CCTV crossings that are extremely heavily used, both by pedestrians and trains, but are also highly protected and of less concern may be shown to be of a higher risk than expected. The issue with CCTV crossings was discussed with NR, RSSB and ADL as part of this review, although calibration of the model was given as the driver behind the apparent observations. Whilst this may be part of the answer, it is also probable that the sensitivity to number of users and number of trains is also part of the answer.
It is, therefore, important that NR use the results from the model with caution, especially where traffic moment and/or user frequency are very different to the average assumed by the model. This is especially the case prior to full calibration. From discussion with NR, they appear to be aware of these limitations.
In terms of estimating the level of risk to the different level crossing users, at the detailed level the ALCRM assumes that the distribution in event frequency applies equally to all sub groups. For example, the distribution of pedestrian incident events is assumed to be the same for 6 Refer to the list of acronyms (Section 13) for a definition of these crossings. 7 Incident data is split between MCB and MCG crossing types. 8 It is assumed that the opportunities for vehicle collision are actually greatest at crossings with a moderate traffic frequency and high train frequency. This builds on the work of Stott[ 4, 6].

16
pedestrians and cyclists/motorcyclists. Similarly the distribution of vehicle events is assumed to be the same for tractor/farm vehicles, buses, heavy goods vehicles (HGVs), van/small lorries, and car occupants. This simplifying assumption appears reasonable. Indeed, there currently would not be sufficient data to support more refined user type event frequency distributions.
4.3 SUMMARY
At a high level the approach taken to estimating the level of risk appears reasonable. A number of observations have been raised with respect to sensitivity to number of users and number of trains, and these potentially masking the impact of crossing feature adjustment factors on collective risk. It is emphasised that the approach is not fundamentally flawed and makes good use of the data that is currently available. What is important, however, is the basis of how the base data is adjusted to make the generic model specific to a particular level crossing. This is explored for the three areas within scope in the following sections. The generic model of risk as a starting point appears to make best use of the available historic data.
Notwithstanding the above, the approach does introduce a number of uncertainties and may not rank highly crossings that are high risk with respect to certain features, but not used regularly. It is, therefore, important that ORR are aware of the limitations in the approach and ensure that the model is used as one input in managing risk at level crossings, as stated to be the case by Network Rail and emphasised in the documentation examined.

17
5 REVIEW OF THE ALCRM’S TREATMENT OF PEDESTRIAN RISK
This section of the report considers the treatment of pedestrian risk across all level crossings. Pedestrian risk at user worked and station footpath crossings are also considered in Sections 6 and 7 respectively, where specifically related to those crossing types. Comments have been raised based on a detailed review of the ALCRM Functional Specification[2, 3] and through discussion with NR, RSSB and ADL.
Within the level crossing models, pedestrian risk appears to be modelled in two slightly different ways depending on whether the crossing is passive or not. Section 5.1 explores the ALCRM’s treatment of pedestrian risk for non-passive level crossings such as automatic crossings (ABCLs, automatic half barrier crossings (AHBs) and automatic open locally monitored crossings (AOCLs)) and manually controlled crossings (manual barrier crossings (MCBs), manual gated crossings (MCGs) and manual crossings protected by CCTV (MCBcctv)). Section 5.2 explores the ALCRM’s treatment of pedestrian risk for passive level crossings such as footpath, user worked and open crossings.
5.1 PROTECTED LEVEL CROSSINGS
This section considers pedestrian risk at automatic and manually protected level crossings. Each step in the risk calculation is explored and summaries of issues raised and observations are presented in separate subsections.
5.1.1 Base events
The pedestrian related base events considered by the protected level crossing models are shown in Table 2. Those events where the calibration data is currently zero are indicated by an asterisk (*). As can be seen, the majority of events are currently assumed to have zero frequency; however, it is noted that the ALCRM is currently being calibrated, which may result in the base event frequency data changing.
Comments relating to the inclusion or not of the events for specific level crossing models include:
• FailsToSLL: It generally appears reasonable (assuming there is no procedure to the contrary) that a pedestrian failing to stop, look and listen is not included for protected crossings. It therefore appears strange that the event FailsToSLL is included for AOCLs as it is understood that an audible warning is provided for pedestrians as a means of protection, as well as road traffic signals for vehicle users[1]. Pedestrians are therefore assumed not to have to stop, look and listen. It appears more appropriate that this event should be ‘ignores audible warning’. It is noted that the event data for this event is currently zero, and its inclusion currently has no effect on the calculated level of risk.
• Nip: It appears unlikely that a pedestrian would be able to nip across a crossing at a MCBcctv, MCB or MCG crossing as the barriers or gates would be fully closed before a train arrived. Therefore, any incident would have to relate to climbing the barriers or gates. Clarity on what is meant by the nip event is required.

18
Table 2 Protected level crossing pedestrian base events
Crossing: MCBcctv MCB MCG AHB ABCL AOCL
Scenario: 1 2 3 1 2 3 1 2 3 1 2 3 1 2 3 1 2 3
Event9 FailsToSLL √* Walks √ √ Climbs √ √ √ √* √ √* Train √* √* √* √* √* √* Unaware √* √* √* √* √* √* Unknown √ √* √ √ √* √* √ √* √* √ √* √* √ √* √* √ √* √* Second √* √* √* √* √* √* Nip √* √* √* √* √* √* Barrier √ √ √ Trapped √* √ √ RTA √ √* √* √* √* √* √* √* √* Falls √* √ √* √ √* √ √* √ √* √ √* √ Gates √ √
Key: Scenario 1 – train-user collision; Scenario 2 – user-equipment collision; Scenario 3 – other
• Barrier and gates: The inclusion or not of these events across the manual crossings does not appear to be consistent. The event name does not help as for example the event PO_Gates appears to mean both gates and barriers. The event PO_Gates is defined as “User is injured in operating gates/barrier” and PA_Barrier is defined as “user is hit by a barrier”. It is not clear why PA_Barrier is not included with automatic crossings (with barriers), even with a zero frequency assigned. It is also not clear who is injured in using the gates/barrier (PO_Gates) as crossing keepers are stated as being outside of scope.
• RTA: It is not clear why this event has not been included with the manual crossings for the train user collision scenario whereas it has for the automatic crossings.
• Visibility: this event is included for vehicles, but not pedestrians. Clarification of this is required.
• Dazzle: this event is included for vehicles, but not pedestrians. This appears to be on the basis that the historical data did not include dazzle as a contributory factor. However, as the potential exists, this event should be included for pedestrians.
Notwithstanding the above, because of the way modification factors are applied to pedestrian related base events for the protected level crossing models, it currently does not matter how historic incidents have been categorised between the events. As the same crossing feature and traffic adjustment factors are applied to each event and the model just adds the event frequencies together, as long as all historic events have been included somewhere then the ALCRM will predict the same level of risk. The ALCRM currently does not output the risk profile at the event level. In any case, it is also noted that many of the comments above relate to 9 See Section 13.2 for a definition of the events.

19
events that currently have zero frequency assigned to them. However, the issue is one of consistency in whether events that have not been observed have been included or not and clarity on the definition of the events.
As noted above, the majority of the events currently have zero frequency assigned to them. Whereas this is not an issue in underestimating the historical level of risk, it does mean that the ALCRM does not consider the level of risk from events that have not occurred, but have the potential to occur. In other words there appears to be currently little predictive element to the frequency estimation. Although this is not a straightforward area, NR should consider how statistical techniques could be used to estimate event frequencies for those events currently assigned a zero. A similar approach to that adopted by RSSB for the Safety Risk Model (SRM) may be useful[19].
One event that particularly stands out due to its zero frequency is that due to a second train. This is particularly noticeable given the high profile accident at Elsenham level crossing[8, 20], where a second train was implicated, notwithstanding that the incident was at a passive level crossing. This is discussed in relation to station footpath crossings (Section 7.1.1) and is explored no further here.
5.1.2 Crossing feature adjustment factors
The key difference that distinguishes how pedestrian risk has been modelled at protected level crossings compared with passive level crossings is the crossing feature adjustment factor. For non-passive level crossings the only crossing feature adjustment factor applied is m_p_protected10. This is applied to all the pedestrian related train-user collision scenario events. This factor is calculated based on the following ALCRM inputs:
• ‘Is the crossing at a or near a station’ – possible answers limited to ‘At station’, ‘Station can be seen from crossing’ and ‘Not within sight’;
• ‘Is there a higher than usual number of vulnerable people (e.g. elderly, disabled, deaf, vision impaired, those with learning difficulties’) – possible answers limited to ‘Yes’ or ‘No’; and
• ‘Number of Tracks Crossing Traverses’ – the number of tracks is selected from a drop down box.
Depending on the inputs for each of these questions, the ALCRM assigns factors as follows:
• 1.25 if crossing is at station, else (can be seen or not within sight) 1;
• 1.1 if there are a higher than usual number of vulnerable people, else 1; and
• 1.25 if a user crosses multiple lines, else 1 if a user crosses only one line.
The overall factor (m_p_protected) is calculated as the product of these factors. It, therefore, varies between 1 if all factors are at their minimum values and 1.72 if they are all at their maximum values. Pedestrian risk at protected crossings, therefore, appears to be relatively insensitive to the crossing features.
The ALCRM functional specification[2] states (at page 19) that pedestrian risk is higher if the crossing is at a station (urgency to catch a train may result in reckless behaviour), there is more than one running line (users may be caught unawares by two trains approaching together,
10 Variable name given in ALCRM Functional Specificaion[2].

20
especially if one is stationary and blocks the view of the approach), and there are a high number of vulnerable people (such as the elderly, vision impaired, deaf or those in wheelchairs). Whereas this is reasonable as a high level statement it does not adequately justify how the factors have been applied.
A number of observations are made:
• It appears strange that the sub-factors are always 1 or greater. It is expected that some crossings would show lower than average risk and the crossing feature adjustment factor in such cases would be less than 1. Pedestrian risk across all protected crossings is, therefore, going to be slightly overestimated. In discussion with NR, RSSB and ADL it was pointed out that this was a calibration issue, and as such should be addressed following calibration.
• The basis of the chosen sub-factors (1, 1.1 and 1.25) is not clearly documented. The enhanced functional specification states that these factors have been derived on the basis of expert judgement, but does not state the basis of this judgement. In discussion with NR, RSSB and ADL it was stated that a workshop was used to sense check the values and also that they are subject to calibration.
• Pedestrian risk at protected crossings is modelled simplistically when compared with the risk to vehicle users and pedestrian risk at passive crossings. This appears partly down to the emphasis of the research over the last 10 years, and also possibly due to the interaction between crossings and the user generally being very different at protected and manual crossings compared to passive crossings. The current approach appears inline with current knowledge, although it is recognised that further work by RSSB is planned in this area.
• It does not appear correct that the same crossing feature adjustment factor is applied to all pedestrian train-user collision events.
• As no crossing feature adjustment factors are applied to the user-collision and other accident scenarios for pedestrian related events, the calculated risk may be insensitive to crossing specific features. How insensitive the calculated risk is depends on the base event frequencies of the user-train collision scenario compared to the user-equipment collision and other scenarios and relative consequences. From examination of the current base event data in the ALCRM Functional Specification[2] it appears that the models least sensitive are MCBcctv, MCB, MCG and AOCL.
5.1.3 Traffic adjustment
At protected level crossings, base events frequencies are adjusted by one of the following traffic adjustment factors:
• P_TrafficMoment: the pedestrian traffic moment (number of pedestrian traverses per day multiplied by the number of trains per day) at the specific crossing relative to the average pedestrian traffic moment for the crossing type.
• P_Users: the number of pedestrian traverses at the specific crossing relative to the average pedestrian traverses for the crossing type.
In both cases pedestrians include cyclists. With the traffic moment, pedestrians also captures horses and their riders. It is not clear why horses have not been treated consistently. This should be reviewed by NR. Indeed, the Enhanced Functional Specification[3] states that horses are outside of scope.

21
For the ‘Train-user collision’ scenario the P_TrafficMoment traffic adjustment factor is used in all cases, which appears reasonable given the level of collective risk will be related to both the frequency of trains and the frequency of use. For the ‘Other’ scenario the P_Users traffic adjustment factor is used in all cases, which again appears reasonable. In this case the level of collective risk will be a function of the frequency of crossing traverses by pedestrians and not the frequency of trains. For the ‘User-equipment collision’ scenario the P_TrafficMoment traffic adjustment factor has generally been used. The only exceptions are:
• PO_Gates at MCB and MCG level crossings where the P_Users traffic adjustment factor has been used; and
• PA_Unknown at AOCL level crossings where a traffic adjustment factor has not been defined, which the ALCRM assumes equates to 1.
Generally the choice of the P_TrafficMoment traffic adjustment factor looks reasonable for situations where the collision is between the user and the barrier or gate, which is only closed across the road or path when trains are approaching. In this case the level of collective risk will be related to both the frequency of trains and the frequency of use. Specific comments relating to the choice of traffic adjustment factor include:
• For the Unknown user-equipment scenario events it is not possible to determine which traffic adjustment factor is most appropriate. However, if it is assumed that these events are based on incidents with insufficient information to identify the cause and it is postulated that the most likely user-equipment collision is with the barrier or gate, then use of the P_TrafficMoment traffic adjustment factor would generally appear reasonable. However, this may not be the case with gated crossings, where gates are normally closed to the road, and open protected crossings, as discussed below.
• For gated crossings operated by railway staff, RSPG 2e[1] states (at Paragraph 33) that the gates are normally kept closed across the road. In which case, use of the P_Users traffic adjustment factor would appear reasonable. In addition, ADL stated that defective gates or barriers closing unexpectedly caused two accidents that contributed to the frequency of this event at manual crossings. In these cases use of the P_Users traffic adjustment factor would again appear reasonable. However, RSPG 2e also states that where the rail traffic is much less than the road traffic that the gates may be kept closed to the railway. In this case use of the P_TrafficMoment traffic adjustment factor would appear more reasonable. NR should consider capturing information on the normal configuration of the gates (i.e. open to road traffic or open to rail traffic) and the ALCRM should use the most appropriate factor.
• For the AOCL crossing, as there is no barrier, any user-equipment collision is going to be with the lights or other roadside equipment or signs. In which case it would be more appropriate to use the P_Users traffic adjustment factor as the level of collective risk is not dependent on the frequency of rail traffic.
As the level of collective risk predicted by the ALCRM is sensitive to the assumed rail traffic frequency and frequency of crossing traverses it is important that the most appropriate traffic adjustment factor is used by the model. NR should, therefore, review the frequency adjustment factors used by the ALCRM taking account of, but not limited to, the above comments.

22
5.1.4 Consequences
The consequences used by the ALCRM in its calculation of pedestrian collective risk are summarised in Table 3. Table 4 shows the equivalent consequences assumed within version 5 of the SRM[21].
Table 3 ALCRM pedestrian collective risk consequences[2]
Event Consequence [Fatality weighted injuries (FWIs) per event]
Train-pedestrian collision 0.812 Pedestrian-equipment collision 0.016 Other 0.022
Table 4 SRM pedestrian collective risk consequences[21]
Predicted average fatalities and injuries per event Passenger/MOP average fatalities and injuries per event
Event
FWI/event Fatalities/event Major injuries/event
Minor injuries/event
Staff shock or trauma/event
Passenger struck on station crossing
0.8663 0.833 0.333 0.0 0.667
MOP struck on non-station crossing
0.7914 0.782 0.0873 0.131 0.935
AOCL & ABCL crossings
0.6930 0.680 0.120 0.200 0.960
AHB, MG, MCB, CCTV, all UWC
0.9100 0.905 0.0476 0.0476 0.905
Footpath crossings 0.6930 0.680 0.120 0.200 0.960
MOP struck/trapped by level crossing equipment
0.0342 0.0190 0.110 0.834 0.0354
For collisions between trains and pedestrians the consequence assumed by the ALCRM is in reasonable agreement with those used by the SRM. The main difference is that the SRM assigns different consequences to the different level crossing types. The ALCRM assumes that the consequences per event are invariant, which appears a reasonable assumption for pedestrian risk. The value used by the ALCRM appears to be about the average assumed by the SRM.
The SRM assumes about 1 staff shock or trauma event per collision. The ALCRM is again consistent here. However, the SRM (version 5) assumes that 1 shock or trauma event is equivalent to 0.005 FWI, whereas the ALCRM assumes 0.1 FWI, which is a factor of 20 higher. Further work has been carried out by RSSB in this area with latest advice[22, 23] (April 2008) being that a Class 1 shock/trauma (caused by witnessing a fatality or being involved in a collision, derailment or train fire) is equivalent to 0.005 FWI and a Class 2 trauma event (other causes, such as verbal abuse, near misses and witnessing non-fatal assaults) is equivalent to

23
0.001 FWI. As part of the calibration process the ALCRM should be made consistent with latest RSSB guidance.
For pedestrian-equipment collisions the consequence per event assumed by the ALCRM appears to be about a factor of 2 lower than that assumed by the SRM. It is possible that the SRM event is not exactly the same as the ALCRM event, which could account for some of the difference.
For the other event in the ALCRM it is difficult to make a direct comparison with the SRM as such an event is split between various events in the SRM. Given this and the insignificance of the scenario in terms of risk no further consideration of the consequences of this event is made in this report.
The observed differences, discussed above, should be addressed by NR at the next planned calibration of the risk model. However, it is noted that the ALCRM outputs will not be overly sensitive to such differences.
5.1.5 ALCRM inputs
As discussed above the ALCRM only uses the following inputs to calculate the level of risk for pedestrian users:
• whether crossing is near a station;
• number of tracks;
• whether there are a higher than usual number of vulnerable pedestrians;
• train frequencies; and
• number of pedestrians, cyclists and horses.
However, the ALCRM requires many more inputs. Most of these appear to relate to the calculation of risk due to train vehicle collisions, but a number do not appear to be used. The information collected but not used by the model is of some, but minor, concern due to the potential in undermining confidence of users. It is recognised, however, that there is benefit in collecting additional information. For example, information to be used in the wider decision making process, outside the ALCRM.
Such information that does not influence the calculated level of risk includes:
• orientation of road/path and railway (although used to help users determine whether direction of the sun is an issue);
• high number of irregular users; and
• are there any planned or any apparent developments near the crossing that may lead to a change or increase in use.
The following inputs are assumed to relate to vehicles and not pedestrians as they do not influence pedestrian risk. However, it is not clear that they are only vehicle related in the ALCRM input screens:
• normal strike-time;
• average time to close gates/barriers; and
• in what proportion of crossing activations does more than one train pass the crossing.

24
Automatic crossings only
• Has there been any user abuse of the crossing in the last year;
• have there been more than two right sided failures of the crossing in the last year; and
• have any actions been taken to mitigate deliberate misuse.
Manual crossings only
• Has there been any user abuse of the crossings in the last year.
In order to reduce any possible confusion the following should be considered by NR:
• where unused inputs are for future developments or for use in the wider decision making process, these should be marked as such; and
• it would be helpful if inputs only relevant for calculating pedestrian risk or vehicle occupant risk are distinguishable.
It is noted that the ALCRM input screens highlight those inputs that are mandatory, which goes part of the way to address the above; a small red asterisk is given before the mandatory questions. However, this appears to include more inputs than those that influence risk. Indeed some inputs that are not used by the model are shown as mandatory, such as the number of animals on the hoof. Thus there appears to be some inconsistency; use of these markings should be reviewed by NR. In discussion with NR it was stated that the model requests more information than needed to calculate the level of risk. This was stated to be for two main reasons: in an attempt to move users away from playing with inputs to get the ‘right’ answer; and, also, as the additional information is valuable in the wider decision making process.
5.1.6 Protected level crossing summary
For protected level crossings the ALCRM does not model how pedestrian behaviour, the environment or particular level crossings influence the level of pedestrian risk at a particular crossing. Pedestrian risk appears to be modelled very simplistically and the ALCRM in terms of collective risk is essentially just ranking level crossings based on scaling average risk by number of users and rail traffic. Individual risk is a little more sensitive to the crossing features.
5.2 PASSIVE LEVEL CROSSINGS
This section considers pedestrian risk at passive level crossings. Each step in the risk calculation is explored and summaries of issues raised and observations are presented in separate subsections. Consequences are not considered here as the same assumptions are used as with the protected crossings (see Section 5.1.4).
5.2.1 Base events
The pedestrian related base events considered by the passive level crossing models are shown in Table 5. Those events where the calibration data is currently zero are indicated by an asterisk (*). As can be seen, the majority of events are currently assumed to have zero frequency; however, it is noted that the ALCRM is currently being calibrated, which may result in the base event frequency data changing.

25
Table 5 Passive level crossing pedestrian base events
Crossing: UWC UWCt UWCmwl FP OC STATION FPmwl STATION mwl
Scenario: 1 2 3 1 2 3 1 2 3 1 2 3 1 2 3 1 2 3 1 2 3 1 2 3
Event11 FailsToSLL √ √ √ √* √ IgnoresRL √ √ √ Sighting √* √* √ √ √* √ √ √ Train √ √* √* √* Unaware √ √ √ √* √ √ √ Unknown √ √* √* √ √* √* √ √* √ √ √* √* √* √* √* √ √* √* √ √* √ √ √* √ Second √* √ √* √* √* √* √* Nip √* √* √ √* √* √* √* RTA √ √* √* √* √* √* √* √* √* √* √* √* √* √* √* Falls √ √* √ √ √ √ √* √ √* √ √* √ √ √ √ √ Gates √ √* √* √* √* √* √* √* √* √* √*
Key: Scenario 1 – train-user collision; Scenario 2 – user-equipment collision; Scenario 3 – other
11 See Section 13.2 for a definition of the events.

26
Comments relating to the inclusion or not of the events for specific level crossing models include:
• FailsToSLL and IgnoresRL: Inclusion or omission of these events, fails to stop, look and listen and ignores miniature warning lights, appears sensible and relates to the protection/warning provided at the crossing.
• Sighting: It appears strange that this event is included for level crossings that are protected by miniature warning lights as there is generally no requirement to look for trains in these circumstances. In discussion with NR, RSSB and ADL it was stated that this event also captures insufficient warning time at crossings protected by MWLs. This appears strange, as the warning time at a MWL protected crossing should be designed to give adequate warning.
• Train: Inclusion of the event ‘train irregularly on crossing’ appears sensible for those crossings with warnings of a trains approach, such as with miniature warning lights. Similarly omission at crossings with no warning measures also appears sensible. However, it appears strange that this event is included for UWCs with telephones. At this type of crossing, the telephone is for vehicle users and, generally, not pedestrians. Pedestrians are required to stop, look and listen.
• Nip: It is not clear why a pedestrian collision with a train as a result of nipping across in front of the oncoming train is not included at unprotected UWCs. Although this was not identified in historic incidents, as the potential for such an incident exists this event should still be included.
• RTA: Inclusion or omission of the road traffic related event is not intuitive across all level crossing types. For example, it is included at protected UWCs (UWCt and UWCmwl), but not at unprotected UWCs. It is included at some crossings (FP, STATIONmwl and FPmwl) where there is no vehicular traffic, which appears strange. There are also a few instances where RTA is considered as a cause for a pedestrian-equipment collision, which also does not seem intuitive. In discussion with NR, RSSB and ADL it was stated that incident data had recorded events relating to vehicles at pedestrian crossings, possibly where a vehicular crossing was adjacent to a pedestrian crossing.
• Gates: Inclusion or omission of the gates related event is not intuitive across all level crossing types and accident scenarios. It is also not consistent with the protected level crossing types. It is not clear how gates are implicated in a train-pedestrian collision. If it is as a result of becoming trapped then this event should be explicit. Inclusion of this event is not consistent between STATION and STATIONmwl crossings, and between FP and FPmwl crossings.
As many of the events have zero frequency assigned to them, the comments above are unlikely to have a major effect on the ALCRM outputs. However, as this may change in the future, following any recalibration of the model, it is recommended that NR review the events and ensure that their inclusion is justified. In addition, because different crossing feature adjustment factors are applied to different events it is more important, than with the protected level crossing types, that the historic incidents are appropriately categorised between the events.
As noted above, and as was discussed with the protected crossings, the majority of events currently have zero frequency assigned to them. Again, one event that particularly stands out in having zero frequency is that due to a second train. This is particularly noticeable given the high profile accident at Elsenham level crossing[8, 20], where a second train was implicated. This is discussed in more detail in Section 7.1.1.

27
The Enhanced Functional Specification[3] states that the base event frequency at STATION level crossings has been based on footpath level crossing incidents due to data being unavailable for station crossings (assumed that 7% of FP events apply to STATION crossings based on relative crossing populations). It further states that the data for STATIONmwl crossings have been estimated based on UWCmwl crossings, again due to a lack of data (assumed that 26% of UWCmwl events apply to station crossings based on relative crossing populations). This does not seem intuitive. The risk drivers at a STATION crossing with and without MWLs will be very different to those at a FP or UWCmwl crossing respectively. It is recommended that NR try and collect more station crossing specific data as soon possible, as use of FP and UWCmwl data for station crossings currently undermines the ALCRM applied to station crossings.
5.2.2 Crossing feature adjustment factors
For the passive level crossing types a different approach has been taken for the crossing feature adjustment factor. In this case a different factor has been applied to different events. In discussion with NR, RSSB and ADL it was stated that the different approach has arisen primarily as a result of specific research in this area underpinning the approach adopted, as opposed to less specific research relating to pedestrians at automatic and manual crossings. The different approach is also as a result of a perception (based on research) of a user’s interaction with a passive crossing being very different to that with an automatic crossing, due to users having to make their own decisions at passive crossings.
For most events no crossing feature adjustment factor is applied, which potentially makes the ALCRM insensitive to specific crossing features. How insensitive the ALCRM is depends on the frequency of these events relative to those events where a factor is applied, the magnitude of the factors and the consequences of the events.
Three broadly different crossing feature modification factors are applied to passive crossing pedestrian events:
• a factor relating to deliberate abuse, i.e. failing to stop, look and listen or ignoring the miniature warning lights – applied to either FailsToSLL or IgnoresRL events;
• a factor relating to the sighting distance and therefore warning time – applied to the Sighting event; and
• a factor relating to the chance of getting caught out by a second train – applied to the Second event.
Each of these broad factors is considered in turn.
5.2.2.1 Deliberate abuse
For passive crossings, other than those protected by miniature warning lights, the overall factor applied is an average of the following three factors:
• total number of trains per day – 3 for a low number of trains, 0.3 for a high number and 1 for an average number;
• average speed of trains – 3 for low average speed, 0.3 for fast average speed and 1 for average speed; and
• spare traverse time – 3 where there is most time, 0.3 where there is least time and 1 for average time.

28
The overall factor, therefore, currently varies between 0.3 and 3 depending on local factors, specifically train speed, train frequency, warning time (based on sighting distance and train speed) and crossing traverse time. The overall variation appears intuitive, i.e. that deliberate abuse is more likely where trains are least frequent, slow and where there is plenty of time to cross the track, even after seeing a train. It also appears sensible that the average event frequency is either increased or decreased for a specific level crossing. The variation (qualitative) of deliberate abuse frequency with these factors is also supported by research[16, 24, 25]. What is not clearly justified in the documentation is the basis of the choice of the specific factors, 0.3 or 3, and the boundaries in speed, frequency and spare traverse time. The Enhanced Functional Specification[3] states:
“A key principle of the adjustment of the base events by crossing features is that, for most, the adjustment is set to be over an order of magnitude (i.e. factor of 10). This means that:
• where crossing features increase the base frequency they multiply it by up to a factor of 3;
• where crossing features decrease the base frequency they multiply it by a factor with a value as low as 0.3; and
• where crossing features are deemed not to change the average base event frequency, the multiplier is 1”.
It also goes on to explain why a more rigorous mathematical approach is not possible, which appears reasonable. Essentially the choice of the order of magnitude range is based on expert judgement and previous experience with the Automatic Model. Additionally, in discussion with NR, RSSB and ADL it was emphasised that this approach and values had been peer reviewed by the RSSB ALCRM Project Steering Group and also that these values are still to be calibrated and are, therefore, subject to change. In terms of the boundaries, the basis of the choice is not documented in the Enhanced Functional Specification, although discussion with NR, RSSB and ADL indicated that this was based on analysis of train speed and frequency distributions rather than a direct link to risk. In addition, it was stated that the boundaries were chosen so that the factor does not change suddenly. Again these data are subject to calibration. Although there is nothing fundamentally wrong with the approach, the basis of the actual choice appears a little weak, especially if the point below is considered. Different boundaries have been chosen for open crossings compared with other unprotected passive crossings. For example, low and high speeds of 7 and 15 mph compared with 40 and 50 mph respectively and low and high train frequencies of 15 and 25 trains per day compared with 45 and 50 trains per day. The difference in boundaries is due to train speeds and frequencies being much lower at open crossings. The boundaries have been chosen to ensure that the majority of crossings fall in the average speed range. The choice of boundaries do not appear intuitive if the different crossing types are compared, as, for example, this says that open crossings with train speeds of 20 mph are low risk whereas a UWC with a train speed of 20 mph is high risk. This allows crossings of the same type to be compared, but does not appear sensible if crossings of different types are compared.

29
It is also observed that the difference between the low and high boundaries is generally quite small, still making the factors change quickly from 0.3 to 3.
For passive crossings protected by miniature warning lights the overall factor is the average of the following two factors:
• average speed of trains – 3 for low average speed, 0.3 for fast average speed and 1 for average speed; and
• spare traverse time – 3 where there is most time, 0.3 where there is least time and 1 for average time.
The overall factor, therefore, varies between 0.3 and 3 depending on local factors, specifically warning time (based on sighting distance and train speed for unprotected crossings) and crossing traverse time.
The only difference here is that the frequency of trains is not taken into account. As the crossing warns whether a train is approaching it appears intuitive that train frequency is not taken into account.
It is emphasised that the factors and choice of boundaries are also subject to change via the calibration process.
An area that the ALCRM does not appear to model appropriately is the warning time for crossings where whistle boards are installed. Therefore the factor relating to the spare traverse time may not be appropriate. The ALCRM calculates the warning time based on the input sighting distances and maximum train speed. However, where there is a whistle board there could be a longer warning time than calculated. This may mean that the frequency of the FailsToSLL event is underestimated.
From discussion with NR, RSSB and ADL it was stated that a policy decision was taken not to model whistle boards within the ALCRM. It is stated in the Enhanced Functional Specification[3] that whistle boards were considered to be more appropriately dealt with by Railway Group Standards than on the basis of risk. It is also noted that whistle boards are the subject of ongoing research[37].
NR have a workaround for this limitation whereby the sighting distances entered are adjusted such that the ALCRM calculates an appropriate warning time. Two scenarios are assessed, one with and one without the increased warning time. Notwithstanding this solution, NR should consider making changes to the ALCRM such that the model calculates the warning time appropriately as there is the potential for errors to be introduced in applying the workaround; it is noted that this is already included in NR’s ALCRM enhancement list.
Where MWLs are installed the Enhanced Functional Specification states that the ALCRM uses warning time directly rather than sighting distance, which appears to be appropriate. However, examination of a selection of ALCRM assessments shows sighting distances and not warning times as inputs. There therefore appears to be some inconsistency between the specification and implementation of the specification. It is, therefore, recommended that NR review whether warning time has been appropriately implemented for passive crossings protected by MWLs.

30
5.2.2.2 Sighting
The factor applied to the Sighting events is calculated based on the spare traverse time. Where there is least time the factor is highest (3), where there is greatest time the factor is lowest (0.3) and for intermediate times a factor of 1 is applied.
Again justification of the magnitude of the factors is not clearly documented, even though the general approach appears sensible. The issue discussed above (Section 5.2.2.1) relating to the calculation of warning times for crossings protected by MWLs or where there is a whistle board also applies here. However, in this case the frequency of the Sighting events is likely to be slightly overestimated.
5.2.2.3 Second train
This factor is zero for crossings that cross one line, as expected; in other cases it is calculated based on the following ALCRM inputs[2]:
• ‘How often does a second train pass the crossing within 20 seconds of the first train’: possible answers are limited to ‘Usually’, ‘Often’, ‘Sometimes’, ‘Occasionally’ or ‘Rarely or never’ – the ALCRM assigns factors from 3 for ‘Usually’ to 0.3 for ‘Rarely or never’; and
• ‘What is the chance that the second approaching train would not be seen until the first train has passed’: possible answers are limited to ‘Impossible’, ‘Likely’ or ‘Possible’ – factors applied range from 1 for ‘Impossible’ to 0.03 for ‘Possible’.
The overall factor is calculated as the product of these factors divided by 2. It, therefore, varies between 0.005 and 1.5. Whereas at a high level this approach appears reasonable, it does not consider the underlying factors that may lead to a user more likely getting caught out by a second train, for example at a station with a stationary train, large numbers of people crossing or local distractions. However, the LXRMTK does consider such issues. Therefore, as long as the ALCRM is used alongside the toolkit and not alone, this should not be an issue.
As with the other factors, the basis of the factors is not clearly documented. They appear to be based on expert judgement, but subject to calibration. These factors also appear to have changed in the Enhanced Functional Specification[3] compared with the Functional Specification[2]. The Functional Specification[2] stated:
Variable Description Value Cal_i_2trains_view_impossible Impossible to see second train approaching at a
passive crossing 1
Cal_i_2trains_view_likely Likely to see second train approaching at a passive crossing
0.0329
Cal_i_2trains_view_possible Possible to see second train approaching at a passive crossing
0.143

31
whereas, the Enhanced Functional Specification states:
Variable Description Value Cal_i_2trains_view_impossible Second train would always be seen - the view
from the crossing is not obscured from either side
0.3
Cal_i_2trains_view_likely The second train would not be seen until the first train had passed - the view is usually or always obscured
1
Cal_i_2trains_view_possible There is some potential to view the second train before the first train has passed.
3
ADL stated that this change was due to considering the initial factors to be inappropriate and therefore proposed changes in the Enhanced Functional Specification. This change is currently not included in the Enhanced Functional Specification Addenda. It is recommended that this is added to the Addenda. In addition, the variable names, descriptions and values do not appear consistent. For example, the variable “…view_impossible” is linked with the description “always be seen” and the lowest factor. It would appear more intuitive if this variable was linked with the description “view usually or always obscured” and the highest factor. It is recommended that NR review these differences and clarify or correct the Enhanced Functional Specification as required.
5.2.2.4 Summary
In general, qualitatively, those factors that influence risk appear to do so in an appropriate manner. These variations appear to be supported by research carried out over the last 10 years. Most comments raised relate to the basis of the chosen values, which essentially are based on expert judgement, but are also still subject to calibration and, therefore, change.
5.2.3 Traffic adjustment
At passive level crossings base events frequencies are adjusted by one of the following traffic adjustment factors:
• P_TrafficMoment: the pedestrian traffic moment (number of pedestrian traverses per day multiplied by the number of trains per day) at the specific crossing relative to the average pedestrian traffic moment for the crossing type.
• P_Users: the number of pedestrian traverses at the specific crossing relative to the average pedestrian traverses for the crossing type.
In both cases pedestrians include cyclists. Horse riders are included in the traffic moment, but not the number of users. As discussed in Section 5.1.3, this does not appear consistent.
For the ‘Train-user collision’ scenario the P_TrafficMoment traffic adjustment factor is used in most cases, which appears reasonable given that the level of collective risk will be related to both the frequency of trains and the frequency of use. The exception is the PO_Gates event for the train-user collision scenario where no factor is defined (interpreted as unity by the model). It is noted that the base event frequency is currently zero for these events. The choice of traffic adjustment factor will currently, therefore, have no impact on the calculated level of risk. However, for consistency it is recommended that this factor should be reviewed by NR.

32
For the ‘User-equipment collision’ and ‘Other’ scenario the P_Users traffic adjustment factor is used in all cases, which again appears reasonable. In this case the level of collective risk will be a function of the frequency of crossing traverses by pedestrians and not the frequency of trains.
The calculation of pedestrian collective risk in the ALCRM appears to be very sensitive to the traffic adjustment factors, and therefore the census inputs.
5.2.4 ALCRM inputs
As discussed above, for passive level crossings, the ALCRM only uses the following inputs to calculate the level of risk for pedestrian users:
• train frequencies;
• train speeds;
• sighting distances;
• pedestrian traverse times;
• number of tracks;
• how often does a second train pass the crossing within 20 seconds of the first train;
• what is the chance that the second approaching train would not be seen until the first train has passed; and
• number of pedestrians, cyclists and horses.
However, again (as with the protected level crossings discussed in Section 5.1.5), the ALCRM requires many more inputs. Most of these appear to relate to the calculation of risk due to train-vehicle collisions, but a number do not appear to be used in the calculation of the level of risk. The information collected but not used by the model is of some, but minor, concern due to the potential in undermining confidence of users. It is recognised, however, that there is benefit in collecting additional information. For example, information to be used in the wider decision making process, outside the ALCRM. Such information includes:
• orientation of road/path and railway;
• is there a high number of irregular users?
• are there any whistle boards and distance to them?
• are there any planned or any apparent developments near the crossing that may lead to a change or increase in use?
• if the gates are left open are trains cautioned (used in the operational risk calculation)?
As with the protected level crossings there are also a number of events that relate to vehicles and not pedestrians as they do not influence pedestrian risk. However, it is not clear that they are only vehicle related in the ALCRM input screens.
5.2.5 Passive level crossing summary
Overall, it appears that the ALCRM is not sensitive to local factors that may influence pedestrian risk. The ALCRM is effectively calculating risk by scaling average crossing risk by relative pedestrian moment (actual moment divided by average moment for the crossing type). The conclusion regarding its sensitivity is based on a number of observations:

33
• the model is very sensitive to the number of crossing traverses and train frequency, i.e. the census data, which are likely to swamp any other adjustments;
• only a small number of events are adjusted to take account of local factors (crossing features), and some of these events have a zero frequency;
• the frequency of some of the unadjusted events dominate;
• the crossing feature adjustment factors are relatively small; and
• the overall crossing ratings (individual risk and collective risk) are unlikely to change even when the crossing adjustment factors are changed from their lowest to highest values.
Another issue relating to the calculation of pedestrian risk at passive level crossings worthy of note includes:
• vulnerable pedestrian groups are not explicitly considered by the ALCRM – the only factor that is used in the risk calculation is that guidance is given for the crossing traverse time to be increased by 50% if there are vulnerable groups. Increasing this factor increases the frequency of Sighting events, but reduces the frequency of deliberate abuse events, e.g. FailsToSLL. Therefore, overall, the estimated risk may not be increased when the traverse time is increased to account for vulnerable groups.
5.3 PEDESTRIAN RISK SUMMARY AND RECOMMENDATIONS
The approach taken to model pedestrian risk at level crossings differs for passive and protected crossings. It is recommended that NR review the two approaches and consider a consistent approach across all level crossings as more relevant research is completed.
A number of comments were raised with the detail in the model. Although, individually each comment would have little effect on the calculated risk, taken together the effect may not be trivial. It is recommended that NR review these comments and consider making appropriate changes to the model, data or supporting justification as required. It is stressed, however, that at a high level there appears to be nothing fundamentally wrong with the ALCRM’s approach for the calculation of pedestrian risk.
It is important that inspectors within ORR fully understand how pedestrian risk is modelled and its limitations. In particular, the following are emphasised:
• the ALCRM generally models pedestrian risk in a fairly simple way – risk to vehicle users is modelled much more comprehensively, particularly from an abuse perspective;
• pedestrian risk is insensitive to most ALCRM inputs, with the exception of number of crossing traverses and number of trains;
• the vast majority of inputs entered into ALCRM have no influence on pedestrian risk;
• the assumed census data is critical – this is discussed in Section 8.1; and
• underlying causes that influence risk are generally not considered by the ALCRM. These would have to be captured outside the ALCRM through use of the LXRMTK and expert judgement.

34
6 REVIEW OF THE ALCRM’S TREATMENT OF USER WORKED CROSSINGS
The following three generic models within the ALCRM cover user worked crossings:
• UWC – user worked crossings without protection;
• UWCt – user worked crossings with telephones; and
• UWCmwl – user worked crossings with miniature warning lights.
The approach taken to model risk across the different types of user worked crossings is essentially the same, with only slight differences dependent on the type of protection, i.e. telephones, miniature warning lights or none.
This section of the report considers the treatment of pedestrian and vehicle risk across all three user worked level crossing models.
6.1 CALCULATION OF RISK AT USER WORKED CROSSINGS
The ALCRM calculates the level of risk based on generic crossing event frequencies that are modified to account for local crossing features and traffic (numbers of vehicles, pedestrians and trains). Each of these aspects is discussed in the following subsections.
6.1.1 Base events
The base events considered by the user worked crossing models are shown in Table 6 for vehicle related events and Table 7 for pedestrian related events. Those events where the calibration data is currently zero are indicated by an asterisk (*). As can be seen, a number of events are currently assumed to have zero frequency; however, it is noted that the ALCRM is currently being calibrated, which may result in the base event frequency data changing.
Comments relating to the inclusion or not of vehicle related events for specific level crossing models include:
• GatesLO: It is not clear why gates left open is not considered as an event at UWCmwl crossings. This event has been included with the UWC and UWCt models. Leaving gates open appears to be a strong driver[27] for deliberate abuse at user worked level crossings. In discussion with NR, RSSB and ADL it was stated that this was captured in the IgnoresRL event. This being the case will not adversely affect the calculated level of risk, although better consistency would be achieved by separating the events.
• Sighting: It appears reasonable that limited sighting is generally an issue for an unprotected user worked crossing (UWC), assuming no procedures to the contrary, but it is not clear why it is an issue for protected crossings where users are not usually required to stop, look and listen. In discussion with NR, RSSB and ADL it was stated that this event also captures limited warning time provided by the MWL. As stated earlier, this appears strange as the warning time at a MWL protected crossing should be designed to give adequate warning. The description of the event would benefit from clarification to make clear what is included.
• Visibility: For the train-user collision scenario, it again appears reasonable that visibility is an issue for unprotected user worked crossings (UWCs), but it is not clear why it is

35
an issue for protected crossings where users are not usually required to stop, look and listen.
• Dazzle: For the train-user collision scenario, it again appears reasonable that being dazzled by the sun is an issue for unprotected user worked crossings (UWCs), but it is not clear why it is an issue for protected crossings where users are not required to stop, look and listen as the modifier applied to this event at UWCs relates to being dazzled looking up and down the line. The definition of the Dazzle event in the Enhanced Functional Specification[3] states: “User unable to see the crossing because of low sun/other cars’ headlights”, which would be an issue across all UWC types. The Dazzle event appears to be being applied in two different ways, but the documentation does not make this clear. This should be clarified in the ALCRM documentation.
Table 6 User worked crossing vehicle events
Crossing: UWC UWCt UWCmwl
Scenario: 1 2 3 1 2 3 1 2 3
Event12 FailsToSLL √ Phone √ IgnoresRL √ GatesLO √ √* Sighting √ √* √* Visibility √* √ √* √ √* √ Dazzle √* √ √* √ √* √ Grounded √ √ √* Brake √* √ √* √ √* √ Block √* √* √ Train √ √* Unknown √ √ √ √ √* √ √ √* Second √* √* √* RTA √* √ √* √* √ √* √* √ √* Turns √* √* √*
Key: Scenario 1 – train-user collision; Scenario 2 – user-equipment collision; Scenario 3 – other
12 See Section 13.2 for a definition of the events.

36
Table 7 User worked crossing pedestrian events
Crossing: UWC UWCt UWCmwl
Scenario: 1 2 3 1 2 3 1 2 3
Event13 FailsToSLL √ √ IgnoresRL √ Sighting √* √* √ Train √ √* Unaware √ √ Unknown √ √* √* √ √* √* √ √* √ Second √* √ √* Nip √* √* RTA √ √* √* √* √* √* Falls √* √* √ √ √ √ Gates √ √* √* √* √*
Key: Scenario 1 – train-user collision; Scenario 2 – user-equipment collision; Scenario 3 – other
Most comments relating to the inclusion or not of pedestrian related events for passive level crossings, including UWCs, were discussed in Section 5.2.1 and are, therefore, not repeated here. The only additional comments include:
• Unaware: It is not clear why a user cannot be unaware of an unprotected UWC.
• Dazzle and Visibility: It is not clear why these are not specific events for pedestrians, as they are for vehicle users. This appears to be on the basis that the historical data did not include dazzle or visibility as contributory factors. However, if the potential exists, these events should be included for pedestrians.
As many of the events have zero frequency assigned to them, the comments above and in the earlier sections are unlikely to have a major effect on the ALCRM outputs. However, as this may change in the future, following any recalibration of the model, it is recommended that NR review the events and ensure that their inclusion is justified. In addition, because different crossing feature adjustment factors are applied to different events it is important that the historic incidents are appropriately categorised between the events.
As noted above, and as was discussed with pedestrian risk and station crossings, a large proportion of events currently have zero frequency assigned to them, which potentially makes the ALCRM insensitive to many of the inputs.
6.1.2 Crossing feature adjustment factors
As with all passive level crossing types modelled by the ALCRM, only train-user collision events are adjusted to take account of specific crossing features.
13 See Section 13.2 for a definition of the events.

37
Crossing feature adjustment factors relating to pedestrian events were discussed in Section 5.2.2, and are not discussed in detail here. This section therefore concentrates on the factors applied to the vehicle events. For the events shown in Table 6, adjustment factors are applied as follows:
• a factor relating to deliberate abuse, i.e. failing to stop, look and listen at UWC crossing types, failing to use the telephone at UWCt crossing types and ignoring the warning lights at UWCmwl crossing types;
• a factor relating to how often gates are left open – applied to the GatesLO event;
• a factor relating to the sighting distance and therefore warning time – applied to the Sighting event;
• a factor relating to whether low sun is an issue – applied to the Dazzle event;
• a factor relating to whether there is a chance of a vehicle getting stuck on the crossing – applied to the Grounded event; and
• a factor relating to the chance of getting caught out by a second train – applied to the Second event.
Each of these broad factors is considered in turn.
6.1.2.1 Deliberate abuse
The approach taken differs dependent on the type of protection. For unprotected user worked level crossings the overall factor is generally the average of the following four factors:
• total number of trains per day – 3 for a low number trains, 0.3 for a high number and 1 for an average number;
• average speed of trains – 3 for low average speed, 0.3 for fast average speed and 1 for average speed;
• spare traverse time – 3 where there is most time, 0.3 where there is least time and 1 for average time; and
• whether gates are left open – 3 when ‘often or always left open’, 1 when ‘occasionally left open’ and 0.3 when ‘always closed’.
The only exception is where gates are ‘often or always left open’ where an overall factor of 3 is applied regardless of the other factors.
The overall factor, therefore, varies between 0.3 and 3 depending on local factors, specifically train speed, train frequency, warning time (based on sighting distance and train speed for unprotected crossings), crossing traverse time and how often (qualitatively) gates are left open.
The overall variation again appears intuitive, i.e. that deliberate abuse is most likely where trains are least frequent, slow, where there is plenty of time to cross the track and where gates are left open. In addition, forcing the factor to 3 when gates are ‘often or always left open’ also feels reasonable given this risk driver is identified in many accidents at user worked level crossings.
The approach taken is similar to that applied to the equivalent pedestrian risk event, FailsToSLL, (Section 5.2.2) with the exception that here there is an additional local factor, whether the gates are left open. It is not documented why pedestrian deliberate abuse is not

38
more likely when gates are left open, although ADL stated that gates have not been found to be an influencing factor for pedestrian risk. Given that no evidence to the contrary has been found, this is considered fit for purpose.
As discussed for pedestrian risk at passive crossings (Section 5.2.2.1), the ALCRM does not take account of the increased warning time when there are whistle boards installed.
For user worked crossings protected by telephones (UWCt) the following approach is taken. The factor applied in this case is only dependent on the following question:
• ‘Are the telephones used’? – possible answers include ‘Always’, ‘Sometimes’ and ‘Rarely’.
A factor of 3 is applied for rarely, 1 for sometimes and 0.3 for always.
This approach appears reasonable, although it is not clearly documented why some of the factors applied for unprotected user worked level crossings are not used in this case, such as frequency of trains, speed of trains, sighting distances and how often gates are left open, as these are likely to influence the chance of a collision after not using the telephone.
For user worked crossings protected by miniature warning lights (UWCmwl) an approach similar to that used for unprotected user worked level crossings is used. The only differences are that the overall factor is not dependent on train frequency and it is not forced to 3 when the gates are ‘often or always left open’.
Overall, a slightly different approach has been applied to the different types of user worked crossings. Whereas most of the differences are understandable given the different types of protection, some are not.
6.1.2.2 Gates left open
Where gates left open accidentally leads to a train-user collision, the factor applied to the base event frequency is dependent solely on the question:
• ‘Are the gates / barriers left open at the crossing’? – possible answers include ‘Often or always left open’, ‘Occasionally left open’ and ‘No always closed’.
In this case a factor of 1 is applied for ‘Often or always left open’, 0.5 for ‘Occasionally left open’ and 0 for ‘No always closed’.
Whereas the approach taken appears reasonable, the basis of the factors is not clearly documented other than by reference to expert judgement. However, based on discussion with NR, RSSB and ADL it is noted that the factors were reviewed by the RSSB ALCRM Project Steering Group and are still subject to calibration.
Additionally, as all the factors are 1 or less, it appears that ALCRM is potentially underestimating risk slightly at crossings where gates are always left open, as more of the historic events than the average would apply in these cases. It is noted, however, that the interaction between the crossing feature adjustment factor and the traffic adjustment factor may compensate. Again, these factors are still subject to calibration, which may also address this issue.
This modifier is only applied to UWC and UWCt crossing types. Currently the UWCmwl crossing model does not take account of this event as discussed in Section 6.1.1.

39
6.1.2.3 Sighting
The factor applied to the Sighting events is calculated based on the spare traverse time as previously. Again, the ALCRM takes no account of the increased warning provided by whistle boards as discussed before.
The only additional issue with its application to user worked crossings is its application to those crossings protected by miniature warning lights as there is no need for a user to stop, look and listen. Indeed, this factor is not included for user worked crossings protected by telephones.
6.1.2.4 Dazzle
The factor applied to the Dazzle event for unprotected user worked crossings is dependent on a single ALCRM input:
• ‘Is low sun a problem looking up and down the tracks’ – 1 for ‘low horizon’ and 0 for ‘high horizon’.
The following comments are made relating to this:
• the approach taken appears reasonable;
• the adjustment factor is only applied to unprotected user worked crossings, which appears intuitive if the dazzle event relates to looking up and down the track, but note the comment relating to the Dazzle event in Section 6.1.1; and
• as the factors are either 1 or 0, it appears that the ALCRM is potentially slightly underestimating the frequency of events related to a driver being dazzled by the sun. Where the sun is an issue the average frequency is used and where it is not an issue the frequency is zero. Therefore, the frequency across all UWCs is always going to be less than historic experience. Again, it is noted that these values are still subject to calibration, which may address the issues.
6.1.2.5 Grounded
The factor applied to the Grounded event for all types of user worked crossing is dependent on a single ALCRM input:
• ‘Is there a risk of a vehicle getting stuck’ – 1 for ‘No’ and 1.5 for ‘yes’.
The following comments are made relating to this:
• the approach taken again appears reasonable, that is the average base event frequency is increased if there is a chance of becoming stuck; and
• as the factors are either 1 or 1.5, it appears that the ALCRM is slightly overestimating the frequency of events related to a vehicle getting stuck. Where there is no risk an average frequency is used and where it is an issue the frequency is increased above the average. Therefore, the frequency across all UWCs is always going to be greater than historic experience. Additionally, these values are not clearly justified in the documentation. Again, it is noted that these values are still subject to calibration, which may address the issues.
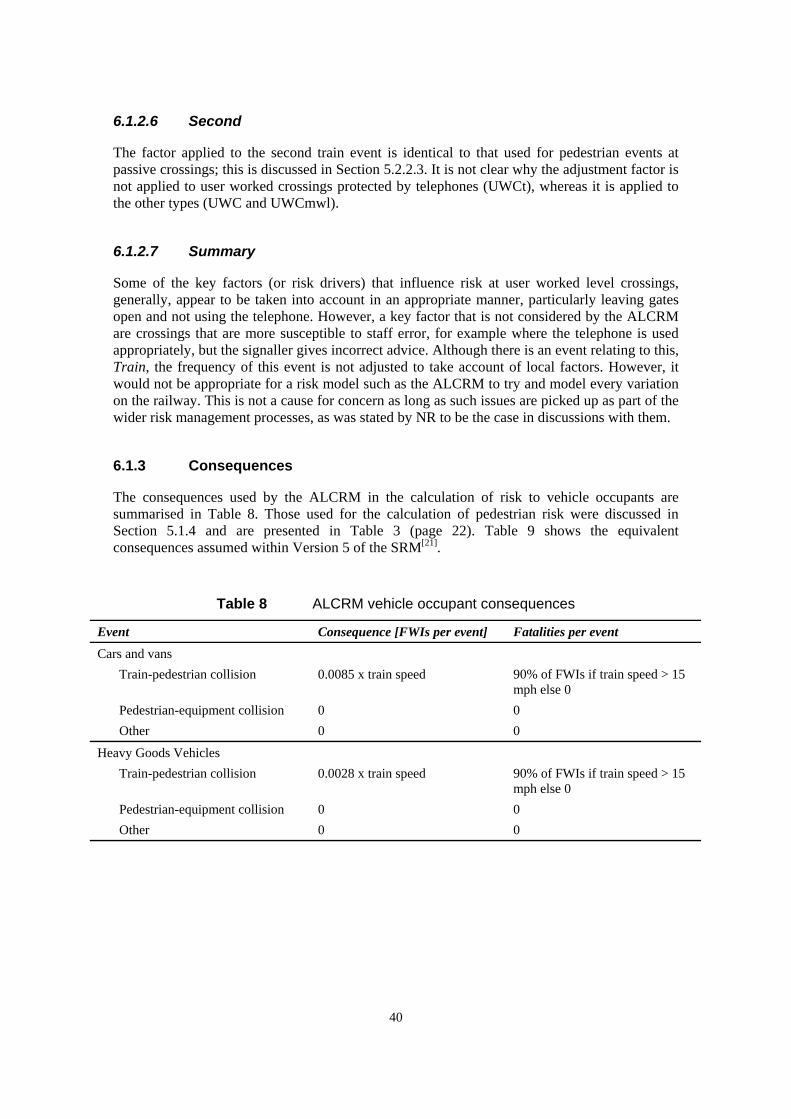
40
6.1.2.6 Second
The factor applied to the second train event is identical to that used for pedestrian events at passive crossings; this is discussed in Section 5.2.2.3. It is not clear why the adjustment factor is not applied to user worked crossings protected by telephones (UWCt), whereas it is applied to the other types (UWC and UWCmwl).
6.1.2.7 Summary
Some of the key factors (or risk drivers) that influence risk at user worked level crossings, generally, appear to be taken into account in an appropriate manner, particularly leaving gates open and not using the telephone. However, a key factor that is not considered by the ALCRM are crossings that are more susceptible to staff error, for example where the telephone is used appropriately, but the signaller gives incorrect advice. Although there is an event relating to this, Train, the frequency of this event is not adjusted to take account of local factors. However, it would not be appropriate for a risk model such as the ALCRM to try and model every variation on the railway. This is not a cause for concern as long as such issues are picked up as part of the wider risk management processes, as was stated by NR to be the case in discussions with them.
6.1.3 Consequences
The consequences used by the ALCRM in the calculation of risk to vehicle occupants are summarised in Table 8. Those used for the calculation of pedestrian risk were discussed in Section 5.1.4 and are presented in Table 3 (page 22). Table 9 shows the equivalent consequences assumed within Version 5 of the SRM[21].
Table 8 ALCRM vehicle occupant consequences
Event Consequence [FWIs per event] Fatalities per event Cars and vans Train-pedestrian collision 0.0085 x train speed 90% of FWIs if train speed > 15
mph else 0 Pedestrian-equipment collision 0 0 Other 0 0
Heavy Goods Vehicles Train-pedestrian collision 0.0028 x train speed 90% of FWIs if train speed > 15
mph else 0 Pedestrian-equipment collision 0 0 Other 0 0

41
Table 9 SRM vehicle occupant collective risk consequences[21]
Predicted average vehicle occupant fatalities and injuries per event
Event FWI/event Fatalities/event Major
injuries/event Minor injuries/event
Passenger train collision with road vehicle on level crossing
0.1472 0.134 0.119 0.254
AOCL & ABCL crossings
0.0599 0.0451 0.133 0.308
Open crossings 0.0065 0.00448 0.0134 0.131 Other crossings 0.1981 0.185 0.119 0.236
Non-passenger train collision with road vehicle on level crossing
0.1507 0.137 0.124 0.260
AOCL & ABCL crossings
0.0632 0.0479 0.137 0.312
Open crossings 0.0245 0.0198 0.0383 0.176 Other crossings 0.2005 0.187 0.123 0.240
The ALCRM is more sophisticated in the way it calculates consequences to vehicle occupants, when compared to pedestrians in that the train speed is taken into account. The following comments are made in relation to this:
• The magnitude of the consequences increasing with train speed generally appears a reasonable assumption, although the basis of the proportional relationship assumed and the range of validity is not clearly documented.
• It appears appropriate that for a given train speed the FWIs per event are lower for large vehicles (HGVs, tractors etc) than for small vehicles (cars, small vans etc) given that their size gives better protection.
• The assumed FWIs for buses does not seem intuitive since it is expected that the level of collective risk would be greater than for HGVs due to the higher number of occupants. The ALCRM does not appear to explicitly take the number of occupants into account in the collective risk calculation. It is noted that in the individual risk calculation it is assumed that buses have an average occupancy of 10 and HGVs have an average occupancy of 1.
• Assuming 90% of FWIs are fatalities appears to be a reasonable assumption, even if very slightly conservative when compared to the SRM average assumptions.
• Assuming that there are no fatalities at low train speeds also appears to be a reasonable assumption, although the basis of the cut-off at 15 mph is not clearly documented.
• There appears to be no consideration of consequences relating to trains carrying dangerous goods or vehicles carrying dangerous goods. However, this omission is unlikely to be significant given the contribution of such events to overall risk at level crossings.

42
• The ALCRM may calculate consequences that are greater than those assumed in the SRM. For example, a train-vehicle collision in the SRM is assumed to give approximately 0.15 FWI per event, which equates to an average speed of 18 mph for the ALCRM to give the same consequence. As it is anticipated that average speeds are in excess of this then the ALCRM appears to overestimate consequences. However, this comparison can only be viewed as indicative because the SRM contains many events, which are modelled in an event tree, and it is, therefore, not a like for like comparison.
• A difference between the approach taken in the SRM and the ALCRM is that the SRM uses different consequences for different groups of crossing types and the ALCRM uses the same approach across all crossings. The approach taken by the ALCRM appears reasonable as the main driver for the consequences is likely to be the speed of the train and the type of vehicle, and both of these factors are taken into account by the ALCRM.
6.2 SUMMARY
The ALCRM appears to consider the key risk drivers that influence the level of risk at UWCs, particularly leaving the gates open and not using the telephone. Also, the variation in the crossing feature factors generally appears intuitive. Again there appears to be nothing fundamentally wrong in the approach taken to modelling risk at user worked level crossings and the ALCRM appears valid as one input for prioritising effort at reducing risk further at these crossings. Notwithstanding this, a number of comments and discrepancies have been noted at the detailed level, which should be considered by NR. Individually, these issues are likely to be insignificant in terms of their effect on the calculated level of risk, but together may be more significant.
In terms of scope, the ALCRM does not cover all issues at user worked crossings. One issue of particular importance is situations where a signaller has more potential for error in advising a user that it is safe to cross at a UWC protected with a telephone. This is not an issue in itself as long as this is considered outside the model, as was stressed by NR to be the case.
One area that differs at UWCs compared to other crossings is that for vehicle users they have to make 5 crossings in total (4 crossings on foot and 1 in a vehicle) for each use of the crossing because of having to open and close the gates before and after use. The ALCRM does not explicitly take the number of crossings into account, but it is implicit in the calculations. This approach appears reasonable as long as the crossing traverse time entered by users is the total time to use the crossing, including the 5 traverses. This should be clarified in the documentation and NR’s Operations Manual.

43
7 REVIEW OF THE ALCRM’S TREATMENT OF STATION FOOTPATH CROSSINGS
Two generic models within the ALCRM cover station footpath level crossings. Both of these are considered here:
• STATION; and
• STATIONmwl.
The STATION crossing type captures the following crossings:
• station barrow crossings;
• station passenger crossings; and
• unprotected staff walking routes.
The STATIONmwl crossing type captures the following crossings:
• station barrow crossings with white lights;
• station crossings with miniature stop lights or white lights;
• staff crossings with non-SP42 white lights; and
• white lights at staff walking routes.
The STATION level crossing type captures both pedestrian station crossings and barrow crossings, where pedestrian crossings are those used by unaccompanied passengers and barrow crossings are those used by staff and passengers only when accompanied by staff. As the underlying risk profile is likely to be different for these types of crossings it appears strange that they have been amalgamated in the ALCRM. The risk calculation would be improved if these were separated. It is, therefore, recommended that NR consider introducing a station crossing model (and station crossing with MWL) as well as barrow and barrow with MWL crossing models.
It is how the ALCRM treats station crossings that are used by passengers that is the subject of review in this section.
The approach taken to the calculation of risk is discussed in Section 7.1, Section 7.2 discusses risk drivers identified in the literature on station footpath crossings, Section 7.3 discusses these risk drivers in relation to the ALCRM and Section 7.4 summarises.
7.1 CALCULATION OF RISK AT STATION FOOTPATH CROSSINGS
The ALCRM calculates the level of risk based on generic crossing event frequencies that are modified to account for local crossing features and traffic (pedestrian and train). Each of these aspects is discussed in the following subsections. Consequences that are combined with frequency to calculate risk are identical to those discussed in relation to pedestrian risk at protected level crossings and are, therefore, not discussed specifically in relation to station footpath crossings; see Section 5.1.4.

44
7.1.1 Base events
The base events considered within the STATION level crossing models are shown in Table 10. Those events where the calibration data is currently zero are indicated by an asterisk (*). Generic issues in relation to the base events were discussed in Section 5.2.1 in relation to passive crossings and are not repeated here.
Table 10 STATION level crossing base events
Crossing: STATION STATION mwl
Scenario: 1 2 3 1 2 3
Event14 FailsToSLL √ IgnoresRL √ Sighting √ √ Train √* Unaware √ √ Unknown √ √* √* √ √* √ Second √* √* Nip √* √* RTA √* √* √* Falls √* √ √ √ Gates √* √*
Key: Scenario 1 – train-user collision; Scenario 2 – user-equipment collision; Scenario 3 – other
The main differences between the two models in terms of the base events are:
• STATION includes FailsToSLL and STATIONmwl includes IgnoresRL, which is as expected given the protection measures employed at the two crossing types;
• the event Train is only included where there are warning lights as this considers the chance of a train arriving when the lights show it is safe to cross, which again seems intuitive;
• the event RTA is only included in STATIONmwl crossing types. Its inclusion appears strange as discussed in Section 5.2.1; and
• the event Gates is also only included in STATIONmwl crossing types. Its omission for STATION level crossings appears strange.
However, the small inconsistencies between the two model types noted above are currently insignificant as the current calibration data for the affected events is zero.
14 See Section 13.2 for a definition of the events.

45
7.1.2 Crossing feature adjustment factors
For the STATION level crossings, only the following three base events, for the train-user accident scenario, are adjusted to take account of local factors:
• FailsToSLL – pedestrian fails to stop, look and listen (STATION) or IgnoresRL – pedestrian ignores warning lights (STATIONmwl);
• Sighting – pedestrian caught out by short warning time; and
• Second – pedestrian caught out by a second train.
For the other events the average frequency (weighted for traffic moment or use) across all level crossings is applied to each specific crossing. The way the ALCRM calculates the above three factors is discussed in Section 5.2.2.
Based on the discussion in Section 5.2.2 the only factors that the ALCRM takes into account in the calculation of the crossing feature adjustment factors are as follows:
• spare traverse time – difference of time to cross and minimum warning time (from minimum sighting distance and maximum train speed);
• number of trains per day (not for STATIONmwl);
• average train speed;
• the frequency of second trains (qualitative input); and
• the chance of not seeing the second train (qualitative input).
There is, therefore, only limited information being used to make the generic frequency data more crossing specific.
7.1.3 Traffic adjustment
As discussed in Section 5.2.3, the following traffic adjustment factors are applied to the base event frequencies:
• P_TrafficMoment: the pedestrian traffic moment (number of pedestrian traverses per day multiplied by the number of trains per day) at the specific crossing relative to the average pedestrian traffic moment for the crossing type. This is applied to train-user collision scenario events; and
• P_Users: the number of pedestrian traverses at the specific crossing relative to the average pedestrian traverses for the crossing type. This is applied to the other scenarios, user-equipment collisions and other.
Application of these factors to the relevant events appears intuitive.

46
7.1.4 Sensitivity of risk estimate to inputs
How sensitive the risk estimate is to the input factors depends entirely on the calibration data. Based on the current event data, the estimated level of risk appears to be fairly insensitive to the crossing feature adjustment factors and sensitive to the assumed number of trains and number of crossing users (collective risk only), hence the census data. This is based on the following observations:
• the frequency for only three events for the train-user collision accident scenario are adjusted to account for local factors;
• the adjustments made to the frequency data are fairly small, up to 3 at most;
• two of the factors (FailsToSLL and Sighting) act against each other, that is as the FailsToSLL factor is at its highest value the Sighting factor is at its lowest and vice versa;
• the third crossing feature adjustment factor, Second, applies to events whose base frequency is currently zero. This therefore has no effect on the level of risk;
• the Unknown event, which is not adjusted to account for local factors, has the highest event frequency; and
• collective risk is essentially proportional to the number of pedestrian traverses.
For a given traffic moment and number of pedestrians per day the crossing risk rankings (collective and individual risk) are, therefore, fairly insensitive to the crossing feature adjustment factors. Indeed the risk ratings may not change at all, or only by 1 category as the inputs are changed from their lowest to highest values. The calculation of collective risk is being driven mainly by the number of trains per day and the number of pedestrians per day.
7.2 RISK DRIVERS
Risk factors at station footpath crossings have been the subject of detailed consideration over recent years, either through research or following incidents. As part of work carried out for ORR to review the Elsenham level crossing risk assessments in place at the time of the Elsenham incident[28], a review of relevant literature was carried out to identify relevant risk factors at station crossings. The factors identified are included in Appendix C of this report. That review also considered research carried out by Arthur D Little[24, 25] on behalf of RSSB, Davies Associates[29] and applicable Railway Group Standards and Guidance (GI/RT7011[30] and GI/GN7611[31]) that were in force at the time of the Elsenham incident.
In addition to the above sources of information, consideration of recent, relevant (pedestrian related) accident reports[8, 20, 32, 33] suggest the following as risk factors:
• visibility to see train – foggy weather;
• hearing impairment;
• mobility impairment;
• clothing warn by user – large coat with hood because of cold weather;
• user illness;
• illumination of crossing;
• failed to stop, look and listen;

47
• sight impairment;
• mud on soles of shoes – leading to slip/fall on crossing;
• distractions; and
• location of facilities, e.g. waiting rooms, vending machines (food and drink), ticket offices/machines.
7.3 RISK DRIVERS WITHIN THE ALCRM
Although the ALCRM considers many of the risk drivers identified in the research, the majority of these are only included in a simple sense. That is the frequency of a specific risk driver may be included, but this generic value is used across all crossings (of that type) without adjustment for specific crossing features.
Key risk drivers that do not influence the level of risk calculated by the ALCRM are:
• any distractions in the vicinity of the station;
• location of station facilities;
• vulnerable groups;
• large groups using the crossing at once;
• the fact that crossing is likely to be around the time of a train;
• whether there are a mixture of stopping and through trains;
• position of warnings (lights or signs);
• crossing surface;
• nearby developments; and
• whether gates, where fitted, are left open.
Although these factors are not explicitly modelled within the ALCRM, it is noted that they could be taken into consideration outside the model; for example, through use of the Level Crossing Risk Management Toolkit. Use of the model in isolation, without consideration of such issues, would be a cause for concern.
7.4 SUMMARY
Although there appears to be nothing fundamentally wrong with how the ALCRM calculates the level of risk at station footpath crossings, the approach adopted is very sensitive to the number of users per day and the number of trains per day, which is not surprising, but is fairly insensitive to other local factors that may influence risk. The census data is a key input to the model, particularly the number of passengers using the crossing.
The model does not consider all key risk factors. Use of the model in isolation would, therefore, not produce a suitable and sufficient risk assessment. Therefore, as stressed in NR procedures, it is imperative that the model is used as part of a wider process. ORR should ensure that this is the case and that suitable records are made by NR of application of the wider process.
The second train event currently has zero frequency assigned to it. This means that the factors that influence the chance of getting caught out by a second train currently have no influence on

48
the level of risk. This appears strange, especially given the high-profile accident at Elsenham[8]. It is noted, however, that NR are currently calibrating the model and that this situation may change. Also, research is ongoing and still being commissioned by RSSB that is focussed on understanding the risk at station crossings. The LXRMTK also already captures many of the relevant risk drivers and potential mitigations for reducing risk at such crossings. Therefore, again, as long as the ALCRM is used as part of a wider process, including alongside the LXRMTK, the lack of explicit consideration of the key risk factors is not a major cause for concern. It is anticipated that the ALCRM will develop in this area as more research is completed. It is recognised that the passive crossing models do not have the benefit of over 10 years of development that the automatic models have had.

49
8 REVIEW OF GENERIC ASPECTS OF THE ALCRM
This section discusses those aspects of the ALCRM that are generic across all level crossing types that were considered as part of this review.
8.1 CENSUS DATA
Based on a review of all level crossing types considered, it is clear that the ALCRM outputs (especially collective risk) are very sensitive to the assumed census data. The number of user traverses of the crossing per day and the number of trains per day are key ALCRM inputs. This in itself is not surprising for a train-user collision as the more trains and the more users there are, simplistically, the more opportunities there are for an accident.
The ALCRM takes one of three approaches for collecting usage data:
• full census – where observations and counts are made over a 24 hour period;
• quick census – where observations and counts are made over a short period, usually 30 minutes; and
• estimate – where number of user traverses are estimated.
In addition, the ALCRM now allows for two census periods to be taken into account, which is an improvement on the Automatic Level Crossing Risk Model. This allows for seasonal variations to be better taken into account as a census can be input for in season and out of season. The proportion of time that each applies is also entered such that the risk is weighted across the two periods.
The numbers of users are required for the following groups, depending on the crossing type15:
• cars;
• vans/small lorries;
• buses;
• HGVs;
• pedal/motor cycles;
• pedestrians;
• horses/riders;
• animals on the hoof; and
• tractors/farm vehicles.
Collective and individual risk are calculated for the majority of these groups. The only exceptions are horses/riders, which is captured under pedestrians, and animals on the hoof, which does not appear to be used.
In addition to the number of users, the ALCRM asks for the duration of time that trains run in the day. This appears to be used as part of the STOTT[28] model.
15 For some crossings only certain groups of users would use the crossing. For example STATION crossings would only be used by pedestrians or cyclists.

50
The three types of census used by the ALCRM are discussed in the following subsections.
8.1.1 Full census
A full census takes the count from a 24 hour observation period and the ALCRM uses this data directly.
8.1.2 Quick census
Operations Manual Procedure 5-23[34] states that this is the standard requirement for vehicular crossings and is the first preference for other crossings. Guidance in the manual states that:
• duration is 30 minutes; and
• it must be carried out between 0930 and 1630 Monday to Friday.
However, the ALCRM allows users to use any duration for the census. Indeed one of the assessments examined as part of this work used a period of 60 minutes. This, therefore, does not appear fully consistent with the Operations Manual. However, as long as the time period is not significantly different to 30 minutes and level crossing usage is fairly uniform over the duration of the census, this is not a cause for concern.
In order to calculate the number of users over a day, the ALCRM takes the quick count (over 30 minutes) and multiplies it by 27. For other durations the factor is adjusted in proportion to the duration compared with 30 minutes; it is multiplied by 30/duration. The assumption that what is seen in 30 minutes is 1/27 of that seen in a day has been used since the initial version of the Automatic Level Crossing Risk Model. The history document[6] states (at Section 3.2.4) that field data supports the use of this factor and that for busy crossings the results can be within 10 percent of a full census. However, no further information is given in the documentation reviewed on what is meant by busy, and what this field data is and how representative it is.
Whereas the approach may be reasonable for busy crossings, or for crossings where there is small to medium variation in usage over a day, it appears more problematic in other situations. For example, station crossings may be extremely busy at peak times, but carrying out a quick census at off-peak times may yield an extremely low count and, therefore, a small day usage estimate, which may seriously underestimate actual overall usage. In addition, where the quick census is applied and only 1 to a few uses are seen, the calculated collective risk for the specific group is going to be extremely sensitive to this count.
Given:
• the ALCRM outputs are very sensitive to the census data, particularly where counts are low;
• the quick census appears to be used in wider circumstances than it was originally developed for; and
• this does not appear to have been revisited for some time, it is recommended that NR carry out a review of this factor (27) and the quick census approach, especially applied to pedestrian crossings and UWCs.

51
8.1.3 Estimated census
The ALCRM user manual[9] states that an estimated census would not be expected for a crossing on a road. It is further emphasised in Operations Manual Procedure 5-23[34] that estimates should only be used for very lightly used crossings and suggests areas to consider to support the estimate. Whereas the guidance looks reasonable, it is imperative that this is fully implemented and as such ORR should ensure that NR take all reasonable steps in supporting the estimate.
For passive crossings, estimates are based on one of the following inputs:
• Once or twice daily – interpreted by the ALCRM as 1 user per day;
• Weekly – interpreted by the ALCRM as 0.143 uses per day;
• Few times a year only – interpreted by the ALCRM as 0.0329 uses per day; or
• No evidence of use – interpreted by the ALCRM as 0.
It would therefore, given the ALCRM’s interpretations of the input options, be inappropriate to use the estimate census where it is anticipated that use will be greater than 1 crossing per day for a specific group. In circumstances where there is more than 1 user for any specific group, a quick or full census should be used.
For protected crossings, the ALCRM still allows use of an estimate, although in this case actual numbers are entered by the user and the user is not restricted to the four categories as above.
8.1.4 Summary
Where there are a large number of users and this is reasonably evenly spread out across the day use of either the full census or quick census is likely to give reasonable results. However, as the numbers of users decrease, or the variability in usage throughout the day increases, the uncertainty in the calculated risk results will grow. It is, therefore, imperative that a thorough sensitivity analysis is carried out on the assumed number of users, particularly where the number of users are small or there is significant variation throughout the day.
It is recommended that ORR make their inspectors aware of the importance of the census data in driving the risk calculations and the potential uncertainty in this area, dependent on the crossing circumstances and number of users (especially where low or where there are significant temporal variations).
8.2 RISK DRIVERS
A major improvement on the Automatic Level Crossing Risk Model has been the inclusion of risk drivers in the output. These flag up particular issues relating to the crossing that are particularly important in terms of influencing risk.
There appears to be nothing fundamentally wrong with the risk driver flags. These are a useful addition to the model. However, the only observations made are related to what determines whether they are output, and whether the name given to them is potentially misleading. The risk drivers are essentially flags that depend on the ALCRM inputs. They do not relate to the underlying risk profile within the ALCRM. For example, if the user stated that a second train “usually” passes the crossing within 20 seconds of the first train and it was “impossible” to see the second train then “Second train” would be flagged in the output. This would be the case even if the underlying frequency data for this event was zero, and therefore the risk was also

52
effectively zero. However, this has the benefit of pushing users of the model to consider important issues outside the model, which may be missed if the underlying risk profile drove the risk drivers.
ORR should be aware of the basis of the risk drivers. Better terminology may be generic risk factors.
8.3 CALIBRATION
An integral part of the ALCRM is the calibration process, as this directly affects the calculated levels of risk. The version of the ALCRM reviewed is generally uncalibrated and the comments raised should be taken in context of this. Some aspects are more calibrated than others, particularly the automatic level crossings. However, the parts of ALCRM in scope of this review are the least calibrated aspects. The calibration process is outlined in Appendix J of the Enhanced Functional Specification[3]; Table J.7 of the Enhanced Functional Specification summarises the calibration activities already undertaken prior to the review which is the subject of this report. Whereas this process looks reasonable, it will be important that application of the process is fully documented by NR. This is an area that ORR should consider revisiting and reviewing once the calibration process is complete.
It is noted that NR have a program in place to fully calibrate the model, the first phase being to collect data for every level crossing so that the population data is accurate.
Table 11 Model limitations where full calibration has not been completed
Crossing Environment
Stott Reference Interpreter CBA Limitation
Y Y Y Y Y The ALCRM is fully calibrated Y Y Y Y N Operational loss and cost-benefit results
should not be used Y Y Y N N Results from the ALCRM can be used with
caution, recognising that the weighting applied by the ALCRM to interpret the contribution of specific risk factors to the overall risk score may not be accurate
Y Y N N N Results from the ALCRM should be used to compare the relative levels of risk between the same types of level crossing only, recognising that comparison of the total FWI / year value between level crossing types within the ALCRM or between the ALCRM and other models may not be accurate.
Y N N N N Results from the ALCRM should not be used
N N N N N Results from the ALCRM should not be used

53
Attention is also drawn to Table J.5 in the Enhanced Functional Specification, which is reproduced in Table 11. Crossing environment, Stott, Reference, Interpreter and CBA are different classes of calibration constants. This clearly states that in its current state, until calibration is complete, the results from the ALCRM should not be used or should be used with caution. This is particularly the case with the passive crossing models. Following any changes to the calibration constants, ranking of crossings will change and decisions already based on the results may not be valid. Thus regular changes to this data could erode confidence in the model for users. NR are aware of these issues and have stated that they try and avoid regular changes and to warn users of changes and the implications. They have also instigated a Change Control Panel to oversee all changes to the model (see Section 8.4). The ALCRM also keeps a copy of the risk assessment results made with the previous set of calibration constants so that users are able to see the effect of such changes on the risk assessment for a specific crossing.
8.4 QUALITY ASSURANCE
In order to manage development of the ALCRM and the calibration data NR have set up a Change Control Panel, which meets every four weeks. This group considers all changes to the model and implications and must agree such changes prior to their implementation. The process, as described by NR, appears to be fit for purpose in terms of managing changes to the ALCRM and its underlying data. It is noted, however, that the process has not been subject to detailed examination as part of this review.

54
9 CONCLUSIONS
Returning to the question posed earlier in this report, is the ALCRM fit for the purpose intended by NR?
In terms of the purpose of the ALCRM, which is explored in Section 3.1, this is difficult to define succinctly. However, based on the documentation reviewed and discussion with NR, the ALCRM is very much intended to form part of an overall process and is planned to be used for a range of different, but related, purposes.
The ALCRM should not be used alone to make decisions, and it would not itself constitute a record of a suitable and sufficient risk assessment as required by the Management of Health and Safety at Work Regulations, 1999[35]. As one input to a wider risk assessment and risk management process the ALCRM has the potential to be a valuable tool. However, like any quantified risk based tool it has the potential to be used inappropriately. It is, therefore, vital that inspectors within ORR fully appreciate at a high level what the model is based on and most importantly its limitations and boundaries, so that they can determine the appropriateness of its use.
An important companion to the ALCRM is the level crossing risk management toolkit (LXRMTK). The ALCRM will provide a user with pointers in terms of where a level crossing sits compared to others, in terms of both collective risk and a measure of individual risk. However, it does not consider all factors that influence risk at a level crossing. Indeed, it would not be appropriate for such a model to do so. The LXRMTK provides a link between the pointers in the ALCRM and the management of risk at level crossings. It identifies a vast array of risk factors across different level crossing types, discusses these and also identifies potential risk mitigation options. This is a vital resource to be used alongside the ALCRM. Use of the ALCRM without the LXRMTK, or something similar, would not be appropriate. Key, however, is creating a suitable record of the thinking that goes into consideration of the risk factors, and potential mitigations.
In terms of a record of a suitable and sufficient risk assessment, outputs from the ALCRM would form a minor part. From discussion with NR, the level crossing risk file appears likely to constitute the record of a suitable and sufficient risk assessment. This would need to be verified by ORR as part of their normal interactions with NR, however.
How the results are used and interpreted is vital, which is something that ORR should consider examining once the model is fully calibrated. The overall individual risk and collective risk rankings only give high level rankings. The detailed results, and most importantly local knowledge should not be neglected.
A number of detailed issues and observations are raised in this report, of which the key ones are summarised below:
• The level of collective risk estimated by the ALCRM is very sensitive to the number of users and to a lesser extent the number of trains. Indeed the sensitivity is such that the crossing feature adjustment factors have little effect on the level of risk. The crossing moment and number of users drive the collective risk estimate;
• The distribution in events for ABCL, FPmwl, STATION and STATIONmwl crossings have been based on other crossings with little basis;

55
• Some of the event frequencies are based on very little data, i.e. 1 or 2 events. These introduce much more uncertainty in the risk estimation. This is the case for CCTV crossings, manually operated crossings and pedestrian events across most crossings;
• Many events have zero frequency assigned, which makes the ALCRM insensitive to some inputs;
• The inclusion and exclusion of events between the different level crossing models is not consistent in all cases. It is noted that the issues are generally associated with events that currently have a zero frequency assigned, however, and have little effect on the estimated level of risk;
• Prior to full calibration, use of the outputs from the ALCRM should be treated with extreme caution, particularly for footpath and station crossings;
• The basis of the crossing feature adjustment factors appears to be mainly down to expert judgement. The basis of this judgement is not clearly documented. However, the ALCRM is not, generally, sensitive to these factors;
• In terms of pedestrian risk at protected level crossings the ALCRM does not model how pedestrian behaviour, the environment or particular level crossings features influence the level of pedestrian risk at a particular crossing. Pedestrian risk appears to be modelled very simplistically and the ALCRM in terms of collective risk is essentially just ranking level crossings based on scaling average risk by number of users and rail traffic. Individual risk is a little more sensitive to the crossing features;
• The ALCRM appears to consider the key risk drivers that influence the risk at UWCs, particularly leaving the gates open and not using the telephone. Also the variation in the crossing feature factors generally appears intuitive. Again there appears to be nothing fundamentally wrong in the approach taken to modelling risk at user worked crossings and the ALCRM appears valid as one input for prioritising effort at reducing risk further at these crossings. Notwithstanding this, a number of comments and discrepancies have been noted at the detailed level, which should be considered by NR. Individually, these issues are likely to be trivial in terms of their effect on the calculated level of risk, but together may be more significant; and
• In terms of station footpath crossings, again there appears to be nothing fundamentally wrong with how the ALCRM calculates the level of risk. However, the model does not consider all key risk factors. Use of the model in isolation would, therefore, not produce a suitable and sufficient risk assessment. Therefore, as stressed in NR procedures, it is imperative that the model is used as part of a wider process.
However, it is stressed that development of the ALCRM is a significant step forward in many respects, for example:
• it is recognised that the model is more sophisticated than models used in many other countries worldwide[36];
• the development of a single model for application across all level crossings aids consistency in the management of risk at level crossings, especially in terms of prioritising effort; and
• hosting the model on NR’s Intranet with all results stored in a single database enables NR to be consistent in its management of risk in this area and provides an excellent source of intelligence on level crossings.

56
Although there appears to be nothing fundamentally wrong with the modelling approach, there are a number of limitations that users need to be aware of, which make the model particularly sensitive to the number of users and number of trains and less sensitive to other local crossing factors. Indeed, if anything, the model is possibly over sophisticated as it takes account of many factors that have little influence on the estimated level of risk.
Notwithstanding some of the limitations and detailed comments, the ALCRM appears fit for the purpose intended by NR, although there a number of improvements that could be made as summarised in the recommendations and as recommended in an earlier review by Sotera[7]. It has to be recognised that the basis of the modelling for the passive crossings is fairly new in comparison to automatic level crossings, and that research is ongoing.
In terms of ORR, it is important that:
• inspectors are under no illusions about the model – it is one tool and is not the whole answer; and
• taken with other parts of NR’s processes, the overall approach has the potential to be fit for purpose.

57
10 RECOMMENDATIONS
The recommendations are brigaded into two groups. One group (Section 10.1) relate to recommendations on improvements to the model. These are recommendations on NR. It is recognised that some of these may eventually fall on RSSB if further research is deemed necessary. The second group (Section 10.2) are recommendations on ORR. In addition to the specific recommendations given below, there are many more detailed comments and observations made throughout the report, which should also be considered.
10.1 RECOMMENDATIONS ON NETWORK RAIL
Recommendations on NR have been prioritised by importance as follows:
• A – short term resolution required. This is an area that potentially could undermine confidence in the model;
• B – medium term resolution required;
• C – longer term resolution or minor issue; and
• D – suggestion for development.
Number Priority Recommendation
1 A The number of generic level crossing models should be reviewed. In
particular, consideration should be made for separating the station crossing models (STATION and STATIONmwl) into separate station crossing and barrow crossing models (both with and without miniature warning lights), thus increasing the number of models from 14 to 16.
2 B The scope of the model should be made clear in all publications describing the model. This is in addition to that contained in the Enhanced Functional Specification, for example in Network Rail’s Operations Manual.
3 C The inclusion and exclusion of events across the different level crossing risk models is not intuitive and consistent in all cases. These should be reviewed by Network Rail taking account of the comments and observations stated throughout the report. The description of each event should also be made clear.
4 D Statistical techniques should be considered to estimate event frequencies for those events currently assigned a zero.
5 D Pedestrian risk modelling at automatic and manual crossings should be developed and made consistent with the approach adopted for vehicle risk and pedestrian risk at passive crossings.
6 C The choice of traffic adjustment factors should be reviewed to ensure the factors applied to each event are intuitive in all cases. The detailed comments raised throughout the report should be considered as part of this review.

58
Number Priority Recommendation
7 C The consequences assumed for staff shock should be made consistent with latest RSSB advice.
8 C Inputs to the ALCRM that influence risk estimates should be made more explicit to ALCRM users.
9 B Specific incident data should be collected for the station events as use of the event profiles from footpath crossings and user worked crossings with MWLs appears to have little basis.
10 C The comments raised throughout the report relating to the crossing feature adjustment factors should be addressed.
11 B Given that the ALCRM outputs are very sensitive to the census data, particularly where counts are low, the quick census appears to be used in wider circumstances than it was originally developed for and this does not appear to have been revisited for some time it is recommended that a review is carried out of the quick census approach, especially applied to pedestrian crossings and UWCs.
10.2 RECOMMENDATIONS ON ORR
Number Recommendation 12
ORR should examine the adequacy of NR’s level crossing files to support a suitable and sufficient risk assessment.
13 The level crossing risk files appear to be an integral part of the risk assessment of a level crossing. It is, therefore, recommended that instead of requesting a risk assessment, ORR Inspectors should request the relevant level crossing file from the duty holder/NR.
14 ORR should take this report as the basis for briefing inspectors on what the ALCRM is, its boundaries and limitations. In particular, ORR should ensure that relevant inspectors understand the scope of the model, particularly those areas not included.
15 In order to use the ALCRM outputs to prioritise where to spend effort on reducing risk it is important that all outputs are used; this includes individual risk ranking, collective risk ranking and the detailed risk outputs. These should be utilised along with other intelligence, for example near misses, incidents and judgement and experience of NR staff. It is important that ORR are satisfied that such a balanced approach is taken. Using just one measure of risk, just the rankings or indeed just the ALCRM output would not be appropriate.
16 It is recommended that ORR make their inspectors aware as to the importance of the census data in driving the risk estimates and the potential uncertainty in this area, dependent on the crossing circumstances and number of users (especially where low).

59
11 APPENDICES
11.1 APPENDIX A GENERIC LEVEL CROSSINGS IN ALCRM
Tables 12 to 14 below are taken from the ALCRM functional specification[2] and ALCRM User Guide[9]. They show how the various crossing types on NR controlled infrastructure map to the 14 generic crossings modelled by the ALCRM.
Table 12 Passive crossings
Generic ALCRM crossing
Crossing Type
FPW Footpath with wicket gates
FPG Footpath with bridleway gates
FPX Footpath fenced off
FPK Footpath with kissing gates
FPO Footpath with undetermined entrance facility
FPS Footpath with stiles
FPT Footpath with turnstiles
FP
FPV Footpath with vehicular gates
OC OC Open crossing not equipped with road traffic light signals
SBC Station barrow crossing
SPC Station passenger crossing STATION
STAF Unprotected staff walking route
UWB Vehicular and bridleway gates
UWC Vehicular gates only
UWCB Vehicular lifting barriers
UWK Vehicular and kissing gates
UWS Vehicular gates and stiles
UWW Vehicular and wicket gates
UWC
UWO Vehicular with undetermined entrance facility
UWCt UWCt Vehicle gates only with telephones

60
Table 13 Psudo protected crossings16
Modelled in ALCRM As Crossing Type
FPOM Footpath crossing with miniature warning lights
FPGM Footpath with bridleway gates and miniature warning lights FPmwl
FPWM Footpath with wicket gates and miniature warning lights
MBWM Manual barrier with wicket gates and miniature warning lights
MSL Miniature stop lights
MWLB Miniature warning lights: barriers
MWLF Miniature warning lights: bridleway gates
MWLG Miniature warning lights: gates
MWLO Miniature warning lights: open
MWLW Miniature warning lights: wicket gates
UWBM Vehicular with bridleway gates and miniature warning lights
UWCM Vehicular with miniature warning lights
UWCMSL Vehicle gates only with miniature stop lights
UWCmwl
UWWM Vehicular with wicket gates and miniature warning lights
SBWL Station barrow crossing with white lights
SIND White lights provided at station crossing
SMWL Station barrow crossing with white lights
SBCMSL Station Crossing with Miniature Stop Lights
SWL Staff crossing with non-SP42 white lights
STATIONmwl
WIND White lights at staff walking route
16 RSGP part 2 section E on page 5 says that MWL crossings can be referred to as Protected Crossings

61
Table 14 Protected crossings
Modelled in ALCRM As Crossing Type
ABCL Automatic half barrier crossing (locally monitored) ABCL
ABCL-X Automatic half barrier crossing (locally monitored) equipped for wrong direction movements
AHB Automatic half barrier crossing AHB
AHB-X Automatic half barrier crossing equipped for wrong direction movements
AOCL Automatic open crossing (locally monitored)
AOCL-X Automatic open crossing (locally monitored) equipped for wrong direction movements
AOCR Automatic open crossing (remotely monitored) AOCL
MCO Open crossing manually operated
MCBcctv CCTV Manually controlled barriers worked remotely with the aid of closed circuit television
MBW Mechanically worked lifting barriers operated by gate wheel under manual control
MCB/MB Manually controlled barriers worked from adjacent cabin or signal box
MCBR Manually controlled barriers worked remotely without CCTV
WB Manually controlled pedestrian barriers
TMOB Trainman operated barriers
MCB
TOB Trainman operated electrically powered barriers
MG Manned Gates
MGB Electrically worked boom gates (manual)
MGH Hand-worked manually operated gates
MGL Lever operated manual gates (oil vane)
MGW Wheel-worked manually operated gates
WG Electrically locked wicket gates
TMOG Trainman operated gates
MCG
TOG Trainman operated manual gates

62
11.2 APPENDIX B THE ALCRM MODELLING APPROACH
The ALCRM consists of 14 models, each representing a generic level crossing type. Mapping between level crossings types and the generic level crossings within the ALCRM is illustrated in Appendix A. Each level crossing model estimates the level of risk from the following three accident scenarios:
• collision between a train and a user;
• collision between a user and level crossing equipment; and
• other, which includes slips, trips and falls and injuries through using the gate for example.
Each of these accident scenarios is modelled using a simple fault tree as illustrated in Figure 1; this example is for the collision between a train and a user scenario for the STATION level crossing model[2]. The base events in this fault tree include the following:
• FailsToSLL – pedestrian hit by train as a results of failing to stop look and listen;
• Sighting – pedestrian hit by train due to inadequate sighting distance;
• Unaware – pedestrian hit by train due to being unaware of crossing;
• Unknown – pedestrian hit by train due to unknown cause;
• Second – pedestrian hit by train due to being caught out by a second train;
• Nip – pedestrian hit by train due to nipping in front of train; and
• Falls – pedestrian hit by train due to falling on crossing.
Each of these base events are assigned a frequency in the model. This frequency is the number of times that the event has occurred per year across all level crossings of the specific type. In this case there are assumed to be 180 STATION crossings[2]. Therefore a frequency of, for example, 0.5 collisions per year17 assigned to the fails to stop look and listen event (FailsToSLL) means that historically there have been on average 0.5 train-pedestrian collisions per year as a result of pedestrians failing to stop look and listen across the 180 STATION crossings and on average 2.8x10⁻³ (0.5/180) collisions per year at each STATION level crossing. The data assigned to each event is predominantly based on analysis of the railway industry’s Safety Management Information System (SMIS) and HSE data.
The ALCRM takes this base average incident frequency and modifies it to reflect the local situation. Two adjustments are made to the base frequency to account for:
• crossing features; and
• traffic flow.
Essentially each base event frequency is multiplied by two factors that increase or decrease the original average frequency. Therefore, for a crossing where a pedestrian is more likely to fail to stop, look and listen the crossing features factor would be greater than 1. A different factor is applied to each of the base events considered. The inputs to the model determine the magnitude of these factors.
17 The 0.5 is used for illustrative purposes only.

63
Figure 1 Fault tree for collision with pedestrian scenario for STATION crossings
As an example, consider the fails to stop, look and listen event (FailsToSLL) in the fault tree shown in Figure 1.
The crossing feature adjustment factor in this case is calculated based on the average of three factors:
• frequency of trains – factor is 3 for 45 trains per day or less, 0.3 for greater than 50 trains per day, and 1 for frequencies in between (greater than 45 and up to 50 trains per day);
• speed of trains – factor is 3 for average train speeds less than 40 mph, 0.3 for average train speeds of 50 mph or greater, and 0.3 for speeds in between (40 mph up to less than 50 mph); and
• the crossing traverse time compared with train sighting time – factor is 3 if the spare time (difference of pedestrian sighting time and crossing time) is greater than 20 s, 1 if the spare time is greater than 5 s else 0.3 for lower durations.
Overall the crossing feature adjustment factor is going to be between 0.3 and 3 depending on the following inputs to the model: train frequencies, train speeds, sighting distances and user crossing time. The base event frequency FailsToSLL could, therefore, be up to 3 times higher or lower at a specific crossing depending on these inputs. For this cause, the model is saying that the risk of failing to stop, look and listen (deliberate abuse) is greatest where the trains are of low frequency, low speed or whether there is greatest sighting time Such an approach is taken with each base event in the underlying fault trees. In many cases it is noted that no modification factor is assumed and for these cases all level crossings are assumed to have the same event frequency as the average situation.
Train-user collision
Falls
FailsToSLL
Sighting
Unaware
Unknown
Second
Nip

64
Following modification by the crossing feature adjustment factor, the traffic modification factor is applied. This takes account of the frequency of trains and frequency of use, crossing traverses, at the level crossing being assessed compared to the average frequency for crossings of that type. For events that lead to a collision between users and a train generally18 the factor is the relative traffic moment, and for the other two scenarios the factor is the relative number of crossing traverses per day. The relative traffic moment is the traffic moment (number of trains per day multiplied by number of user traverses per day) at the crossing being assessed divided by the average traffic moment across all level crossing of that type. In the case of the STATION level crossing, the ALCRM currently assumes an average moment of 61 pedestrian.trains day-2. Therefore if a crossing is assessed as having 10 pedestrian traverses per day and 12 trains per day pass the crossing, this would give a traffic moment of 120 pedestrian.trains day-2, and a traffic adjustment factor of 2 (120/61). Relevant base event frequencies would be increased by this factor, in this example 2. Essentially the model is scaling the frequency of train-user collisions by both the frequency of use and the frequency of trains compared to the average. The relative number of crossings per day is simply the number of crossing traverses at the crossing being assessed divided by the average traverses across all level crossing of that type. Once each base event has been multiplied by the relevant crossing feature modification factor and the relevant traffic adjustment factor, it is then divided by the number of level crossings of the type being assessed. This then gives the frequency of accidents for the causes being considered predicted for the specific level crossing being assessed. The frequencies can be combined (by summation) for a given accident scenario to give the frequency of the accident scenario, train-user collision, user equipment collision or other, for that level crossing. Following calculation of the accident frequency for a given level crossing, next the model considers the consequences. Risk is estimated for the following groups:
• car occupants;
• van / small lorry occupants;
• HGV occupants;
• bus occupants;
• tractor or farm vehicle occupants;
• cyclists or motorcyclists;
• pedestrians;
• passengers; and
• staff.
Therefore, the model estimates consequences for each of these groups. It treats consequences for car and van occupants as the same, HGV, bus and tractor occupants the same, and pedestrians and cyclists the same. Passengers and staff are treated separately. Most of their risk comes from the possibility of derailment, which the ALCRM models in some detail. However, as the contribution to the overall collective risk from staff or passengers is generally small it is
18 For passive crossings this is true. However, with active crossings for vehicle train collisions a more complicated factor is used. This accounts for the Stott effect[4].

65
not considered here, and the reader is directed to the ALCRM functional specification[2] and history document[6] for a description.
In terms of train-user collisions:
• for vehicle occupants the consequences (in terms of FWIs) per collision is assumed to vary as a function of train speed (proportional); and
• for pedestrians and cyclists there is assumed to be 0.812 FWIs per collision.
In terms of user-equipment collisions:
• for vehicle occupants there is assumed to be 0 FWIs per collision; and
• for pedestrians and cyclists there is assumed to be 0.016 FWIs per collision.
In terms of other scenarios:
• for vehicle occupants there is assumed to be 0 FWIs per event; and
• for pedestrians and cyclists there is assumed to be 0.022 FWIs per event.
Collective risk is then calculated for each of the groups considered by multiplying the frequency of events to that group by the relevant consequence.
Taking the STATION crossing example, collective risk of pedestrians would be calculated as follows:
• considering one accident scenario at a time;
• firstly for the train-user collision scenario each base event adjusted frequency (discussed above) would be summed to give the overall frequency of pedestrian-train collisions;
• as the overall frequency is for collisions between trains and both pedestrians and cyclists, this frequency is split in the ratio of pedestrian to cyclist traverses to give the pedestrian-train collision frequency and the cyclist-train collision frequency;
• combining the specific user-collision frequency with the relevant consequence from above gives the collective risk of that group of users colliding with trains; and
• once completed for each accident scenario the overall collective risk for a given group of users is calculated by summing across the three accident scenarios.
For a crossing with pedestrian and vehicle users, as events have been separated between pedestrians users and vehicle users in the underlying fault tree, the summation would be across those events relating to either vehicles or pedestrians. A specific vehicle collision frequency would be calculated in the same way as for pedestrians and cyclists, but in this case the overall frequency would be split between 5 groups by the ratio of their crossing traverses: cars, vans, HGVs, buses and farm vehicles.

66
11.3 APPENDIX C RISK FACTORS FOR STATION CROSSINGS
Table 15 below presents the risk factors identified in Reference 28 as part of reviewing the risk assessments in place at the time of the Elsenham incident.
Table 15 Risk factors
Risk Factor Comment Nip across and misuse User crosses in front of approaching train but misjudges time. Arrival time At station crossings, users are more likely to arrive at the crossing within a
short time of a train arriving in comparison to footpath crossings. At station crossings many people will know the train departure time and so will arrive shortly before hand, hence the distribution of the utilisation is much closer to the time when a train is due at the crossing thus increasing the likelihood of users being at or on the crossing when a train is approaching.
Disregard - user fails to acknowledge risk of crossing
The case of Hendrie v Calendonian Railway Company places the onus on the user to determine that it is safe to cross. RSPG 2E 138 states “Users are expected to use reasonable vigilance to satisfy themselves that no trains are approaching the crossing before they start to cross the line”.
Second train comes User waits for train to pass but is caught by second train from opposite direction.
Frequency of trains Crossings with a low frequency of trains are likely to increase the risk taking behaviour of regular users.
Regularity of trains Variations in train schedules, such as engineering works, unexpected delays to train services, and line speed restrictions etc., all contribute to fluctuations in trains passing a point at a supposedly ‘known’ time.
Group usage People in groups may undertake more risky behaviour, than when on their own.
Position of warning lights The effectiveness of warning lights is influenced by their position. Usage times According to the research quoted in this report (including Ref. 12), risk
taking at level crossings increases during rush hours, at midday and at the beginning and end of the school day.
Low train speeds Low train speeds may increase the risk taking behaviour of users. Unseen train User caught out by negative sighting time (caused by failure of horn to be
sounded and limited sighting distance). User perception of train speed and distance
Train speed and distance is underestimated by users, which may result in increased decision making errors by users at level crossings.
Foliage The effectiveness of information on the approach to and at the level crossing is reduced by overgrown foliage.
Trespass on rail structures Rail structures located at the entrance and exit areas to crossings that appear suitable for climbing may result in undesirable risk taking behaviour by members of the public.
Sighting distance Good sighting distance should indicate the level crossing as high risk. Position of safety Insufficient space between trackside gate and rail results in potential
obstruction of track by bicycles and pushchairs. Crossing utilisation Level crossings with high crossing utilisation increase the risks to users. Type of trains Train lines with high frequency of both freight and passenger services may
influence the risk taking behaviour of users.

67
Risk Factor Comment Crossing surface Uneven and slippery level crossing surface may present a potential hazard
to those using the crossing. Housing developments Housing developments increase road traffic and level crossing use. Animals:dogs Unrestrained dogs may impair their owners concentration while on the level
crossing. Number of train lines Single train lines may increase the risk taking behaviour of both vehicle
drivers and pedestrians. Decision point An obvious decision point is critical for users at unprotected level crossings. Trespassers Food and drink rubbish at a level crossing is often an indicator of young
people using the crossing as a meeting place. Noise Noisy surroundings may impair the ability of the users to detect trains at
level crossings. Proximity to public houses Crossings located on route to public houses may result in increased
violations of crossing procedures. Sightlines Restricted or blocked sightlines may encourage users to move past a point
of safety. Familiarity with crossing Regular users and those living close to level crossings are more likely to
undertake risk-taking behaviour when using the crossing. Open gates Open gates increase the risk to approaching users.

68
11.4 APPENDIX D ALCRM RISK RANKING CATEGORIES
Table 16 Collective risk categories
Risk category Lower risk FWIs/year
Upper risk FWIs/year
1 5E-2 ∞ 2 1E-2 5E-2 3 5E-3 1E-2 4 1E-3 5E-3 5 5E-4 1E-3 6 1E-4 5E-4 7 5E-5 1E-4 8 1E-5 5E-5 9 5E-6 1E-5 10 1E-6 5E-6 11 5E-7 1E-6 12 >0 5E-7 13 0 0
Table 17 Individual risk categories
Risk category Lower risk fatalities/year
Upper risk fatalities/year
A 1E-3 1 B 2E-4 1E-3 C 4E-5 2E-4 D 8E-6 4E-5 E 4E-6 8E-6 F 2E-6 4E-6 G 1E-6 2E-6 H 5E-7 1E-6 I 2.5E-7 5E-7 J 1E-7 2.5E-7 K 5E-8 1E-7 L >0 5E-8 M 0 0

69
12 REFERENCES
1 Office of Rail Regulation, January 2005 Railway Safety Principles and Guidance, part 2 section E, Guidance on level crossings www.rail-reg.gov.uk/upload/pdf/rspg-2e-levxngs.pdf, accessed 2 June 08.
2 Arthur D Little, v2.5, January 2006 Level Crossing Risk Model – To Assess Risks at all Crossing Types, Functional
Specification 20419/014rep 3 Arthur D Little, v1.0, April 08 All Level Crossing Risk Model – an Enhanced Specification 21477/010rep 4 Stott, P.F., Department of Transport, 1987 Automatic Open Crossings – a review of safety 5 Rail Safety & Standards Board, June 2005 Formal Inquiry Final Report: Ufton Level Crossing, Passenger Train Collision with a
Road Vehicle and Subsequent Derailment on 6 November 2004 www.rssb.co.uk/pdf/reports/Ufton%20Level%20Crossing%20Formal%20Inquiry%20-
%20Final%20Report.pdf, accessed on 2 June 2008. 6 Arthur D Little, October 2007 Development of the All Level Crossing Risk Model, A History, 1993-2007 www.rssb.co.uk/pdf/reports/research/T737_history_final.pdf, accessed 2 June 2008.
7 Sotera Risk Solutions Ltd, October 2006 Independent review of the All Level Crossing Risk Model J1093/Doc001, Issue 2. 8 Rail Safety & Standards Board, May 2006 Formal inquiry into the Elsenham accident that occurred on 3 December 2005. FI3669/F, www.rssb.co.uk/pdf/reports/Elsenham-report.pdf, accessed 2 June 2008.
9 Network Rail, Issue 1, March 2008 All Level Crossing Risk Model (ALCRM) User Guide. 10 Rail Safety & Standards Board, July 2007 Research brief, Design and implementation of the all level crossings risk model T028, www.rssb.co.uk/pdf/reports/research/T028_rb_final.pdf, accessed 2 June 2008. 11 Network Rail, Issue 1, December 2006 Specification: Provision, Risk Assessment and Review of Level Crossings NR/SP/OPS/100.
12 Network Rail, Issue 3, June 2008 Operations Manual Procedure 5-24, Use of the All Level Crossing Risk Model
(ALCRM)

70
13 Network Rail, Issue 2, June 2008 Operations Manual Procedure 5-25, Determining the Reasonable Practicability of Level Crossing Risk Reduction and Mitigation Measures
14 Rail Safety & Standards Board, September 2006 Level Crossing Risk Management Toolkit www.lxrmtk.com, accessed 2 June 2008. 15 Rail Safety & Standards Board T335: Improving road user and pedestrian behaviour at level crossings rssb.co.uk/research/allsearch.asp, accessed 2 June 2008. 16 Rail Safety & Standards Board T730: Understanding human factors and developing risk reduction solutions for
pedestrian crossings at railway stations rssb.co.uk/research/allsearch.asp, accessed 2 June 2008.
17 Network Rail, v1.3 All Level Crossing Risk Model User Training Course MS Powerpoint slides. 18 Network Rail, v12, January 2008 All Level Crossing Risk Model (ALCRM) Appreciation Briefing for HMRI MS Powerpoint slides. 19 Rail Safety & Standards Board, June 2004 A statistical review of the RSSB Safety Risk Model (WP2) www.rssb.co.uk/pdf/reports/research/A%20statistical%20review%20of%20the%20RSS
B%20Safety%20Risk%20Model%20(WP2).pdf, accessed on 2 June 2008. 20 Rail Accident Investigation Branch, December 2006 Rail Accident Report, Investigation into station pedestrian crossings (including
pedestrian gates at highway level crossings), with reference to the fatal accident at Elsenham station on 3 December 2005, Report 23/2006
www.raib.gov.uk/cms_resources/061211_%20R232006_%20Elsenham.pdf, accessed 2 June 2008.
21 Rail Safety & Standards Board, August 2006 Profile of safety risk on the GB mainline railway Issue 5 SP-RSK-3.1.3.11/Issue 5/August 2006 22 Rail Safety & Standards Board, May 2008 Risk Profile Bulletin Version 5.5 23 Rail Safety & Standards Board, February 2008 Proposals for the weighting of major and minor injuries www.rssb.co.uk/pdf/reports/research/T440_WeightingProposals.pdf, accessed on 2
June 2008. 24 Arthur D Little, September 2002 User Worked and Footpath Level Crossings: Risk Review, RT/70988/14rep.doc,
www.rssb.co.uk/pdf/reports/research/User%20Worked%20and%20Footpath%20Level%20Crossing%20Research.pdf, accessed on 2 June 2008.

71
25 Arthur D Little, October 2005 Station and Barrow Crossings Review of Risk Management
www.rssb.co.uk/pdf/reports/research/T332%20Risks%20at%20station%20and%20barrow%20crossings.pdf, accessed on 2 June 2008.
26 Rail Safety & Standards Board, February 2007 Evaluating the safety benefits from miniature warning lights at user worked crossings www.rssb.co.uk/pdf/reports/research/T561%20rpt_final.pdf, accessed on 2 June 2008. 27 Human Engineering for Rail Safety & Standards Board, June 2004 T269: Human factors risk at user worked crossings rssb.co.uk/research/allsearch.asp, accessed 2 June 2008. 28 Health & Safety Laboratory, November 2006 Review of Risk Assessments relating to the Elsenham Station Footpath Crossing RAS/06/08 29 Davis Associates, December 2005 Level crossings: Summary of findings and key human factors issues RR359, www.hse.gov.uk/research/rrhtm/rr359.htm, accessed on 2 June 2008. 30 Railway Group Standard (withdrawn), Issue 1, October 2002 Provision, Risk Assessment and Review of Level Crossings GI/RT7011, www.rgsonline.co.uk/docushare/dsweb/Get/Rail-42193/GIRT7011.pdf,
accessed on 2 June 2008. 31 Railway Group Guidance Note (withdrawn), Issue 1, October 2002 Guidance on Provision, Risk Assessment and Review of Level Crossings GI/GN7611, www.rgsonline.co.uk/docushare/dsweb/Get/Rail-42251/GIGN7611.pdf,
accessed on 2 June 2008. 32 Rail Accident Investigation Branch, July 2006 Rail Accident Report, The fatality at Barratt’s Lane No.1 footpath crossing, 21
November 2005, Report 13/2006 www.raib.gov.uk/cms_resources/210706_R132006_BarrattsLane.PDF, accessed 2 June
2008. 33 Rail Accident Investigation Branch, June 2006 Rail Accident Report, Serious injury to a cyclist at Scate Moor bridleway crossing, 8
January 2006, Report 06/2006 www.raib.gov.uk/cms_resources/060108_R062006_ScateMoor.pdf, accessed 2 June
2008.
34 Network Rail, Issue 1, December 2006 Operations Manual Procedure 5-23, Level Crossing Risk Assessment – Site Visits &
Censuses 35 HSC, 2000 Management of Health and Safety at Work Regulations 1999, Approved Code of
Practice and Guidance HSE L21, ISBN 0 7176 2488 9.

72
36 Arthur D Little, March 2007 Use of Risk Models and Risk Assessments for Level Crossings by Other Railways,
Reference 21138 www.rssb.co.uk/pdf/reports/research/T524_rpt_final.pdf, accessed on 2 June 2008. 37 Rail Safety & Standards Board, December 2006 T668 Research into the safety benefits provided by train horns at level crossings www.rssb.co.uk/pdf/reports/research/T668_rpt_final.pdf, accessed on 2 June 2008. 38 Rail Safety & Standards Board T334: Reducing the risk to motorists traversing user worked crossings on foot rssb.co.uk/research/allsearch.asp, accessed 2 June 2008.

73
13 ACRONYMS AND GLOSSARY
13.1 ACRONYMS
ABCL Automatic barrier crossing locally monitored
ADL Arthur D Little
AHB Automatic half barrier level crossing
AOCL Automatic open crossing locally monitored
ALARP As low as reasonably practicable
ALCRM All Level Crossing Risk Model
CCTV Closed circuit television level crossing
FP Footpath level crossing
FPmwl Footpath level crossing with miniature warning lights
FWI Fatalities and weighted injuries
HGV Heavy goods vehicle
HSE Health and Safety Executive
HSL Health & Safety Laboratory
LCRCC Level Crossing Risk Control Coordinator
LXRMTK Level Crossing Risk Management Toolkit
MCB Manual barrier crossing
MCG Manual gated crossing
MWL Miniature warning light
NR Network Rail
OC Open crossing
ORR Office of Rail Regulation
SMIS Safety Management Information System
RSPG Railway safety, principles and guidance
RSSB Rail Safety & Standards Board
SFC Station footpath crossing

74
SRM Safety Risk Model
STATION Station crossing
STATIONmwl Station crossing with miniature warning lights
UWC User worked crossing
UWCmwl User worked crossing with miniature warning lights
UWCt User worked crossing with telephones
13.2 GLOSSARY OF LEVEL CROSSING BASE EVENTS
Barrier User is hit by a barrier
Block User has stopped in traffic on the crossing when crossing activates (also known as blocking back)
Brake User brakes too late to stop before the crossing (includes driver misjudgment, ice, mud etc.)
Climbs User climbs the barrier whilst it is in the closed position
Dazzle User unable to see the crossing because of low sun/other cars’ headlights
FailsToSLL User crosses without stopping, looking and listening
Falls User falls on crossing deck
Foul User (in a vehicle) has stopped foul of a crossing
Gates User is injured in operating gates/barrier
GatesLO User continues directly onto the crossing because the user worked gates/barriers have been left open
Grounded Vehicle has become grounded on the crossing
IgnoresRL User ignored the red light warning (MWL crossings)
Nip User ‘nips’ across because they think they have sufficient time to cross
Phone User failed to phone the signalman (when required)
Redlight User ignored the red light warnings (AHB/ABCL/AOCL crossings)
RTA User involved in a road traffic accident at/near the crossing
Second User unaware of a second train approaching (having seen the first train pass)
Sighting User caught unaware by poor sighting distances
Train Train not expected at level crossing

75
Trapped User is trapped on crossing between barriers/gates
Turns User turns onto track thinking it is a road junction
Unaware User is unaware of the crossing
Unknown Insufficient information to determine the event leading up to the accident
Visibility General poor visibility due to weather e.g. rain, fog
Walks User walks around the protecting barriers
ZigZag User zigzags around the protecting barriers


