
Program & Abstracts 10th Annual Meeting of the Danish Society of
Biomechanics
Editor: Ernst Albin Hansen
05-10-2018

1
WELCOME & VENUE
Dear Colleagues
On behalf of the board of the Danish Society of Biomechanics, Team Danmark, as well as the
Organising Committee, we invite you to the 10th annual meeting on October 5, 2018 in Brøndby,
The House of Sport, Brøndby Stadion 20, 2605 Brøndby. Meeting room: Gunnar Nu.
This year’s annual meeting is arranged in collaboration with the Danish elite sport institution Team
Danmark. Team Denmark acknowledge that sports biomechanics have received inadequate
attention in the quest for medals. Thus, the program around mid-day will focus on sports
biomechanics and the way biomechanics interacts with other disciplines to produce performance
improvements. Team Danmark has invited Catherine Shin, a sport biomechanist from the English
Institute of Sport (EIS), who will be keynote speaker and participate in a subsequent panel
discussion focusing on the use of biomechanics in Danish elite sports. The overall purpose is
therefore to enlighten Team Danmark, the Danish National Coaches and Sport Directors in the
perspectives of sports biomechanics in the quest for medals but also to encourage and motivate the
Danish scientist and students in the area of biomechanics to do research in the applied area of sports
biomechanics.
Looking forward to be seeing you in The House of Sport
On behalf of the organizers
Thue Kvorning
Team Danmark

2
MEETING INFORMATION
Keynote lecture
The EIS supports 38 Olympic and Paralympic sports in science, medicine, technology and
engineering. The biomechanics team is one of 12 disciplines which all work to support Olympic and
Paralympic success. As an applied biomechanics discipline, all athletes are treated as individuals.
While much academic literature and teaching is based on finding an optimal movement pattern,
once we reach these levels of performance, we are looking for smaller nuances of technique which
are specific to a single athlete, to find possible performance gains or interventions to mitigate
against injury risk. For our team, one of the most important factors is the ability to measure and
understand performance in the athletes’ training or competition environment. This can be very
challenging, especially in water or ice-based sports however new technologies, such as wearable
motion capture, allow us to move closer to this goal. We work closely with the performance
innovation team to investigate whether athletes have the optimal equipment set-up to optimise
performance, or consult on skill acquisition by evaluating learning environments. We also work
closely with other disciplines, such as strength and conditioning coaches and physiotherapists. Here
we can use the insight gained from biomechanics testing to inform training programmes, monitor
longitudinal change and tailor training to individuals.
Catherine Shin
English Institute of Sport (EIS)

3
Steno Speaker
The Steno lecture 2018 will be given by Professor Marius Henriksen.
Nedestående er Steno-udvalgets vurdering:
Professor Marius Henriksen (MH) har en stærk faglig, biomekanisk profil med indsigt i metoder til
at studere den funktionelle anatomi i såvel det raske, som det syge menneske. MH har inden for sin
forskning fokuseret på patienter med knæ artrose samt smertelindring relateret til denne lidelse, og i
de senere år er god klinisk praksis blevet et centralt udgangspunkt for MHs professionelle virke.
MH har stor erfaring og succes inden for undervisning, forskningsformidling, forskningsledelse og
fundraising især nationalt, men også internationalt. Desuden har MH en lang ekspertbedømt
publikationsliste (jf. SCOPUS d.d. 90 publikationer H-index: 22). Et af de største fingeraftryk MH
p.t. har sat på dansk biomekanik er dannelsen af Dansk Biomekanisk Selskab (DBS). Selskabet blev
stiftet år 2009 på grundlag af et ambitiøst forarbejde alene drevet af Marius Henriksen. MH besad
selv formandsposten 2009 – 2014, og i denne periode blev DBS konsolideret og årsmøderne blev
det centrale omdrejningspunkt. Desuden blev DBS affilieret med International Society of
Biomechanics (ISB).
Komiteen tilslutter sig følgende karakteristik af MH som blev givet i indstillingen:
’Marius Henriksen har haft, og har fortsat en signifikant indflydelse på dansk biomekanik. Han er et
kreativt og generøst menneske, som villigt deler sin viden og sine ideer. Han er på én og samme tid
visionær og pragmatisk, men også rastløs og uimponeret - altid på vej mod nye mål og horisonter.
Marius har en gadedrengs mod til at udfordre det gængse - bryde med vanetænkningen og sætte nye
retninger. Derfor indstilles Marius Henriksen til at modtage Stenoprisen 2018.’
Dansk Biomekanisk Selskab (DBS)
Komiteen for årets Stenopris 2018
v. Prof. Karen Søgaard, Prof. Pascal Madeleine og Prof. Michael Voigt (Formand)

4
Organizing Committee
Thue Kvorning, Sportsfysiolog, Team Danmark
DBS Board
Scientific Committee
Tine Alkjær, Associate Professor, DBS Board Member
Ernst Albin Hansen, Associate Professor, DBS Board Member
Anders Holsgaard Larsen, Associate Professor, DBS President
Maj Halling Thomsen, Dyrlæge, DBS Board Member

5
PROGRAM OVERVIEW
10th Annual Meeting of the Danish Society of Biomechanics
8:30-
9:00
Registration, poster mounting, and coffee
9:00-
9:10
Welcome
9:10-
10:10
Steno lecture
10:10-
11:00
Podium presentations (DBS student award)
11:00-
11:15
Coffee break
11:15-
12:00
Keynote lecture
12.00-
13:00
Lunch (and General assembly for
members)
13:00-
14:00
Panel discussion on the perspectives of sports biomechanics in the quest for medals
14:00-
15:00
Podium presentations
15:00-
16:00
Posters and coffee
16:00-
16:10
DBS Student Award ceremony
16:10-
16:20
Official closing of the meeting
16:20- Refreshments and networking

6
PROGRAM DETAILED
________________________________________________________________________________
8:30-9:00 REGISTRATION, POSTER MOUNTING, AND COFFEE
________________________________________________________________________________
9:00-9:10 WELCOME
By Thue Kvorning
________________________________________________________________________________
9:10-10:10 STENO LECTURE
Myth busting in clinical biomechanics
By Marius Henriksen
Chair: Tine Alkjær _______________________________________________________________________________________
10:10-11:00 PODIUM PRESENTATIONS (DBS STUDENT AWARD)
10:10-10:22 ESTIMATION OF SPINAL LOADING DURING MANUAL MATERIALS
HANDLING USING ONLY INERTIAL MOTION CAPTURE AND PREDICTED
GROUND REACTION FORCES - A VALIDATION STUDY
FG Larsen, FP Svenningsen, MS Andersen, M de Zee, S Skals
10:22-10:34 SCAPULAR MUSCLE ACTIVITY IN HEALTHY INDIVIDUALS DURING
SERRATUS PUNCH EXERCISES
SK Magnúsdóttir, T Alkjær, M Henriksen, R Høffner, A Cools
10:34-10:46 THE EFFECT OF NORDIC HAMSTRING EXERCISE AS PREVENTION OF
HAMSTRING STRAIN INJURY IN PHYSICALLY ACTIVE - A SYSTEMATIC
REVIEW
E Ringtved, M Schuster, M Banck-Petersen, K Nørgaard, H Koblauch
10:46-10:58 EFFECT OF EXPERIMENTAL TIBIALIS POSTERIOR MUSCLE PAIN ON
MUSCLE RECRUITMENT: A PARAMETRIC STUDY
MB Simonsen, A Yurtsever, K Næsborg-Andersen, PDC Leutscher, K Hørslev-
Petersen, RP Hirata, MS Andersen
Chair: Maj Halling Thomsen
________________________________________________________________________________
11:00-11:15 COFFEE BREAK
________________________________________________________________________________
11:15-12:00 KEYNOTE LECTURE

7
Biomechanics as part of the multidisciplinary team at the EIS
By Catherine Shin
Chair: Thue Kvorning
_______________________________________________________________________________
12:00-13:00 LUNCH _______________________________________________________________________________________
12:00-13:00 GENERAL ASSEMBLY (for DBS members)
_______________________________________________________________________________
13:00-14:00 PANEL DISCUSSION ON THE PRESPECTIVES OF SPORTS
BIOMECHANICS IN THE QUEST FOR MEDALS
Chair: Thue Kvorning _______________________________________________________________________________________
14:00-15:00 PODIUM PRESENTATIONS
14:00-14:15 HOW DIFFERENT IS THE NEW BADMINTON SERVE?
J Rasmussen, M de Zee
14:15-14:30 IDENTIFICATION OF HAND EXERCISES USING WEARABLE SURFACE
ELECTROMYOGRAPHY
JL Isaksen, JK Kanters, T Alkjær
14:30-14:45 THE INFLUENCE OF ADDED COGNITIVE LOAD ON THE TRANSITION
BETWEEN WALKING AND RUNNING
MK Hyttel, LS Jakobsen, MK Jensen, H Balle, EA Hansen, M Voigt
14:45-15:00 VARIABILITY OF FOOT STRIKE CHARACTERISTICS IN RUNNERS WITH
DIFFERENT SELF-REPORTED RUNNING RELATED INJURIES
PC Raffalt, M Neutzner, T Neitmann, AN Agres, GN Duda
Chair: Ernst Albin Hansen
_______________________________________________________________________________
15:00-16:00 POSTERS AND COFFEE
MAPPING THE LOAD INTENSITY OF JUMPING EXERCISES IN POST-MENUPAUSAL
FEMALES: IMPLICATIONS FOR OSTEOGENIC TRAINING
T Alkjaer, KB Smale, LH Hansen, JK Kristensen, MK Zebis, C Andersen, DL Benoit, EW Helge
HABITUAL LOADING LEADS TENDON HYPERTROPHY IN THE ELDERLY AND YOUNG
HUMAN PATELLAR TENDON
C Couppé, RB Svensson, SV Skovlund, JD Nybing, JK Jensen, M Kjaer, SP Magnusson

8
THE ESSENTIALS OF TRAINING DIARIES FOR SPECIFIC PHYSICAL ACTIVITY
QUANTIFICATION IN HEALTH PROMOTION – A WORKPLACE CLUSTER RANDOMISED
TRIAL
T Dalager, V Johnston, E Boyle, A Welch, J Larkin, S O’Leary, G Sjøgaard
PASSIVE FINGER TAPPING IS SUFFICIENT TO ELICIT REPEATED BOUT RATE
ENHANCEMENT
A Emanuelsen, M Voigt, P Madeleine, EA Hansen
STRIDE FREQUENCY AS DETERMINANT FOR THE TRANSITION BETWEEN WALKING
AND RUNNUNG
LS Jakobsen, MK Jensen, MK Hyttel, H Balle, EA Hansen, M Voigt
A NEW DEVICE FOR MEASURING FORCES IN THE FOOTREST AND SEAT DURING
SPRINT KAYAKING
K Klitgaard, J Hansen, M de Zee
DYNAMICS OF POSTURAL CONTROL IN ELITE SPORT RIFLE SHOOTERS
IF Marker, PC Raffalt, AT Adler, T Alkjaer
BODY DISCOMFORT AND TRUNK MUSCLE ACTIVATION DURING A WRITING-TASK
ON A DYNAMOSTOL INCHARGE CHAIR WITH EITHER A STABLE OR UNSTABLE BASE
OF SUPPORT
JE Nørgaard, MJ Thomsen, RP Hirata, TS Palsson
ANODAL TRANSCRANIAL DIRECT CURRENT STIMULATION DOES NOT IMPROVE
VOLUNTARY ACTIVATION LEVEL OR MAXIMAL VOLUNTARY CONTRACTION IN
QUADRICEPS
JE Nørgaard, MJ Thomsen, JS Aaes, D Knudsen, M Voigt, M Kristiansen
DYNAMICS OF POSTURAL CONTROL IN INDIVIDUALS WITH LATERAL ANKLE
SPRAIN
PC Raffalt, M Chrysanthou, GN Duda, AN Agres
FREELY CHOSEN FINGER TAPPING FREQUENCY IS INCREASED BETWEEN LIMBS
DURING REPEATED BOUT RATE ENHANCEMENT
B Seiferheld, S Bak, L Knudsen, EA Hansen, AJT Stevenson, A Emanuelsen
INCREASE IN CORTICAL EXCITABILITY ELICITED BY ANODAL TRANSCRANIAL
DIRECT CURRENT STIMULATION DOES NOT AFFECT SELF-PACED CYCLING
PERFORMANCE
MJ Thomsen, JE Nørgaard, D Knudsen, JS Aaes, M Kristiansen, M Voigt

9
________________________________________________________________________________
16:00-16:10 DBS STUDENT AWARD CEREMONY
Chair: Anders Holsgaard Larsen & Maj Halling Thomsen
________________________________________________________________________________
16:10-16:20 OFFICIAL CLOSING OF THE MEETING
By Thue Kvorning
________________________________________________________________________________
16:20- REFRESHMENTS AND NETWORKING
________________________________________________________________________________

10
ABSTRACTS
Mapping the load intensity of jumping exercises in post-menopausal females: Implications for osteogenic training
Tine Alkjaer 2,6, Kenneth B. Smale1, Lisa H. Hansen2, Julie K. Kristensen2, Mette K. Zebis3,
Christoffer Andersen3, Daniel L. Benoit1,4, Eva W. Helge5, 1School of Human Kinetics, University of Ottawa, Canada. 2Department of Biomedical Sciences, University of Copenhagen,
Denmark. 3Department of Physiotherapy and Occupational Therapy, Faculty of Health and Technology, Metropolitan University College, Denmark. 4School of Rehabilitation Sciences, University of Ottawa, Canada. 5Department of Nutrition, Exercise and
Sports, University of Copenhagen, Copenhagen, Denmark. 6The Department of Physical and Occupational Therapy, Copenhagen University Hospital Bispebjerg-Frederiksberg, Denmark.
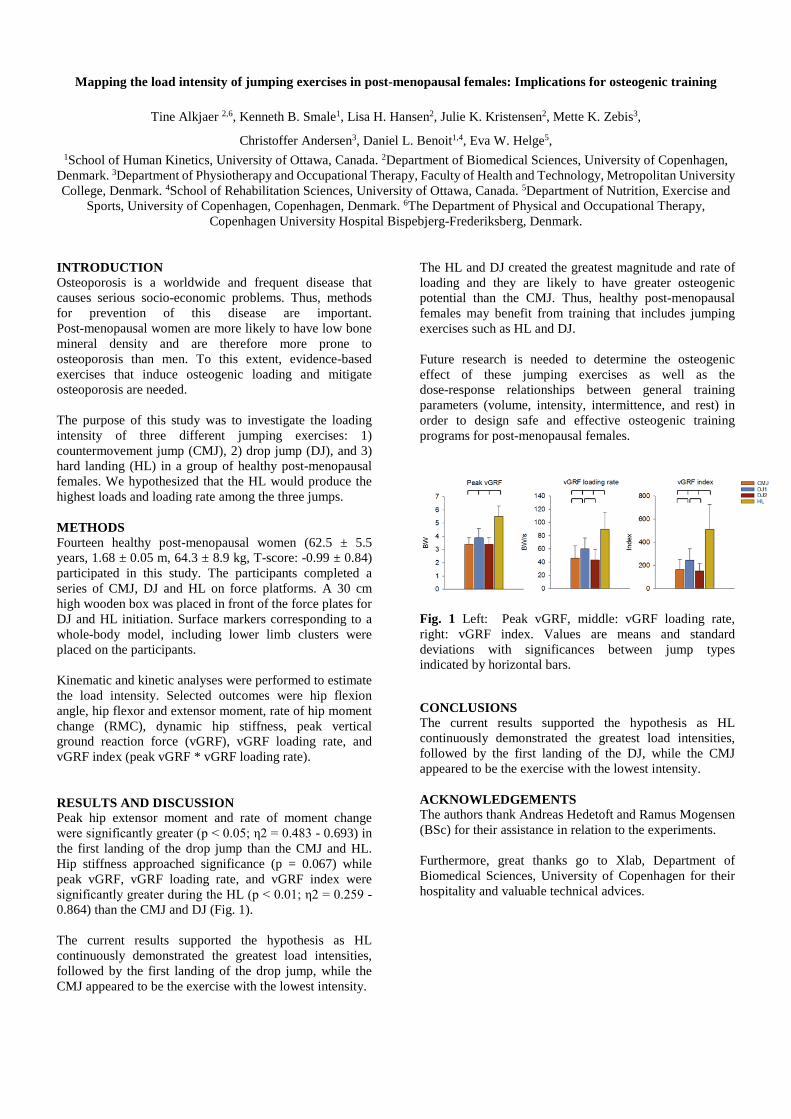
INTRODUCTION Osteoporosis is a worldwide and frequent disease that causes serious socio-economic problems. Thus, methods for prevention of this disease are important. Post-menopausal women are more likely to have low bone mineral density and are therefore more prone to osteoporosis than men. To this extent, evidence-based exercises that induce osteogenic loading and mitigate osteoporosis are needed. The purpose of this study was to investigate the loading intensity of three different jumping exercises: 1) countermovement jump (CMJ), 2) drop jump (DJ), and 3) hard landing (HL) in a group of healthy post-menopausal females. We hypothesized that the HL would produce the highest loads and loading rate among the three jumps. METHODS Fourteen healthy post-menopausal women (62.5 ± 5.5 years, 1.68 ± 0.05 m, 64.3 ± 8.9 kg, T-score: -0.99 ± 0.84) participated in this study. The participants completed a series of CMJ, DJ and HL on force platforms. A 30 cm high wooden box was placed in front of the force plates for DJ and HL initiation. Surface markers corresponding to a whole-body model, including lower limb clusters were placed on the participants. Kinematic and kinetic analyses were performed to estimate the load intensity. Selected outcomes were hip flexion angle, hip flexor and extensor moment, rate of hip moment change (RMC), dynamic hip stiffness, peak vertical ground reaction force (vGRF), vGRF loading rate, and vGRF index (peak vGRF * vGRF loading rate). RESULTS AND DISCUSSION Peak hip extensor moment and rate of moment change were significantly greater (p < 0.05; η2 = 0.483 - 0.693) in the first landing of the drop jump than the CMJ and HL. Hip stiffness approached significance (p = 0.067) while peak vGRF, vGRF loading rate, and vGRF index were significantly greater during the HL (p < 0.01; η2 = 0.259 - 0.864) than the CMJ and DJ (Fig. 1). The current results supported the hypothesis as HL continuously demonstrated the greatest load intensities, followed by the first landing of the drop jump, while the CMJ appeared to be the exercise with the lowest intensity.
The HL and DJ created the greatest magnitude and rate of loading and they are likely to have greater osteogenic potential than the CMJ. Thus, healthy post-menopausal females may benefit from training that includes jumping exercises such as HL and DJ. Future research is needed to determine the osteogenic effect of these jumping exercises as well as the dose-response relationships between general training parameters (volume, intensity, intermittence, and rest) in order to design safe and effective osteogenic training programs for post-menopausal females.
Fig. 1 Left: Peak vGRF, middle: vGRF loading rate, right: vGRF index. Values are means and standard deviations with significances between jump types indicated by horizontal bars. CONCLUSIONS The current results supported the hypothesis as HL continuously demonstrated the greatest load intensities, followed by the first landing of the DJ, while the CMJ appeared to be the exercise with the lowest intensity. ACKNOWLEDGEMENTS The authors thank Andreas Hedetoft and Ramus Mogensen (BSc) for their assistance in relation to the experiments. Furthermore, great thanks go to Xlab, Department of Biomedical Sciences, University of Copenhagen for their hospitality and valuable technical advices.

HABITUAL LOADING LEADS TENDON HYPERTROPHY IN THE ELDERLY AND YOUNG HUMAN PATELLAR TENDON
C. Couppé1,2,*, RB. Svensson1, SV. Skovlund1,2, JD. Nybing3, JK. Jensen1, M. Kjaer1 and SP. Magnusson1,2 1Institute of Sports Medicine Copenhagen, Bispebjerg-Frederiksberg Hospital, Denmark
2Department of Physical and Occupational Therapy, Bispebjerg-Frederiksberg Hospital, Denmark 3Department of Radiology, Bispebjerg-Frederiksberg Hospital, Denmark
INTRODUCTION Habitual loading leads to tendon hypertrophy and greater mechanical properties of the young human patellar tendon (PT) [1]. However, it remains unknown if life-long habitual side-specific loading results in augmented structural and mechanical properties of the older tendon. The purpose was to investigate if life-long side-specific loading leads to greater cross-sectional area (CSA) and mechanical properties of the patellar tendon (PT). METHODS Nine elderly (OM) (age: 66±7yrs, BMI: 24.7±2.7, 51±8 playing-yrs) and 6 young (YM) (age 23±5, BMI: 22.0±1.7, 15.8 playing-yrs) knee-injury free elite badminton players and fencers were included. CSA of the PT, obtained by 3-tesla MRI, and ultrasonography-based measurement of tibial and patellar movement together with PT force during isometric contractions were used to estimate mechanical properties of the PT bilaterally. MRI images and mechanical properties of the PT were evaluated in a blinded fashion. Differences between legs (lead vs. non-lead) were analyzed using paired two-tailed t tests, while differences between the two groups (YM vs OM) were analyzed using unpaired two-tailed t tests with the level of significance set at p < 0.05. Data are reported as Mean±SD or Mean±SE. RESULTS AND DISCUSSION We found that the CSA of the lead leg was greater than the non-lead at the proximal and distal, but not the mid PT, in both OM and YM (Table 1). For a given common force, OM had a stress (based on average CSA) that was lower on the lead leg compared with the non-lead (28±4 MPa vs. 32±4 MPa; p<0.05). Again, in the YM, the lead leg demonstrated lower PT stress than the non-lead (55±4 MPa vs. 64±7 MPa; p<0.05) and also lower tendon strain on the lead compared to their non-lead leg (3.5±0.3%, vs. 4.6±0.4%; p<0.05). The OM PT stiffness did not differ between the lead and non-lead legs (4997±887 N/mm vs. 4800±1016 N/mm). However YM had 29% greater PT stiffness on the lead than on the non-lead leg
(7571±749 N/mm vs. 5861±397 N/mm, p<0.05). Moreover, there was no side-to-side difference for PT elastic modulus either in OM (lead 1.6±0.3 GPa vs. non-lead 1.8±0.3 GPa) or in YM (lead 3.0±0.2 GPa vs. non-lead 2.6±0.3 GPa) at a common force. Fig. 1 Stress-strain relationship for the patellar tendon.
CONCLUSIONS These data confirm previous data that habitual loading leads to tendon hypertrophy and greater mechanical properties of the young human patellar tendon. The data also demonstrate that life-long unilateral habitual loading in elderly elite athletes yields region-specific tendon hypertrophy that may serve to lower the mechanical stress and thereby reduce the risk of injury. ACKNOWLEDGEMENTS The present study was supported by RegionH, Center for Healthy Aging (Nordea Foundation), University of Copenhagen, Lundbeck Foundation and the Danish Medical Research Council. REFERENCES 1. Couppé C, et al., J Appl Physiol 105: 805-810, 2008
Table 1 Patellar tendon (PT) cross-sectional area (CSA) in the lead and non-lead legs of old and young athletes. * p<0.05
versus non-lead.
Proximal Mid Distal
Lead Non-lead Lead Non-lead Lead Non-lead
Old PT CSA (mm2) 154±12* 126±8 130±10 113±4 128±9* 112±5
Young PT CSA (mm2) 114±6* 97±6 99±4 93±6 108±28* 102±12

The essentials of training diaries for specific physical activity quantification in health promotion – A workplace cluster randomised controlled trial
T Dalager1*, V Johnston2, E Boyle1, A Welch2, J Larkin2, S O’Leary2, G Sjøgaard1.
1: University of Southern Denmark, Denmark 2: University of Queensland, Australia.
INTRODUCTION Exercise as medicine has been proven effective for many disorders. In a workplace setting, adherence among participants is a challenge since low adherence and compliance compromise effectiveness of exercise. Training diaries provide unique information of importance for compliance and for quantification of participants’ adherence and dropout. The aim of this study was to determine drop out and adherence in a strength training intervention using training diaries. The effect on muscle strength/endurance and musculoskeletal pain was investigated. METHODS A total of 763 office workers were cluster-randomised to a training group, TG, or a control group, CG. CG attended health promotion information sessions one hour weekly. TG performed five specific strength training exercises explained detailed according to biomechanical principles in the training diary to ensure optimal compliance (forward and backward neck bend, front and side raise, and reverse pull) for 12 weeks, 3x20 min sessions a week -three sets per session- with 1/3 supervised. Training diaries were completed with repetitions and resistances performed. Dropout was defined as missing two sequential weeks of training, and the time point for 25% dropout was determined by Kaplan Meier analysis. Adherence was calculated as number of attended training sessions in the diary out of a maximum of 36 sessions. Adherence ≥70% was used in the dose-response analysis. Intensity of neck/shoulder pain last three months was evaluated by a 10-point numerical scale (0-9, 9=worst possible pain). Muscle strength/endurance was
measured for neck flexion/extension and shoulder raise. Intention-to-treat (ITT) analysis and adherence dose-response analysis was performed by Wilcoxon test between groups with p<0.05 for significance. RESULTS Time point for the 25% drop out was week 10. Participants had an average adherence of 60%. Out of nine possible training sets each week, on average five training sets were completed (95% CI: 5.04-5.21). TG increased significantly neck flexion strength (mean±SD (6.4±22.0%)) and endurance (28.6±72.7%), neck extension endurance (30.0±100.3%), and shoulder raise strength (10.9±26.4%) and endurance (43.6±103.5%), compared with CG. Neck and left shoulder pain decreased significantly more (~0.5points) among TG participants with adherence ≥70% compared to those with adherence <70%. CONCLUSIONS Specific strength training performed according to detailed biomechanical information proved effective in improving muscle strength/endurance and decreasing neck/shoulder pain when adherence was ≥70%. A novel finding is the Kaplan Meier analysis showing 25% of the participants had dropped out at week 10, suggesting reinforcement of motivational initiatives already around week 8-9. Training diaries provide unique opportunities to examine the training volume that will contribute with important knowledge for future implementation of workplace health promotion interventions.

PASSIVE FINGER TAPPING IS SUFFICIENT TO ELICIT REPEATED BOUT RATE ENHANCEMENT
Anders Emanuelsen*, Michael Voigt, Pascal Madeleine and Ernst Albin Hansen
Sport Sciences, Department of Health Science and Technology, Aalborg University, Denmark. E-mail: [email protected]. *Ph.D. student
INTRODUCTION The freely chosen frequency of voluntary rhythmic movement like finger tapping is suggested to be controlled by spinal central pattern generators (CPGs) in an interrelationship with supraspinal descending input and sensory feedback [1,2]. Moreover, it has been shown that the freely chosen finger tapping frequency increases in the second of two consecutive tapping bouts separated by a rest period. The latter phenomenon has been termed repeated bout rate enhancement [3]. The overall aim of the present study was to further investigate the phenomenon of repeated bout rate enhancement. More specifically, it was to elucidate whether sensory feedback, caused by passive finger tapping, would be sufficient to elicit repeated bout rate enhancement. METHODS Healthy individuals (n = 21; 16 men and 5 women, 1.83 ± 0.08 m, 82.6 ± 13.1 kg, and 25.3 ± 3.1 years) participated. Each participant reported to the laboratory twice, referred to as Session A and B. The sessions were separated by a three-week washout period [2,3]. In Session A, two 3-min index finger tapping bouts were performed at freely chosen tapping frequencies. In Session B, a 3-min passive index finger tapping bout was followed by a 3-min tapping bout at freely chosen frequency. It applied to both Session A and B, that the bouts were separated by 10 min rest. The passive tapping was performed by using a custom-built machine that could move the passive finger. The tapping frequency during the passive tapping bout corresponded to the average tapping frequency that the participant had applied during the first tapping bout in Session A. RESULTS AND DISCUSSION The tapping frequency in the first bout in Session A was used as a reference tapping frequency. The tapping frequencies in the second bout in session A and B were 12.9 ± 14.8% (p < 0.001) and 9.9 ± 6.0% (p = 0.001) higher than the reference tapping frequency, respectively (Fig 1). These differences were not significantly different (p = 0.438). The results from Session A support previous findings by replicating the phenomenon of repeated bout rate enhancement [3,4]. The elicitation of repeated bout rate enhancement in Session B constituted a novel finding. It has been suggested that an increased CPG-mediated movement frequency output might be caused by increased supraspinal descending drive [5]. However, it is also possible that an increased movement frequency can occur without increased supraspinal descending drive as a result of excitation of the rhythm generating part of the CPG. The latter could be caused by neuromodulators released as a consequence of e.g. afferent feedback [6,7]. The present results from Session B might support the latter.
Fig. 1 Mean + SD tapping frequencies in Session A (applying freely chosen tapping in 1. bout) and Session B (applying passive tapping in 1. bout). White and black bars represent first and second bouts, respectively. The second bouts consisted of freely chosen tapping. *different from the first bout (p < 0.01). CONCLUSIONS We showed for the first time that the phenomenon of repeated bout rate enhancement also is elicited after passive tapping (Session B). These results are interpreted to support a working hypothesis suggesting that sensory feedback to the spinal CPG might excite this and explain the increased tapping frequency during repeated bout rate enhancement. ACKNOWLEDGEMENTS The present research is supported by The Ministry of Culture Committee on Sports Research. REFERENCES [1] Shima et al. Conf Proc IEEE Eng Med Biol Soc, 4443-48, 2011. [2] Hansen & Ohnstad Exp Brain Res 186: 365-73, 2008. [3] Hansen et al. J Mot Behav 47: 490-96, 2015. [4] Mora-Jensen et al. Motor Control 21: 457-67, 2017. [5] Prochazka & Yakovenko Integr Comp Biol 47: 474-81, 2007. [6] Cropper et al. J Neurophysiol 118: 1861-70, 2017. [7] Frigon J Neurophysiol 117: 2224-41, 2017.
Tap
ping
freq
uenc
y (t
aps/
min
)
140
160
180
200
220
240
Session BSession A
**

THE INFLUENCE OF ADDED COGNITIVE LOAD ON THE TRANSITION BETWEEN WALKING AND RUNNING
*M.K., Hyttel, L.S., Jakobsen, M.K., Jensen, H. Balle, E.A. Hansen & M. Voigt Dept. of Health Sciences and Technology, Sport Sciences, Aalborg University
*Student INTRODUCTION Many studies search for a specific trigger behind the behavioral change in locomotion that appears when the walking transits into running. However, it has so far been difficult to find evidence for a single determinant [1]. The majority of researchers examining the walk-to-run transition (WR-transition) consider the speed of locomotion to be the main determinant. A different view has been proposed by Hansen et al. (2017) [2] who examined the stride frequency as the main determinant for the WR-transition and they provided evidence for the transition to occur at the frequency ‘midpoint’ between two behavioral attractor states represented by the preferred walking and running speed/frequency combinations. In any case, it cannot be ignored that the transition point is sensitive to a variety of factors [1] and a few studies have examined how added cognitive load in dual-tasks involving locomotion influence the WR-transition [3,4]. Conflicting results have been found and therefore, a dual-task paradigm adding cognitive load by subtraction tasks was applied in this study to re-examine to which degree cognitive loading influences the WR-transition. METHODS Eighteen healthy participants (13 men and 5 women) were recruited (age; 23.9 ± 1.5 years, height; 1.77 ± 9.6 cm, body mass; 77.3 ± 12.8 kg). All participants were accustomed to treadmill walking/running prior to the experiment. Before the running trials force sensing resistor footswitches (FSRs, Interlink, USA) were placed under the insole of the right shoes of the participants. One was placed under calcaneus and the other was placed under the heads metatarso-phalangeal joints 1-2. The sensitivity of each footswitch was individually adjusted, to avoid false triggering. A 10-minute warm-up/adaptation period was applied. The treadmill (Woodway XL Pro, Waukesha, USA) speed was initially 1 km/h and was increased by 1 km/h each minute until the final speed at 10 km/h was reached. After four minutes of rest the ‘preferred’ WR-transition was determined. The initial treadmill speed was 5 km/h and increased by 0.1 km/h each 10th second until the final speed of 9 km/h was reached. The speed immediately before the transition was determined. This was followed by four minutes rest. Then the dual-task procedure began. The primary task was subtraction tasks and the secondary task was the walking/running protocol identical to the protocol for determination of the ‘preferred’ transition. The subtraction task consisted of consecutive subtraction of 7 starting at 911 (e.g. 911-7 = 904. 904-7 = 697 and so on). The participants were instructed to state the answers aloud. The test leader controlled all the answers and in case of an error, the answer should be corrected until right. The participants would be told how well they had performed in the subtraction task compared to the other subjects as motivation. The sampling frequency of the footswitches
was 1000 Hz. Data were processed in MATLAB (R2018A, The MatWorks BW, Natrick, USA). The exact WR- transition was determined based on the stride-to-stride changes in duty factor (i.e. the relationship between stance time and stride time).
Data were organized in Excel (version 15.4, Microsoft Corporation, Bellevue, WA, USA) and analyzed in SPSS (PASW statistics, version 25.0, SPSS Inc., Chicago, USA). Paired samples t-tests were used to examine if any difference between preferred and dual-task transition were present. Two subjects were excluded from the analysis because the WR-transition was absent during the dual-task trials RESULTS The preferred WR-transition stride frequency was 67.0±3.1 strides/min and the dual-task WR-transition stride frequency was 68.4±3.7 strides/min. This 2.2% difference was not statistically significant (p=.137). The preferred WR-transition speed was 7.5±0.5 km/h and the WR-transition speed during the dual-task trial was 7.6±0.5 km/h. This 1.2% difference was also not statistically significant (p=.073). DISCUSSION No significant effect on WR-transition speed or WR-transition stride frequency of an added cognitive load during locomotion was found. This finding supports the work by Abdolvahab (2015) [4] in which it was found that the Froude number did not change significantly when cognitive load was added. The unchanged Froude number indicated that the transition speed did not change. However, it should be noted that they also found that the Froude number at the transition from running to walking was significantly decreased at transition by added cognitive load, and the decrease was correlated with the intensity of this added load. As mentioned previously, it cannot be ignored that the added cognitive load might influence the gait-transition and that the magnitude of the influence most likely is proportional with the intensity of the added cognitive load. So, in the present study the cognitive load may have been so limited that it did not affect the WR-transition for most of the participants.
According to the work by Hansen et al. [1] it is suggested that the stride frequency is the best predictor of the WR-transition. The critical WR-transition stride frequency may depend on a critical dynamic state of the moving body, which is sensitive to many different factors e.g. added cognitive load, changes in inertia of the body segments and prior movement history [5].
REFERENCES 1. Kung, S.M. et al. Hum Mov Sci 57:1-12, 2018 2. Hansen, E.A. et al. Sci Rep 7:2010, 2017 3. Daniels, G.L. & Newell, K.M. Biol Psychol 63: 163-78, 2003 4. Abdolvahab, M. Atten Percept Psychophys 77: 2502-06, 2015 5. Jakobsen, L.S. et al. Proceedings from the Annual meeting of the
Danish Biomechanical Society, 2018

IDENTIFICATION OF HAND EXERCISES USING WEARABLE SURFACE ELECTROMYOGRAPHY
Jonas L. Isaksen*, J.K. Kanters and T. Alkjær
Department of Biomedical Sciences, University of Copenhagen, Nørre Allé 14, 2200 Copenhagen N
*Ph.D. student
INTRODUCTION
Electromyography (EMG) from surface electrodes can detect
muscle activity, [1] and EMG obtained using small, Ag/AgCl
electrodes have previously been used for identification of
movements. [2] This study aimed to explore, if it is possible
to identify movements using dry electrodes and machine
learning in a wearable device.
METHODS
52 participants (33 (63%) women, 15 (29%) injured)
performed a series of 24 hand exercises including extensions,
flexions, and rotations at different loads (0, 2, and 5 kg) paced
by an instruction video using their dominant hand. Surface-
EMG was obtained at 1043 Hz using the PreCure Elbow
(PreCure IVS, Havnebakken 26, 3770 Allinge, Denmark)
wearable device on dry or dampened skin.
18 EMG features were used to characterize the movements
including direct characterization of the EMG signal, a 201-
sample windowed root-mean-square (RMS) signal, and
frequency spectrum features. The features were based on a
10-second segment of each exercise. In addition, the sex was
available in the classification stage.
We trained a conditional inference tree (ctree) to classify
movements on 70 % of the recordings. Feature extraction was
performed in MATLAB R2018a and the ctree was
implemented in R v. 3.5.0 using package ‘party’.
RESULTS AND DISCUSSION
1205 (96.6%) exercises yielded valid recordings. Of the 359
exercises in the test set, 90 (25.1%) were correctly identified.
We found a large variation in accuracy between exercises
(Table 1). We found that exercises tended to be better
identified if they were a) with the 5 kg load, b) extensions or,
c) involving as few muscle groups as possible.
Many strictly incorrect predictions may be considered partly
correct. For instance, computer mouse operations were
identified as static hand holds, which is known to be a major
constituent of the exercise. [3] There was a large overlap in
muscle activity between the exercises, and often it was
difficult to differentiate between 0 kg- and 2 kg-exercises.
CONCLUSIONS
Identification of hand movements across movement types
using surface EMG was possible with an accuracy of 25%.
REFERENCES
1. Moseley JB, Jr., et al., Am J Sports Med 20: 128-34, 1992
2. Geethanjali P, et al., Australas Phys Eng Sci Med 34: 419-27,
2011
3. Alkjaer T, et al., Scand J Work Environ Health 31: 152-9, 2005
Table 1 Confusion matrix for the test set – prediction (P) against actual exercise (E).
E2 E3 E4 E5 E6 E7 E8 E9 E10 E11 E12 E13 E14 E15 E16 E17 E18 E19 E20 E21 E22 E23 E24 E25
P2 19 0 0 0 0 0 0 0 0 0 0 0 0 0 0 0 0 0 0 0 0 0 0 4
P3 0 4 0 0 0 0 0 0 0 0 0 0 0 0 0 0 0 0 0 1 0 0 0 0
P4 0 0 4 5 1 0 0 1 0 1 1 1 0 0 0 0 4 0 0 0 0 1 0 0
P5 0 0 1 3 0 3 0 1 0 0 1 0 0 0 0 0 4 0 0 0 0 0 0 0
P6 0 0 0 1 10 0 0 0 0 0 0 0 2 0 0 0 0 0 0 0 0 4 0 2
P7 0 0 6 1 0 4 7 4 2 1 1 3 0 0 0 0 1 0 0 0 3 0 7 0
P8 0 1 0 0 0 2 2 0 0 0 1 5 1 0 0 1 0 1 0 1 1 1 2 1
P9 0 0 0 1 0 1 0 0 3 2 0 1 0 1 0 7 1 0 0 2 0 0 0 1
P10 0 1 2 0 0 2 1 5 3 3 6 0 1 0 0 0 0 1 0 1 0 0 0 5
P11 0 1 1 0 0 0 1 1 3 2 3 1 1 0 0 0 0 0 0 0 1 0 0 1
P12 0 0 0 0 0 0 4 0 2 0 1 0 0 0 0 0 0 1 0 2 0 0 0 0
P13 0 0 0 0 0 0 1 0 0 0 0 0 0 0 0 0 0 0 0 0 0 0 0 0
P14 0 0 0 4 0 0 0 1 0 0 0 1 10 0 0 3 1 0 0 0 0 2 4 1
P15 0 1 0 0 0 0 0 0 0 0 0 0 0 2 0 0 0 0 1 2 0 0 0 0
P16 0 1 0 0 0 0 0 1 1 0 1 0 0 0 1 0 0 0 0 3 0 0 0 0
P17 0 0 0 0 0 0 0 0 0 0 0 0 2 0 2 3 0 0 0 0 0 0 0 0
P18 1 0 0 1 1 0 0 0 0 0 0 0 0 0 0 0 0 0 0 0 0 0 0 1
P19 0 3 0 0 0 0 0 3 0 0 2 1 0 7 1 1 0 6 5 1 0 0 1 0
P20 0 2 0 0 0 0 0 1 0 0 0 0 0 5 8 0 0 3 8 4 0 0 0 0
P21 0 0 0 0 0 0 0 0 0 0 0 0 0 0 0 0 0 0 0 0 0 0 0 0
P22 0 0 0 0 0 0 0 0 0 0 0 0 0 0 0 0 0 0 0 0 7 8 1 2
P23 1 0 0 0 0 0 0 0 0 0 0 0 1 0 0 1 1 0 0 0 4 1 0 1
P24 0 0 0 0 0 0 0 0 0 0 0 0 0 0 0 0 0 0 0 0 0 0 0 0
P25 0 0 0 0 0 0 0 0 0 0 0 0 0 0 0 0 0 0 0 0 0 0 0 0
STRIDE FREQUENCY AS DETERMINANT FOR THE TRANSITION BETWEEN WALKING AND RUNNUNG
L.S. Jakobsen*, M.K. Jensen, M.K. Hyttel, H. Balle, E.A. Hansen, M. Voigt
Dept. of Health Sciences and Technology, Sport Sciences, Aalborg University
*Student
INTRODUCTION
It is generally believed that the walk-to-run transition
(WR-transition) occurs at a critical walking speed 1.
However, recent studies [2,3] have, based on Dynamic
Systems Theory, provided evidence for the WR-transition to
be triggered at a critical point occurring at the frequency
‘midpoint’ between two behavioral attractor states
represented by the ‘preferred’ or ‘basic’ walking and running
stride frequency/speed combinations. If a given critical stride
frequency truly determines the basic WR-transition, then this
should be independent of the speed of locomotion. During
locomotion, speed and stride frequency are closely linked
since: speed = stride length × stride frequency. However,
speed and frequency can be de-coupled in locomotion tests,
where the speed is kept constant and the stride frequency
increased systematically. We hypothesize 1) that the
WR-transition stride frequency (WRTSF) at preferred
walking speed (PWS) and with increasing stride frequency is
not different from the basic WRTSF and 2) that the WRTSF
is independent of the initial speed/frequency combination of
walking until the basic WR-transition.
METHODS
Eighteen healthy participants were recruited (13 men and 5
women, age; 23.9 ± 1.5 years, height; 1.77 ± 0.10 m, body
mass; 77.3 ± 12.8 kg). All participants were familiar with
treadmill running in advance.
Force sensing resistor footswitches (FSRs, Interlink,
USA) were placed under the insole in the right shoe of the
participant: 1) under Calcaneus and 2) under the
Metatarso-Phalangeal joints 1-2. The sensitivities of the
footswitches were adjusted individually for each participant
to avoid false triggers.
A 10-minute warm-up/adaptation period was used. The
initial treadmill (Woodway XL Pro, Waukesha, USA) speed
was set at 1 km/h and increased by 1 km/h each minute until
the final speed at 10 km/h was reached. Following 4 minutes
rest, the ‘preferred’ or ‘basic’ WR-transition speed (BTS) and
stride frequency were determined: the initial treadmill speed
was set at 5 km/h and increased by 0.1 km/h each 10 seconds
until a final speed of 9 km/h was reached. After additional 4
minutes rest the ‘preferred’ walking speed was determined:
the walking speed was initially set at 0 km/h and the
participants were instructed to change the speed of the
treadmill until the preferred walking speed (PWS) (and stride
frequency) was found. No feedback concerning treadmill
speed was given. After another 5 minutes of rest, 4 tests
involving stride frequency modulation were executed at 4
different speeds: 1) PWS, 2) WS25 = PWS+0.25(BTS-PWS),
3) WS50 = PWS+0.50(BTS-PWS) and 4) WS75 =
PWS+0.75(BTS-PWS). The order of the execution of the four
stride frequency modulations was randomized. At each
speed, the participant adapted to their preferred stride
frequency and the metronome set accordingly, and after 30
seconds with this constant stride frequency, the metronome
beat frequency was changed by 2 strides each 15th second
and the participant should follow the beat until the
WR-transition emerged. To verify the transition, participants
were equipped with a hand-switch to utilize whenever they
felt the WR-transition occurred. The sampling frequency of
the footswitches signals was 1000 Hz. Data were processed in
MATLAB (R2018A, The MatWorks BW, Natrick, USA).
Stride-to-stride duty factors were extracted, and the
WR-transitions were determined based on the abrupt changes
in this parameter at transition combined with the hand-switch
signal when available. Transition speeds and stride
frequencies for all situations were determined.
A paired t-test was applied for the comparison of the
basic WRTSF and the WRTSF induced at PWS. A One-Way
Repeated Measures ANOVA combined with a Holm-Sidak
post hoc test was used to examine differences in WRTSF’s in
the frequency modulation tests.
RESULTS
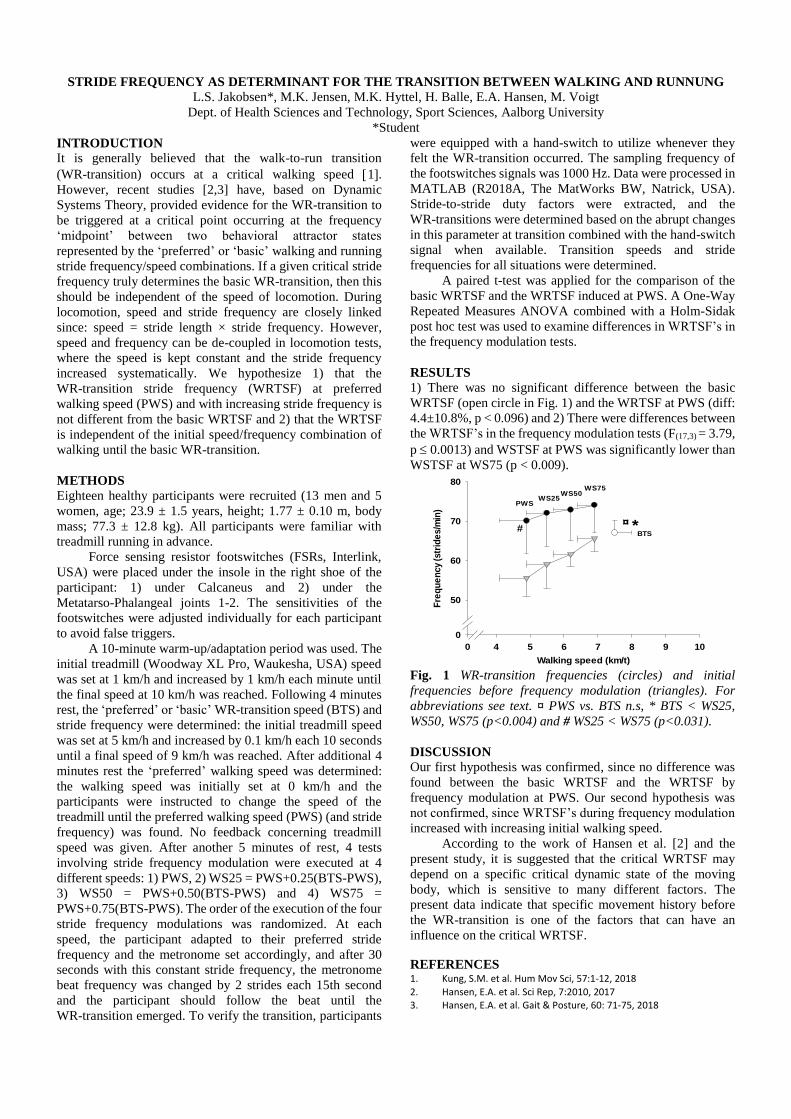
1) There was no significant difference between the basic
WRTSF (open circle in Fig. 1) and the WRTSF at PWS (diff:
4.4±10.8%, p < 0.096) and 2) There were differences between
the WRTSF’s in the frequency modulation tests (F(17,3) = 3.79,
p 0.0013) and WSTSF at PWS was significantly lower than
WSTSF at WS75 (p < 0.009).
Walking speed (km/t)
0 4 5 6 7 8 9 10
Fre
qu
en
cy
(str
ide
s/m
in)
0
50
60
70
80
*#
PWSWS25
WS75
BTS
WS50
¤
Fig. 1 WR-transition frequencies (circles) and initial
frequencies before frequency modulation (triangles). For
abbreviations see text. ¤ PWS vs. BTS n.s, * BTS < WS25,
WS50, WS75 (p<0.004) and # WS25 < WS75 (p<0.031).
DISCUSSION
Our first hypothesis was confirmed, since no difference was
found between the basic WRTSF and the WRTSF by
frequency modulation at PWS. Our second hypothesis was
not confirmed, since WRTSF’s during frequency modulation
increased with increasing initial walking speed.
According to the work of Hansen et al. [2] and the
present study, it is suggested that the critical WRTSF may
depend on a specific critical dynamic state of the moving
body, which is sensitive to many different factors. The
present data indicate that specific movement history before
the WR-transition is one of the factors that can have an
influence on the critical WRTSF.
REFERENCES 1. Kung, S.M. et al. Hum Mov Sci, 57:1-12, 2018
2. Hansen, E.A. et al. Sci Rep, 7:2010, 2017 3. Hansen, E.A. et al. Gait & Posture, 60: 71-75, 2018
A NEW DEVICE FOR MEASURING FORCES IN THE FOOTREST AND SEAT DURING SPRINT KAYAKING
Kent Klitgaard1* John Hansen1 and Mark de Zee1 1Department of Health Science and Technology Aalborg University, Fredriks Bajers Vej 7, 9220 Aalborg Øst
*Ph.D. student
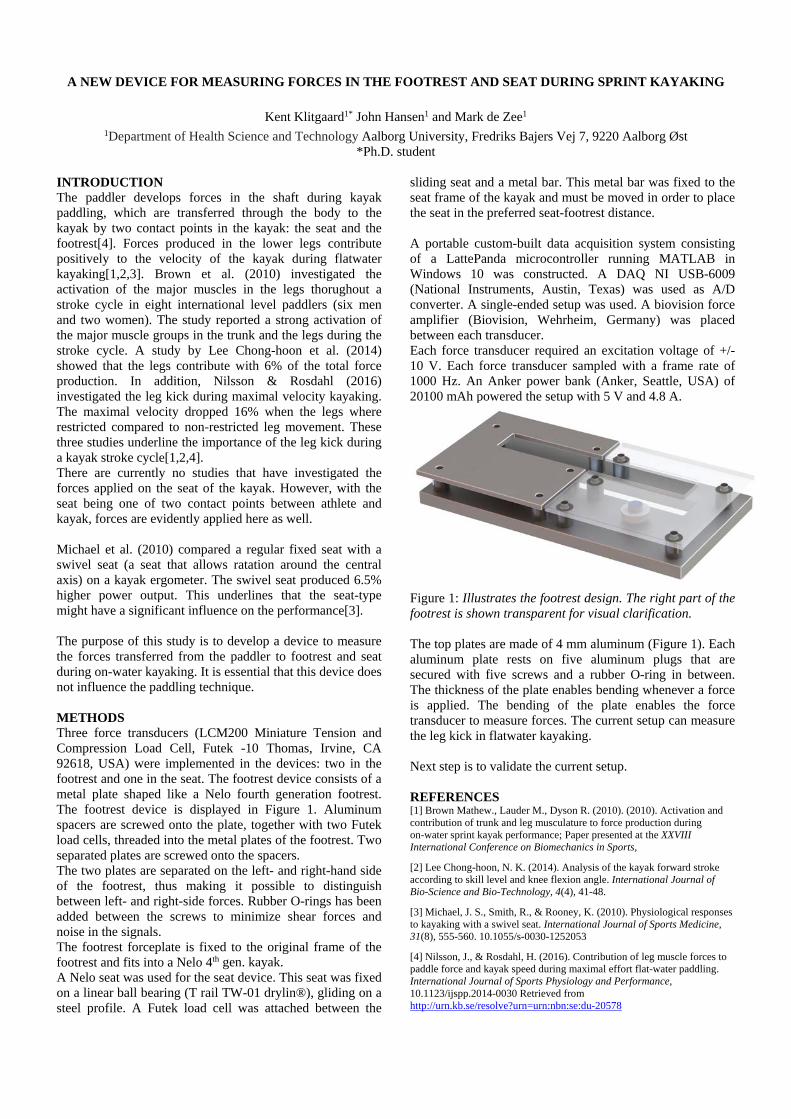
INTRODUCTION The paddler develops forces in the shaft during kayak paddling, which are transferred through the body to the kayak by two contact points in the kayak: the seat and the footrest[4]. Forces produced in the lower legs contribute positively to the velocity of the kayak during flatwater kayaking[1,2,3]. Brown et al. (2010) investigated the activation of the major muscles in the legs thorughout a stroke cycle in eight international level paddlers (six men and two women). The study reported a strong activation of the major muscle groups in the trunk and the legs during the stroke cycle. A study by Lee Chong-hoon et al. (2014) showed that the legs contribute with 6% of the total force production. In addition, Nilsson & Rosdahl (2016) investigated the leg kick during maximal velocity kayaking. The maximal velocity dropped 16% when the legs where restricted compared to non-restricted leg movement. These three studies underline the importance of the leg kick during a kayak stroke cycle[1,2,4]. There are currently no studies that have investigated the forces applied on the seat of the kayak. However, with the seat being one of two contact points between athlete and kayak, forces are evidently applied here as well. Michael et al. (2010) compared a regular fixed seat with a swivel seat (a seat that allows ratation around the central axis) on a kayak ergometer. The swivel seat produced 6.5% higher power output. This underlines that the seat-type might have a significant influence on the performance[3]. The purpose of this study is to develop a device to measure the forces transferred from the paddler to footrest and seat during on-water kayaking. It is essential that this device does not influence the paddling technique. METHODS Three force transducers (LCM200 Miniature Tension and Compression Load Cell, Futek -10 Thomas, Irvine, CA 92618, USA) were implemented in the devices: two in the footrest and one in the seat. The footrest device consists of a metal plate shaped like a Nelo fourth generation footrest. The footrest device is displayed in Figure 1. Aluminum spacers are screwed onto the plate, together with two Futek load cells, threaded into the metal plates of the footrest. Two separated plates are screwed onto the spacers. The two plates are separated on the left- and right-hand side of the footrest, thus making it possible to distinguish between left- and right-side forces. Rubber O-rings has been added between the screws to minimize shear forces and noise in the signals. The footrest forceplate is fixed to the original frame of the footrest and fits into a Nelo 4th gen. kayak. A Nelo seat was used for the seat device. This seat was fixed on a linear ball bearing (T rail TW-01 drylin®), gliding on a steel profile. A Futek load cell was attached between the
sliding seat and a metal bar. This metal bar was fixed to the seat frame of the kayak and must be moved in order to place the seat in the preferred seat-footrest distance. A portable custom-built data acquisition system consisting of a LattePanda microcontroller running MATLAB in Windows 10 was constructed. A DAQ NI USB-6009 (National Instruments, Austin, Texas) was used as A/D converter. A single-ended setup was used. A biovision force amplifier (Biovision, Wehrheim, Germany) was placed between each transducer. Each force transducer required an excitation voltage of +/- 10 V. Each force transducer sampled with a frame rate of 1000 Hz. An Anker power bank (Anker, Seattle, USA) of 20100 mAh powered the setup with 5 V and 4.8 A.
Figure 1: Illustrates the footrest design. The right part of the footrest is shown transparent for visual clarification. The top plates are made of 4 mm aluminum (Figure 1). Each aluminum plate rests on five aluminum plugs that are secured with five screws and a rubber O-ring in between. The thickness of the plate enables bending whenever a force is applied. The bending of the plate enables the force transducer to measure forces. The current setup can measure the leg kick in flatwater kayaking. Next step is to validate the current setup. REFERENCES [1] Brown Mathew., Lauder M., Dyson R. (2010). (2010). Activation and contribution of trunk and leg musculature to force production during on-water sprint kayak performance; Paper presented at the XXVIII International Conference on Biomechanics in Sports,
[2] Lee Chong-hoon, N. K. (2014). Analysis of the kayak forward stroke according to skill level and knee flexion angle. International Journal of Bio-Science and Bio-Technology, 4(4), 41-48.
[3] Michael, J. S., Smith, R., & Rooney, K. (2010). Physiological responses to kayaking with a swivel seat. International Journal of Sports Medicine, 31(8), 555-560. 10.1055/s-0030-1252053
[4] Nilsson, J., & Rosdahl, H. (2016). Contribution of leg muscle forces to paddle force and kayak speed during maximal effort flat-water paddling. International Journal of Sports Physiology and Performance, 10.1123/ijspp.2014-0030 Retrieved from http://urn.kb.se/resolve?urn=urn:nbn:se:du-20578

ESTIMATION OF SPINAL LOADING DURING MANUAL MATERIALS HANDLING USING ONLY INERTIAL
MOTION CAPTURE AND PREDICTED GROUND REACTION FORCES - A VALIDATION STUDY
Frederik G. Larsen1*, Frederik P. Svenningsen1, Michael S. Andersen2, Mark de Zee2 & Sebastian Skals3 1Department of Health Science and Technology, Aalborg University, Fredrik Bajers Vej 7D, DK-9220 Aalborg East
2Department of Materials and Production, Aalborg University, Fibigerstræde 16, DK-9220 Aalborg East 3The National Research Centre for the Working Environment, Lersø Parkallé 105, DK-2100 Copenhagen East
Corresponding author email: [email protected]
INTRODUCTION
Musculoskeletal models are often used to gain insight into
the internal loading of the musculoskeletal system. Typically,
these models use measurements of kinematics and ground
reaction forces and moments (GRF&Ms) to compute the
joint contact forces bottom up. However, these
measurements often require a complex setup of infrared
cameras, reflective markers and force plates, and is usually
limited to laboratory environments. Recently, a study
showed that these joint contact forces can be estimated
accurately during gait based exclusively on inertial motion
capture (IMC) and musculoskeletal modeling [1]. If this
system can provide accurate estimations of joint loads
outside a laboratory environment, it would provide
important opportunities to assess musculoskeletal loads in
the field, as for instance, during ergonomic job evaluation.
Therefore, the aim of the present study was to validate the
estimation of L4-L5 spinal forces based on a
musculoskeletal model driven exclusively using IMC data
and ground reaction force prediction during various lifting
and transferring tasks. This approach will help determine if
musculoskeletal models driven by IMC data and ground
reaction force prediction can be used to estimate spinal
loading during MMH tasks in the field.
METHODS
Nine healthy males and 4 healthy females (age 25.7 ± 3.4
years, height 179.3 ± 7.8 m, weight 76.4 ± 12.8 kg)
volunteered to participate in the study. All subjects
performed six different lifting tasks and two transferring
tasks in their own pace, including symmetrical lifting
(5-20kg box), asymmetrical lifting (5-10kg box) and load
transferring (10kg box and 5kg weight). Motion analysis
was performed simultaneously using optical motion capture
(OMC) and IMC, specifically a Qualisys marker-based
system (Qualisys, Göteborg, Sweden) and 17 inertial
measurement units (Xsens MVN Awinda, Xsens
Technologies BV, Enschede, The Netherlands). GRF&Ms
were measured using floor-mounted force plates (AMTI,
Watertown, MA, USA). Based on these measurements, two
biomechanical models were constructed in the AnyBody
Modeling System [2] to estimate the L4-L5 joint reaction
forces: 1) OMC and measured GRF&Ms OMC-MGRF) and
2) IMC and predicted GRF&Ms (IMC-PGRF).
RESULTS AND DISCUSSION
Table 1 shows relative root mean square error (rRMSE)
between the OMC-MGRF and IMC-PGRF models. The
rRMSE ranged from 21.35 % to 28.44% for SYM and
ASYM while rRMSE were 56.83% and 78.40% for
TRA-BOX and TRA-OH, respectively. Fig. 1 shows a
Bland-Altman plot comparing L4-L5 axial compression
force for OMC-MGRF and IMC-PGRF with a mean -0.021
log(%BW). Errors between IMC-PGRF and OMC-MGRF
might be related to differences in scaling methods, full-body
kinematics and prediction of GRF&Ms.
Fig. 1 Bland Altman plot comparing L4-L5 axial
compression force log(%BW) for the two biomechanical
models showing the mean (solid line) and upper and lower
limit of agreement (dashed lines). Blue circles represent
symmetric lifting, red plus sign asymmetric lifting, black
asterisk box transferring, and green cross one-handed
dumbbell transferring.
CONCLUSION
The present results showed L4-L5 axial compression forces
were underestimated for IMC-PGRF compared with
OMC-MGRF with outliers. IMC-PGRF models should
therefore be used with caution to estimate L4-L5 joint load
in the field.
REFERENCES
1. Karatsidis A, et al., Arxiv.org, 2018
2. Damsgaard M, et al., Simulation Modelling Practice and
Theory, 14: 1100-1111, 2006
Table 1 rRMSE (mean ± SD) for L4-L5 axial compression force IMC-PGRF versus OMC-MGRF for the eight lifting scenarios.
Agreement between L4-L5 axial compression forces (%BW)
SYM 5 SYM 10 SYM 15 SYM 20 ASYM 5 ASYM 10 TRA-BOX TRA-OH
rRMSE
(%)
26.96
±21.17
23.35
±11.49
27.42
±21.17
28.44
±21.45
22.47
±12.60
21.35
±11.85
56.83
±36.29
78.40
±41.85

Scapular Muscle Activity in Healthy Individuals during Serratus Punch Exercises
Sigríður Katrín Magnúsdóttir*1, Tine Alkjær1,2, Marius Henriksen2, Rikke Høffner2, Ann Cools2,3
1 Department of Biomedical Sciences, University of Copenhagen, 2 The Department of Physical and Occupational Therapy, Copenhagen University Hospital Bispebjerg-Frederiksberg, Denmark, 3 Department of Rehabilitation Sciences and
Physiotherapy , Ghent University , Gent , Belgium. *Biomedical engineering student, KU/DTU
INTRODUCTION Scapulothoracic (ST) dysfunction is commonly seen in relation to shoulder pathologies. It has been suggested that patients with ST dysfunction show increased activation of the upper trapezius (UT), while the serratus anterior (SA) is not activated enough. Rehabilitation programs that restore normal scapular movement by strengthening the SA, while minimally activating the UT, could therefore be helpful[1]. As such the UT/SA muscle activity may be a relevant outcome. The UT/SA muscle activity ratio during various relevant shoulder rehabilitation exercises is yet to be investigated. Thus, the purpose of the present study was to assess the UT/SA muscle activity ratio in healthy individuals, during different scapular punch exercises. METHODS A single session, controlled laboratory study, measuring the UT, middle trapezius (MT), lower trapezius (LT) and SA activity, using surface electromyography (sEMG) was performed. Bipolar electrodes on the three trapezius muscle parts were applied according to the SENIAM guidelines. The SA electrodes were applied below the axilla, anterior to the latissimus dorsi and posterior to the pectoralis major. Eight healthy, right handed, subjects participated in the study. They performed 14 well known shoulder rehabilitation exercises. Three of these exercises; the serratus punch in three different positions (table 1), were analyzed further. Peak EMG activity for each muscle of interest was determined for normalization, using MVIC contractions through manual muscle tests. All analyses were done using SAS software. A repeated measurements linear mixed model was used. A statistically significant interaction was broken down (post hoc), using paired t-tests. Level of significance was set to 5% (P = 0.05). RESULTS AND DISCUSSION No statistically significant differences were found between the UT/SA ratio of activity between positions (figure 1).
However, results may reflect a pattern of decrease in the UT/SA ratio of activity when increasing the angle of action from 90° to 120° on the right side. It is evident that the UT/SA ratio is similar at 120°, when changing positions from standing to side lying. This holds true for both sides. This was expected since the elimination of gravity is equally reduced for both muscles when changing positions. It is important to address the very small sample size in this study, which renders any conclusions tentative. Further research is needed to determine if the pattern suggested here holds true, why there is a change in ratio of activity and to see how the activity in each muscle changes throughout the different exercises.
Figure 1 - UT/SA ratio during the three serratus punch exercises for both the right and left arm
CONCLUSIONS The results of this study do not show any statistically significant difference in the UT/SA muscle activity ratio in any of the exercises. REFERENCES 1. Ann M Cools et al. Rehabilitation of scapular muscle
balance: which exercises to prescribe? The American journal of sports medicine 35,10: 1744–1751, 2007
Table 1 - The SA exercises, start position and description of movement.
Position Exercise Start position Description of movement
Standing SA punch, 90° Shoulder flexed to 90°. Arm fully extended, holding an
EB, hand 120 cm from the wall. Scapula fully retracted.
Protraction against the
resistance of EB.
Standing SA punch, 120° Shoulder flexed to 120°. Arm fully extended holding an
EB, hand 120 cm from wall. Scapula fully retracted.
Protraction against the
resistance of EB.
Side lying SA punch, 120° Shoulder in 120° flexion and the elbow extended. Protraction in the horizontal
plane.

DYNAMICS OF POSTURAL CONTROL IN ELITE SPORT RIFLE SHOOTERS 1 Ida Fillingsnes Marker, 1, 2 Peter C. Raffalt, 3 Andreas Top Adler and 1 Tine Alkjaer
1 Department of Biomedical Sciences, University of Copenhagen, Copenhagen, Denmark 2 Julius Wolff Institute for Biomechanics and Musculoskeletal Regeneration, Charité – Universitätsmedizin Berlin, Berlin, Germany
3 Team Denmark, House of Sport, Brondby, Denmark INTRODUCTION Standing rifle shooting is a highly technical Olympic sport that requires extreme accuracy from the sport rifle shooters (SRS), and postural control has been identified as a critical factor for performance [1]. Quantification of the dynamics of the center of pressure (COP) trajectories during upright stance has been used to investigate the postural control in different populations [2,3]. However, it is unknown how the COP dynamics of SRS during two-legged and single-legged stance differs from that of non-sport shooters (NSS). Furthermore, it is unknown how COP dynamics is related to shooting performance. The purpose of the present study was: 1) to investigate if the dynamics of postural control differs between SRS with extensive postural control training background and untrained NSS, and 2) to investigate if there is a correlation between the dynamics of postural control and level of performance during shooting. METHODS Thirteen SRS ranging from Danish national level to world-class level (males/females: 6/7, mean±SD age: 20.2±4.0yrs, body weight: 71.0±14.0kg and body height: 174±11.0cm) and eleven NSS (males/females: 4/7, mean±SD age: 28.1±4.9yrs, body weight: 71.1±10.5kg and body height: 175.2±9.0cm) performed two 90s barefooted standing tasks: 1) shoulder wide on both feet (BF) and 2) unilateral stance on the right foot (RF) with hands kept akimbo. Then, only the SRS performed a 20-shot competition-like standing rifle shooting task. Both tasks were performed on a force plate (AMTI AccuPower) and anterior-posterior (AP) and mediolateral (ML) COP trajectories from 60s of standing and from the last 9s prior to each shot were extracted. To assess the dynamics of the postural control, four different nonlinear methods were applied to the COP trajectories: sample entropy (SaEn) to quantify regularity, the largest Lyapunov exponent (LyE) to quantify rate of trajectory divergence, entropic half-life (EnHL) to quantify the level of time dependency, and the correlation dimension (CoD) to quantify dimensionality. A two-way mixed design ANOVA was used to test the effect of group, task and their interaction on the dependent variables during the standing task. A Pearson correlation analysis investigated the relationship between the level of performance and the dependent variables during the shooting task. The significance level was set at 0.05. RESULTS There was a significant overall effect of group on SaEn and CoD in AP and ML (p<0.001). The SRS had significantly lower SaEn and CoD than the NSS (Figure 1). There was a significant effect of task for all extracted variables in AP and ML (Figure 1). There was a significant group-task interaction on the RF on SaEn AP and ML, LyE and EnHL ML, and CoD AP (p<0.001), and on both BF and the RF on CoD ML
(p=0.002 and p=0.014) (Figure 1). There was a significant group-task interaction on both the SRS and the NSS in SaEn AP (p=0.027 and p<0.001), LyE AP (p=0.026 and p<0.001) and EnHL AP (p<0.001 and p<0.001) (Figure 1), on only the NSS in SaEn, LyE and EnHL ML (p<0.001) and CoD AP (p=0.002), and on only the SRS on CoD ML (p=0.018) (Figure 1). The correlation analysis between the four different non-linear parameters in the AP and ML directions and the level of performance of the SRS showed no correlation.
Figure 1: SaEn (top left), LyE (top right), EnHL (bottom left) and CoD (bottom right) in AP and ML direction for BF and RF, * indicates significant group difference, $ indicates overall significant task difference and # indicates significant task difference within a group. CONCLUSIONS The present study suggests that extensive training in maintaining upright quiet standing may be associated with altered postural control as the SRS solved the challenging nature of the unilateral task by use of a less complexed movement pattern compared to the NSS. However, during the standing shooting task, no correlation was found between the level of performance and the COP dynamics, suggesting that other parameters than the postural control (e.g. aiming accuracy and strategy, mental strength and ability to maintain high concentration) is determining for the performance of SRS at a high level. REFERENCES 1. Ball et al. J Sports Sci. 21: 559-566, 2003. 2. Ko et al. Hum Mov Sci. 55: 255-263, 2017. 3. Baltich et al. Proc Inst Mech Eng H. 229(9), 2015. ACKNOWLEDGEMENTS The authors thank The Danish Sport Shooting Association for helping with subject recruitment.
BODY DISCOMFORT AND TRUNK MUSCLE ACTIVATION DURING A WRITING-TASK ON A
DYNAMOSTOL INCHARGE CHAIR WITH EITHER A STABLE OR UNSTABLE BASE OF SUPPORT
Jens Eg Nørgaard*, Mikkel Jacobi Thomsen, Rogerio Pessoto Hirata, and Thorvaldur Skuli Palsson
Department of Health Science and Technology, Sport Sciences, Aalborg University, Denmark
* Student ([email protected])
INTRODUCTION
Lower back pain (LBP) is the most common work-related
injury and the leading cause of absenteeism from work [1].
Prolonged sitting is proposed to be a risk-factor for the
development of LBP. However, it has recently been shown
that sitting duration alone does not lead to LBP [2]. A
potential factor influencing the level of LBP is the degree of
spinal movement during sitting [3]. Indeed, it has been
hypothesized that chairs with an unstable base of support
may increase spinal motion leading to less muscle fatigue
due to alternating muscle activation [4]. The purpose of the
present study was to compare perceived body discomfort
and trunk muscle activation during a writing task on a
Dynamostol InCharge with either a stable of unstable base
of support.
METHODS
Sixteen healthy subjects (25±1 year, 182.8±6.5 cm, and
82.4±16.9 kg) volunteered to participate in this randomized
cross-over study. Upon arrival to the lab, the subject had
electromyography (EMG) electrodes placed over the
external oblique (EO), internal oblique (IO), rectus
abdominis (RA), superficial lumbar multifidus (LM),
iliocostalis lumborum pars thoracis (ICLT) and thoracic
erector spinae (TES) in accordance to the SENIAM
recommendation. Thereafter, subjects were instructed to
perform the plank for 30 seconds for assessing submaximal
activation of trunk muscles. EMG data during the exercise
was extracted and used for normalization of EMG data
during the typing task with.
The subjects performed two, 10-minute typing tasks;
one performed on a Dynamostol InCharge with a stable base
of support (static), and the other on a Dynamostol InCharge
with an unstable base of support (dynamic). Neither of the
chairs had a backrest. The order in which chair the subjected
sat in first was randomized. During the tests, 5-second
epochs of EMG data were collected each minute to
determine the level of muscle activation. Moreover, the
subjects rated their discomfort using the body part
discomfort scale prior to, half-way through, and upon
completion of the task [5].
The middle 3 seconds of each epoch of raw EMG data from
the typing task were processed using a root-mean-square
algorithm, expressed as %SMVIC.
A repeated measures ANOVA was used to compare
the muscle activity over time for each chair, as well as
comparing the difference of muscle activation between the
chairs.
RESULTS AND DISCUSSION
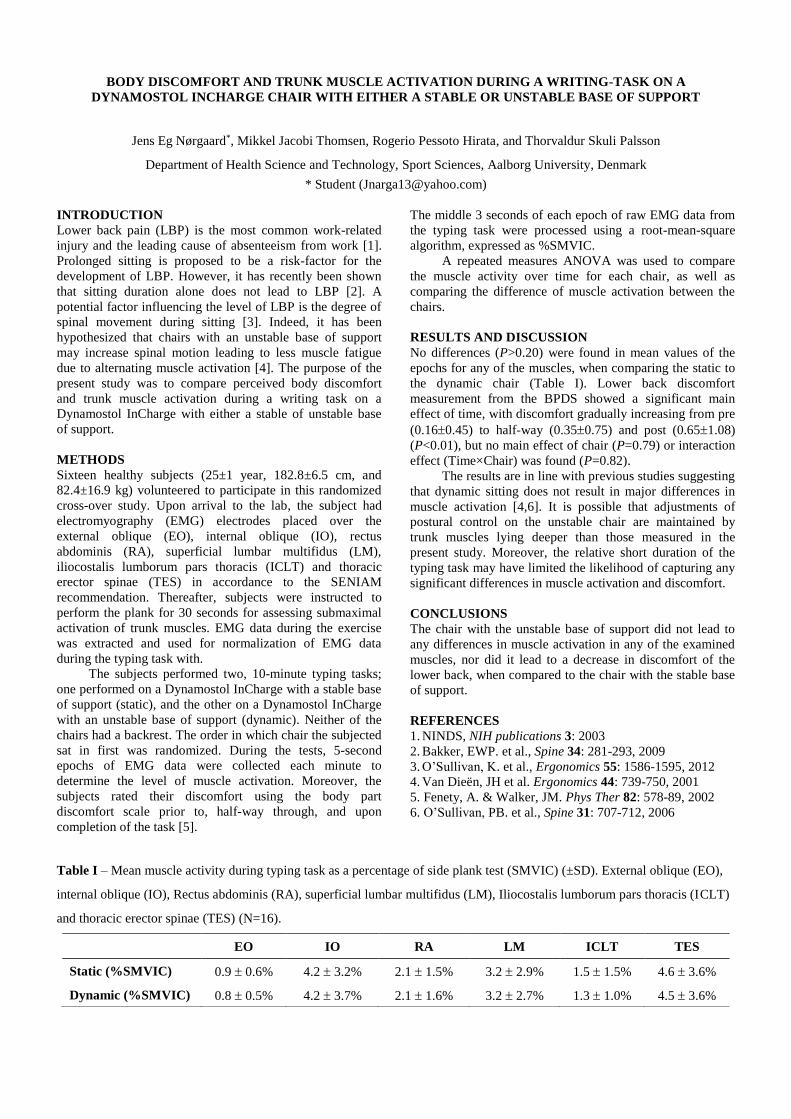
No differences (P>0.20) were found in mean values of the
epochs for any of the muscles, when comparing the static to
the dynamic chair (Table I). Lower back discomfort
measurement from the BPDS showed a significant main
effect of time, with discomfort gradually increasing from pre
(0.160.45) to half-way (0.350.75) and post (0.651.08)
(P<0.01), but no main effect of chair (P=0.79) or interaction
effect (Time×Chair) was found (P=0.82).
The results are in line with previous studies suggesting
that dynamic sitting does not result in major differences in
muscle activation [4,6]. It is possible that adjustments of
postural control on the unstable chair are maintained by
trunk muscles lying deeper than those measured in the
present study. Moreover, the relative short duration of the
typing task may have limited the likelihood of capturing any
significant differences in muscle activation and discomfort.
CONCLUSIONS
The chair with the unstable base of support did not lead to
any differences in muscle activation in any of the examined
muscles, nor did it lead to a decrease in discomfort of the
lower back, when compared to the chair with the stable base
of support.
REFERENCES
1. NINDS, NIH publications 3: 2003
2. Bakker, EWP. et al., Spine 34: 281-293, 2009
3. O’Sullivan, K. et al., Ergonomics 55: 1586-1595, 2012
4. Van Dieën, JH et al. Ergonomics 44: 739-750, 2001
5. Fenety, A. & Walker, JM. Phys Ther 82: 578-89, 2002
6. O’Sullivan, PB. et al., Spine 31: 707-712, 2006
Table I – Mean muscle activity during typing task as a percentage of side plank test (SMVIC) (±SD). External oblique (EO),
internal oblique (IO), Rectus abdominis (RA), superficial lumbar multifidus (LM), Iliocostalis lumborum pars thoracis (ICLT)
and thoracic erector spinae (TES) (N=16).
EO IO RA LM ICLT TES
Static (%SMVIC) 0.9 0.6% 4.2 3.2% 2.1 1.5% 3.2 2.9% 1.5 1.5% 4.6 3.6%
Dynamic (%SMVIC) 0.8 0.5% 4.2 3.7% 2.1 1.6% 3.2 2.7% 1.3 1.0% 4.5 3.6%

ANODAL TRANSCRANIAL DIRECT CURRENT STIMULATION DOES NOT IMPROVE VOLUNTARY
ACTIVATION LEVEL OR MAXIMAL VOLUNTARY CONTRACTION IN QUADRICEPS
Jens Eg Nørgaard*, Mikkel Jacobi Thomsen, Jon Slettum Aaes, Dennis Knudsen, Michael Voigt and Mathias Kristiansen
Department of Health Science and Technology, Sport Sciences, Aalborg University, Denmark
* Student ([email protected])
INTRODUCTION
Anodal transcranial direct current stimulation (a-tDCS), a
non-invasive brain stimulation technique, has previously
been used to increase cortical excitability [1]. Moreover,
a-tDCS has recently been investigated as a potential
ergogenic aid in sports. For instance, maximal voluntary
contraction (MVC) [2,3] has been shown to increase
following stimulation. The mechanisms responsible for the
positive effects of a-tDCS are still widely unknown, but it
has been hypothesized that increases in voluntary activation
levels (VAL) may play a signficant role [2]. The purpose of
this study was therefore to investigate the effects of a-tDCS
on cortical excitability, MVC, and VAL. We hypothesized
that a-tDCS would lead to increases in cortical excitability
resulting in increased MVC due to increased VAL.
METHODS
Nine healthy male participants (25±3 years, 185.0±4.5 cm,
and 89.6±19.4 kg) were recruited for this randomized
sham-controlled experiment. All participants were untrained
and had not performed strength training at least six months
prior to the experiment. The participants reported to the lab
on two separate days, with at least seven days in between,
where they received either a-tDCS or sham-stimulation. At
each test day: 1) baseline cortical excitability, 2) MVC, and
3) VAL were assessed prior to receiving either a-tDCS or
sham-stimulation. Ten minutes post-stimulation cortical
excitability, MVC and VAL were assessed again to evaluate
the effects of the two types of stimulation.
Transcranial magnetic stimulation was used to assess
the cortical excitability of the cortical representation at M1
of the right rectus femoris, by averaging 20 motor evoked
potentials elicited with 120% of the threshold stimulation
intensity. Femoral nerve stimulation was applied to
determine the VAL. A current intensity at two times the
intensity of the Mmax was used. The first stimulation was
applied manually at the plateau of the MVC and the second
stimulation ~5 seconds after the MVC in a relaxed state.
Anodal-tDCS and sham-stimulation was applied through
saline-soaked sponge electrodes (5x7 cm) with the anode
placed over the motor representation of the right rectus
femoris and the cathode centered over the contralateral
deltoid muscle. During the a-tDCS condition, the electrical
current amplitude was ramped up over 30 seconds to 2 mA
and kept constant for 9 minutes and ramped down again over
30 seconds, this procedure was repeated three times
separated by two 5-minute breaks. During the
sham-stimulation the current was ramped up to 2 mA over
30 seconds, and then ramped down over 30 seconds to zero
again followed by 9 min without stimulation. This procedure
was repeated three times with two 5- minute breaks.
Two-way ANOVAs were carried out to assess
differences in the MVC and VAL pre to post a-tDCS or
sham-stimulation. T-tests were carried out to determine the
differences in cortical excitability pre and post a-tDCS and
sham-stimulation.
RESULTS AND DISCUSSION
The results of the present study showed that the cortical
excitability was significantly higher following a-tDCS
(Table I). However, this increase in cortical excitability did
not result in any changes in MVC (P>0.72) or VAL
(P>0.33) (Table 1). The lack of improvements may be due to
a ceiling effect, i.e. further increases in cortical excitability
may not improve recruitment and/or increase firing rates of
motor units in healthy subjects as the M1 may have a
preexisting high excitability. So, if the motor cortex is
pre-exited in healthy subjects further cortical excitation
should have no effect on MVC and VAL [4].
CONCLUSIONS
In conclusion, the a-tDCS protocol applied in the present
study resulted in increased cortical excitability. However,
this increase did not lead to improvements in either MVC or
VAL.
ACKNOWLEDGEMENTS
We would like to thank the participants who volunteered to
participate in the study.
REFERENCES 1. Nitsche, MA, and Paulus, W. J Physiol 527: 633-639, 2000.
2. Krishnan, C. et al., Brain stimul 7: 443-450, 2014.
3. Vargas, VZ. et al., J Strength Cond Res 5: 1336-1341, 2017
4. Lampropoulou, SI and Nowicky, AV Motor control 17: 412-426,
2013
Table I – The average pre and post scores and the percentage differences in motor evoked potentials (MEP), maximal voluntary
contractions (MVC) and voluntary activation levels (VAL) following a-tDCS and sham-stimulation (N=9). *: P<0.05
a-tDCS Sham
Pre Post % ∆ Pre Post % ∆
MEPs (µV) 415.19 366.97 564.06 415.22* 45.53 63.74 484.92 628.99 404.71 405.37 -3.11 20.66
MVC (N) 994.25 237.79 984.28 254.43 -1.60 7.07 1043.1 235.0 1015.0 227.51 -2.33 5.70
VAL (%) 86.04 8.75 87.38 8.71 1.67 4.95 87.21 5.05 86.25 9.14 -1.22 7.60
VARIABILITY OF FOOT STRIKE CHARACTERISTICS IN RUNNERS WITH DIFFERENT SELF-REPORTED RUNNING RELATED INJURIES
Peter C. Raffalt, Maria Neutzner, Thomas Neitmann, Alison N. Agres and Georg N. Duda
Julius Wolff Institute for Biomechanics and Musculoskeletal Regeneration, Charité – Universitätsmedizin Berlin, Berlin, Germany
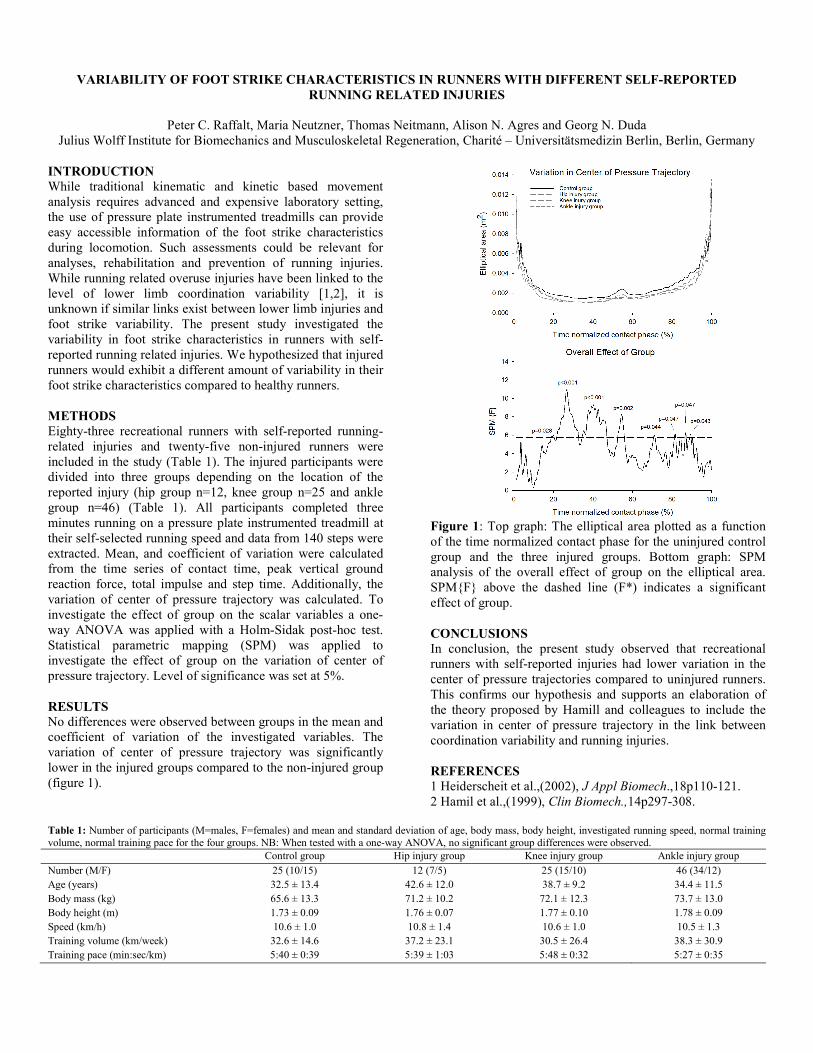
INTRODUCTION While traditional kinematic and kinetic based movement analysis requires advanced and expensive laboratory setting, the use of pressure plate instrumented treadmills can provide easy accessible information of the foot strike characteristics during locomotion. Such assessments could be relevant for analyses, rehabilitation and prevention of running injuries. While running related overuse injuries have been linked to the level of lower limb coordination variability [1,2], it is unknown if similar links exist between lower limb injuries and foot strike variability. The present study investigated the variability in foot strike characteristics in runners with self-reported running related injuries. We hypothesized that injured runners would exhibit a different amount of variability in their foot strike characteristics compared to healthy runners. METHODS Eighty-three recreational runners with self-reported running-related injuries and twenty-five non-injured runners were included in the study (Table 1). The injured participants were divided into three groups depending on the location of the reported injury (hip group n=12, knee group n=25 and ankle group n=46) (Table 1). All participants completed three minutes running on a pressure plate instrumented treadmill at their self-selected running speed and data from 140 steps were extracted. Mean, and coefficient of variation were calculated from the time series of contact time, peak vertical ground reaction force, total impulse and step time. Additionally, the variation of center of pressure trajectory was calculated. To investigate the effect of group on the scalar variables a one-way ANOVA was applied with a Holm-Sidak post-hoc test. Statistical parametric mapping (SPM) was applied to investigate the effect of group on the variation of center of pressure trajectory. Level of significance was set at 5%. RESULTS No differences were observed between groups in the mean and coefficient of variation of the investigated variables. The variation of center of pressure trajectory was significantly lower in the injured groups compared to the non-injured group (figure 1).
Figure 1: Top graph: The elliptical area plotted as a function of the time normalized contact phase for the uninjured control group and the three injured groups. Bottom graph: SPM analysis of the overall effect of group on the elliptical area. SPM{F} above the dashed line (F*) indicates a significant effect of group. CONCLUSIONS In conclusion, the present study observed that recreational runners with self-reported injuries had lower variation in the center of pressure trajectories compared to uninjured runners. This confirms our hypothesis and supports an elaboration of the theory proposed by Hamill and colleagues to include the variation in center of pressure trajectory in the link between coordination variability and running injuries. REFERENCES 1 Heiderscheit et al.,(2002), J Appl Biomech.,18p110-121. 2 Hamil et al.,(1999), Clin Biomech.,14p297-308.
Table 1: Number of participants (M=males, F=females) and mean and standard deviation of age, body mass, body height, investigated running speed, normal training volume, normal training pace for the four groups. NB: When tested with a one-way ANOVA, no significant group differences were observed. Control group Hip injury group Knee injury group Ankle injury group Number (M/F) 25 (10/15) 12 (7/5) 25 (15/10) 46 (34/12) Age (years) 32.5 ± 13.4 42.6 ± 12.0 38.7 ± 9.2 34.4 ± 11.5 Body mass (kg) 65.6 ± 13.3 71.2 ± 10.2 72.1 ± 12.3 73.7 ± 13.0 Body height (m) 1.73 ± 0.09 1.76 ± 0.07 1.77 ± 0.10 1.78 ± 0.09 Speed (km/h) 10.6 ± 1.0 10.8 ± 1.4 10.6 ± 1.0 10.5 ± 1.3 Training volume (km/week) 32.6 ± 14.6 37.2 ± 23.1 30.5 ± 26.4 38.3 ± 30.9 Training pace (min:sec/km) 5:40 ± 0:39 5:39 ± 1:03 5:48 ± 0:32 5:27 ± 0:35

DYNAMICS OF POSTURAL CONTROL IN INDIVIDUALS WITH LATERAL ANKLE SPRAIN
Peter C. Raffalt, Marios Chrysanthou, Georg N Duda and Alison N Agres
Julius Wolff Institute for Biomechanics and Musculoskeletal Regeneration, Charité – Universitätsmedizin Berlin, Berlin, Germany
INTRODUCTION The center of pressure (CoP) trajectory reflects the neuromuscular processes executed to maintain postural control. It has previously been suggested that individuals with ankle instability rely more on visual input to maintain postural control during unilateral stance compared to healthy individuals [1]. The present study tested this notion by assessing the dynamics of CoP trajectory in individuals with previous lateral ankle sprain (LAS) and ankle instability, as well as healthy controls during unilateral stance with and without visual input. We hypothesized that the CoP dynamics of individuals with LAS during unilateral stance with no visual feedback would be characterized by lower regularity, higher dimensionality and shorter time dependency compared to healthy controls. In contrast, the characteristics of the CoP dynamics during unilateral stance with visual input were expected not to differ between groups. METHODS Sixteen individuals with previous LAS (males/females: 9/7, mean±SD age: 30.9±4.7 yrs, body mass: 73.4±11.9 kg and body height: 176.4±9.5 m) and nine healthy controls (CON) (males/females: 7/2, mean±SD age: 29.3±4.5 yrs, body mass: 72.5±11.3 kg and body height: 178.6±11.5 m) performed 30 seconds of shod unilateral stance (on the affected leg for the LAS individuals and preferred leg for the healthy controls) with 1) eyes open (EO) and 2) eyes closed (EC). Anterior-posterior (AP) and mediolateral (ML) CoP trajectories were extracted from the middle 20 seconds of each trial, filtered using a Daubechies wavelet and down sampled to 100Hz. To assess the dynamics of the postural control, three different nonlinear methods were applied to the CoP trajectories: sample entropy to quantify regularity, the correlation dimension (CoD) to quantify dimensionality, and entropic half-life (Ent) to quantify the level of time dependency [2]. To investigate the effect of task (EO vs EC), group (LAS vs CON), and the task-group interaction on the dependent variables, a two way mixed-design ANOVA was applied. In case of an overall effect, a Holm-Sidak post hoc test was applied. Level of significance was set at 5%. RESULTS AND DISCUSSION There was a significant effect of task (p=0.003) and group (p=0.028) on SaEn in the AP direction and a significant interaction (p=0.019) on the SaEn in the ML direction. The post hoc test revealed that CON had a significant lower regularity (higher SaEn) compared to LAS for the eyes open task (p=0.013, Figure 1). There was a significant effect of task (p=0.001) on CoD in the ML direction, indicating that the CoP trajectory during EC had lower dimensionality compared to during EO (Figure 1). There was a significant effect of task (p=0.001) on Ent in the AP direction, indicating that the CoP trajectory during EC had shorter time dependency compared to during EO. There was a significant interaction (p=0.028) on
the Ent in the ML direction. The post hoc test revealed that CON had significantly shorter time dependency (p=0.024) during EO compared to LAS. We could not confirm our hypothesis as we did not observe concomitant group differences in the CoP dynamics during EC and no group differences during EO. The significant effect of visual information for Ent in the AP direction but not in the ML direction suggests that visual feedback plays a more pronounced role for AP postural control.
Figure 1: SaEn (top), CoD (middle), and Ent (bottom) in anterior/posterior and mediolateral direction for unilateral stance with eyes open and eyes closed for the CAI and CON group. $) indicates a significant effect of task, #) indicates a significant effect of group, and *) indicates a significant interaction effect and a significant group difference within a task. CONCLUSIONS The present study did not support the notion that individuals with LAS rely more on visual input during unilateral stance compared to healthy controls. However, higher regularity in the CoP trajectory was observed suggesting that the motor control system of LAS individuals rely on fewer functional degrees of freedom to maintain postural control [3]. REFERENCES 1. Song et al. Med Sci Sports Exerc. 48: 2046-2056, 2016. 2. Federolf, P. Exp Brain Res. 233(12): 3507-3515, 2015. 3. Newell, KM. Erlbaum. 63-84, 1998.

HOW DIFFERENT IS THE NEW BADMINTON SERVE?
John Rasmussen1,* and Mark de Zee2 1Department of Materials and Production, Aalborg University, Fibigerstræde 16, 9220 Aalborg Ø
2Department of Health Science and Technology, Fredrik Bajers Vej 7E, 9220 Aalborg Ø
INTRODUCTION
The International Badminton Federation has imposed new
rules for the serve. In the old rule, the racket head had to be
below the lowest rib at the time of the serve, which favors tall
players because they can launch the shuttle cock from a higher
position than players of shorter statures. In the new rule, the
shuttle cock has to be hit by the racket below a height of
1.15m for any player.
The change of rules have been received differently in
different player populations, so we investigate the statistical
consequences of the new rule in doubles using a
computational model capable of firing an unlimited number
of random serves on which we perform statistical analysis.
The model is calibrated with serves performed by a top-class
player.
METHODS
One top-10 female doubles badminton player was recruited
for the experiment to which she gave informed consent. She
performed a number of serves according to the old and new
rules, respectively, on a court established in the motion
capture lab. The shuttle cock cork was stained with reflective
paint, allowing it to be tracked by a Qualisys Oqus system at
500 Hz.
A computational model of ballistic flight with drag was
developed using 4th order Runge-Kutta time integration [1].
The initial velocity vector of the serves was fed into the
model, which subsequently computed the shuttle cock
trajectory. An optimization routine minimized the difference
between the measured and simulated trajectories by variation
of the aerodynamic properties of the shuttle cock and air, thus
identifying the aerodynamic conditions leading to correct
simulation.
The identified model was subsequently executed 5000 times
from each of the experimentally identified launch heights of
the old and new serves respectively, with randomly varying
launch velocities and angles, but always in directions that
would qualify as “into the T” (Figure 1).
Fig. 1 5000 random serves from 1.21m launch height.
Serves that hit the net or land outside the doubles service box
are discarded. The remaining serves are assessed with respect
to two criteria:
1. The area of the part of the trajectory that is over net
height in the receiver’s court.
2. The time-of-flight from launch until the shuttle is 1m
past the net on the receiver’s side (TF1).
The 100 best serves of the 10,000 performed according to
criterion 1 are selected and assessed with respect to criterion
2.
RESULTS AND DISCUSSION
The experiments show that the test subject launches the serves
from a mean height of 1.21m with the old rule and 1.02m with
the new rule. Out of the 100 best serves according to criterion
1 (Figure 2), 68 are launched from 1.21m and 32 from 1.02m,
verifying that it is possible to perform good serves from both
launch heights, but it is more difficult from the new, lower
height.
Fig. 2 The best 100 serves out of 10,000.
According to criterion 2 (Figure 3), there is a negative
correlation between launch proximity to the net and TF1,
indicating that launch positions further back on the court do
tend to give the receiver more reaction time. However, a few
serves launched from larger distance manage the minimum
TF1 of about 0.2s, because the larger distance also requires
larger launch velocity and enables an initially flatter
trajectory.
Fig. 3 TF1 for the best 100 serves out of 10,000 as a function
of launch position.
CONCLUSIONS
The new serve rule makes it harder but not impossible for the
test subject to perform good serves. The goto launch position
seems to be close to the net, but alternative solutions with
equally good results launched from larger distances are
possible and could be exploited as a tactical variation.
REFERENCES
1. Bray K, et al., J Sports Sc 21: 75–85. 2003.

The effect of Nordic Hamstring Exercise as prevention of hamstring strain injury in physically active - A systematic
review.
Emil Ringtved1,*, Mark Schuster1*, Marcus Banck-Petersen1, Klaus Nørgaard1 and Henrik Koblauch1 1University College Copenhagen, School of Physiotherapy, Carlsbergvej 14, DK-3400 Hillerød
*Student
INTRODUCTION
Hamstring strain injury (HSI) is one of the most common
muscle injuries, appearing in a wide range of sports, with a
high injury occurrence and recurrence, which does not seem
to decrease despite interventions to prevent HSI1. There
appears to be a consensus about eccentric strength training
as a prevention for HSI, which seems to address
morphological factors2,3. This has led to an increased focus
on different exercises and particularly The Nordic
Hamstring exercise (NHE) as an efficient intervention to
decrease injury occurrence.
The purpose of this study was to determine what influence
NHE has on morphological adaptions in the hamstring
muscles in connection to prevention of HSI.
METHODS
This study is a systematic review that aimed to answer the
research question through a systematic review of the
literature. The included studies were based on quantitative
data and our primary outcomes were assessed through
paraclinical examinations. All three studies underwent
“Cochrane risk of bias tool” to assess the internal validity of
the included studies.
To perform a thorough literature search, four databases were
chosen for this study; Pubmed, CINAHL, Cochrane and
PEDro. Beforehand a search profile was made and a
PICO-model was used to ensure a systematic search the
databases (Figure 1)
Fig. 1 The PICO-model that was chosen for the systematic search including
all words that was used for the search.
Inclusion criteria were: RCT-study, use of NHE,
pennationangle, fascicle length or cross-sectional-area as
outcome.
RESULTS AND DISCUSSION
The systematic search identified 828 studies, of which three
where included. Studies were excluded using in- and
exclusion criteria. The quality of the studies where assessed
through the assessment tool, of which one study revealed
“unclear risk of bias”, while the remaining two were
assessed as “low risk of bias”. The results from the present
study indicates, that NHE has a significant positive outcome
on some of the morphological adaption, but not all (Figure
2).
Fig. 2 indicates the results of the three studies on morphological adaptions;
Fascicle length, Angle of pennation, Muscle volume, Average torque angle,
Strength, Neural drive, Muscle stiffness.
CONCLUSIONS
By using NHE as a preventive tool for HSI, some of the
morphological factors associated with HSI can be affected.
NHE is useful as a part of HSI prevention among physical
active adults. However, it doesn’t seem to be able to stand
alone as the only preventive tool addressing HSI.
Furthermore, based on the low number of papers identified
in the present systematic review, we cannot be very
conclusive.
REFERENCES 1. Lovell et al. Hamstring injury prevention in soccer: Before or
after training? 2017
2. Seymore et al. The effect of Nordic hamstring strength training
on muscle architecture, stiffness and strength, 2017
3. Bourne et al. Impact of the Nordic hamstring and hip extension
exercises on hamstring architecture and morphology:
implications for injury prevention, 2016

FREELY CHOSEN FINGER TAPPING FREQUENCY IS INCREASED BETWEEN LIMBS DURING
REPEATED BOUT RATE ENHANCEMENT
Bo Seiferheld* • Søren Bak* • Lasse Knudsen • Ernst A Hansen • Andrew J T Stevenson • Anders Emanuelsen
Sport Sciences, Department of Health Science and Technology, Aalborg University, Denmark.
E-mail: [email protected]. *Student, shared first authorship.
INTRODUCTION
Rhythmic movements such as finger tapping are
suggested to be controlled by spinal central pattern
generators (CPGs) in collaboration with supraspinal
descending input and sensory feedback [1,2]. Previous
findings showed an increase of the freely chosen tapping
frequency in the second of two consecutive bouts of
finger tapping. This phenomenon was termed repeated
bout rate enhancement [3]. The phenomenon was found
when finger tapping was performed with the same hand.
The purpose of the present study was to further
investigate this phenomenon when the contralateral
finger was used in the second bout. It was hypothesized
that 1) the freely chosen frequency in unilateral index
finger tapping was highly correlated between the
dominant and non-dominant hands and 2) a single bout
of tapping would subsequently increase the freely
chosen frequency of the contralateral index finger.
METHODS
32 healthy subjects (20 men and 12 women, 1.79 ± 0.09
m, 80.5 ± 15.8 kg, and 26.1 ± 5.0 years) participated in
two test sessions separated by a three-week washout
period [3]. Each session consisted of two consecutive
three-minute bouts of index finger tapping with a freely
chosen frequency. Bouts were separated by ten minutes
of rest. The participants were randomly counterbalanced
into two groups. One group tapped with the dominant
hand in bout 1 and the non-dominant hand in bout 2 in
the first session. In the second session, the order was
reversed. For the other group, the order was opposite to
that of the first group.
RESULTS
The results showed a significant correlation between the
freely chosen frequency of the two hands in bout 1 (r =
0.86, p < 0.001). In addition, the tapping frequency
increased by 8.2 ± 17.2% (p = 0.041) and 14.1 ± 17.5%
(p < 0.001) when tapping started with the dominant or
non-dominant hand, respectively (Figure 1).
DISCUSSION
Perhaps the phenomenon of repeated bout rate
enhancement occurs as a result of an increased net
excitation of the spinal CPG itself [3,6]. The
contralateral transfer of the tapping frequency could
indicate that the spinal network between limbs is
associated together, as previously proposed [7]. Since
the magnitude of enhancement was similar to what was
previously reported when tapping with the same hand in
both bouts [4,5], a strong connection between the CPGs
is expected. However, changes in supraspinal
descending drive and sensory feedback cannot be
excluded as an explanation.
Fig. 1 Tapping frequency as a function of bout. Grey
representations illustrate individual data. Grand means
are shown as either the blue or red lines for starting with
the dominant or non-dominant hand, respectively.
*Difference from bout 1 to bout 2, p = 0.041.
**Difference from bout 1 to bout 2, p < 0.001.
CONCLUSION
In the present study, we found that 1) the tapping
frequency was highly correlated between hands, and 2)
there was a contralateral transfer of the repeated bout
rate enhancement phenomenon in index finger tapping.
REFERENCES
[1] Shima et al. Conf Proc IEEE Eng Med Biol Soc,
4443-48, 2011
[2] Zehr Exerc Sport Sci Rev, 22:54-60, 2005
[3] Hansen et al. J Mot Behav, 47:365-73, 2015
[4] Mora-Jensen et al. Motor Control, 21:457-67, 2017
[5] Emanuelsen et al. Front Neurosci 12:526, 2018
[6] Finkel et al. J Comp Neurol 522:3437-55, 2014
[7] Stang et al. Front Hum Neurosci 10:36, 2016

Effect of experimental tibialis posterior muscle pain on muscle recruitment: a parametric study
*Morten Bilde Simonsen1,2, AysunYurtsever2,3, Ketill Næsborg-Andersen, Peter Derek Christian Leutscher2, Kim
Hørslev-Petersen4, Rogerio Pessoto Hirata1, Michael Skipper Andersen5.
1 SMI®, Department of Health Science and Technology, Aalborg University, 2Centre for Clinical Research, North Denmark
Regional Hospital, 3Department of Rheumatology, North Denmark Regional Hospital, 4King Christian 10th Hospital for
Rheumatic Diseases, 5Department of Materials and Production, Aalborg University.
*Ph.D. student
INTRODUCTION
Pain and malalignment of the feet are common among
patients with rheumatoid arthritis and over 85% of patients
with rheumatoid arthritis experience painful feet at some
point during the disease. Further, dysfunction of the tibialis
posterior muscle has been reported with a prevalence of 64%
among patients with rheumatoid arthritis [1].
Redundancy in the physiological function between different
muscles gives the central nervous system multiple
possibilities in order to perform the same movement [2].
However, if pain is present, the central nervous system
might choose a compensation strategy that potentially could
lead to further injury [3]. Therefore, in order to recommend
the best treatment for foot pain, in-depth insight into the
complex foot function is crucial. We combined experimental
and computational approaches to investigate which muscles
would compensate during experimentally induced pain in
the tibialis posterior muscle.
METHODS
Twelve healthy subjects participated in the study.
Experimental pain was induced in the tibialis posterior
muscle by injecting 1 mL of hypertonic saline (5.0% NaCL)
at the upper third point of the tibia via an anterior approach
using an ultrasound-guided injection technique [4]. The
participants' gait was captured by motion capture and force
plates and musculoskeletal models created in the Anybody
Modeling System V 7.0.1 (Anybody Technology, Aalborg)
were used to systematically investigate compensation
mechanisms in the lower leg when tibialis posterior was
recruited less as a consequence of the induced pain. The
isometric strength of the tibialis posterior muscle was
systematically reduced to 40, 50, 60, 70, 80 and 90 % of the
default strength.
RESULTS
The mean tibialis posterior muscle force decreased after
simulating the experimental pain by lowering the maximal
isometric force of the tibialis posterior muscle (Fig. 1), and,
at the same time, the force of the flexor digitorum longus
and flexor hallucis longus increased.
DISCUSSION
This study demonstrated that experimental tibialis posterior
muscle pain and simulated reduced tibialis posterior muscle
strength caused altered muscle recruitment and made flexor
digitorum longus and flexor hallucis longus muscles
compensate for the impairment of the tibialis posterior
muscle. The increased muscle force found in the present
study could indicate that alterations in muscle recruitment
and muscle force distribution could be a contributing factor
in the development of toe deformities observed in patients
with rheumatoid arthritis (e.g. hallux valgus, claw toes,
metatarsal instability, and cross-over-toes.). These foot
deformities might be caused when planterflexion and foot
invertion is increasingly performed in the forefoot, via the
flexor digitorum longus and flexor hallucis longus muscles.
Fig. 1 Mean muscle force of selected muscles of the lower
leg for 100, 90, 80, 70, 60, 50 and 40% of default TP muscle
strength
ACKNOWLEDGEMENTS
Trygfonden (grant number 124714) and the Danish
Rheumatism Association supported this study, (grant
number R161-A5276).
REFERENCES
1. Michelson J, et al. Foot ankle Int. 16: 156-161, 1995
2. Kutch and Valero-Cuevas, J Biomech 44: 1264-1270,
2011
3. Fella D., et al., Spine 29: 1436-1440, 2004
4. Rha, et al. Arch Phys. Med. Rehabil 44: 283-287, 2010

INCREASE IN CORTICAL EXCITABILITY ELICITED BY ANODAL TRANSCRANIAL DIRECT CURRENT
STIMULATION DOES NOT AFFECT SELF-PACED CYCLING PERFORMANCE
Mikkel Jacobi Thomsen*, Jens Eg Nørgaard, Dennis Knudsen, Jon Slettum Aaes, Mathias Kristiansen and Michael Voigt
Department of Health Science and Technology, Sport Sciences, Aalborg University,
* Ph.D. student ([email protected])
INTRODUCTION
The non-invasive brain stimulation technique, anodal
trancranial direct current stimulation (a-tDCS), has been
shown to increase cortical excitability [1]. Recently, a-tDCS
has been investigated as a potential ergogenic aid in sports, showing improvements in time to fatigue (TTF) tests
performed at 70-80% of VO2max [2,3] during cycling.
Improved performances were associated with a decreased
rating of perceived exertion (RPE). The purpose of this
study was to investigate the effect of a-tDCS on cortical
excitability and on the performance in two self-paced
cycling tasks, which were: 1) a five-minute RPE-clamp test
and 2) a 250-kJ time trial (TT) (10km). We hypothesized
that a-tDCS would increase cortical excitability and that this
would increase power output (PO) in both the RPE-clamp
and the TT tests and improve TT performance.
METHODS
Twenty healthy, recreational trained participants were
recruited for this counter-balanced sham-controlled
experiment (16 males/4 females, 26±4 years, 181.5±9.9 cm,
83.9±17.9 kg). Eleven of the participants had their cortical
excitability assessed using transcranial magnetic stimulation
(TMS) prior to and following a-tDCS or sham stimulation.
The participants reported to the lab four different days,
separated by at least two days. The first test day served as
familiarization and the following three test days included a
control, sham, and a-tDCS test day, respectively, and were
completed in a randomized order. At all test days, the participants completed a
three-minute warm-up, leading directly to an RPE-clamp
test, where the participants were instructed to bike with an
RPE of 13 on the Borg scale for five minutes. Following a
3-minute break, the participants then performed a 250-kJ TT
as fast as possible. On the a-tDCS and sham test days the
participants underwent the stimulation protocol, followed by
a 10-minute break before any testing was carried out.
Cortical excitability was assessed using TMS, over the
cortical motor representation of the right rectus femoris, by
averaging 20 motor evoked potentials elicited with a
stimulus intensity of 120% of the motor threshold. This was done before and after the a-tDCS and sham stimulation,
respectively. a-tDCS and sham-stimulation was applied
through an anode (4x9cm brass plate over a saline-soaked
sponge) centered over Cz and a similar the cathode (5x7cm)
centered over the right deltoid muscle. During the a-tDCS
the electrical current amplitude was ramped up to 2 mA over
10 seconds and held constant for 13 min before being
ramped down to zero over 10 seconds again. During the sham-stimulation the current was ramped up to 2 mA over
10 s and immediately ramped down again over 10 s to zero
again and then waiting 13 min without stimulation.
One-way ANOVA tests were carried out to assess
differences in performance time, PO, heart rate (HR),
oxygen uptake (VO2) and RPE between conditions. Paired
t-tests were carried out to test for differences in cortical
excitability between pre and post a-tDCS and sham,
respectively.
RESULTS AND DISCUSSION
Significantly larger differences in cortical excitability from pre- to post-stimulation (P=0.01) was found following
a-tDCS (44 ±34%) compared to sham-stimulation (6 ±31%).
However, this increase did not lead to any changes in
performance time, PO, HR, VO2 or RPE in either the
RPE-clamp or TT (P>0.05) (Table I). The lack of
performance improvements may be explained by, that
self-pacing seems to be influenced by muscle sensations and
pain perception. As the cortical image of the homeostatic
afferent pathway is located in the insular cortex [4],
increased cortical excitability of M1 may not lead to
improvements in self-paced exercise performance, as it is seen for externally driven exercise tests [2,3]
CONCLUSIONS
a-tDCS applied over the primary motor cortex for leg
muscles led to increased cortical excitability in these areas.
However, this did not lead to improvements in self-paced
cycling performance in either RPE-clamp or performance
time in TT tests.
REFERENCES 1. Nitsche, MA, and Paulus, W. J Physiol 527: 633-639, 2000. 2. Angius L. et al., Brain Stimul 11: 108–117, 2018. 3. Vitor-Costa M. et al., PLoS One 10: 1–15, 2015. 4. Craig AD, Curr Opin Neurobiol 13: 500–505, 2003.
Table I – The average time trial time (TT Time), power output (PO), heart rate (HR), oxygen consumption (VO2) and rating of perceived
exertion (RPE) during the 250-kJ time trial (N=20).
Time (s) PO (Watt) HR (BPM) VO2 (mL/min) RPE
a-tDCS 1195 ± 361 227 ± 56 166 ± 9 3058 ± 643 16 ± 1
Sham 1182 ± 355 230 ± 60 164 ± 11 2973 ± 1160 16 ± 1
Control 1219 ± 372 223 ± 55 163 ± 11 3003 ± 557 16 ± 1


