Download - Profile Editor - UiO

Profile Editor INF2260 Høst 2014
Kaja Stene, Andreas Kristiansen, Andreas Holskil and Dawood Ahmad
1
Table of Contents
Introduction ............................................................................................................................................................................... 2
Aim ........................................................................................................................................................................................................ 2
Group ................................................................................................................................................................................................... 2
Petrel ................................................................................................................................................................................................... 2
Terminology ..................................................................................................................................................................................... 3
Profile Editor .................................................................................................................................................................................... 4
Relevant literature .................................................................................................................................................................. 5
Research Methods ................................................................................................................................................................... 6
Recruiting Participants ............................................................................................................................................................... 6
Interviews .......................................................................................................................................................................................... 6
Paper Prototyping ......................................................................................................................................................................... 7
Focus Groups .................................................................................................................................................................................... 7
Guerilla Testing .............................................................................................................................................................................. 8
Expert evaluation .......................................................................................................................................................................... 8
High-Fidelity Prototyping .......................................................................................................................................................... 8
Summative Evaluation and Usability Testing .................................................................................................................. 9
Empirical Data and Findings ............................................................................................................................................... 9
Interviews .......................................................................................................................................................................................... 9
Focus Group ................................................................................................................................................................................... 11
Summative Evaluation ............................................................................................................................................................. 13
Analysis ............................................................................................................................................................................................ 15
Findings ........................................................................................................................................................................................... 16
Design ......................................................................................................................................................................................... 16
Discussion and Analysis ...................................................................................................................................................... 18
Scope for Future Work ........................................................................................................................................................ 18
Conclusion ................................................................................................................................................................................ 19
References ................................................................................................................................................................................ 20
2
Introduction
Aim
The aim of our research has been to explore to what extent Petrel can be customized for personal
use, and through this design an interface editor. We will also look into which areas the users will
benefit from customizing, how to balance freedom with constraints and what effects the editor
will have on the Petrel user experience as well as supporting cooperative work.
Group
Table 1: work distribution in group
Group Member Tasks
Andreas Holskil Interviews, paper prototyping, programming, data gathering, analysis, writing, design
Andreas Kristiansen Test leader, paper prototyping, programming, data gathering, analysis, writing, design,
final presentation
Dawood Ahmad Video recordings, user contact
Kaja Stene Interviews, paper prototyping, programming, data gathering, analysis, writing, design,
midterm presentation
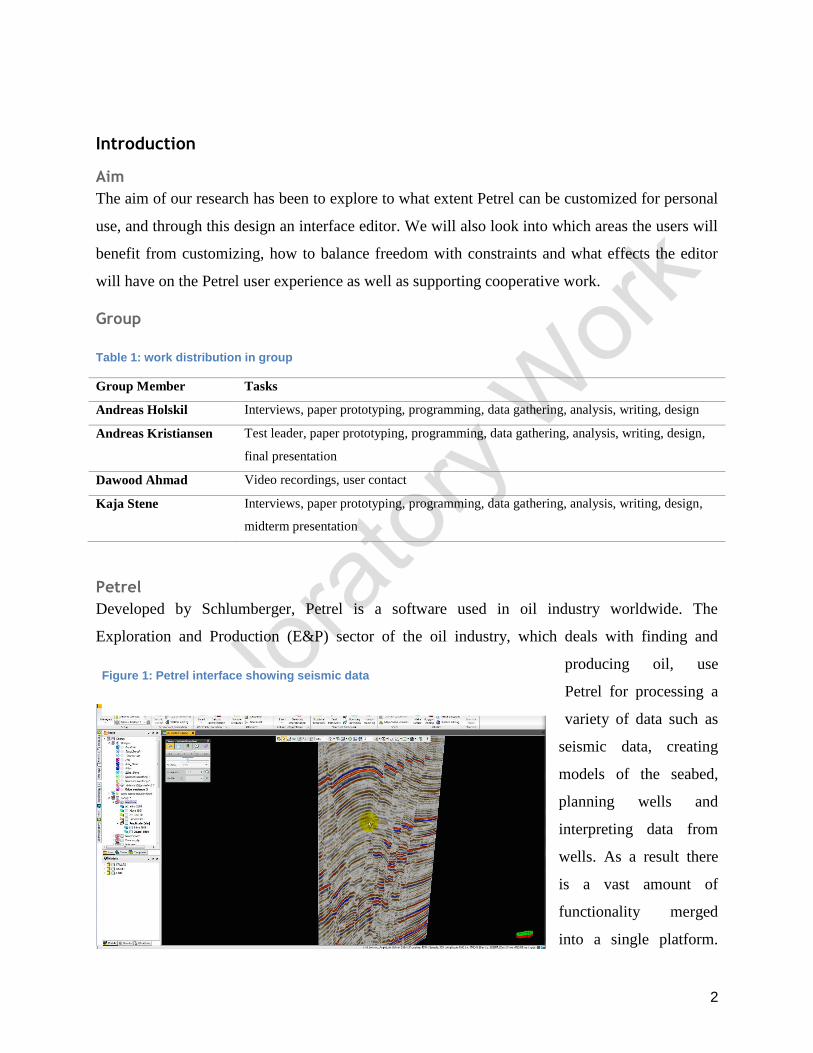
Petrel
Developed by Schlumberger, Petrel is a software used in oil industry worldwide. The
Exploration and Production (E&P) sector of the oil industry, which deals with finding and
producing oil, use
Petrel for processing a
variety of data such as
seismic data, creating
models of the seabed,
planning wells and
interpreting data from
wells. As a result there
is a vast amount of
functionality merged
into a single platform.
Figure 1: Petrel interface showing seismic data
3
Petrel is used by a variety of professions (geologists, well engineers, geophysicists etc.) across
companies worldwide, and there is a large variation geographical, cultural as well as professional
context of users.
Consequently, the interface can be intimidating to new users and difficult to navigate, even for
expert users this can be a hassle. We hope to improve the user experience by letting users
customize the interface and hide information that is not necessary at all times.
Terminology
This section will explain some of the terms used about the interface in the
report.
Because of Petrel’s complexity, the developers introduced perspectives in
the 2014 edition. This feature allowed users to select a perspective based
on the user’s profession. For example, a drilling expert can choose the
perspective name “Drilling”, which includes the relevant functions and
tools while hiding anything else.
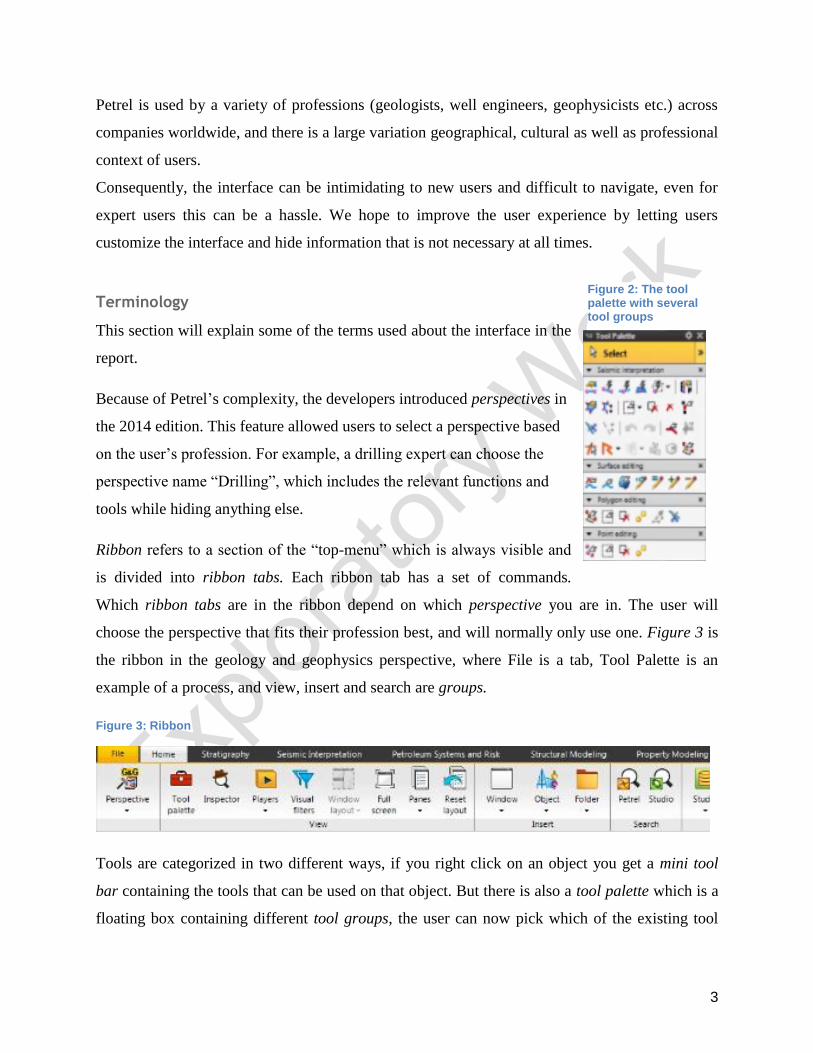
Ribbon refers to a section of the “top-menu” which is always visible and
is divided into ribbon tabs. Each ribbon tab has a set of commands.
Which ribbon tabs are in the ribbon depend on which perspective you are in. The user will
choose the perspective that fits their profession best, and will normally only use one. Figure 3 is
the ribbon in the geology and geophysics perspective, where File is a tab, Tool Palette is an
example of a process, and view, insert and search are groups.
Figure 3: Ribbon
Tools are categorized in two different ways, if you right click on an object you get a mini tool
bar containing the tools that can be used on that object. But there is also a tool palette which is a
floating box containing different tool groups, the user can now pick which of the existing tool
Figure 2: The tool palette with several tool groups
4
groups are shown in the tool palette. Figure 2 shows a tool palette and seismic interpretation is a
tool group.
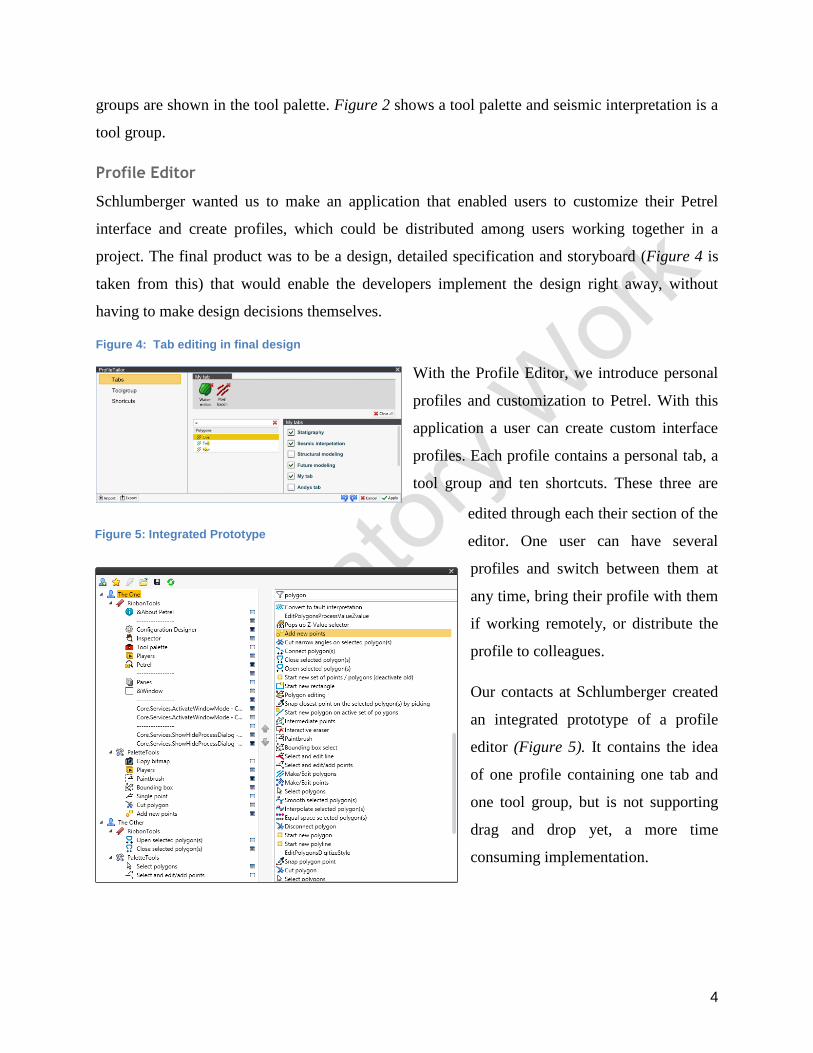
Profile Editor
Schlumberger wanted us to make an application that enabled users to customize their Petrel
interface and create profiles, which could be distributed among users working together in a
project. The final product was to be a design, detailed specification and storyboard (Figure 4 is
taken from this) that would enable the developers implement the design right away, without
having to make design decisions themselves.
With the Profile Editor, we introduce personal
profiles and customization to Petrel. With this
application a user can create custom interface
profiles. Each profile contains a personal tab, a
tool group and ten shortcuts. These three are
edited through each their section of the
editor. One user can have several
profiles and switch between them at
any time, bring their profile with them
if working remotely, or distribute the
profile to colleagues.
Our contacts at Schlumberger created
an integrated prototype of a profile
editor (Figure 5). It contains the idea
of one profile containing one tab and
one tool group, but is not supporting
drag and drop yet, a more time
consuming implementation.
Figure 4: Tab editing in final design
Figure 5: Integrated Prototype
5
Relevant literature
With the Profile Editor, we enable collaborative work through profile sharing, which is made
possible through creating and distributing profile-files. Research on a similar system for sharing
e-mail customization files in an organization (Mackay, 1990) found several patterns of sharing.
Although the study is old, the system for sharing is the same, and so the sharing patterns might
be expected to be similar. She found that customization sharing would become a part of the way
employees helped new people who were unfamiliar with the software, and the more tech-
oriented people would often distribute customization files to the less tech-oriented ones. In our
project is should be a goal to develop a design that encourages not only the most tech-oriented
users to want to create and share files.
However, Mackay researched a customization tool that required a relatively high level of
technical ability, as it was code based. Creating a visual and interactive interface, we hope to
encourage the average Petrel user to customize regardless of interest in software. Newer research
(Weiss & Heidenbluth, 2012) finds that the ability to customize software is to an increasing
extent becoming a requirement when creating new software, and something that users expect.
The ability to customize has a positive effect both on usability and the way the user feels about
the software. Furthermore, they show that removing functionality that is not used is likely to
increase efficiency as well as user satisfaction among people who often customize software
(Weiss & Schweiggert, 2013). We found during the interviews that removing content was one of
the most important goals for the users in being able to customize the software, and is a focus in
the design.
Customization can also affect software learning in a positive way, by adapting software to
different user abilities, skills and learning styles (Weiss & Schweiggert, 2013). Another
application for our design will in training programs, by creating a simplified teaching profile
tailored for a specific training course. This will enable a more gradual introduction to the
interface for beginners. Though we designed mostly for making Petrel more effective for the
expert user, enabling for a less painful training process is another valuable aspect to us.
The application will also to some extent enable mass customization (Kumar, 2007), which would
be used by companies to create their own customized version of a software and distributing the
company profile to their employees. If the particular company work in a specific area, or with a
narrow field, their employees might benefit from using the company profile rather than the

6
custom one, and be saved the time it takes to create a personal profile. But, as Kumar points out,
personalization on an individual basis is only increasing in popularity, and mass customization is
losing terrain as users are more accustomed to highly personalized technologies. This support our
decision to focus on personal profile and leave the idea of company profiles out of the scope of
this project.
Research Methods
This section describes the HCI research methods we have used throughout this project.
Whenever we interacted with participants, a consent form was signed. This form informed about
the project, the study and the participants rights including the treatment of the data gathered.
Recruiting Participants
The branch of Schlumberger located in Oslo is mainly Petrel development and support, so we
had trouble recruiting primary users of the system for requirements gathering as well as
evaluation. As a response to this, we have worked with a small group from the support branch,
some of whom have participated several times. Although we can only support out findings in
data gathered from a small of expert users, software support provide an interesting perspective.
They communicate with users on a daily bases, and have provided insight into different user
groups’ experiences with Petrel. The limited access to primary users also contributed to our
decision to focus on qualitative data gathering.
Interviews
We conducted interviews with three participants from Schlumberger, in order to explore the
scope of our project as well as getting a better understanding of Petrel, how it is used the
terminology and how the users in our group feel about customizing the interface.
Having broken the interface down into five main areas of investigation as listed in table 2, we
chose a semi structured interview form. This enabled us to explore further ideas that came up
while discussing a few main topics with all the interviewees.
The second part of the interview was a demonstration of the software where we asked the
participant to show us a typical workflow while asking some questions about the interface. By
asking the participant questions in their office and letting them demonstrate using their own
7
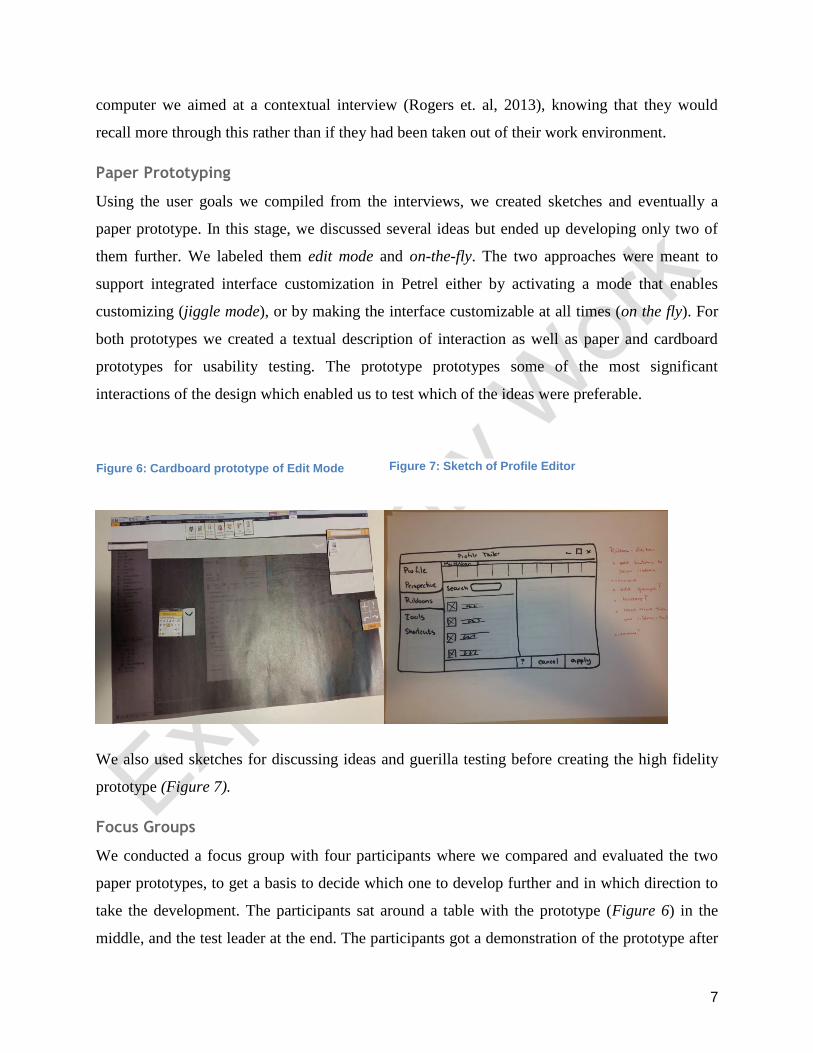
Figure 6: Cardboard prototype of Edit Mode Figure 7: Sketch of Profile Editor
computer we aimed at a contextual interview (Rogers et. al, 2013), knowing that they would
recall more through this rather than if they had been taken out of their work environment.
Paper Prototyping
Using the user goals we compiled from the interviews, we created sketches and eventually a
paper prototype. In this stage, we discussed several ideas but ended up developing only two of
them further. We labeled them edit mode and on-the-fly. The two approaches were meant to
support integrated interface customization in Petrel either by activating a mode that enables
customizing (jiggle mode), or by making the interface customizable at all times (on the fly). For
both prototypes we created a textual description of interaction as well as paper and cardboard
prototypes for usability testing. The prototype prototypes some of the most significant
interactions of the design which enabled us to test which of the ideas were preferable.
We also used sketches for discussing ideas and guerilla testing before creating the high fidelity
prototype (Figure 7).
Focus Groups
We conducted a focus group with four participants where we compared and evaluated the two
paper prototypes, to get a basis to decide which one to develop further and in which direction to
take the development. The participants sat around a table with the prototype (Figure 6) in the
middle, and the test leader at the end. The participants got a demonstration of the prototype after
8
which they could play with it by dragging buttons around, while the test leader changed screens
and explained what happened, like when using the “Wizard of Oz” approach (Rogers et. al.,
2013). Finally, the test leader opened a discussion with thinking aids in form of pen and paper.
The focus group was captured on audio recording in addition to two observers taking notes. The
results are grouped according to topic and discussed in empirical data and findings section.
Guerilla Testing
Throughout the project, every time we have had a new sketch or changed something in the
design, we have tried to do informal tests. This sometimes involves just showing a sketch to
someone in the hallway asking “what does this look like?” or “what do you think that button
does?”. When we had any disagreement in within the design group, we conducted a guerilla test
(Toftøy-Andersen&Wold).
We also had the opportunity to test our new design with a student from the faculty of geology,
who were familiar with Petrel, just before we started programming the high fidelity prototype.
Through this quick way of getting feedback on a design question, we have saved a lot of time
and settled many disagreements in the making of both low and high fidelity prototypes.
Expert evaluation
Whenever we had made some progress, or at least every other week, we sought advice from our
contact at Schlumberger. Here we presented the design we had and the findings we made from
the latest data gathering activity, to get some feedback or constructive criticism. The insight
gained from these sessions were invaluable, and really kickstarted further progress.
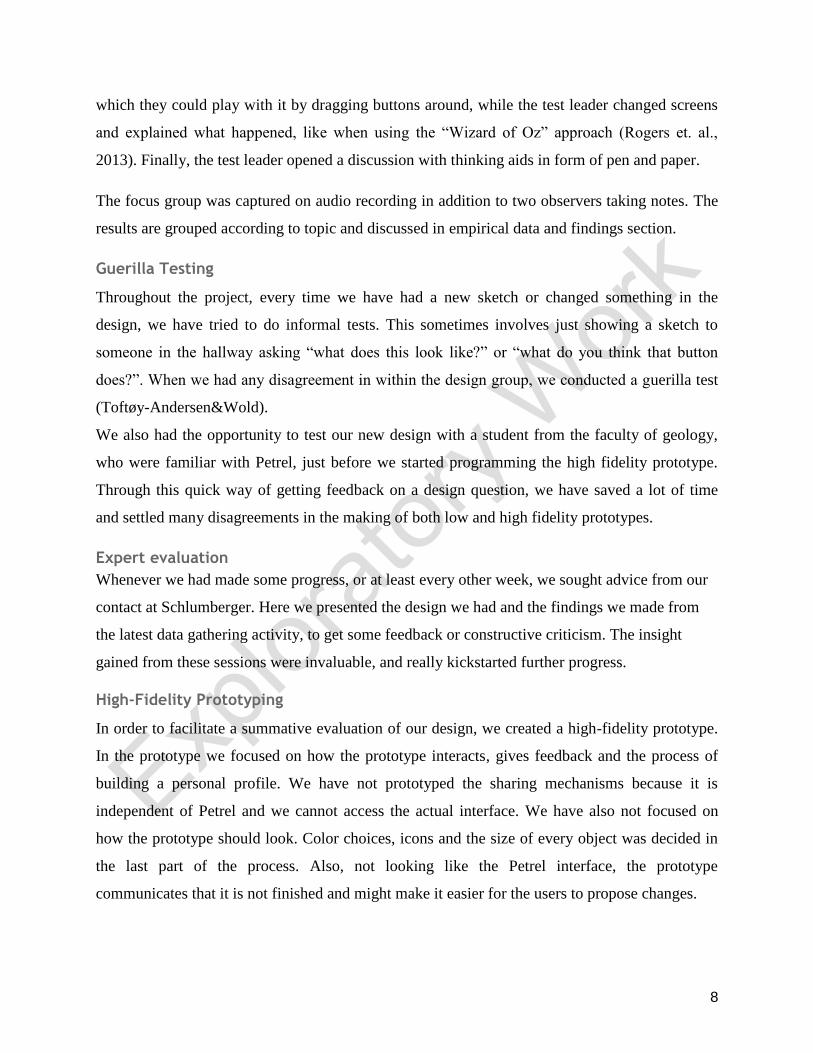
High-Fidelity Prototyping
In order to facilitate a summative evaluation of our design, we created a high-fidelity prototype.
In the prototype we focused on how the prototype interacts, gives feedback and the process of
building a personal profile. We have not prototyped the sharing mechanisms because it is
independent of Petrel and we cannot access the actual interface. We have also not focused on
how the prototype should look. Color choices, icons and the size of every object was decided in
the last part of the process. Also, not looking like the Petrel interface, the prototype
communicates that it is not finished and might make it easier for the users to propose changes.
9
Summative Evaluation and Usability Testing
Using our high fidelity prototype we designed a usability test aiming to find out . The
participants were assigned to a computer with a running prototype, and was to perform a set of
tasks that we had prepared. The participants were encouraged to think aloud during the test, the
test leader could not help them if they had trouble, unless the participant got completely stuck.
After the test they filled out a questionnaire, before the test leader conducted an unstructured
interview where the participants could share their thoughts on the interface, its interactivity, the
aesthetics, and what changes could be made.
The usability testing involved video and audio recording of the participants while they performed
given tasks. The video was captured through the webcam on the test computers. At the same
time, the screen was captured so the users interaction with the prototype could be well
documented, including pointer operations. Through this we could analyse the recordings and
determine whether there were moments of confusion and exactly what the user was doing at that
time.
Empirical Data and Findings
Interviews
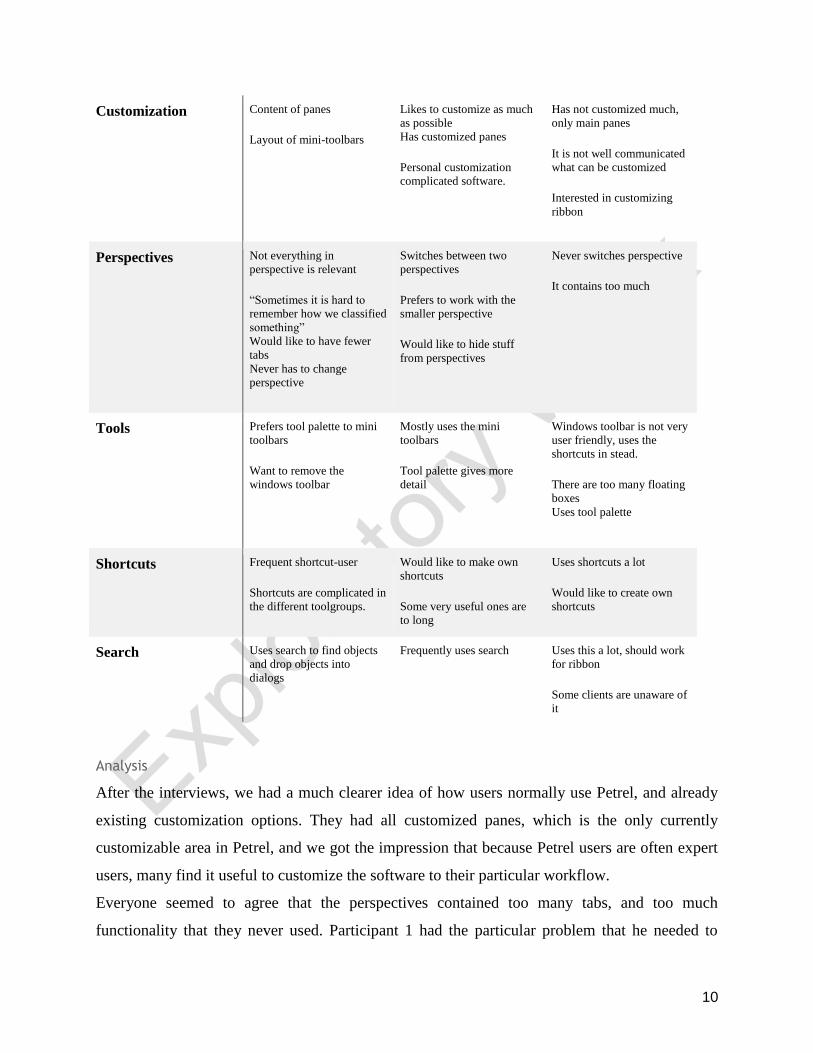
Table 2: Interview data coded according to topic
Topic Pilot Participant 1 Participant 2
Figure 8: hi-fi prototype tabs view Figure 9: hi-fi prototype shortcuts view
10
Customization Content of panes Layout of mini-toolbars
Likes to customize as much
as possible Has customized panes Personal customization
complicated software.
Has not customized much,
only main panes It is not well communicated
what can be customized Interested in customizing
ribbon
Perspectives Not everything in
perspective is relevant “Sometimes it is hard to
remember how we classified
something” Would like to have fewer
tabs Never has to change
perspective
Switches between two
perspectives Prefers to work with the
smaller perspective Would like to hide stuff
from perspectives
Never switches perspective It contains too much
Tools Prefers tool palette to mini
toolbars Want to remove the
windows toolbar
Mostly uses the mini
toolbars Tool palette gives more
detail
Windows toolbar is not very
user friendly, uses the
shortcuts in stead. There are too many floating
boxes Uses tool palette
Shortcuts Frequent shortcut-user Shortcuts are complicated in
the different toolgroups.
Would like to make own
shortcuts Some very useful ones are
to long
Uses shortcuts a lot Would like to create own
shortcuts
Search Uses search to find objects
and drop objects into
dialogs
Frequently uses search Uses this a lot, should work
for ribbon Some clients are unaware of
it
Analysis
After the interviews, we had a much clearer idea of how users normally use Petrel, and already
existing customization options. They had all customized panes, which is the only currently
customizable area in Petrel, and we got the impression that because Petrel users are often expert
users, many find it useful to customize the software to their particular workflow.
Everyone seemed to agree that the perspectives contained too many tabs, and too much
functionality that they never used. Participant 1 had the particular problem that he needed to
11
change between two perspectives. Ribbon-tabs seems to be one of the most important things to
customize.
The greatest difference between our participants was in how they preferred to use tools,
participant 1 preferring the mini toolbars which have been common in the old versions, whereas
the pilot participant and participant 2 used the tool palette.
All of the participants were frequent shortcuts users, and would like to map their own shortcuts.
In addition, the pilot participant and participant 2 expressed a wish to hide the windows toolbar
as they only use the shortcuts for these commands.
Findings
After the interviews we focused the scope of our project to a number of functions we wanted to
include in the design.
pin and attach dialogues
hide irrelevant information (windows toolbar, panes, icons, tabs)
customize ribbons
change windows layout
change keyboard shortcuts
not have to switch between perspectives
chose to show search
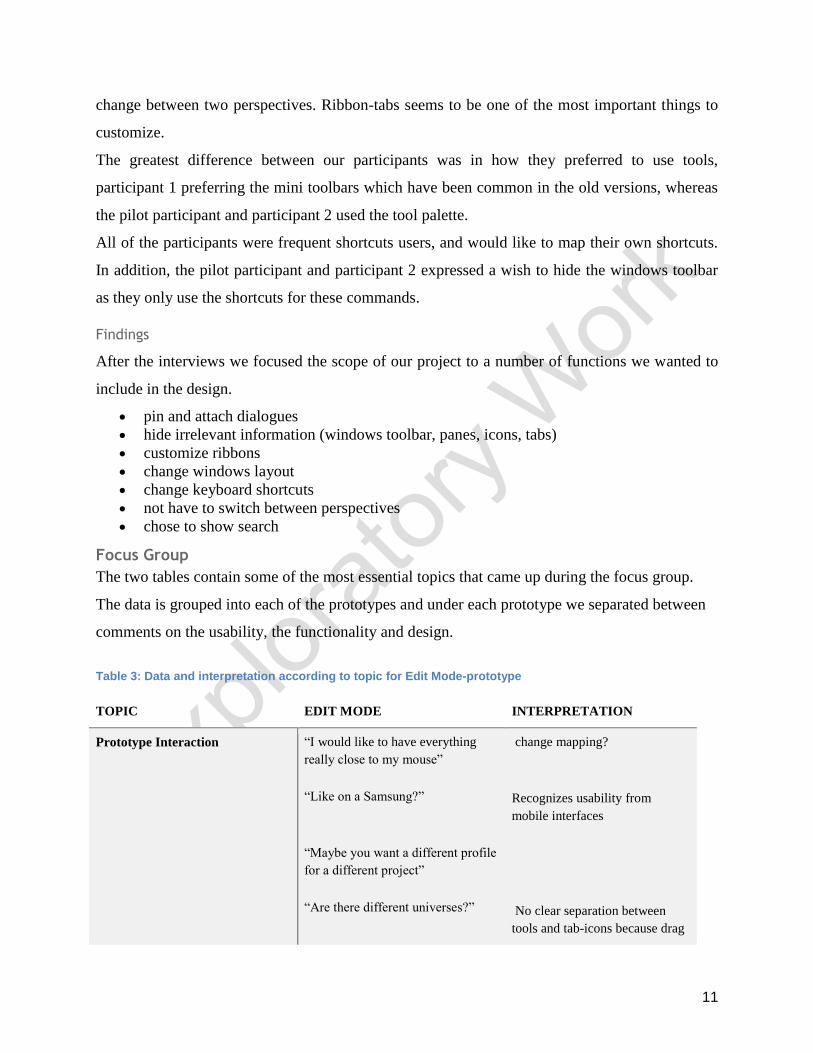
Focus Group
The two tables contain some of the most essential topics that came up during the focus group.
The data is grouped into each of the prototypes and under each prototype we separated between
comments on the usability, the functionality and design.
Table 3: Data and interpretation according to topic for Edit Mode-prototype
TOPIC EDIT MODE INTERPRETATION
Prototype Interaction “I would like to have everything
really close to my mouse”
“Like on a Samsung?”
“Maybe you want a different profile
for a different project”
“Are there different universes?”
change mapping?
Recognizes usability from
mobile interfaces
No clear separation between
tools and tab-icons because drag
12
and drop breaks down barriers
Functions
“It would be nice to have a history
list of undo-actions”
Action-history
Look-and-feel “Can you open the eye?”
“How do I get out of the edit
mode?”
“It would be nice to have some
subcategories in here”
Ambiguous eye-symbols
The done-button should be more
visible.
Categorize hidden field.
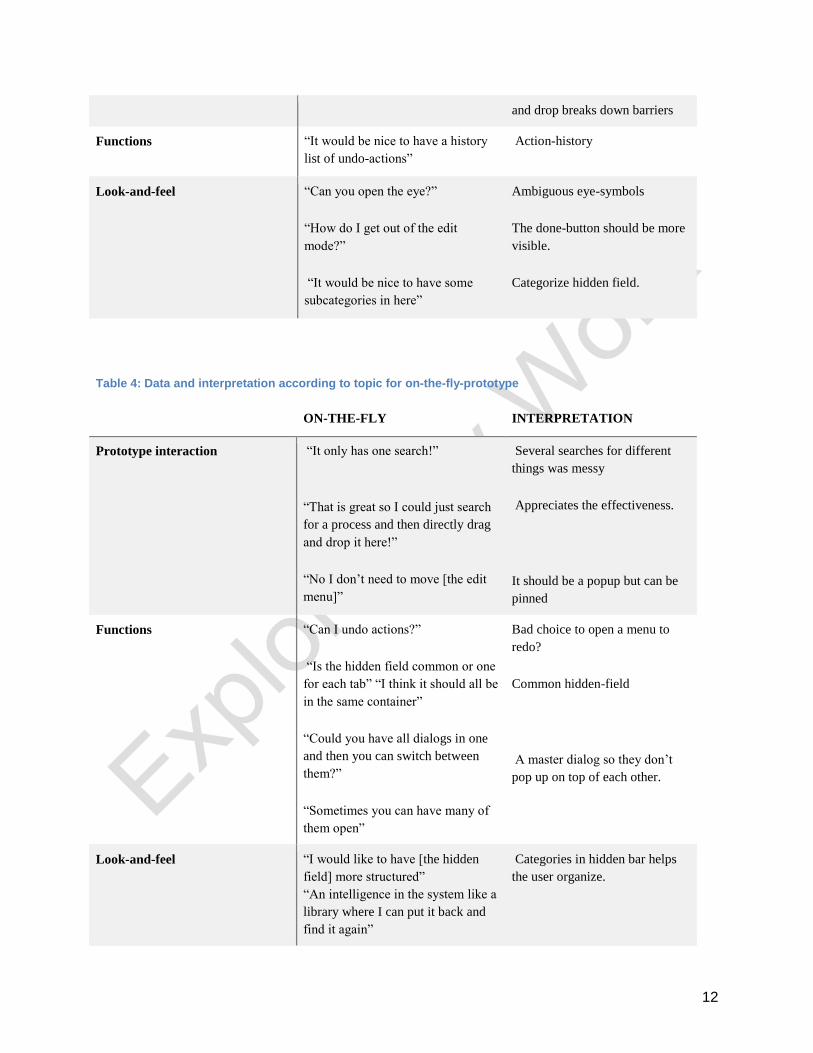
Table 4: Data and interpretation according to topic for on-the-fly-prototype
ON-THE-FLY INTERPRETATION
Prototype interaction “It only has one search!”
“That is great so I could just search
for a process and then directly drag
and drop it here!”
“No I don’t need to move [the edit
menu]”
Several searches for different
things was messy
Appreciates the effectiveness.
It should be a popup but can be
pinned
Functions
“Can I undo actions?”
“Is the hidden field common or one
for each tab” “I think it should all be
in the same container”
“Could you have all dialogs in one
and then you can switch between
them?”
“Sometimes you can have many of
them open”
Bad choice to open a menu to
redo?
Common hidden-field
A master dialog so they don’t
pop up on top of each other.
Look-and-feel “I would like to have [the hidden
field] more structured”
“An intelligence in the system like a
library where I can put it back and
find it again”
Categories in hidden bar helps
the user organize.
13
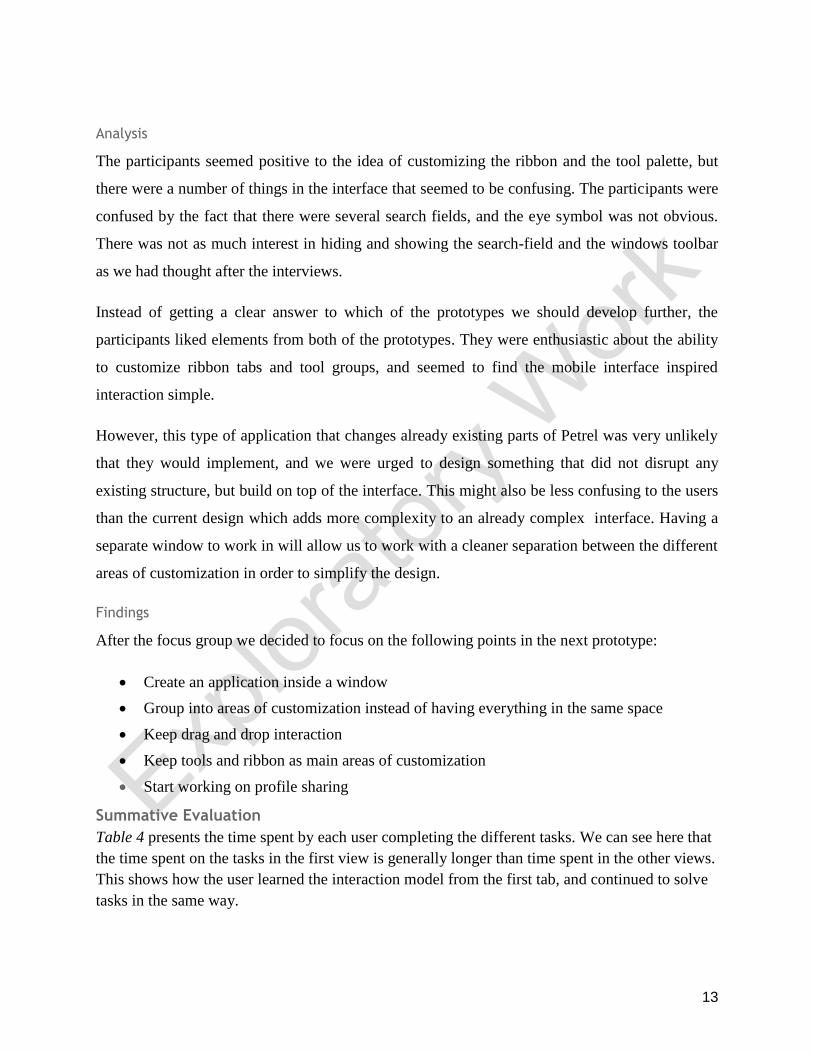
Analysis
The participants seemed positive to the idea of customizing the ribbon and the tool palette, but
there were a number of things in the interface that seemed to be confusing. The participants were
confused by the fact that there were several search fields, and the eye symbol was not obvious.
There was not as much interest in hiding and showing the search-field and the windows toolbar
as we had thought after the interviews.
Instead of getting a clear answer to which of the prototypes we should develop further, the
participants liked elements from both of the prototypes. They were enthusiastic about the ability
to customize ribbon tabs and tool groups, and seemed to find the mobile interface inspired
interaction simple.
However, this type of application that changes already existing parts of Petrel was very unlikely
that they would implement, and we were urged to design something that did not disrupt any
existing structure, but build on top of the interface. This might also be less confusing to the users
than the current design which adds more complexity to an already complex interface. Having a
separate window to work in will allow us to work with a cleaner separation between the different
areas of customization in order to simplify the design.
Findings
After the focus group we decided to focus on the following points in the next prototype:
Create an application inside a window
Group into areas of customization instead of having everything in the same space
Keep drag and drop interaction
Keep tools and ribbon as main areas of customization
Start working on profile sharing
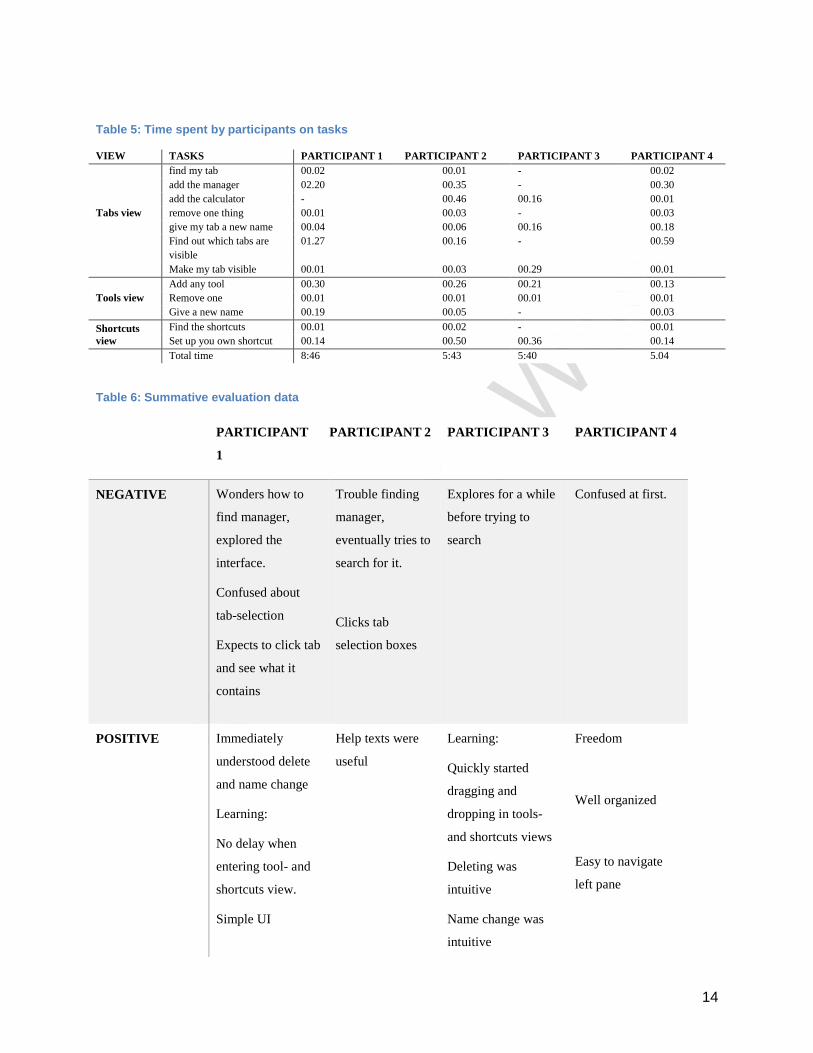
Summative Evaluation
Table 4 presents the time spent by each user completing the different tasks. We can see here that
the time spent on the tasks in the first view is generally longer than time spent in the other views.
This shows how the user learned the interaction model from the first tab, and continued to solve
tasks in the same way.
14
Table 5: Time spent by participants on tasks
VIEW TASKS PARTICIPANT 1 PARTICIPANT 2 PARTICIPANT 3 PARTICIPANT 4
find my tab 00.02 00.01 - 00.02
add the manager 02.20 00.35 - 00.30
add the calculator - 00.46 00.16 00.01
Tabs view remove one thing 00.01 00.03 - 00.03
give my tab a new name 00.04 00.06 00.16 00.18
Find out which tabs are
visible
01.27 00.16 - 00.59
Make my tab visible 00.01 00.03 00.29 00.01
Add any tool 00.30 00.26 00.21 00.13
Tools view Remove one 00.01 00.01 00.01 00.01
Give a new name 00.19 00.05 - 00.03
Shortcuts
view
Find the shortcuts 00.01 00.02 - 00.01
Set up you own shortcut 00.14 00.50 00.36 00.14
Total time 8:46 5:43 5:40 5.04
Table 6: Summative evaluation data
PARTICIPANT
1
PARTICIPANT 2 PARTICIPANT 3 PARTICIPANT 4
NEGATIVE Wonders how to
find manager,
explored the
interface.
Confused about
tab-selection
Expects to click tab
and see what it
contains
Trouble finding
manager,
eventually tries to
search for it.
Clicks tab
selection boxes
Explores for a while
before trying to
search
Confused at first.
POSITIVE Immediately
understood delete
and name change
Learning:
No delay when
entering tool- and
shortcuts view.
Simple UI
Help texts were
useful
Learning:
Quickly started
dragging and
dropping in tools-
and shortcuts views
Deleting was
intuitive
Name change was
intuitive
Freedom
Well organized
Easy to navigate
left pane
15
SUGGESTIONS Highlight my tab in
tab selection
Scrollbar in search
More specific
help-texts
Categories search
More freedom
(change
shortcuts)
Undo redo should
be connected to
view.
Clear all in tools
and tabs
Wants more
freedom (making
shortcuts, change
existing tabs)
Change help
function to
standard Petrel (?)
COMMENTS
AND
OBSERVATIONS
I want to make a
tab that is a mix of
two tabs
Uses categories
search
Visual/textual
users will react
differently to
interface.
Sees use for
Petrel training
with single tab.
Silent through test.
Would like to use
this
“As often in Petrel,
the small things
make a big
difference”
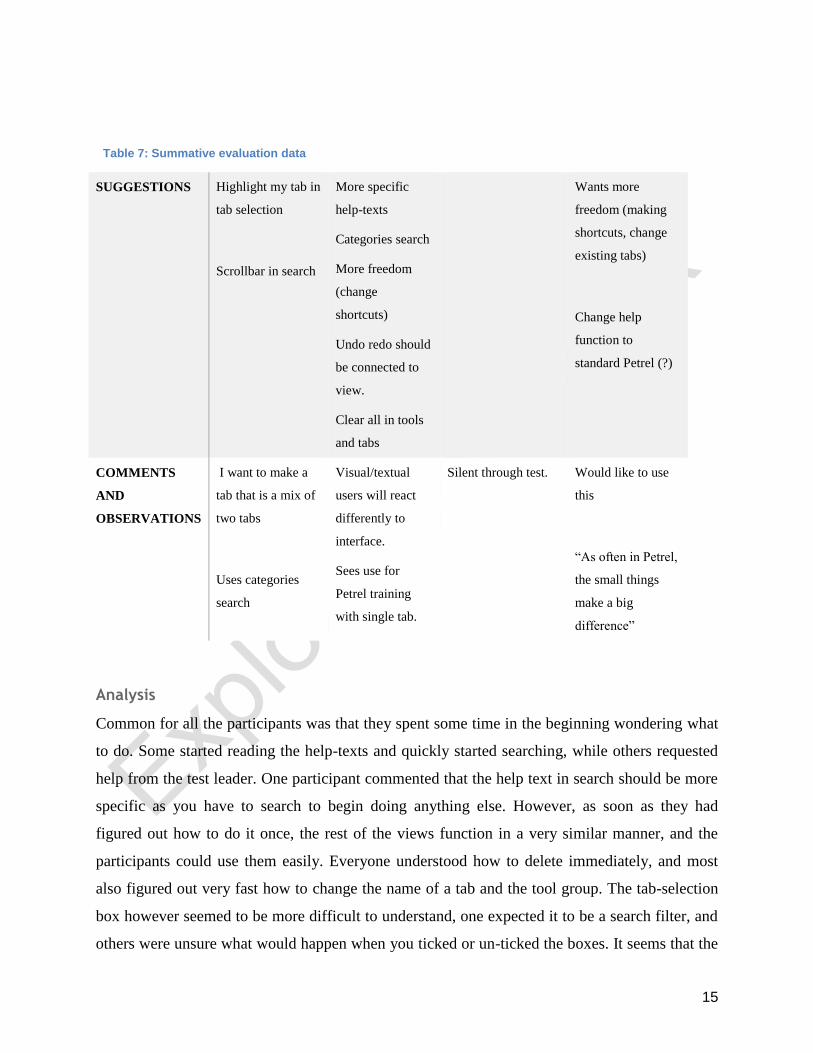
Analysis
Common for all the participants was that they spent some time in the beginning wondering what
to do. Some started reading the help-texts and quickly started searching, while others requested
help from the test leader. One participant commented that the help text in search should be more
specific as you have to search to begin doing anything else. However, as soon as they had
figured out how to do it once, the rest of the views function in a very similar manner, and the
participants could use them easily. Everyone understood how to delete immediately, and most
also figured out very fast how to change the name of a tab and the tool group. The tab-selection
box however seemed to be more difficult to understand, one expected it to be a search filter, and
others were unsure what would happen when you ticked or un-ticked the boxes. It seems that the
Table 7: Summative evaluation data

16
interface is intuitive to use as soon as you can get over the first barrier of how to start, and if we
can help the user start the usability could be very good.
All of the participants commented that it looked very little like Petrel, and spent a lot of time on
things we had just not implemented such as what happens when you click apply, scrolling in the
search field. These things might have taken the attention away from the things that were
implemented and perceived as bad design rather than unfinished prototype, which is a
disadvantage of high fidelity prototyping.
Although the time spent on completing the assigned tasks are included in the table, it might not
be a good measure of how well the user understood the interface. Whereas one user very
efficiently completed her tasks, another was more explorative and tried everything she could
think of, whereas a third started a discussion with the test leader in the middle of testing.
The participants also had a number of suggestions to further development of the design, and
interesting comments to look into. For example adding a “clear all” button to the tool group and
the tab could be included right away. The help-functionality can be the way that is common in
Petrel where small question marks that you can hover over and opens a small text box. We also
realized that the tab-selection box needed more explanation.
Findings
To sum up main findings in the evaluation which we will address in the design.
It is hard to get started the user has to search before doing anything else
Having figured out how to interact with one view, they easily solved tasks in the other
views.
The help texts disappeared to fast, it could be useful to have question marks, the standard
in Petrel
A “clear all” function could be useful in tabs and tool groups
All participants answered they would create a profile if the tool was made available
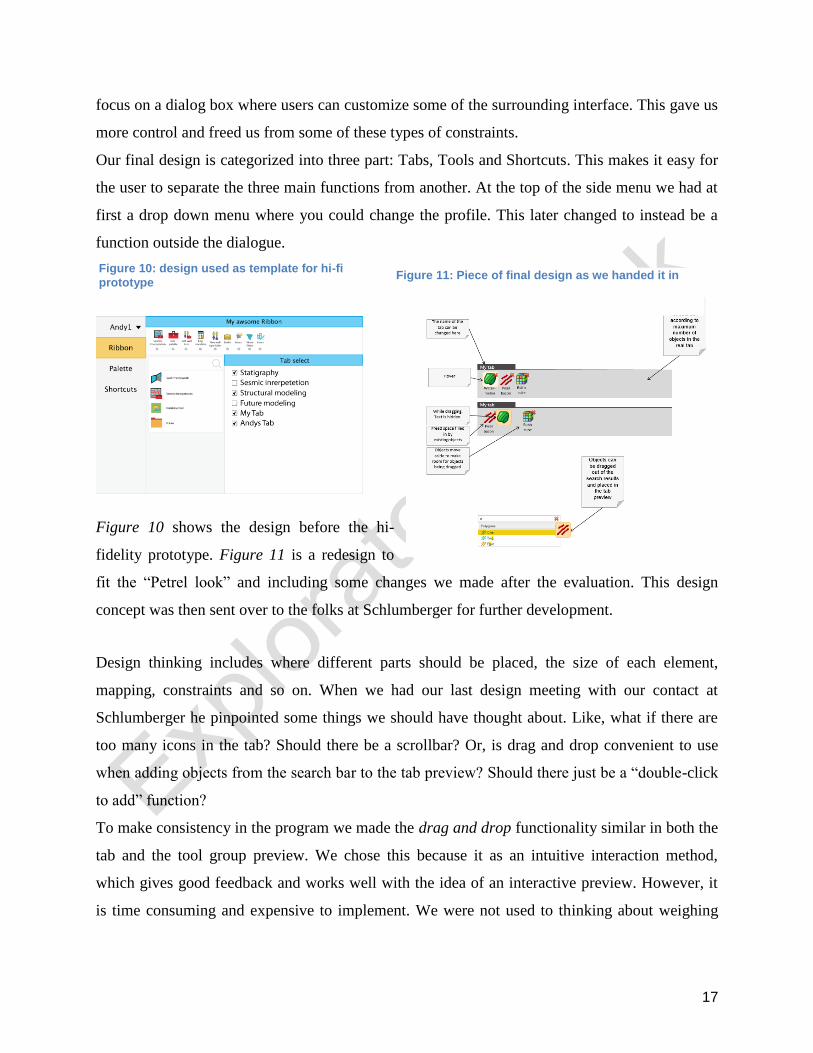
Design
At first we designed two different concepts. These were edit mode and on-the-fly. Both these
concepts were designed to be implemented in Petrels core, not as an add-on. This was difficult to
do since many parts of the interface, like the ribbon, where third-party software that could not be
changed or customized in the way we wanted. Therefore we decided, with help of our contact, to
17
Figure 10: design used as template for hi-fi
prototype
focus on a dialog box where users can customize some of the surrounding interface. This gave us
more control and freed us from some of these types of constraints.
Our final design is categorized into three part: Tabs, Tools and Shortcuts. This makes it easy for
the user to separate the three main functions from another. At the top of the side menu we had at
first a drop down menu where you could change the profile. This later changed to instead be a
function outside the dialogue.
Figure 10 shows the design before the hi-
fidelity prototype. Figure 11 is a redesign to
fit the “Petrel look” and including some changes we made after the evaluation. This design
concept was then sent over to the folks at Schlumberger for further development.
Design thinking includes where different parts should be placed, the size of each element,
mapping, constraints and so on. When we had our last design meeting with our contact at
Schlumberger he pinpointed some things we should have thought about. Like, what if there are
too many icons in the tab? Should there be a scrollbar? Or, is drag and drop convenient to use
when adding objects from the search bar to the tab preview? Should there just be a “double-click
to add” function?
To make consistency in the program we made the drag and drop functionality similar in both the
tab and the tool group preview. We chose this because it as an intuitive interaction method,
which gives good feedback and works well with the idea of an interactive preview. However, it
is time consuming and expensive to implement. We were not used to thinking about weighing
Figure 11: Piece of final design as we handed it in

18
cost of implementation against usability gains, our conversations with Lucas about this was one
of the most valuable lessons for us on this project.
We chose to change the searchbar to a field containing all relevant commands or tools and a
filter field, which filters the content. This aims to solve the problem of users opening the window
and not realizing what to do, but gives a number of icons that are interactive. We have not spent
much time on describing the functionality of the filter, as it already exists in other parts of the
software and should look and function exactly the same.
The side menu is put there to give good visibility of what the program does. When you click on
something you immediately get feedback in form of changing color. The left hand menu is a
good example of this, when you click “Tabs” the tab customization comes on the right side and
the tab button is highlighted in yellow.
Discussion and Analysis
In the relevant literature section we discuss how allowing for customization will often improve
the user experience of a software. Though we had participants test our application, it did not at
the time create a profile, and we have not had the ability to research how this will affect their
daily work.
The participants in our evaluation reported that they would like to use this if it was available in
order to customize their own profile. But in a lot of ways they are super-users as they are
working with support and not primarily with tasks in the software.
We did not have the ability to test how sharing of profiles would be used, but it would be
interesting to find whether it would form similar patterns to the ones found by Mackey. Would
user prefer a more general customization distributed by a colleague or the company or spend the
time to create a personal profile like Kumar predicts is becoming the norm.
Scope for Future Work
If we had the time to work more on the project, it would have been interesting to explore further
how profiles was used if it was tested by a group of people over some time. Would it be
something that everyone started doing, or only for users with a particular interest in
customization? Would few distribute profiles to many like in Mackays case, or would sharing be
both ways? Would it actually increase efficiency? One way to do this would be to introduce the
profile editor to one workplace and conduct a case study focusing on patterns of sharing.

19
We designed the left pane of the application to contain only three views, but in a way so that
more can easily be added and one could select other parts of Petrel to customize. The next area
of Petrel that would be interesting to focus on is how you could customize is the “look-and-feel”
of the interface. For instance, one could change the background which appears when Petrel is
opened, This would probably not be of as much value for the individual user as for companies
who could create their company profile of Petrel. Perhaps you could even have a super-editor for
the company who could create super-profiles?
Throughout our project we have discussed ways of sharing files and working together with Petrel
customization through profile sharing. We have designed for importing and exporting files. This
involves the extra step of moving outside the application in order to send files. If we had the
chance to work further with this project, it would be very interesting too work with a cloud
sharing of profiles. In this way sharing and cooperation could become a more natural and
integrated part of daily workflow.
Conclusion
Having studied the options for customizability on Petrel, we have made several interesting
observations leading to our final design for the Profile Editor. The Profile Editor lets the users
create a personal profile containing a customized ribbon, a custom tool group as well as ten
custom shortcuts. If implemented, this would hopefully improve the user experience of Petrel by
minimizing clutter, and functionality which is irrelevant to the user.
20
References
Kumar, A., 2007. From mass customization to personalization: a strategic transformation. Springer
Science+Business Media, Volume 19, pp. 533-547.
Lazar, J., Feng, J. F. & Hochheiser, H., 2010. Research Methods in Human Computer Interaction. United
Kingdom: Wiley.
Mackay, W. E., 1990. Patterns of Sharing Customizable Software. CSCW 90 Proceedings, pp. 209-220.
Rogers, Y., Sharp, H. & Preece, J., 2013. Interaction Design: beyond human computer interaction. 3rd
ed. Chichester: Wiley.
Toftøy-Andersen, E. & Wold, J. G., 2011. Praktisk Brukertesting. 1st ed. Oslo: Cappelen akademisk.
Weiss, M. & Frans Schweiggert, 2013. Opportunities and Challenges of Software Customization. ACEEE
International Journal of Infomation Technology, pp. 1-11.
Weiss, M. & Heidenbluth, N., 2012. A Two-Dimensional Overall Software Customization Classification
and Visualisation. s.l., s.n.


