
PRODUCTION CHEMICAL APPLICATIONS: USING ANALYTICAL DATA TO MONITOR AND OPTIMIZE
CHEMICAL TREATMENTS Becky L. Ogden
Multi-Chem—A Halliburton Service
ABSTRACT
Advancing technology has enabled the oil and gas industry to analyze and track constituents in fluid samples.
However, without proper sampling, appropriate laboratory procedures, and correct interpretations of such analyses,
these data could be erroneous and result in costly and unnecessary actions. Through proper analytical sampling,
testing, and understanding of these results, operators can monitor and optimize chemical applications.
This paper discusses the following:
- Common analytical testing performed within the oil and gas production chemical industry
- Identification of critical hold-points within these procedures
- Common general rules for the identification of possible anomalies during such analyses
- How these tests can be applied to assist optimization of chemical applications
Key Words: analytical, anomalies, interpretation, results, optimization, chemical applications
INTRODUCTION
Within the oil and gas industry, well fluids are sampled and analyzed for a variety of purposes, ranging from general
knowledge analyses to determining the economic viability of a well or field. Considerable costs can be associated
with well treatments based on data incorrectly sampled, handled, or interpreted. Such treatments might not have
been necessary. Ensuring proper handling of samples and correct interpretation of the results helps provide
confidence in the analytical testing results and the application of these results during the chemical treatment of a
well.
Chemicals can help minimize disruptions during the lifecycle of a well, reduce well or pipeline corrosion rates,
enhance oil and water separation, reduce the amount of solids in wellbore fluids, and control micro-organisms.
While these are examples of the many positive economic attributes provided, chemicals can also impact the safety
and environmental performance of treatments. Analytical tests can be performed to support and optimize chemical
treatments to help reduce or eliminate these concerns.
The analytical tests most commonly conducted for oilfield chemical support include water analyses, product
residuals (scale, corrosion inhibitors), total filterable solids, corrosion coupon analyses, bacterial enumeration tests,
solids analyses, and oil and grease analyses. Each of these tests has a specific and unique set of detail, sampling, and
preservation needs; additionally, understanding the results of these tests is crucial to designing an appropriate and
effective chemical program.
SAMPLING AND MONITORING
Understanding the characteristics of the producing fluids from a well can assist with identifying current or future
operational challenges. Screening production chemicals with those fluids can help identify the appropriate chemical
additive to address those challenges; however, to optimize a well’s chemical treatment, the response to that chemical
additive should be determined. Through effective monitoring, tracking, and trending of analytical data, it is possible
to determine whether the well responds favorably or if modifications to the treatment should be implemented.
When determining the specific analyses necessary, it is important to know the following:
- Properties being measured
- Test purpose
- Sample amount to be collected
- Possible contaminates that could adversely affect results
- Industry standards for sampling, preserving, and conducting the analytical test
- Allowable sample-to-analysis timeframe
IDENTIFICATION OF CHEMICAL-RELATED PRODUCTION CHALLENGES
As fluids flow from the wellbore into the various surface vessels and tanks, the operating conditions within these
locations change. As these changes occur, production challenges can be impacted. It is important to acknowledge
that, while certain challenges can be present in the downhole environment, they might be somewhat different, or
even non-existent, in the surface equipment. Velocity, pressure, pressure reduction, and temperature can vary greatly
as fluids progress through the production system. Additional analytical testing might be necessary to determine the
magnitude of these challenges at each location in the system. Table 1 identifies common challenges throughout a
production system and the associated analytical tests. Sampling upstream and downstream of production equipment
can be helpful in terms of determining the severity of a production challenge following a modification in the
operational parameters (pressure/temperature).
After completion of product screening and implementation of the resulting recommendations, it is imperative to
monitor and track the response from the well or piece of equipment. Without proper monitoring, it is difficult to
assess the success of the chemical application. The following sections identify common analytical techniques and
discuss their application for optimizing chemical treatment.
ANALYTICAL TESTS ASSOCIATED WITH CHALLENGES Water Analyses
Water is often referred to as the universal solvent; as such, it dissolves and carries many impurities. These impurities
can be troublesome within many industries, including the oil and gas industry. While water is viewed as a byproduct
of production in the oil and gas industry, it can contain vital information about reservoir characteristics,
corrosiveness in a well, the tendency for mineral scale deposition, and many other factors pertaining to oil and gas
production. Without water, many of the production challenges experienced in the oil and gas industry would be
substantially minimized.
Water analysis is one of the basic analytic tests performed by the oil and gas industry; however, results are
frequently misunderstood and misapplied. Table 2 shows the primary components of water analysis. Depending on
the final use of the water being analyzed, additional components, such as boron or silica, can be added to the
analysis; however, this table details the most commonly identified components observed in oil and gas produced
water.
When proper sampling, preservation, and analytical procedures are used, the analyst or engineer can interpret the
water analysis with confidence. By analyzing for the constituents listed in Table 2, several conclusions can be
ascertained.
Uses for Water Analyses: Identification of Production Zones Production zones have distinct water properties characteristic to the location within a given county or geographic
area. These records have been gathered, cataloged, and used for more than 50 years by independent laboratories to
aid identification of production zones or contamination within a production zone. The characteristics are highly
dependent on chlorides, calcium, magnesium, sulfate, barium, and the ratios of these cations and anions to each
other. It is recommended to conduct a water analysis as soon as possible after a well has stabilized following its
initial completion, recompletion, or when new zones are opened for production. When suspect production trends are
noted, a repeat water sample can be captured and analyzed. An accurate water analysis can be compared to existing
historical records for a specific well or on offset well records within the geographic area to determine if the
produced water is characteristic of the water produced from that formation or if possible casing leaks, foreign water

entry, or contamination have occurred. An accurate water analysis is vitally important in such situations because
costly well workovers could be scheduled based on the results. It is recommended to conduct a repeat water analysis
before rigging up on a well to verify the suspect water constituent values.
Predicting Corrosivity Water analysis can indicate whether corrosion is likely to occur based on several factors. Water analysis identifies
acid gases in the produced water as well as the dissolved minerals and metals that could contribute to the corrosion
process. For accuracy, acid gases (CO2 and H2S) should be tested on location immediately after the sample is
obtained. The acid gas content determines the dominate type of corrosion and significantly influences the corrosion
rate of a system. Corrosion rates are directly related to the amount of such gases dissolved in the produced water in
combination with the dissolved chlorides and system pressures. CO2 corrosion can result in various forms of metal
loss and pitting. H2S can result in a severe pitting attack and can often create high pitting/failure rates. In systems
where CO2 and H2S are both produced, the ratio of CO2 to H2S determines which species dominants corrosion in the
system.
When CO2 and H2S dissolve in water, they form acids. As the levels of dissolved CO2 and H2S increase in the water,
the pH of the produced fluids declines. This creates a corrosive environment. Dissolved CO2 acid gas or dissolved
H2S gas present in the water, when combined with the low pH and high chloride content, is indicative that the water
is potentially corrosive in nature. As with acid gasses, the pH of the water should be tested on location immediately
after the sample is obtained.
In addition to reviewing the acid gases, chloride levels, and pH, it is also advantageous to review the levels of iron
and manganese contained within the water sample. Because these are analyzed on acidized samples, the
measurements are reflective of both dissolved and any suspended compounds that were solubilized by the acid,
referred to as “total iron and total manganese.” High iron and manganese levels can be indicative of active corrosion
occurring downhole or in surface equipment. Additional monitoring of equipment integrity, reviews of failure
records, and visual inspection of any removed metallic components are recommended to verify active corrosion.
Depending on their history, older waterfloods can sometimes recirculate iron and manganese, making interpretation
during the monitoring process difficult. In such situations, it is recommended to review trend analyses on
iron/manganese and attempt to relate these trends to actual field corrosion failure data.
In some instances, water analyses can include a determination for oxygen. This is commonly included for water
injection or water disposal systems and should be performed onsite for accuracy. Levels of oxygen should not
exceed 50 ppb (0.050 ppm) when H2S and/or CO2 are present. Not only is oxygen a severely corrosive species, but
acid gas corrosion is accelerated in the presence of oxygen. In the absence of H2S and/or CO2, it is recommended for
oxygen levels to be maintained below 100 ppb (0.10 ppm). Ideally, oxygen should be excluded or scavenged from
production facilities.
Using water analysis to understand the potential for corrosion and relating this information to actual failure records
for a field or area enables the producer to design an appropriate corrosion mitigation program. This program can
consist of engineering solutions to remove the corrosive species, selection of corrosion-resistant alloys, application
of protective coatings, or application of corrosion inhibitors.
Predicting Scaling Tendencies Mineral scales are defined as mineral depositions that result from an oversaturation of a given compound in a
solution under a certain set of conditions. Scales can result in plugging problems in the producing formation,
downhole equipment, and/or surface piping/equipment. Additionally, under-deposit corrosion can occur beneath
scale depositions, resulting in high corrosion rates and premature failure of production or pipeline equipment.
Predicting the scale deposition tendency in water is achieved through the analysis and arithmetical combination of
the cations, anions, pH, temperature, and pressure of the water and then comparing the saturation of the water to
solubility constants under the temperatures and pressures noted. A pressure drop can indicate the potential for
calcium carbonate (CaCO3) scale formation. Increased temperatures (i.e., submersible pumps or surface pumps) can
result in a potential for calcium sulfate (CaSO4) scale formation. Barium sulfate (BaSO4) scale, which is insoluble in
water, forms upon mixing of incompatible waters.
These calculated tendencies are only indicators of possible deposition that might occur given the operating
conditions of the system, including pressure reductions and temperatures of the produced fluids. It should be noted
that calcium carbonate mineral scales have an inverse solubility in water as the temperature increases (i.e., they
become less soluble as temperatures increase). The solubility of calcium sulfate scales increases up to a temperature
of 50°C but then decreases with increasing temperature, and the solubility of barium sulfate scales increases with
increasing temperatures (Figure 1). Therefore, as temperatures change, the likelihood of scale deposition can vary.
Typically, three (3) types of mineral scales are present in production and injection systems: calcium carbonate,
calcium sulfate, and barium sulfate. Table 3 shows the solubilities of these scales in water (calcium sulfate >
calcium carbonate > barium sulfate). Table 4 shows the primary variables that can result in the deposition of these
mineral scales.
Calcium Carbonate scale (Figure 2) is an acid-soluble mineral scale that forms easily and is most common in low-
pressure systems and injection wells. This scale deposition can be removed with the application of acid. However,
acids will not typically penetrate an oil-wet solid; therefore, using a mutual solvent is necessary to assist removing
the hydrocarbons from the scale. This allows the acid to effectively dissolve the mineral scale and clean the
equipment. Calcium carbonate scale can be prevented and controlled using low concentrations of scale inhibitor.
Calcium Sulfate scale (Figure 3) is the second most common scale observed in production/water systems and is
formed through pressure and temperature variances. This scale is not acid-soluble and must first be chemically
converted to an acid-soluble salt using a sulfate converter or removed using a specialized dissolver. If a converter is
used, a two-step procedure is necessary. The converter is applied to the system; the well (or equipment) is shut-in
and allowed to react with the calcium sulfate scale. This shut-in time is generally 12 to 24 hours. Once the sulfate
scale has been converted to an acid-soluble form, acid can be applied to remove the converted mineral deposition.
It is possible to use a calcium sulfate dissolver in some applications to reduce the two-phase cleanup to a single
application. The product is designed to dissolve calcium sulfate molecules in a single procedure. It is not necessary
to apply acid in conjunction with this application. However, it is recommended to allow at least 12 to 24 hours for
the process to completely dissolve the scale present.
Barium Sulfate scale (Figure 4) is the third mineral scale that can be present in production/water systems. This
scale is neither acid-soluble nor can it be dissolved economically. Once this scale is formed, it is usually removed by
mechanical methods. Barium sulfate scale will form before calcium sulfate scale if there is any barium present in the
produced water with any amount of sulfates. This type of mineral scale can be inhibited, but a higher chemical
concentration is usually necessary to be effective.
Other types of depositions can occur; however, many are byproducts of bacterial activity and acid gas corrosion of
metallic components or the result of mixing incompatible waters. Reviewing the water analysis and field failure
history and monitoring for biological activity can help determine the origin of deposits. Iron carbonate and iron
sulfide are two deposits that can originate from either corrosion or biological activity. They are generally not
categorized as scales but as “deposits” and are most effectively controlled using corrosion inhibitors and biocides or
by controlling the quality of makeup water for injection systems (i.e., mixture of incompatible waters).
Understanding Chemical Solubilities A water analysis is also helpful for understanding the solubilities of production chemical products. Knowledge of
the chloride level is crucial for the selection of gas enhancement products (i.e., foam-assisted lift products). The total
dissolved solids (TDS) content and calcium levels in a water are also important factors for the solubility of scale and
corrosion inhibitors. Again, an accurate water analysis is the beginning for screening such products and is necessary
to design an effective program to address production challenges.
Recognition of Possible Anomalies in Water Analyses When reviewing a water analysis, a few general rules can assist in determining the presence of possible anomalies.
Comparing current analyses with historical analyses is important to help identify possible changes in the water
composition or possible anomalies for follow-up confirmation. General guidelines include the following:
- Compare the measured density of the water to the TDS to determine if errors exist in the reported figures.

- Compare reported sulfate values to reported barium values. Unless scale inhibition is present (and
effective), barium content should be relatively low (2 to 3 mg/L) if sulfate values are at, or exceed, 150 to
200 mg/L in the water.
- Compare the ratio of total iron to total manganese; if the source of the manganese is the result of carbon
steel alloy corrosion, it should be 1 to 1.5% of the iron levels.
- Check the alkalinity, pH, and CO2 levels. At a pH equal to or less than 4.5, only CO2 is present; at pH
levels greater than 4.5 but less than 8.3, CO2 and bicarbonate (HCO3-) will be present; at pH levels above
8.3 but less than 10.2, bicarbonates (HCO3-) and carbonates (CO3
-2) will be present, but no CO2 will be
present. At pH levels greater than 10.2, carbonates and hydroxyl (OH-) will be present.
- If the water pH is low (below 6) but alkalinity is high, additional analytical work might be justified.
Organic acids might be present (these are a part of the water alkalinity).
- The fresher the water (low TDS), the more oxygen a water can contain. Fresh water (TDS less than 1000
mg/L) is saturated with oxygen (at room temperature, atmospheric pressures)—between 6 to 8 ppm
oxygen.
- Oxygen readings need to be performed in the field to ensure accuracy. Unusually high oxygen levels in a
water sample can be indicative of a poor sampling technique (i.e., allowing the introduction of oxygen into
the glass test ampule) or not conducting the oxygen determination in the field. Resampling and retesting
onsite is recommended.
- Lower-pH water (less than 7.0) indicates the water could be corrosive (acidic).
- Higher-pH water (greater than 7.0) can indicate the water has increased scaling tendencies (especially with
calcium carbonate scale).
- The higher the chlorides/TDS, the higher the potential for corrosion.
- Higher temperatures can indicate a greater potential for corrosion and/or scale.
- If unstable constituents were not determined onsite, erroneous scaling and/or corrosion tendencies are
likely.
- If the water was not sampled in the appropriate container, or preserved correctly, erroneous data are likely.
Refer to API RP-45 (1998) for details about containers and preservation techniques.
- If the sample valve was not adequately flushed before capturing the sample, impurities from the valve
could be introduced into the sample container and solubilized upon acidification, altering the dissolved
components reported during testing.
A water analysis can provide extremely informative analytical information and is integral to production chemical
selection and monitoring, and it can aid in the design and development of secondary and tertiary recovery systems
for the oil and gas industry. However, to provide these benefits, the water analysis must be correctly sampled,
preserved, analyzed, and interpreted. Furthermore, it should be representative of the system being tested. Regular
testing of produced waters (annually, unless conditions warrant a retest) can indicate whether corrective actions are
necessary and will also assist with confirming the success, or failure, of past actions. The frequency of sampling
should be modified if changes are implemented to a system or if conditions within a system deteriorate.
Total Filterable Solids
In addition to the TDS identified in the water analysis, understanding the total suspended solids (TSS) can be
beneficial, particularly in a water injection or water disposal system. TSS are generally measured, examined, and
analyzed using a membrane filter. NACE TM0173-2015 (2015) uses a preweighed 0.45-micron pore size filter pad.
The water is filtered at 20 psig (delta pressure across the membrane filter) for up to 10 minutes or until a set volume
of water has been filtered. The filter pad is then dried and reweighed to determine the TSS. Further analyses can be
conducted on the solids captured on the filter pad to yield useful information, such as hydrocarbon content, acid
solubles, acid insolubles, and deposited particle sizes. TSS can be naturally occurring (silicates, sands) or can be
formed as a result of corrosion by-products or mineral scale deposition. In terms of injection systems, a target TSS
of 50 mg/L or less is desirable; however, if the matrix into which the water is to be injected is tight (i.e., low
porosity and/or low permeability), knowing the particle sizes can be as important as the quantity of particles present.
Both size and quantity of particles can be determined on the membrane filter.
TSS can result in solids deposition throughout a reservoir, on downhole equipment, or within surface equipment.
TSS can also result in erosional damage to equipment, erosion/corrosion damage (especially with stainless steels),

plugging of the reservoir or production equipment, and injectivity losses or reductions in injection wells, and it can
be involved in the development of oil-field emulsions (normal and reverse emulsions).
Suspended solids can be addressed chemically and/or mechanically. Chemicals can aid in water-wetting solids and
be used in conjunction with mechanical solids removal equipment, such as WEMCO® units, upflow or downflow
filtration units, hydrocyclones, and simple cartridge filtration. Solids removal should help increase the life
expectancy of projects and equipment and increase the economics of such projects.
Recognition of Possible Anomalies in TSS Analyses Tracking and trending the analyzed components present on the membrane filter can aid in the recognition of possible
anomalies within the analysis or can expose possible upsets in the system. When a spike, or sudden decrease, in a
value appears that is not statistically average for that sampling point, it is recommended to retest the location. It is
imperative that the analyst in the field adequately purge the sample valve to help prevent the accumulation of “valve
solids” on the membrane filter, which can result in an erroneously high TSS calculation during laboratory analysis.
Additionally, oxygen should be purged from the sample line to help prevent ineffective filtration, which can result in
an erroneously low TSS value during laboratory analysis of the filter.
Handling the membrane filter correctly is crucial for proper interpretation of the test. The filter must not be handled
with bare hands (finger prints and oils from the skin can add weight and/or result in blocking the pores on the
membrane), and the membrane must not be damaged in any way before, during, or after the field filtration test or
during the laboratory analysis process. The filter is a preweighed, delicate membrane, and TSS calculation is based
on the weight gained as a result of water being filtered through the membrane.
A common error in membrane filter analysis is omitting the initial distilled water rinse (before any acid washes),
which removes water-soluble salts present on the membrane. When determining carbonate deposits, this results in a
false elevation of carbonates after the first acetic acid rinse (followed by its subsequent distilled water rinse).
Again, understanding the water analysis can assist in predicting the types and possible location for the formation of
suspended solids throughout a production facility.
Table 5 illustrates the common suspended solids and their probable origins. It should be noted that 1 mg/L of
suspended solids equates to 0.00035 lbm/bbl of potential deposition. For a 10,000 BWPD injection system at
50 mg/L, depositing all TSS would equate to 175 lbm/day of solids or 32 tons of deposition per year.
Solids Analyses
The deposition of solids has long been recognized as a major economic concern. With increased concerns about
improving the productivity of oil and gas operations, the continuing depletion of reservoirs, and the institution of
waterflooding, pressure maintenance, and even more sophisticated recovery practices, the effects of solids
deposition within the oil and gas industry is becoming increasingly significant. Effects, such as plugging of tubular
goods used in lifting and handling petroleum, reservoir damage, accelerated boiler or fire-tube failures, among
others, can impair productivity in oil and gas recovery operations. Deposits can result in costly maintenance,
remedial work, and equipment replacement.
While water analysis can model the likelihood for scale formation, solids analysis validates the system’s actual
tendency. Using solids analysis is important for understanding the types of deposits present within the production
system. By determining the composition of the solids, it is possible to design a program for managing them.
As stated, mineral scales are defined as deposits that result from the oversaturation of a mineral in a solution. For oil
and gas production, carbonate or sulfate deposits are most common. If the solids analysis indicates deposits are
mineral scale, then management programs can be designed to address the formation of these scales. Analyses on
deposits are important for the development of a removal and prevention program. Not only do they validate the scale
prediction models of the water analysis, they yield information useful during the selection of the proper scale
product. Scale removers and inhibitors are scale-type specific; certain inhibitor chemistries are better at inhibiting
carbonate scales, while some are better at inhibiting sulfate scales. Additionally, it is important to identify the type

of deposit before recommending a removal process. Table 6 lists common scales and their solubility with respect to
water and acid.
An initial solids analysis can be performed relatively easily in the field using an organic solvent, water, and 15%
hydrochloric (HCl) acid. By observing the reactions in each step, preliminary conclusions concerning the
components of the solid can be quickly determined. Following this initial test, a more detailed analysis can be
performed in the laboratory using wet-chemistry or instrumental analyses.
Recognition of Possible Anomalies in Solids Analyses One common error with solids analyses often originates with the process used. For wet-chemistry methods, it is
important to ensure all organics/hydrocarbons are removed from the deposits before subjecting them to the water
and acid steps. If the organics/hydrocarbons are not effectively removed, the subsequent reagents will be unable to
contact the deposit. Wet chemistry relies on the ability of the reagents to contact the solid and react, thus removing
that component. The weight loss that occurs during this step is used to calculate the weight percent of that specific
component. Without adequate contact, these reactions cannot occur; thus, erroneous calculations can result.
Furthermore, it is imperative that all water-soluble salts be removed before exposing the solid to the various acids
during the wet-chemistry method. Otherwise, the water-soluble salts will be rinsed off of the deposit following
exposure to the acid and reported as a mineral scale instead of a water-soluble salt.
When instrumental methods are used, sample preparation is crucial. Additionally, the instruments need to be
maintained in good working order to help prevent erroneous conclusions and affecting the compositional makeup.
Regardless of the procedure used, proper laboratory techniques are necessary for accurate analyses. If inaccurate
results are published, incorrect or unnecessary expenses could ensue.
It should also be noted that iron sulfide, upon exposure to atmospheric oxygen, can oxidize to an iron oxide
(magnetite). Therefore, it is important that solids samples be transported to the laboratory in a timely manner. Field
identification of iron sulfide can be crucial to the laboratory analysis if oxidation has occurred.
Product Residuals
Product residuals are useful for determining the amount of a chemical that is traveling through a system. However,
the presence of a residual does not necessarily imply it is effective. Unless the correct chemical has been selected
and applied at the recommended dosage level, the presence of a product can be negligible. Therefore, it is important
to understand the product selection process and ensure the correct product has been identified. Then, through
residuals testing, the producer can have confidence in the performance of the production chemical.
The most common product residuals are the corrosion inhibitor and scale inhibitor. These residuals have different
interpretations. Corrosion inhibitors are designed to form a film on solid surfaces; therefore, the corrosion inhibitor
residual is expected to be lower than the targeted injection rate because some of it would film on the pipe surfaces.
This “excess” corrosion inhibitor is therefore captured in the corrosion inhibitor product residual. A positive value
on the corrosion inhibitor residual is adequate to ensure the inhibitor has filmed on the metal surfaces. A negative
value would indicate there was an inadequate quantity of inhibitor injected and the pipe surfaces might not be
adequately protected.
In contrast to the corrosion inhibitor residual, the scale inhibitor value is crucial. Scale inhibitors adhere to the
micronuclei scale particles as they begin to form and disrupt the crystal surface or block the growth sites. Phosphate
scale inhibitors are acidized, so they are released from the micronuclei scale particles and can then be detected.
Inhibitors have a minimum effective dosage (MED), defined by the inhibitor chemistry, product activity, and
severity of the scaling issue. When the inhibitor drops below this MED, it can no longer effectively inhibit the
deposition of scale. Therefore, the scale inhibitor value reported is important for managing mineral scales.

Oil and Grease Analyses
A primary use for oil and grease analysis involves compliance with the regulations governing the overboard
discharge of produced waters from offshore platforms. However, in addition to this regulatory application, the oil
and grease values are of economic importance for onshore facilities, especially water disposal facilities and
waterflood systems.
Excessive oil and grease discharged from offshore platforms could result in fines from the Environmental Protection
Agency (EPA) (or other regulatory entities) in addition to affecting the company’s public image. Therefore, it is
imperative that samples be captured and preserved in accordance with the EPA Method 1664 (2010).
Unless samples are obtained correctly and acidified upon sampling, the results obtained from this method can be
erroneous. Non-acidified samples could result in a false low value. Organics and hydrocarbons are often co-
precipitated with acid-soluble mineral scales; without acidification, these mineral scales are not dissolved and the oil
and grease is not released and therefore unreported. This could have serious regulatory repercussions offshore and
result in economic repercussions onshore.
In onshore environments, high oil and grease values can represent revenue losses, such as when oil and grease is
carried in a water stream and is injected into a water-disposal well. If oil has been pumped down a well into a
nonproducing zone, this could represent a significant loss in oil revenue, depending on the determined quantity of
the oil and grease and the volume of water disposed. Additionally, oil and grease can cause plugging in water
injection/disposal wells, thereby resulting in costly remediation work.
While the oil and grease values in waterflood injection water do not represent an actual loss in revenue, the injection
of oil and grease in the water stream does delay realizing that revenue. Additionally, just as with disposal wells, oil
and grease can cause near-wellbore damage that can negatively impact the waterflood and result in costly
remediation work to the injection wells.
If water clarification chemicals are used, oil and grease values indicate the effectiveness of this program. Injection
rate optimization for water clarifiers is assessed based on oil and grease values, upstream and downstream of the
chemical injection. Therefore, correct sampling, preservation, and laboratory techniques are important to help ensure
the oil and grease values are accurate and prevent overtreatment of clarification products.
Corrosion Coupons
Corrosion coupons are one of the most used corrosion monitoring tools in the oil and gas industry. Their
preparation, installation, analysis, and interpretation are based on NACE SP0775-2005 (2005). The advantages of
using corrosion coupons are numerous.
- They provide visual evidence of the corrosion type in the system at the location tested (pitting, generalized
corrosion damage, hydrogen blistering).
- They are a physical measurement of the corrosion rates.
- They can be retained, preserved, or photographed.
- They can be used to measure the response of a system to an operational or treatment modification.
Conversely, there are disadvantages to using corrosion coupons.
- They are a preweighed sand-blasted surface, which is susceptible to contamination that can result in
erroneous results (fingerprint, mechanical damage).
- The corrosion rate calculation is a general equation based on weight loss and coupon surface area; it does
not consider pitting attack.
- The location within the system is important for the accurate assessment of the corrosion rate.
o The coupon represents only that location during the test period in which it was exposed.
- Any weight loss resulting from mechanical damage will be factored into the equation and calculated as
corrosion weight loss, artificially increasing the mils-per-year (mpy) corrosion rate.
- Incorrect cleaning of the coupon after removal from the system can result in an erroneous weight-loss
calculation.
o If solids are not removed and are left on the coupon surface, a low mpy reading can result.
o If the cleaning procedure is too aggressive and additional metal is removed during the cleaning
process, the mpy rate can be artificially elevated.
- Results are not instantaneous; the coupon should be exposed to the fluids for a minimum of 2 weeks
(NACE SP0775-2005 2005); maximum 180 days (49 CFR 192.477 2010).
- The corrosion rate determined on the coupon is a measurement of the corrosion rate on that material at that
location.
o Interpretation of the coupon mpy is crucial. This mpy rate is not literally applied to the material
within the system but is an indicator of the severity of the corrosion that system might be
experiencing.
When handled correctly, inserted at the proper location, and analyzed in accordance with NACE SP0775-2005
(2005), coupons are a viable tool for assessing corrosion in a system. When mpy rates are trended over time,
coupons are excellent for determining the system’s response to a modification—chemical or operational practice
change. In chemical treatments, coupons can be used to quantify the response of the system to these changes,
whether positive or negative.
Recognition of Possible Anomalies in Coupon Analyses Tracking and trending the coupon results over time is crucial for identifying possible anomalies. Comparing the mpy
rates to the failure rates for a well or field can help validate the mpy reading as a viable measurement for corrosion
rates. Furthermore, it can be used to define the well or field key performance indicator (KPI), or tolerance, to
corrosion. While NACE SP0775-2005 (2005) defines the corrosion rate interpretation, relating the coupon mpy to
failure rates in real time for that coupon location reveals the actual tolerance of the system to the mpy rate. This
tolerance for corrosion will, of course, be heavily influenced by economic factors (cost of failures), environmental
exposure risks (air/ground/water contamination potentials), or personnel or population exposure (likelihood of injury
or fatalities to employees or the public) risk factors; however, a tolerance can be determined.
Without tracking the coupons over time, the overall trend cannot be as easily determined. If trended regularly, an
analyst can quickly determine if the mpy result is within historical averages (statistical process control) for that
location. If it is not within the historical average, changes during the current testing cycle need to be considered.
Through tracking and trending these mpy readings, anomalies can be quickly identified and corrective action can be
made to determine if this anomaly is “real” or a statistical error. Furthermore, conversations between the operator
and chemical company are initiated to determine if operational or unscheduled chemical rate changes have occurred
during the test period, subsequently explaining the anomaly. Figure 5 shows an example of coupon trending.
Bacterial Enumeration
Microbiologically influenced corrosion (MIC) is a term used to designate corrosion resulting from the presence and
activities of micro-organisms. While micro-organisms do not produce a unique type of corrosion, they can be
involved in the degradation of both metallic and non-metallic materials. They produce a localized attack on surfaces
that can include pitting, de-alloying, stress cracking, and hydrogen embrittlement. Therefore, monitoring and
controlling the bacterial population is crucial for reducing the occurrence of MIC failures.
Monitoring for bacterial growth can be complicated and confusing. Accurate testing is dependent on the sampling
technique, procedure, and interpretation of the results. Microscopic, culturing, and immuno-chemistry techniques are
all options for the enumeration of bacteria. However, each of these procedures can yield unique and somewhat
confusing results from the same sample. Understanding their advantages, disadvantages, and limitations can help
select the best process for initial and subsequent bacterial testing.
A microbiologist uses environmental factors to isolate and study micro-organisms. When a nutrient solution of
known composition is inoculated with a mixed microbial population, the principle of natural selection begins to
operate and the microbe that grows best under the conditions provided soon predominates. As a result of its growth
and the chemical changes brought about by its metabolic processes, the medium substrate composition changes and
a new predominate microbe will emerge that grows best under these conditions. By carefully selecting and

maintaining a set of conditions and providing a specific nutritional media, any naturally occurring micro-organism
can be isolated. This principle is the basis by which all micro-organisms are studied and isolated.
Because bacteria vary greatly in their nutritional needs, no single medium is capable of supporting growth of more
than a small fraction of the bacteria that exist in nature. Therefore, if bacteria are suspected, yet no growth is noted
within standard culture vials, a specialized broth or enumeration technique might be required to verify their
existence.
The enumeration tests conducted are based on NACE TM0194-2014 (2014), which is the industry-standard serial
dilution test method. Even if other enumeration techniques are used, it is recommended that the technician inoculate
the serial dilution broth bottles for a comparison in compliance with NACE TM0194-2014 (2014).
This enumeration technique uses a common culture media to determine the broadest classification of bacteria (i.e.,
sulfate-reducing, acid-producing, or general aerobic bacteria), not the specific bacterial species.
NACE TM0194-2014 (2014) contains the specific formulation for preparing the serial dilution broth bottles. It
should be noted that some strains of bacteria might necessitate specific specialized broths. If this is the case, a broth
can be made to better replicate the produced water and its associated nutrients (i.e., some strains of sulfate-reducing
bacteria (SRB) require the addition of organic acids as a nutrient to facilitate growth). Viable bacteria are necessary
for this technique, and it is the only method available to measure viable bacteria only, which highlights several
limitations to this technique.
- Culturing time is necessary for these cells to replicate within the vials. Therefore, 2 to 4 weeks of
incubation is necessary to reach completion.
- The correct saline broth should be used (matched closely to the saline of the produced water).
- Incubation temperatures might need to be modified to better represent the system.
- When flowing water is tested, the bacteria captured and inoculated will be the planktonic (floating) bacteria
in the water stream and not the sessile (attached) bacteria adhering to the pipe/vessel wall surfaces.
Other techniques can be used to determine total bacteria counts, such as the adenosine triphosphate (ATP) method.
This technique is based on the metabolism of the living bacterium, which uses this high-energy molecule in large
quantities. This method calls for extracting the ATP from the cell, reacting it with a standard quantity of luciferin-
luciferase, and measuring the light units produced with a photometric analyzer. These light units can then be
compared throughout a field or lease to identify areas of high metabolic activity; however, this technique cannot
differentiate between the various strains of bacteria.
Other methods, such as RapidChek® SRB immunoassay test kits, Sani-Check
® SRB/APB test kits, fluorescence
microscopy, fluorescence in-situ hybridization, and advanced genetic techniques for the identification of bacterial
species, can be used to identify bacteria. Each technique produces results unique to that specific procedure;
therefore, the results from one test method should not be intermixed with the results from another test method.
In review of the typical methods of identifying the types of bacteria, microscopic examination and staining
techniques obviously do not lend themselves readily to field evaluations. Additionally, most culturing techniques are
not easily performed in the field, with the exception of the NACE serial dilution technique.
Recognition of Possible Anomalies in Bacterial Analyses A common error in the enumeration of bacteria is contamination during the sample gathering and/or testing
procedure. Analysts must use sterile syringes when performing the serial dilution technique to help ensure no
contamination is introduced into the culture vials. Additionally, if using the ATP or immunoassay techniques for
enumeration, it is imperative that the analyst use consistent techniques to prevent inconsistent results.
Furthermore, all culture vials and reagents used in these tests have a shelf-life, or expiration date. This shelf-life is a
function of not only the age of the vials/reagents but also the conditions of the environment in which they are stored.
Therefore, it is crucial that the analyst ensure all equipment, culture vials, and reagents are stored in compliance with
the manufacturer’s recommendations and are discarded after the expiration date noted on each shipment. Otherwise,
erroneous results might be reported, which could result in overconfidence (that no potential problems exist) and
treatments being ceased or reduced. This could ultimately result in an increase in bacterial-related failures.
It is also important for the analyst and producer to understand that the fluids used in these enumeration techniques
are most commonly extracted from the flowing stream of water; therefore, the results represent the planktonic
bacteria. In summary, these methods only enumerate a small fraction of the total bacteria in the water stream
compared to what the system might actually contain. Most of the bacteria are sessile (i.e., growing on pipe walls,
under scale, in sludges, and at interfaces) and not planktonic (i.e., free floating in the water). Therefore, if the
enumeration of sessile bacteria is the goal of the monitoring program, additional equipment (Robbins devices) or
modified procedures [NACE TM0194-2014 (2014) contains examples of these sessile techniques] might be
necessary.
Ultimately, measuring, tracking, and trending the bacterial counts is crucial to understanding what is occurring in a
field, lease, or well, in addition to determining the efficiency of biological control methods (operational and/or
chemical). Correlating these numbers to the actual observed bacterial damage or bacterially related well/equipment
failures should yield the optimum level of tolerance for that field, lease, or well as it relates to the number of
colonies enumerated by the various techniques.
CONCLUSIONS
Technology advances enabled an operator and chemical company to analyze fluid constituents and solids to
determine their components and probable origins to identify effective management programs for these production
challenges. However, it is important that industry standards be used for proper sampling, handling, and preservation
of field fluid samples. Additionally, analysis and interpretation of these analytical tests needs to be performed and
communicated accurately.
Tracking and trending analytical results over time makes it possible for anomalies to be quickly and readily
discovered. Therefore, retesting can be performed to determine if these anomalies are truly a system or chemical
performance change or an error in the sampling/analysis techniques. Identifying the correct response to an anomaly
can be the difference between the success or failure of a well or field management program and can impact the
future environmental, regulatory, and economic viability of a well or field.
REFERENCES
API RP-45: API Recommended Practice for Analysis of Oil-Field Waters Third Edition, American Petroleum
Institute, Washington, DC (1998).
49 CFR 192.477, Internal corrosion control: Monitoring, US Government Publishing Office, Washington, DC
(2010).
EPA Method 1664, N-Hexane Extractable Material (HEM; Oil and Grease) and Silica Gel Treated N-Hexane
Extractable Material (SGT-HEM; Non-polar Material) by Extraction and Gravimetry, Washington, DC (2010).
Kemmer, F.N., Editor, The NALCO Water Handbook, Second Edition, New York, McGraw-Hill Book Company
(1979).
Oddo, J. E. and Tomson, M.B.: Why Scale Forms and How to Predict It, SPE Production and Facilities 9 (1), 47–54
(1994).
Ogden, B.L.: Establishing and Monitoring an Effective Chemical Program, Martin Water Labs, Midland College
Continuing Education Course (2006).Ostroff, A.G.: Introduction to Oilfield Water Technology, National Association
of Corrosion Engineers, Houston, Texas (1979).
Ogden, B.L.: Water Technology: Understanding, Interpreting and Utilizing Water Analysis Data, Southwestern
Petroleum Short Course, Lubbock, Texas (2008).

Martin, W.C.: Waterflood Waters – Problems and Practices, AIChE Symposium, Midland, Texas (1965).
Martin, W.C.: Water Quality and Control, Panel Discussion for Southwestern Short Course (April 1964).
NACE International Standard SP0775 (formerly RP0775): Preparation, Installation, Analysis, and Interpretation of
Corrosion Coupons in Oilfield Operations, Houston, Texas (2013).
NACE International Standard TM0173: Methods for Determining Quality of Subsurface Water Using Membrane
Filters, Houston, Texas (2015).
NACE International Test Method TM0194: Field Monitoring of Bacterial Growth in Oil and Gas Systems, Houston,
Texas (2014).
Patton, C.C.: Applied Water Technology, Campbell Petroleum Series, Norman, Oklahoma (1986).
Patton, C.C.: Injection-Water Quality, Journal of Petroleum Technology 42 (10), 1,238–1,240 (1990).
Van Delinder, L.S., Editor, Corrosion Basics, An Introduction, National Association of Corrosion Engineers,
Houston, Texas (1984).
ACKNOWLEDGMENT
RapidChek® SRB is a registered trademark of Strategic Diagnostics Inc., Newark, Delaware.
Sani-Check® is a registered trademark of Biosan Laboratories, Warren, Michigan.
WEMCO® is a registered trademark of Weber Electric Manufacturing Co., Shelby Charter Township, Michigan.
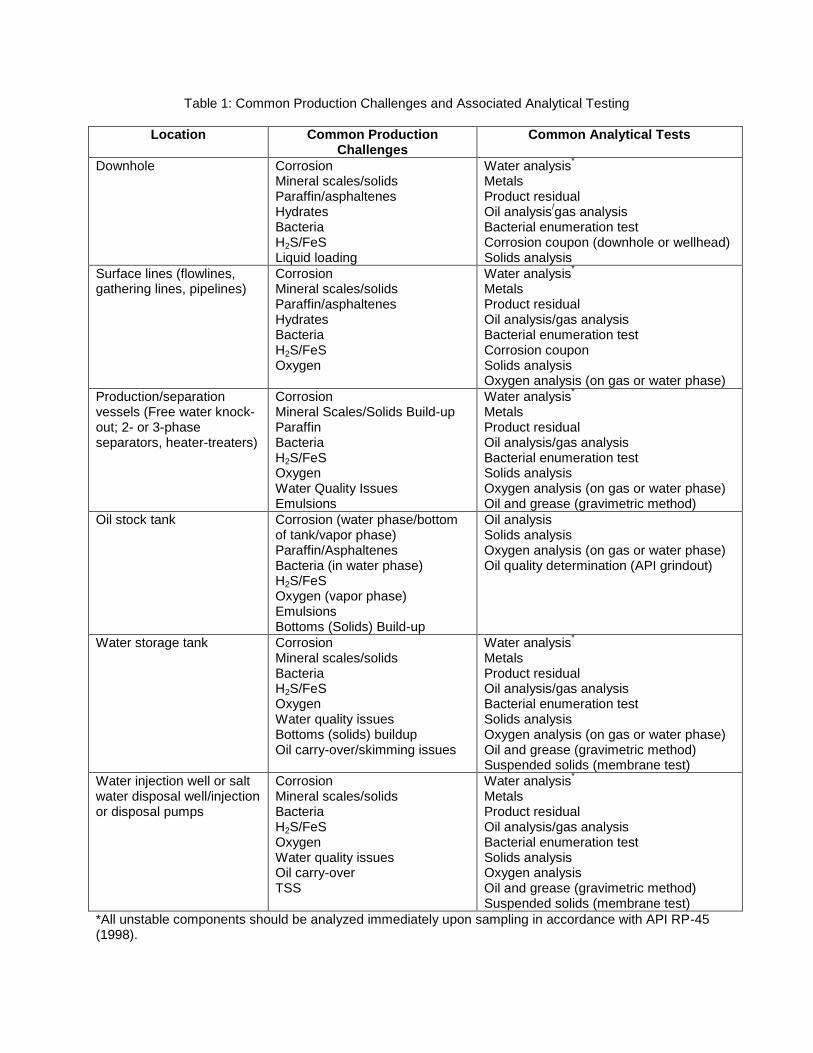
Table 1: Common Production Challenges and Associated Analytical Testing
Location Common Production Challenges
Common Analytical Tests
Downhole Corrosion Mineral scales/solids Paraffin/asphaltenes Hydrates Bacteria H2S/FeS Liquid loading
Water analysis*
Metals Product residual Oil analysis
/gas analysis
Bacterial enumeration test Corrosion coupon (downhole or wellhead) Solids analysis
Surface lines (flowlines, gathering lines, pipelines)
Corrosion Mineral scales/solids Paraffin/asphaltenes Hydrates Bacteria H2S/FeS Oxygen
Water analysis*
Metals Product residual Oil analysis/gas analysis
Bacterial enumeration test Corrosion coupon Solids analysis Oxygen analysis (on gas or water phase)
Production/separation vessels (Free water knock-out; 2- or 3-phase separators, heater-treaters)
Corrosion Mineral Scales/Solids Build-up Paraffin Bacteria H2S/FeS Oxygen Water Quality Issues Emulsions
Water analysis*
Metals Product residual Oil analysis/gas analysis
Bacterial enumeration test Solids analysis Oxygen analysis (on gas or water phase) Oil and grease (gravimetric method)
Oil stock tank Corrosion (water phase/bottom of tank/vapor phase) Paraffin/Asphaltenes Bacteria (in water phase) H2S/FeS Oxygen (vapor phase) Emulsions Bottoms (Solids) Build-up
Oil analysis
Solids analysis Oxygen analysis (on gas or water phase) Oil quality determination (API grindout)
Water storage tank Corrosion Mineral scales/solids Bacteria H2S/FeS Oxygen Water quality issues Bottoms (solids) buildup Oil carry-over/skimming issues
Water analysis*
Metals Product residual Oil analysis/gas analysis
Bacterial enumeration test Solids analysis Oxygen analysis (on gas or water phase) Oil and grease (gravimetric method) Suspended solids (membrane test)
Water injection well or salt water disposal well/injection or disposal pumps
Corrosion Mineral scales/solids Bacteria H2S/FeS Oxygen Water quality issues Oil carry-over TSS
Water analysis*
Metals Product residual Oil analysis/gas analysis
Bacterial enumeration test Solids analysis Oxygen analysis Oil and grease (gravimetric method) Suspended solids (membrane test)
*All unstable components should be analyzed immediately upon sampling in accordance with API RP-45 (1998).

Table 2: Primary Constituents of Oilfield Waters
Cations Anions Other Properties
*Calcium (Ca) *Magnesium (Mg) *Sodium (Na) *Iron (Fe) *Barium (Ba) Strontium (Sr) Manganese (Mn)
*Chloride (Cl) *Carbonate (CO3) *Bicarbonate (HCO3) *Sulfate (SO4)
*pH *Temperature *Specific gravity *Dissolved carbon dioxide *Sulfide as H2S Resistivity Dissolved oxygen Bacterial population Oil content Turbidity Suspended solids—amount, size, shape, chemical composition
(*) Essential components for obtaining a thorough and meaningful water analysis
Table 3: Relative Solubilities of Mineral Scales in Distilled Water, Atmospheric Pressure
Mineral Scale Solubility (mg/L) in Water
Calcium sulfate (gypsum) (CaSO4 . 2H2O) 2080
Calcium carbonate (CaCO3) 53
Barium sulfate (BaSO4) 2.3
Table 4: Primary Variables in the Formation of Mineral Scales
Scale or Deposit Chemical Formula Primary Variables
Calcium carbonate CaCO3
Partial pressure of CO2 (scale increases as CO2 decreases)
Less soluble with increasing temperatures
Pressure reductions
More soluble as TDS increases
Calcium sulfate CaSO4 . 2H20 (gypsum)
CaSO4 (anhydrite)
Less soluble at temperatures higher than 50°C
Pressure reductions
More soluble as TDS increases
Barium sulfate BaSO4 More soluble as temperatures increase
More soluble as TDS increases
Strontium sulfate SrSO4 Solubility decreases as temperatures
increase
Iron Compounds: Iron carbonate
Iron sulfide Iron (II) hydroxide Iron (III) hydroxide
Iron oxide
FeCO3
FeS Fe(OH)2 Fe(OH)3 Fe2O3
Corrosion by-products
Bacterial activity
Dissolved gases
Depositions increase as pH increases

Table 5: Common Suspended Solids and Their Probable Origins
Hydrocarbons
Iron Compounds
Carbonates Sulfates Insolubles
Analysis detail
Oil carry-over
Paraffin
Iron sulfide
Iron oxide
Iron carbonate
Calcium carbonate
Iron carbonate
Magnesium carbonate
Calcium sulfate
Magnesium sulfate
Barium sulfate
Formation fines
Sand
Microbes
Asphaltenes
Completion fluid returns
Possible origin(s)
Separator malfunction
Truck treating schedules
Surface tank or vessel damage
Improper equipment sizing
Corrosion
Mixture of incompatible waters
Oxygen introduction
Stimulation by-products
Scaling waters
Corrosion
Pressure reductions with subsequent scale deposition
Fluid property changes
Scaling water
High temperatures
Pump outlets/ shrouds
Ineffective cooling of downhole electric submersible pumps (ESPs)
Incompatible waters
Scaling
Mixing incompatible waters
Pump intakes set low
Bacterial activity
Dead bacteria (following a biocide application)
Biofilm
Natural, or induced, formation of asphaltenes (CO2 flood)
Table 6: Solubilities of Oilfield Deposits
Scale Type Chemical Formula Mineral Name
Water-Soluble Deposits
Sodium chloride NaCl Halite (salt)
Hydrochloric Acid-Soluble Deposits
Calcium carbonate CaCO3 Calcite
Iron carbonate FeCO3 Siderite
Iron sulfide FeS Trolite
Iron oxides Fe3O4 Magnetite
Fe2O3 Hematite
Hydrochloric Acid-Insoluble Deposits
Calcium sulfate CaSO4 * 2 H2O Gypsum
Calcium sulfate CaSO4 Anhydrite
Barium sulfate BaSO4 Barite
Strontium sulfate SrSO4 Celestite
Barium strontium sulfate BaSr(SO4)2 Barium strontium sulfate

Figure 1: Scale Solubilities in Water as a Function of Temperature
Figure 2: Calcium Carbonate Scale

Figure 3: Calcium Sulfate (Gypsum) Scale
Figure 4: Barium Sulfate Scale
Figure 5: Illustration of Coupon Trending Over Time


