
PROCESSING AND MATERIAL CHARACTERIZATION OF CONTINUOUS BASALT FIBER REINFORCED CERAMIC MATRIX COMPOSITES USING POLYMER DERIVED
CERAMICS
By
SARAH BETH COX B.S. Georgia Institute of Technology, 2004
A thesis submitted in partial fulfillment of the requirements for the degree of Masters of Science
in the Department of Materials Science and Engineering in the College of Engineering and Computer Science
at the University of Central Florida Orlando, Florida
Summer Term 2014
Major Professor: Jihua Gou
https://ntrs.nasa.gov/search.jsp?R=20140010906 2018-06-19T22:44:27+00:00Z

ii
©2014 Sarah Cox
iii
ABSTRACT
The need for high performance vehicles in the aerospace industry requires materials
which can withstand high loads and high temperatures. New developments in launch pads and
infrastructure must also be made to handle this intense environment with lightweight, reusable,
structural materials. By using more functional materials, better performance can be seen in the
launch environment, and launch vehicle designs which have not been previously used can be
considered. The development of high temperature structural composite materials has been very
limited due to the high cost of the materials and the processing needed. Polymer matrix composites
can be used for temperatures up to 260°C. Ceramics can take much higher temperatures, but they are
difficult to produce and form in bulk volumes. Polymer Derived Ceramics (PDCs) begin as a
polymer matrix, allowing a shape to be formed and cured and then to be pyrolized in order to obtain
a ceramic with the associated thermal and mechanical properties. The use of basalt in structural and
high temperature applications has been under development for over 50 years, yet there has been little
published research on the incorporation of basalt fibers as a reinforcement in the composites. In this
study, continuous basalt fiber reinforced PDCs have been fabricated and tested for the applicability
of this composite system as a high temperature structural composite material. The oxyacetylene torch
testing and three point bend testing have been performed on test panels and the test results are
presented.

iv
To my wonderful family
Christopher, Madison, Everett
I couldn’t have done this without you.
To Dan Koporec
Thank you for always believing
I love you and miss you

v
ACKNOWLEDGMENTS
I would like to thank the National Aeronautics and Space Administration at Kennedy Space
Center for funding this project, and to Robert Mueller who helped me get this project. I would
also like to thank everyone in the Composite Materials and Structures Lab at UCF for their help:
Donovan Lui for help with the panel fabrication and torch testing, Xin Wang for help with the
SEM/EDS/XRD, John Sparkman for helping with the facilities and equipment, and Hongjiang
Yang for always being there to support me, listen to me, and encourage me. I would also like to
thank Wilson Perez from the Mechanical and Aerospace Engineering Department for helping me
with the bend testing. Most of all, I would like to thank Dr. Jihua Gou for all of his mentorship,
guidance, and support in completing this project.
vi
TABLE OF CONTENTS
LIST OF FIGURES ..................................................................................................................... viii
LIST OF TABLES .......................................................................................................................... x
CHAPTER ONE: BACKGROUND ............................................................................................... 1
Current Launch Pad Configurations ........................................................................................... 1
Commercial Launch Vehicles ................................................................................................. 2
NASA Launch Vehicles for Manned Missions ...................................................................... 2
Current Materials in Use ............................................................................................................. 5
Future Launch Pad Requirements ............................................................................................... 8
A New Launch Pad Structure Material ..................................................................................... 10
CHAPTER TWO: LITERATURE REVIEW ............................................................................... 11
Polymer Derived Ceramics ....................................................................................................... 12
Continuous Basalt Fiber ............................................................................................................ 15
Thermal and Mechanical Testing of PIP CMCs ....................................................................... 19
CHAPTER THREE: FABRICATION ......................................................................................... 20
Panel Cure and Pyrolysis .......................................................................................................... 20
Reinfiltration and Pyrolysis Cycles .......................................................................................... 25
CHAPTER FOUR: MATERIAL TESTING METHODS ............................................................ 27
Scanning Electron Microscopy ................................................................................................. 27
X-Ray Diffraction ..................................................................................................................... 33
vii
Thermogravimetric Analysis .................................................................................................... 34
Oxyacetylene Torch Testing ..................................................................................................... 36
Flexural Testing ........................................................................................................................ 38
CHAPTER FIVE: RESULTS AND DISCUSSION ..................................................................... 39
Oxyacetylene Torch Testing of Baseline Panels ...................................................................... 39
Oxyacetylene Torch Testing of Reinfiltrated Panels ................................................................ 43
Flexural Testing of Baseline Panel ........................................................................................... 45
Flexural Testing of Reinfiltrated Panel ..................................................................................... 47
CHAPTER SIX: CONCLUSIONS ............................................................................................... 49
APPENDIX A: PANEL FABRICATION DATA ........................................................................ 50
APPENDIX B:COPYRIGHT LICENSE AGREEMENTS .......................................................... 89
REFERENCES ............................................................................................................................. 98
viii
LIST OF FIGURES
Figure 1: Schematic of Space Shuttle Flame Trench (Credit: (Calle et al., 2010)) ........................ 3
Figure 2 Morpheus Lander (credit: www.nasa.gov) ....................................................................... 8
Figure 3 SWORDS Launcher (http://www.smdc.army.mil/FactSheets/SWORDS.pdf) ................ 9
Figure 4 Structure of a Linear Polysiloxane (Torrey et al., 2006) ................................................ 13
Figure 5 Polycarbosilane Structure (Ly et al., 2001a) .................................................................. 14
Figure 6. Panel LBF107 after cure (left) and after pyrolysis (right) ............................................. 22
Figure 7. Panel LBF214 after cure (left) and pyrolysis (right) ..................................................... 23
Figure 8. SEM of Biaxial Basalt (Left) and Plain Weave Basalt (Right) ..................................... 28
Figure 9. EDS of Plain Weave Basalt Fiber ................................................................................. 28
Figure 10. SEM Images of Polysiloxane Panels: LBF105 (Left), LBF107 (Right) ..................... 29
Figure 11. EDS of Fiber from Panel LBF105 ............................................................................... 29
Figure 12. EDS of Matrix Material from Panel LBF105 .............................................................. 30
Figure 13. SEM Images of Polycarbosilane Panels: LBF208 (Left). LBF207 (Right) ................ 30
Figure 14. EDS of Matrix Material from Panel LBF214 .............................................................. 31
Figure 15. EDS of Fiber from Panel LBF208 ............................................................................... 31
Figure 16. SEM Image of LBF224 ............................................................................................... 32
Figure 17. SEM Image of LBF225 ............................................................................................... 32
Figure 18. EDS of Panel LBF225 ................................................................................................. 33
Figure 19. XRD of Panel LBF225 ................................................................................................ 34
Figure 20. TGA of Panel LBF217 ................................................................................................ 35
ix
Figure 21. TGA of Panel LBF224 ................................................................................................ 35
Figure 22. TGA of Panel LBF225 ................................................................................................ 36
Figure 23. Torch Test Setup.......................................................................................................... 37
Figure 24. During Test .................................................................................................................. 37
Figure 25. 3 Point Bend Test Setup .............................................................................................. 38
Figure 26. Torch Testing Results of the Polysiloxane Panels ...................................................... 39
Figure 27. Panel LBF103 Post Test .............................................................................................. 40
Figure 28. Panel LBF106 Post Test .............................................................................................. 40
Figure 29. Torch Testing Results of the Polycarbosilane Panels .................................................. 42
Figure 30. Panel LBF203 Post Test .............................................................................................. 43
Figure 31. Panel LBF206 Post Test .............................................................................................. 43
Figure 32. Torch Testing Results of the Reinfiltrated Panels ....................................................... 44
Figure 33. Panel LBF224 Post Test .............................................................................................. 45
Figure 34. Panel at Failure ............................................................................................................ 46
Figure 35. Bending Load vs. Displacement for Polycarbosilane Panel ........................................ 46
Figure 36. Bending Load vs. Displacement for Reinfiltrated Panel ............................................. 47
x
LIST OF TABLES
Table 1: Compression Values for Materials Tested (values based on Figure 7 in (Calle et al.,
2010)) .............................................................................................................................................. 7
Table 2. Modulus of Rupture Values for Materials Tested (values based on Figure 8 in (Calle et
al., 2010)) ........................................................................................................................................ 7
Table 3. Comparison of Glass Fiber to Basalt Fiber ..................................................................... 15
Table 4. Properties of PDC Resins ............................................................................................... 20
Table 5. Properties of Basalt Fabrics ............................................................................................ 20
Table 6. Cure Cycles ..................................................................................................................... 21
Table 7. Pyrolysis Cycle for Polysiloxane in Kiln ........................................................................ 22
Table 8. Cure Cycles of Polycarbosilane Panels for Torch Testing ............................................. 23
Table 9. Fabrication Data .............................................................................................................. 24
Table 10. Fabrication Data for Bend Test Panel #1 ...................................................................... 24
Table 11. Fabrication Data for Reinfiltrated Panels ..................................................................... 25
Table 12. Fabrication Data for Bend Test Panel #2 ...................................................................... 26
Table 13. Recession Rates for Polysiloxane Panels ...................................................................... 40
Table 14. Recession Rates for Polycarbosilane Panels ................................................................. 42
Table 15. Recession Rates of Reinfiltrated Panels ....................................................................... 44
Table 16. Flexural Strength Data for Polycarbosilane Panel ........................................................ 46
Table 17. Flexural Strength Data for Reinfiltrated Panel ............................................................. 47
Table 18. Materials for LBF103 ................................................................................................... 51
Table 19. Cure Cycle for LBF103 ................................................................................................ 51
xi
Table 20. Post Cure for LBF103 ................................................................................................... 51
Table 21. Pyrolysis Cycle for LBF103 ......................................................................................... 52
Table 22. Post Pyrolysis for LBF103 ............................................................................................ 52
Table 23. Materials for LBF104 ................................................................................................... 53
Table 24. Cure Cycle for LBF104 ................................................................................................ 53
Table 25. Post Cure for LBF104 ................................................................................................... 53
Table 26. Pyrolysis Cycle for LBF104 ......................................................................................... 54
Table 27. Post Pyrolysis for LBF104 ............................................................................................ 54
Table 28. Materials for LBF105 ................................................................................................... 55
Table 29. Cure Cycle for LBF105 ................................................................................................ 55
Table 30. Post Cure for LBF105 ................................................................................................... 55
Table 31. Pyrolysis Cycle for LBF105 ......................................................................................... 56
Table 32. Post Pyrolysis for LBF105 ............................................................................................ 56
Table 33. Materials for LBF106 ................................................................................................... 57
Table 34. Cure Cycle for LBF106 ................................................................................................ 57
Table 35. Post Cure for LBF106 ................................................................................................... 57
Table 36. Pyrolysis Cycle for LBF106 ......................................................................................... 58
Table 37. Post Pyrolysis for LBF106 ............................................................................................ 58
Table 38. Materials for LBF107 ................................................................................................... 59
Table 39. Cure Cycle for LBF107 ................................................................................................ 59
Table 40. Post Cure for LBF107 ................................................................................................... 59
Table 41. Pyrolysis Cycle for LBF107 ......................................................................................... 60
xii
Table 42. Post Pyrolysis for LBF107 ............................................................................................ 60
Table 43. Materials for LBF203 ................................................................................................... 61
Table 44. Cure Cycle for LBF203 ................................................................................................ 61
Table 45. Post Cure for LBF203 ................................................................................................... 61
Table 46. Pyrolysis Cycle for LBF203 ......................................................................................... 62
Table 47. Post Pyrolysis for LBF203 ............................................................................................ 62
Table 48. Materials for LBF204 ................................................................................................... 63
Table 49. Cure Cycle for LBF204 ................................................................................................ 63
Table 50. Post Cure for LBF204 ................................................................................................... 63
Table 51. Pyrolysis Cycle for LBF204 ......................................................................................... 64
Table 52. Post Pyrolysis for LBF204 ............................................................................................ 64
Table 53. Materials for LBF206 ................................................................................................... 65
Table 54. Cure Cycle for LBF206 ................................................................................................ 65
Table 55. Post Cure for LBF206 ................................................................................................... 65
Table 56. Pyrolysis Cycle for LBF206 ......................................................................................... 66
Table 57. Post Pyrolysis for LBF206 ............................................................................................ 66
Table 58. Materials for LBF207 ................................................................................................... 67
Table 59. Cure Cycle for LBF207 ................................................................................................ 67
Table 60. Post Cure for LBF207 ................................................................................................... 67
Table 61. Pyrolysis Cycle for LBF207 ......................................................................................... 68
Table 62. Materials for LBF208 ................................................................................................... 69
Table 63. Cure Cycle for LBF208 ................................................................................................ 69
xiii
Table 64. Post Cure for LBF208 ................................................................................................... 69
Table 65. Pyrolysis Cycle for LBF208 ......................................................................................... 70
Table 66. Materials for LBF214 ................................................................................................... 71
Table 67. Cure Cycle for LBF214 ................................................................................................ 71
Table 68. Post Cure for LBF214 ................................................................................................... 71
Table 69. Pyrolysis Cycle for LBF214 ......................................................................................... 72
Table 70. Post Pyrolysis for LBF214 ............................................................................................ 72
Table 71. Materials for LBF215 ................................................................................................... 73
Table 72. Cure Cycle for LBF215 ................................................................................................ 73
Table 73. Post Cure for LBF215 ................................................................................................... 73
Table 74. Pyrolysis Cycle for LBF215 ......................................................................................... 74
Table 75. Post Pyrolysis for LBF215 ............................................................................................ 74
Table 76. Post Reinfiltration #1 for LBF215 ................................................................................ 75
Table 77. Post Reinfiltration #2 for LBF215 ................................................................................ 75
Table 78. Materials for LBF216 ................................................................................................... 76
Table 79. Cure Cycle for LBF216 ................................................................................................ 76
Table 80. Post Cure for LBF216 ................................................................................................... 76
Table 81. Pyrolysis Cycle for LBF216 ......................................................................................... 77
Table 82. Post Pyrolysis for LBF216 ............................................................................................ 77
Table 83. Post Reinfiltration #1 for LBF216 ................................................................................ 78
Table 84. Post Reinfiltration #2 for LBF216 ................................................................................ 78
Table 85. Materials for LBF222 ................................................................................................... 79
xiv
Table 86. Cure Cycle for LBF222 ................................................................................................ 79
Table 87. Post Cure for LBF222 ................................................................................................... 79
Table 88. Pyrolysis Cycle for LBF222 ......................................................................................... 80
Table 89. Post Pyrolysis for LBF222 ............................................................................................ 80
Table 90. Reinfiltration Cycle for LBF222 ................................................................................... 81
Table 91. Post Reinfiltration #1 for LBF222 ................................................................................ 81
Table 92. Post Reinfiltration #2 for LBF222 ................................................................................ 82
Table 93. Materials for LBF224 ................................................................................................... 83
Table 94. Cure Cycle for LBF224 ................................................................................................ 83
Table 95. Post Cure for LBF224 ................................................................................................... 83
Table 96. Pyrolysis Cycle for LBF224 ......................................................................................... 84
Table 97. Post Pyrolysis for LBF224 ............................................................................................ 84
Table 98. Reinfiltration Cycle for LBF224 ................................................................................... 85
Table 99. Post Reinfiltration #1 for LBF224 ................................................................................ 85
Table 100. Post Reinfiltration #2 for LBF224 .............................................................................. 85
Table 101. Materials for LBF225 ................................................................................................. 86
Table 102. Cure Cycle for LBF225 .............................................................................................. 86
Table 103. Post Cure for LBF225 ................................................................................................. 86
Table 104. Pyrolysis Cycle for LBF225 ....................................................................................... 87
Table 105. Post Pyrolysis for LBF225 .......................................................................................... 87
Table 106. Reinfiltration Cycle for LBF225 ................................................................................. 88
Table 107. Post Reinfiltration #1 for LBF225 .............................................................................. 88

xv
Table 108. Post Reinfiltration #2 for LBF225 .............................................................................. 88
1
CHAPTER ONE: BACKGROUND
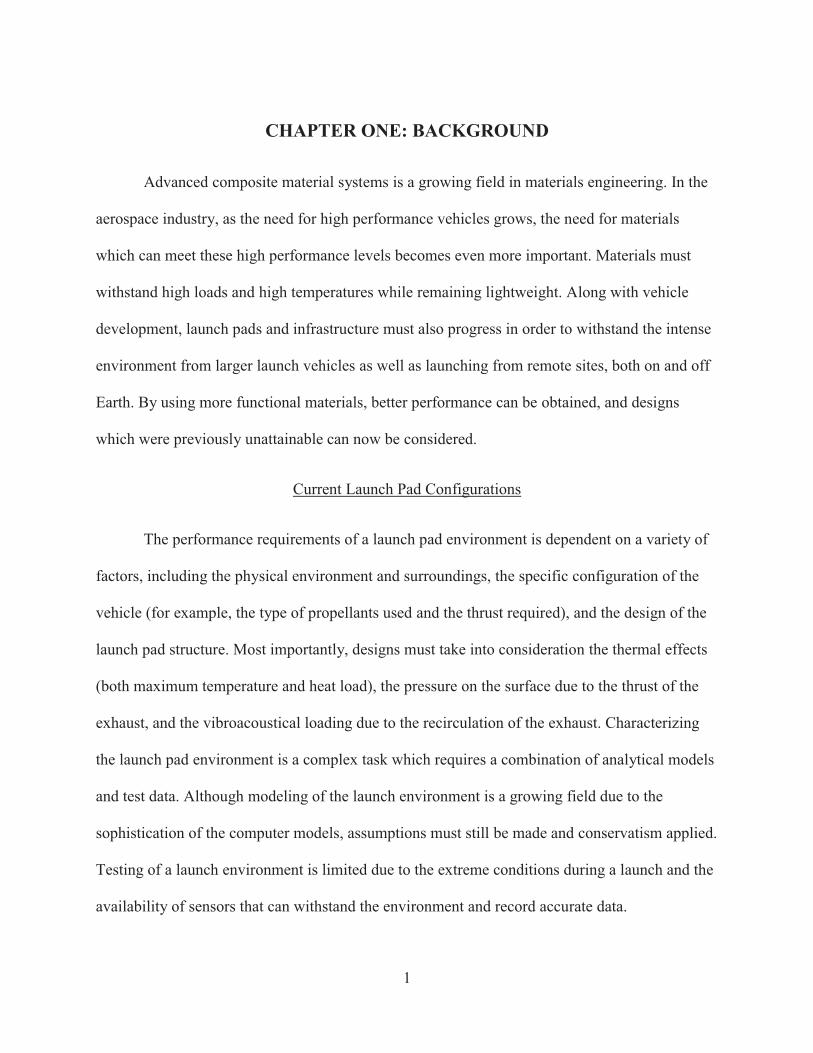
Advanced composite material systems is a growing field in materials engineering. In the
aerospace industry, as the need for high performance vehicles grows, the need for materials
which can meet these high performance levels becomes even more important. Materials must
withstand high loads and high temperatures while remaining lightweight. Along with vehicle
development, launch pads and infrastructure must also progress in order to withstand the intense
environment from larger launch vehicles as well as launching from remote sites, both on and off
Earth. By using more functional materials, better performance can be obtained, and designs
which were previously unattainable can now be considered.
Current Launch Pad Configurations
The performance requirements of a launch pad environment is dependent on a variety of
factors, including the physical environment and surroundings, the specific configuration of the
vehicle (for example, the type of propellants used and the thrust required), and the design of the
launch pad structure. Most importantly, designs must take into consideration the thermal effects
(both maximum temperature and heat load), the pressure on the surface due to the thrust of the
exhaust, and the vibroacoustical loading due to the recirculation of the exhaust. Characterizing
the launch pad environment is a complex task which requires a combination of analytical models
and test data. Although modeling of the launch environment is a growing field due to the
sophistication of the computer models, assumptions must still be made and conservatism applied.
Testing of a launch environment is limited due to the extreme conditions during a launch and the
availability of sensors that can withstand the environment and record accurate data.
2
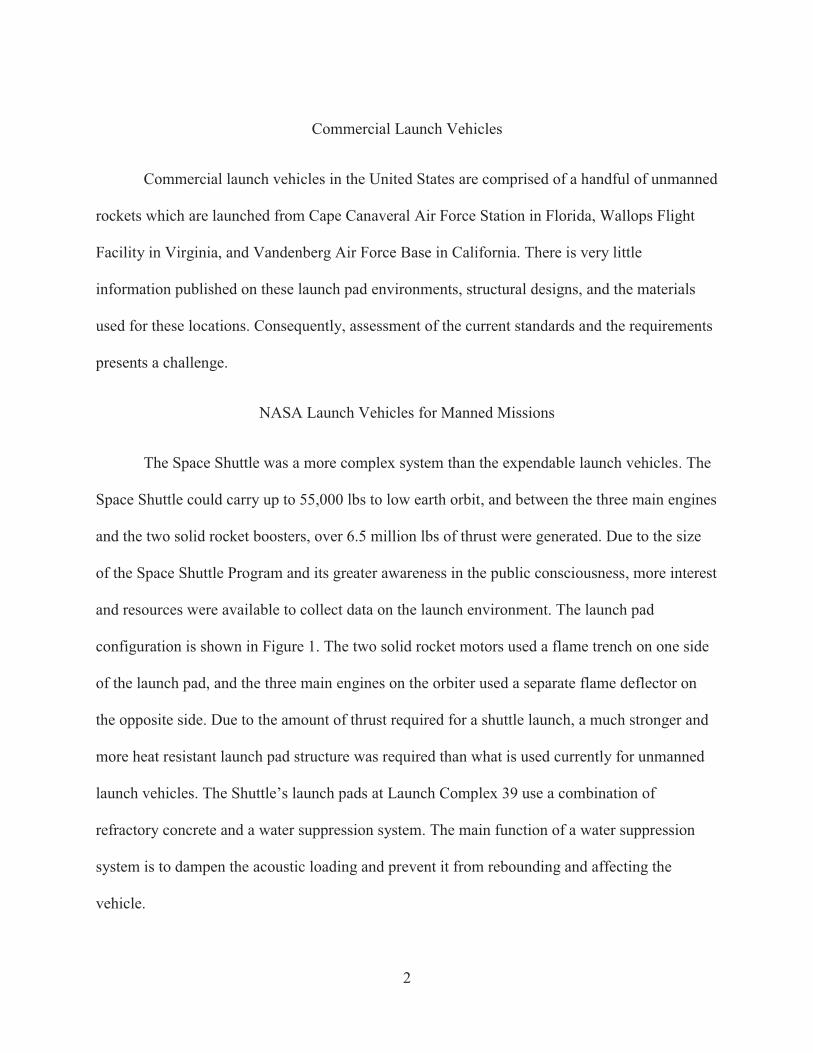
Commercial Launch Vehicles
Commercial launch vehicles in the United States are comprised of a handful of unmanned
rockets which are launched from Cape Canaveral Air Force Station in Florida, Wallops Flight
Facility in Virginia, and Vandenberg Air Force Base in California. There is very little
information published on these launch pad environments, structural designs, and the materials
used for these locations. Consequently, assessment of the current standards and the requirements
presents a challenge.
NASA Launch Vehicles for Manned Missions
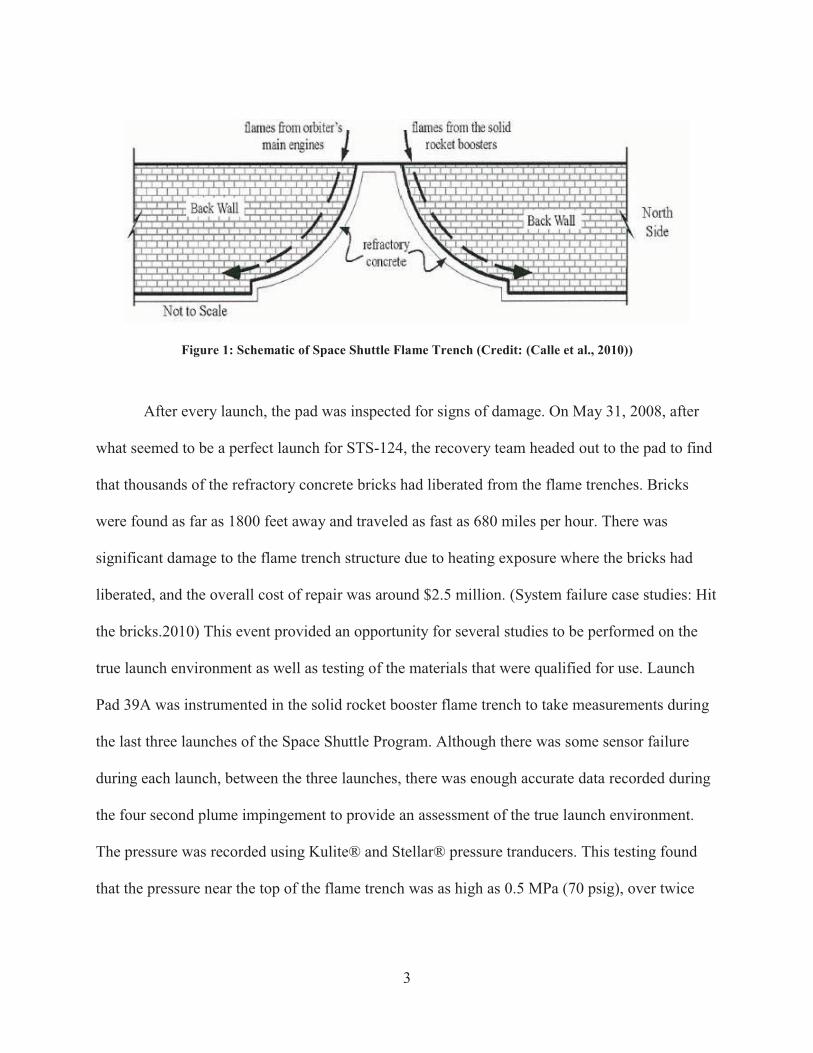
The Space Shuttle was a more complex system than the expendable launch vehicles. The
Space Shuttle could carry up to 55,000 lbs to low earth orbit, and between the three main engines
and the two solid rocket boosters, over 6.5 million lbs of thrust were generated. Due to the size
of the Space Shuttle Program and its greater awareness in the public consciousness, more interest
and resources were available to collect data on the launch environment. The launch pad
configuration is shown in Figure 1. The two solid rocket motors used a flame trench on one side
of the launch pad, and the three main engines on the orbiter used a separate flame deflector on
the opposite side. Due to the amount of thrust required for a shuttle launch, a much stronger and
more heat resistant launch pad structure was required than what is used currently for unmanned
launch vehicles. The Shuttle’s launch pads at Launch Complex 39 use a combination of
refractory concrete and a water suppression system. The main function of a water suppression
system is to dampen the acoustic loading and prevent it from rebounding and affecting the
vehicle.
3
Figure 1: Schematic of Space Shuttle Flame Trench (Credit: (Calle et al., 2010))
After every launch, the pad was inspected for signs of damage. On May 31, 2008, after
what seemed to be a perfect launch for STS-124, the recovery team headed out to the pad to find
that thousands of the refractory concrete bricks had liberated from the flame trenches. Bricks
were found as far as 1800 feet away and traveled as fast as 680 miles per hour. There was
significant damage to the flame trench structure due to heating exposure where the bricks had
liberated, and the overall cost of repair was around $2.5 million. (System failure case studies: Hit
the bricks.2010) This event provided an opportunity for several studies to be performed on the
true launch environment as well as testing of the materials that were qualified for use. Launch
Pad 39A was instrumented in the solid rocket booster flame trench to take measurements during
the last three launches of the Space Shuttle Program. Although there was some sensor failure
during each launch, between the three launches, there was enough accurate data recorded during
the four second plume impingement to provide an assessment of the true launch environment.
The pressure was recorded using Kulite® and Stellar® pressure tranducers. This testing found
that the pressure near the top of the flame trench was as high as 0.5 MPa (70 psig), over twice
4
what is called out in GP-1059, which was the Space Shuttle specification for the thermal and
pressure environment at the launch pad. The ignition overpressure at Mission Elapsed Time
(MET) + 0.3 seconds spiked to 1.1 MPa (160 psig) in the middle of the flame trench. Another
finding was that at the bottom of the flame trench, negative pressure was recorded, indicating a
partial vacuum condition, until around MET + 3 seconds, after which point the vehicle is
traversing across the pad and the plume is directly impinging at this location. (von Eckroth et al.,
2012)
Thermal measurements were recorded by a Medtherm® calorimeter and Nanmac®
erodible thermocouples. Additionally, a Tungsten Piston calorimeter was developed at Kennedy
Space Center which could withstand the plume and be used in comparison with the other sensors.
The temperature sensors located at the top of the flame trench failed during all three launches.
Before data cutoff, the highest temperature value recorded at MET + 3.3 was 1180°C (2160°F),
which is only about half of what is predicted in GP-1059. The authors of this study suggest this
incongruity results from a boundary layer formed across the flame trench surface, insulating it
from the higher heat. They suggest that “factors contributing to the formation of the boundary
layer include the sound suppression system water, the supersonic plume speed, and the
undulations in the [flame deflector] surface.” The average maximum heat rate from all the
recorded data is 908 W/cm2 (800 BTU/ft2-sec), which is about ¼ of the value in GP-1059.
Overall heating for the 4 second event is around 2.5 KJ/cm2 (2200 BTU/ft2), while GP-1059
gives this value as 9 KJ/cm2 (8000 BTU/ft2). The authors suggest that this discrepancy is due to
the short duration spikes up to 3500 BTU/ft2-sec, which occur throughout the launch as the
alumina particles, or slag, are ejected from the plume and contact the sensor. The original authors
5
of GP-1059 would not have been able to measure the short duration of these events due to the
instrumentation available at that time; this caused the requirement to be overly conservative. The
heat rate for the gaseous portion of the plume was measured to be around 350 BTU/ft2-sec. (von
Eckroth et al., 2012)
The vibrational loads were measured with PCB® accelerometers. A sensor was also
placed in a location that did not see direct impingement from the plume, in order to measure the
acoustic loading. The peak recorded is around 15 psig, with a sustained value of 10 psig; the
sustainment is only for 2 seconds. (von Eckroth et al., 2012)
Current Materials in Use
Most unmanned launch structures are comprised of carbon steel structures which use a
water deluge system for both heat and sound suppression. Steel structures are commonly used
because of their high temperature capabilities. Again, there is little published information on the
performance of these structures.
The Shuttle’s launch pads at Launch Complex 39 used a refractory concrete, designed to
specification KSC-SPEC-P-0012, in order to protect the areas which see the highest heat and
pressure loading during a launch. The concrete requirements pertinent to this study are that it
shall have a compressive strength of 31 MPa (4500 psi), and when exposed to a heat flux up to
3750 W/cm2 (3300 BTU/ft2-sec) for 10 seconds, it “shall not crack, spall, or erode more than 1/8
inch.” The material must also be able to handle the natural environment of the launch pad, such
as humidity and sea salt exposure, without degradation of properties. (Refractory concrete,
specification for1979)
6
A study completed at Kennedy Space Center in 2010 compared Fondue Fyre, which is
the only qualified refractory material for use at the Launch Complex 39 pads, with two other
materials: Ultra-Tek FS Gun Mix and Kruzite GR Plus. Two Fondue Fyre samples were tested;
one prepared per the manufacturer, and the other one prepared at the pad as would be done for a
repair. All of the specimens were made using the gunite method. After manufacture, the
specimens were subjected to a variety of testing, including bending, thermal shock, and
compression after environmental conditioning. Modulus of rupture was determined with 3 point
bending per ASTM C133: Standard Test Methods for Cold Crushing Strength and Modulus of
Rupture of Refractories. Compression strength was tested per ASTM C133 on a control sample
as well as after three different exposures: environmental exposure at the Corrosion Technology
Laboratory Beachside Atmospheric Exposure Facility, located at Kennedy Space Center;
submerged in water for 1 month, to simulate the sound suppression system deluge during launch;
and submerged in .1M hydrochloric acid for 10 days, to simulate the solid rocket booster plume.
Thermal shock testing was conducted similarly to ASTM C1171. The specimens were subjected
to 3 thermal cycles which consisted of 15 minutes at 1100°C followed by 10 minutes at room
temperature.
7
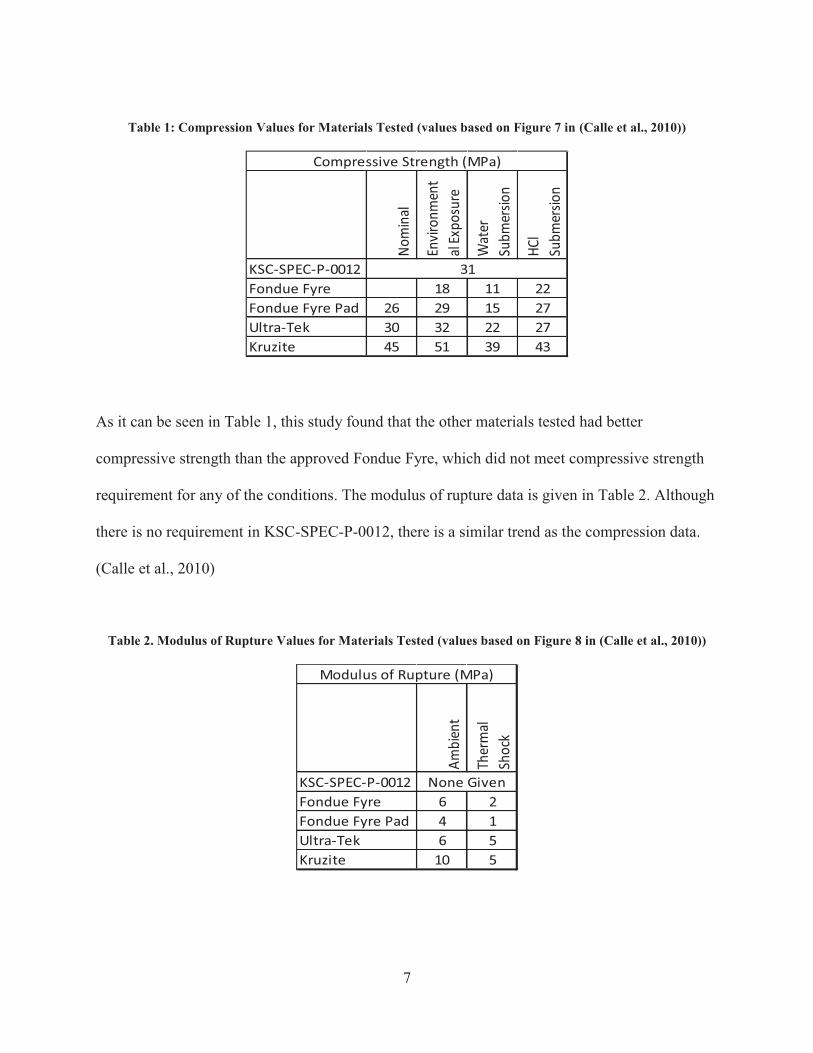
Table 1: Compression Values for Materials Tested (values based on Figure 7 in (Calle et al., 2010))
Nom
inal
Envir
onm
ent
al Ex
posu
re
Wat
er
Subm
ersio
n
HCl
Subm
ersio
n
KSC-SPEC-P-0012Fondue Fyre 18 11 22Fondue Fyre Pad 26 29 15 27Ultra-Tek 30 32 22 27Kruzite 45 51 39 43
31
Compressive Strength (MPa)
As it can be seen in Table 1, this study found that the other materials tested had better
compressive strength than the approved Fondue Fyre, which did not meet compressive strength
requirement for any of the conditions. The modulus of rupture data is given in Table 2. Although
there is no requirement in KSC-SPEC-P-0012, there is a similar trend as the compression data.
(Calle et al., 2010)
Table 2. Modulus of Rupture Values for Materials Tested (values based on Figure 8 in (Calle et al., 2010))
Ambi
ent
Ther
mal
Shoc
k
KSC-SPEC-P-0012Fondue Fyre 6 2Fondue Fyre Pad 4 1Ultra-Tek 6 5Kruzite 10 5
Modulus of Rupture (MPa)
None Given
8
Based on the most recent launch pad environment data, and the measured performance of
existing materials, additional studies will be required to support future used of the existing
launch pads.
Future Launch Pad Requirements
Kennedy Space Center is investigating the development of a portable and deployable launch
pad system which will have the capability to be transported and assembled at any location. As
future mission plans include hardware architectures using much smaller vehicles than the
heritage Saturn V and Space Shuttle rockets, this type of launch system is becoming necessary
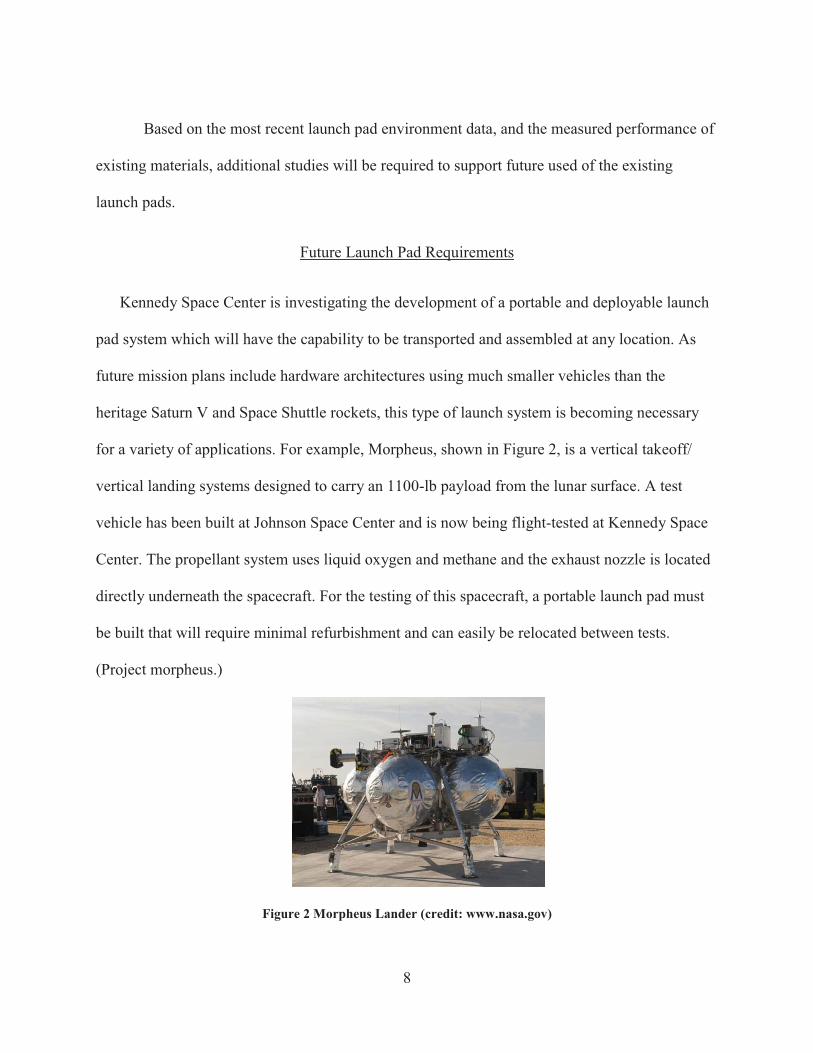
for a variety of applications. For example, Morpheus, shown in Figure 2, is a vertical takeoff/
vertical landing systems designed to carry an 1100-lb payload from the lunar surface. A test
vehicle has been built at Johnson Space Center and is now being flight-tested at Kennedy Space
Center. The propellant system uses liquid oxygen and methane and the exhaust nozzle is located
directly underneath the spacecraft. For the testing of this spacecraft, a portable launch pad must
be built that will require minimal refurbishment and can easily be relocated between tests.
(Project morpheus.)
Figure 2 Morpheus Lander (credit: www.nasa.gov)

9
Another portable launch pad application is for launch vehicles specifically developed for
smaller payloads. These small payloads, or nanosatellites, are developed by industry,
government, and academia to collect data and perform experiments in microgravity. Currently,
these types of payloads are secondary to a larger payload on a launch vehicle. This has the
benefit of reducing the launch cost, but it is then restricted to the schedule and the orbit of the
primary payload. As the demand for this service continues to grow, more efficient and effective
deployment would be provided by launch systems designed specifically for these payloads.
SWORDS (Soldier-Warfighter Operationally Responsive Deployer for Space), shown in Figure
3, is a collaboration between the Office of the Secretary of Defense, U.S. Army Space and
Missile Defense Command/Army Forces Strategic Command, and NASA to develop a launch
system which will deliver nanosatellites to orbit as a primary payload at a reduced cost.
SWORDS will have the capability to launch a 55-lb payload into orbit. It uses liquid oxygen and
methane for the propellant. The launch system must have the ability to launch quickly from a
variety of locations, depending on the orbit requirements of the payload. These locations will
have minimal infrastructure, requiring a portable, deployable launch pad. (SWORDS: Soldier-
warfighter operationally responsive deployer for space.)
Figure 3 SWORDS Launcher (http://www.smdc.army.mil/FactSheets/SWORDS.pdf)
10
These are just two examples of the need for a deployable, lightweight launch structure.
Carbon steel and refractory concrete are less than ideal materials for this type of structure due to
their weight and the necessary infrastructure. Materials developed for launch pad structures must
be able to handle the harsh environment during launch and be reusable with minimal
refurbishment between launches. This requires the materials to be able to survive in the launch
environment with minimal degradation. In addition, the desired portability of the launch pad
requires the structure to be lightweight; Ease of transportation becomes an important
consideration, as does assembly without the need for a large crane or other heavy lift equipment.
Development of a launch pad that is reusable and lightweight will reduce the costs of
refurbishment and transportation.
A New Launch Pad Structure Material
The standard materials that have been used for the Space Shuttle pads as well as the
expendable launch vehicles have been adequate, but with the need for smaller deployable pads,
other materials need to be explored. Fiber reinforced composites have become more prevalent as
structural materials because of their strength to weight ratio. The combination of fibers and
matrix can be tailored to specifically meet unique requirements. This would be ideal for a
lightweight, high temperature application. Ceramic matrix composites maintain their properties
at high temperatures, and the continuous fiber reinforcement provides increased strength in an
otherwise brittle material. In this study, a ceramic matrix composite is fabricated and tested for
high temperature and mechanical capabilities.
11
CHAPTER TWO: LITERATURE REVIEW
The development of high temperature structural composite materials has been very
limited due to the high cost of the materials and the processing required. Polymer matrix
composites are popular for structural components because the resins used have low viscosity,
allowing complex shapes to be formed prior to curing. However, their use in elevated
temperatures is limited; high temperature polymers such as bismaleimides and polyimides have a
maximum operating temperature around 300°C. (Mangalgiri, 2005) One study, which exposed
bismaliemide composites to 260°C demonstrated a steady state of mass loss, reaching 25% loss
after 3000 hours; this correlated with degradation in mechanical properties during bend testing.
(Hague et al., 2014)
Ceramic materials operate at much higher temperatures but are more expensive to
produce in bulk volumes than polymer matrix derivatives. The primary methods of producing a
continuous fiber reinforced ceramic matrix composite are chemical vapor infiltration, reactive
melt infiltration, slurry impregnation and hot pressing, and polymer infiltration and pyrolysis.
Chemical vapor deposition uses a gaseous precursor and diffuses it into the fiber preform. This
allows for deposition of the matrix at the nanometer-scale, but it is relatively slow. The other
three methods use a liquid precursor, which is optimal for making structural components as the
quicker infiltration of the matrix allows the formation of larger shapes in a reasonable time
period. Reactive melt infiltration requires the matrix material to melt in order to penetrate the
fiber form. This requires the elements in the matrix to have low melting temperatures or else the
fibers are at risk for damage. For slurry impregnation and hot pressing, the fiber form is
impregnated with a slurry and put into a hot press, which could potentially damage the fiber.
12
Polymer infiltration and pyrolysis (PIP) begins with a polymer precursor which is combined with
the fibers and cured in an oxygen environment to allow for crosslinking, which inhibits any
further shape changes. The part is then pyrolized at high temperatures in an inert environment,
removing the polymer chains and leaving the ceramic backbone. The part then requires
reinfiltration with the polymer and further pyrolysis cycles in order to increase the density of the
ceramic matrix which maximizes the ceramic content and increases the strength. (Naslain, 1999)
Although carbon fibers are typically used for aerospace applications, basalt fibers have
been receiving more attention due to their strength, temperature capabilities, and the abundance
of basalt on Earth as well as other planetary bodies, making these fibers attractive for future
aerospace applications. Continuous basalt fibers are becoming more readily available in a variety
of fabric styles. The combination of basalt with polymer derived ceramics is an area of
composites which has seen little research to date but is becoming more popular.
Polymer Derived Ceramics
Several polymers have been studied as a polymer derived ceramic (PDC) for PIP
processing. Polysiloxanes, polycarbosilanes, and polysilazanes can all be pyrolized to form
silicon carbide. Polysiloxanes (PSX) contain a Si-O-C, or silicon oxycarbide, backbone when
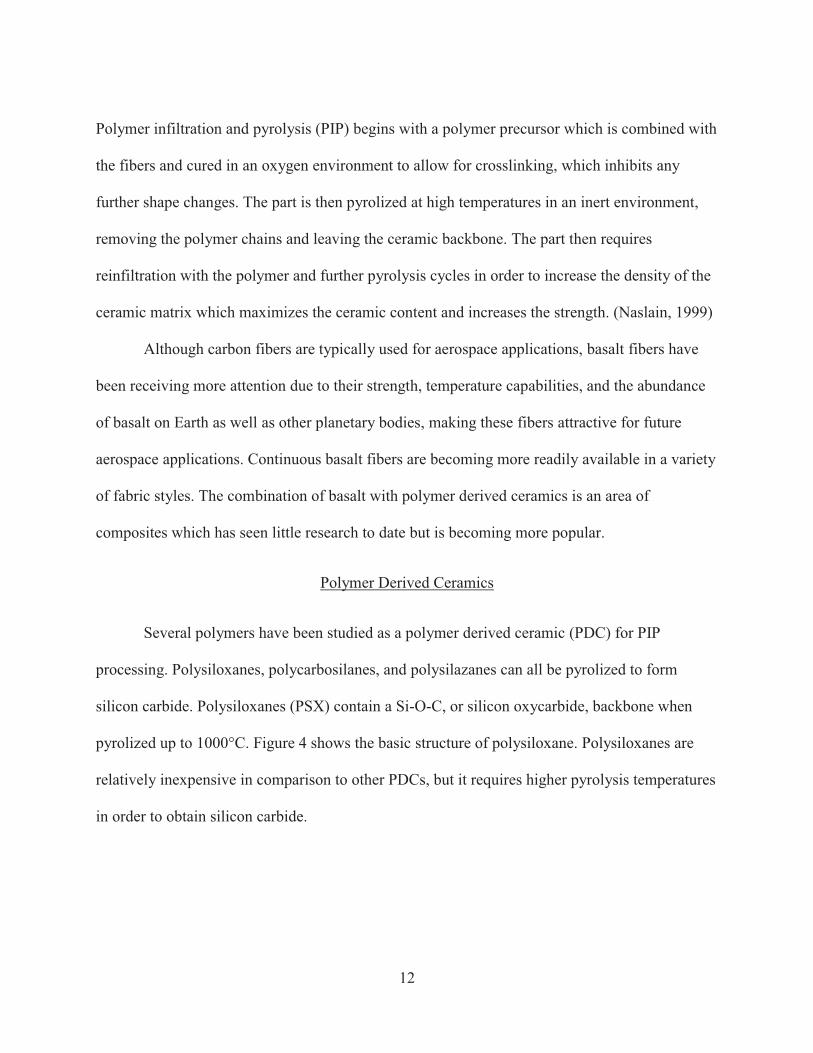
pyrolized up to 1000°C. Figure 4 shows the basic structure of polysiloxane. Polysiloxanes are
relatively inexpensive in comparison to other PDCs, but it requires higher pyrolysis temperatures
in order to obtain silicon carbide.
13
Figure 4 Structure of a Linear Polysiloxane (Torrey et al., 2006)
A study by Gumula et. al. in 2009 examined four PSX resins with varying ratios of
carbon to silicon. These variations were compared to the mass loss as the polymer was pyrolized
to a silicon carbide, SiC, from 1000° to 1700°C. This study concluded that a 1:1 ratio produced
the lowest mass loss, but it was also the only sample to remain as a silicon oxycarbide at 1700°C,
while the others had converted to silicon carbide. (Gumula, Paluszkiewicz, & Blazewicz, 2009)
A follow-up study in 2013 examined the effects of adding continuous carbon fibers to the
polymer. The results of this testing indicated that the addition of carbon fibers caused an increase
in mass loss at 1700°C. The authors suggest that an increase in the surface area at the
matrix/fiber interface affects the conversion of the matrix, which increases the gasses produced
and the pores that develop. (Gumula & Blazewicz, 2013)
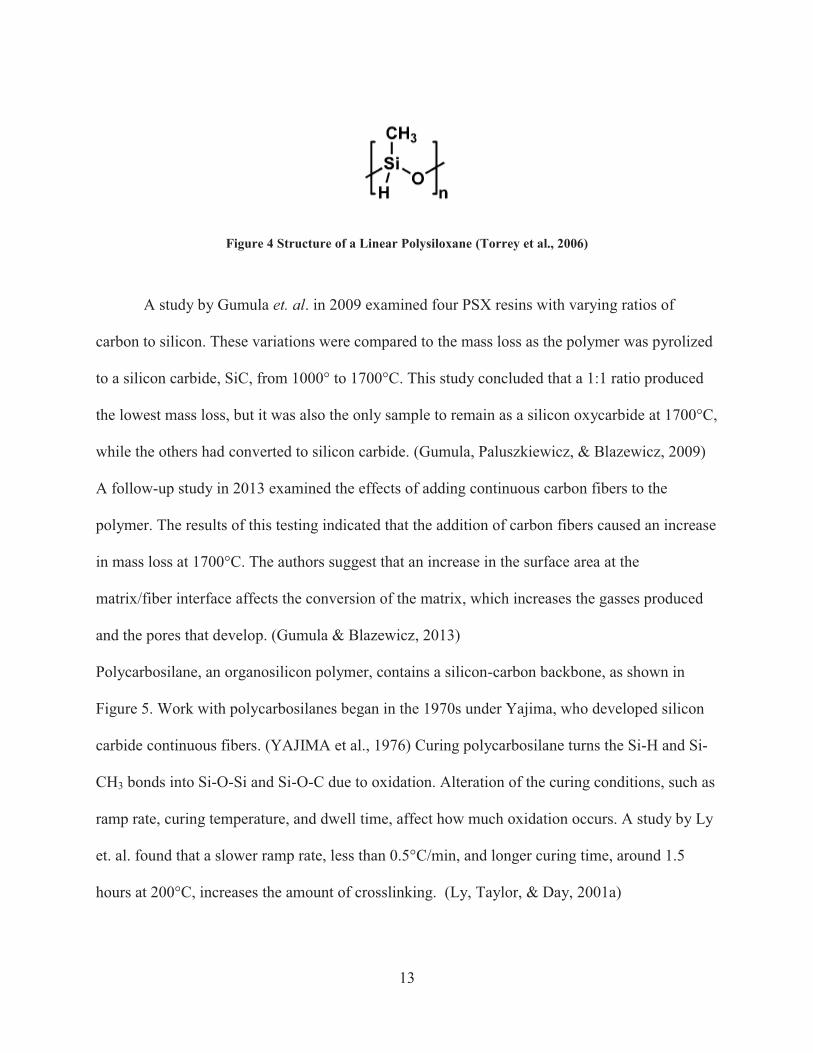
Polycarbosilane, an organosilicon polymer, contains a silicon-carbon backbone, as shown in
Figure 5. Work with polycarbosilanes began in the 1970s under Yajima, who developed silicon
carbide continuous fibers. (YAJIMA et al., 1976) Curing polycarbosilane turns the Si-H and Si-
CH3 bonds into Si-O-Si and Si-O-C due to oxidation. Alteration of the curing conditions, such as
ramp rate, curing temperature, and dwell time, affect how much oxidation occurs. A study by Ly
et. al. found that a slower ramp rate, less than 0.5°C/min, and longer curing time, around 1.5
hours at 200°C, increases the amount of crosslinking. (Ly, Taylor, & Day, 2001a)
14
During the pyrolysis, the resin forms a Si-O-C phase; around 1200°C, β-SiC begins to
crystallize. This is similar to the pyrolysis of the polysiloxane, except that the transformation to
β-SiC occurs at a lower temperature. A follow up study by Ly et. al. found that pyrolyzing
uncured polycarbosilane resulted in β-SiC crystallization at even lower temperatures, around
1000°C. (Ly et al., 2001b) Therefore, curing and pyrolization methods can be adjusted to get the
optimal properties needed for the application.
Figure 5 Polycarbosilane Structure (Ly et al., 2001a)
Several studies have researched carbon fiber reinforced ceramic matrix composites, but
only a few have looked at the PIP process using polycarbosilane reinforced with carbon fiber.
One study compared the microstructure of two carbon fibers and the effects of how they bonded
to the resin and transformed during pyrolysis. For ceramic matrix composites, the flexural
strength is increased when the fibers are weakly bonded to the matrix and instead absorb energy
through the friction between the fiber and the matrix. When the bond is strong, the fibers have a
brittle failure that occurs at the same loading as the matrix; this prevents the fibers from serving
as a reinforcement. (Zheng et al., 1999) Another study tested the flexural strength of carbon fiber
reinforced polycarbosilane composites. It found the strength to be 27 MPa and the failure to be
less brittle than monolithic ceramics. (Nicholas et al., 2012)
15
Continuous Basalt Fiber
Basalt is a naturally occurring material found in volcanic rock. Although the use of basalt
in structural and high temperature applications has been under development for over 50 years,
only in the past decade has there been an emergence of published research on the incorporation
of basalt fibers as reinforcement in composites. Carbon fibers are widely used because of their
high thermal and mechanical properties, but they are expensive. Glass fibers are less expensive,
but have a lower operating temperature than carbon fibers. Basalt fibers are around the same cost
as glass fibers, but they have a higher operating temperature and slightly higher mechanical and
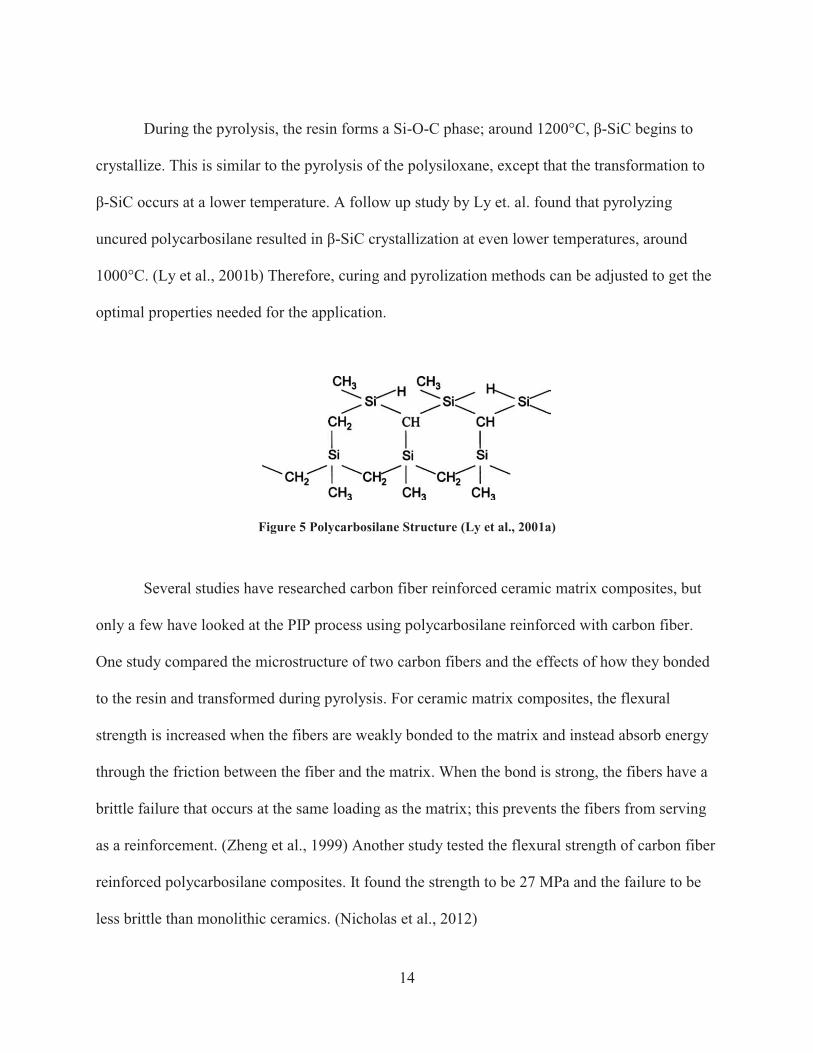
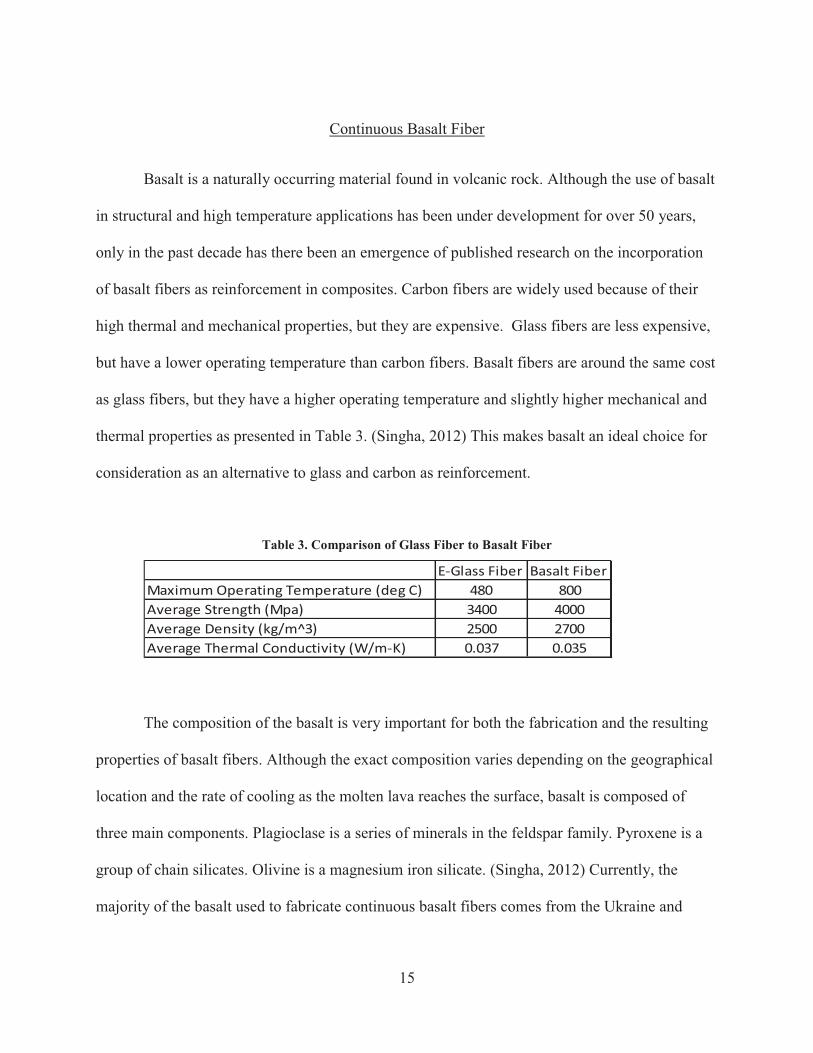
thermal properties as presented in Table 3. (Singha, 2012) This makes basalt an ideal choice for
consideration as an alternative to glass and carbon as reinforcement.
Table 3. Comparison of Glass Fiber to Basalt Fiber
E-Glass Fiber Basalt FiberMaximum Operating Temperature (deg C) 480 800Average Strength (Mpa) 3400 4000Average Density (kg/m^3) 2500 2700Average Thermal Conductivity (W/m-K) 0.037 0.035
The composition of the basalt is very important for both the fabrication and the resulting
properties of basalt fibers. Although the exact composition varies depending on the geographical
location and the rate of cooling as the molten lava reaches the surface, basalt is composed of
three main components. Plagioclase is a series of minerals in the feldspar family. Pyroxene is a
group of chain silicates. Olivine is a magnesium iron silicate. (Singha, 2012) Currently, the
majority of the basalt used to fabricate continuous basalt fibers comes from the Ukraine and
16
Georgia. When compared with basalt mined from other regions, the differences in the viscosity
and melting temperatures affect the fabrication process of long continuous fibers. (A. G.
Novitskii & Efremov, 2013) Basalt fiber has an acidity modulus, which is the ratio of acidic to
basic oxides, greater than 1.5 which gives it the desired properties such as high strength at
elevated temperatures and acoustic dampening. (Czigány, 2005) This high acidity modulus is due
a silicon oxide level greater than 46%. (Militky & Kovacic, 2000) The basalt composition found
in the Ukraine has a silicon oxide content of greater than 50%, which again leads to these
improved properties. (A. G. Novitskii & Efremov, 2013)
Basalt fibers can be formed by either the Junkers method or the spinneret method. The
Junkers method uses melt blowing to form short fibers. Long continuous fibers are made using
the spinneret method, which uses more precise methods to form and size the fibers. (Singha,
2012) A study on the fabrication of long fibers by Novitskii and Efremov found that the
temperature, length of time at the temperature, and the cooling rate all affect the properties of the
fiber. Of the two processes for fabricating long fibers compared in this study, the one which held
the melt at temperature for a longer period had better properties. (A. Novitskii & Efremov, 2011)
A study by Ivanitskii and Gorbachev looked at the fabrication of continuous basalt fibers using
the glass fiber fabrication process. Differences in the viscosity, crystallization, and wettability
between glass and basalt causes complications and therefore requires many alterations to the
glass fiber process in order to fabricate basalt fibers. (Ivanitskii & Gorbachev, 2011) Further
research and development into the fabrication process will increase the production of high
quality continuous basalt fibers and expand the development and use of these fibers in more
widespread applications.
17
Basalt is a good candidate due to its high elastic modulus, heat resistance, and acoustic
dampening. (Czigány, 2005) The literature gives tensile strength values from 1500 to 4000 MPa
and operating temperatures around 800°C. Above this, degradation begins to occur. The melting
point of basalt is around 1400°C.
Basalt fibers have also been found to perform well after being immersed in various
environments. Ying and Zhou compared the tensile strength of basalt fibers and glass fibers after
immersion in water, HCl, and NaOH. When in water or HCl, the glass fibers lost strength over
time. The basalt fibers had an initial slight decrease in strength, but then there was a period of
increased strength, followed by another decrease. The authors suggest that the chemical reactions
taking place between the fiber and the water or the HCl caused a protective layer on the fiber,
which increased the strength. As the reaction continued over time, the fiber began to degrade,
decreasing the strength. The fibers in the alkali solution underwent a chemical change on the
fiber surface which caused an immediate decrease in strength. (Ying & Zhou, 2013) Favorable
results for immersion in HCl are desirable as HCl exposure can be prevalent in a launch pad
environment.
One study looked at the use of basalt fiber composites for fire protection. This study cites
the high temperature capabilities and relatively low cost of basalt fibers. A flame test was
performed with an oxyacetylene torch. Two configurations were used: one with woven basalt in
an epoxy matrix and one with chopped basalt in concrete. Both tests showed better flame
resistance than a fiberglass and polyester resin composite panel and another thermal insulative
panel. The low thermal conductivity keeps the high temperature from spreading quickly through
the panel. (Landucci, Rossi, Nicolella, & Zanelli, 2009)
18
Because of the high temperature stability of basalt fibers, a series of studies was
performed on the mechanical behavior of the fibers alone as well as the effect of partial pyrolysis
on a polysiloxane matrix reinforced with basalt fibers. The high temperature tensile properties of
basalt fibers were found to be similar to those of glass fibers. (Cerny et al., 2007) This study of
basalt fiber reinforcement in a polysiloxane resin conducted pyrolysis at temperatures ranging
from 400°C to 800°C. Tensile testing found that the fiber is prone to elongation at temperatures
above 600�C and that microcracking in the matrix causes cracking in the fiber as well; the
authors suggest that further attention be paid to the processing pressure and temperature rates in
to mitigate these effects. The results of the study found that the elastic and shear moduli of the
composites increased with oxidative heat treatment, and the authors attribute this to a more
complete transformation of the polymer matrix to a ceramic matrix. (Glogar, Sucharda, Cerny,
Puchegger, & Peterlik, 2007) Another study performed mechanical testing on unidirectional
basalt fiber/polysiloxane composites, looking at both the pyrolysis temperature (650°C or 750°C)
and the effect of fiber surface treatment. This study found that the surface treatment and the
lower pyrolysis temperature increased the shear modulus but did not have significant effect on
the elastic modulus, which is dominated by the fibers. (Glogar et al., 2007) A more recent study
tested plain weave basalt fiber/polysiloxane composites at pyrolysis temperatures up to 800°C.
The flexural strength of the specimens pyrolized at 450°C only reached 30 MPa. As the pyrolysis
temperature was increased to 650°C, the flexural strength increased to slightly above 100 MPa.
Above 650°C, there was a slight decrease in the flexural strength. It is suggested that this
variation in flexural strength is due to a greater percentage of resin converted to a ceramic
matrix. (Cerny et al., 2014)
19
Thermal and Mechanical Testing of PIP CMCs
Thermal and mechanical testing of fiber reinforced ceramic matrix composites has
yielded promising results. Typically, oxyacetylene torch testing is used as it provides a quick
study of how the material handles a high heat load. One study performed on PIP processed C/Zr-
O-Si-C, using polycarbosilane as the SiC precursor, used bend testing and oxyacetylene torch
thermal input to characterize the material. For test panels pyrolized up to 1200°C, the flexural
strength was 370.6 MPa and the recession rate during torch testing was 0.0297 mm/sec. (Ma &
Chen, 2013)
20
CHAPTER THREE: FABRICATION
Panel Cure and Pyrolysis
Composite panel fabrication requires the consideration of several factors. The viscosity of
the resin and the fiber form used affects the ability of the resin to flow through the fabric,
influencing the porosity in the part. The cure cycle is optimized based on the temperature and the
time at temperature that the resin is exposed to. The method of fabrication, such as wet layup,
resin transfer mold, or preimpregnated fabrics, also affects the outcome of the part.
For this study of ceramic materials for a high temperature application, a polysiloxane and
a polycarbosilane were selected, both from Starfire Systems. Material properties provided by
Starfire are given in Table 4. Two different basalt fabrics were used, a biaxial fabric from
FiberStar and a plain weave fabric from Sudaglass Fiber Technology; material properties are
given in Table 5.
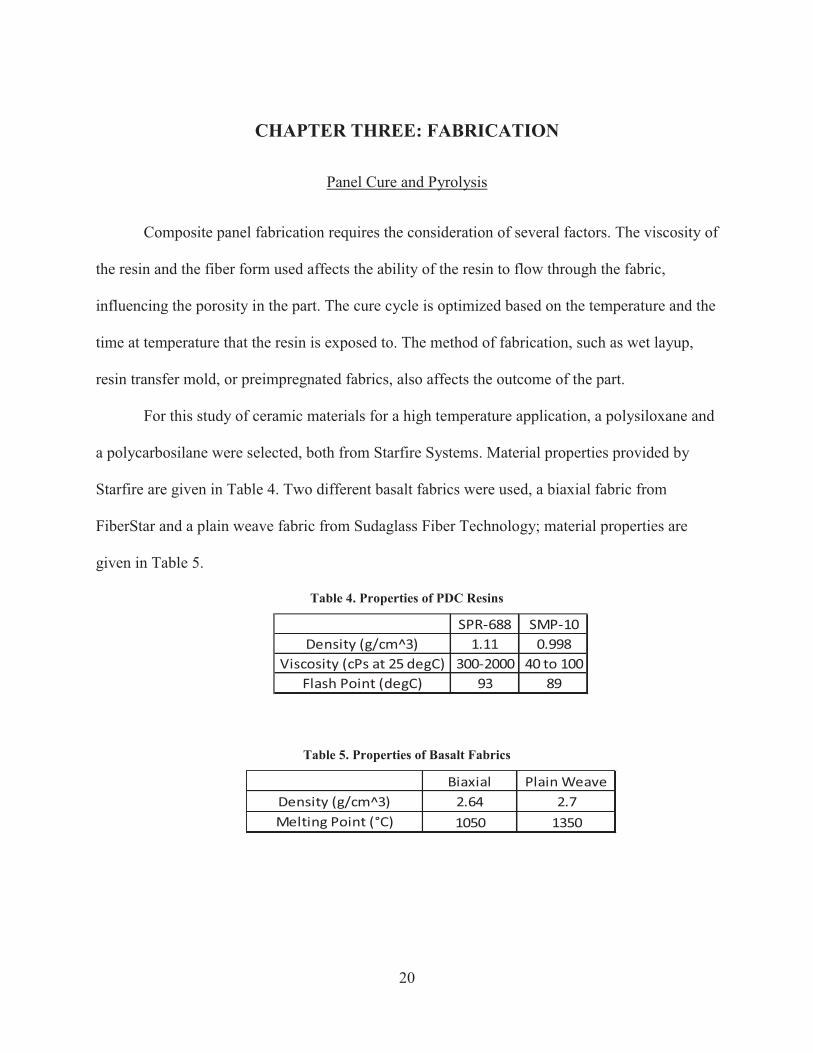
Table 4. Properties of PDC Resins
SPR-688 SMP-10Density (g/cm^3) 1.11 0.998
Viscosity (cPs at 25 degC) 300-2000 40 to 100Flash Point (degC) 93 89
Table 5. Properties of Basalt Fabrics
Biaxial Plain WeaveDensity (g/cm^3) 2.64 2.7Melting Point (°C) 1050 1350
21
Curing processes were provided by Starfire for hot press processing; this was used as a
basis for the cure cycle, with further direction provided in the study performed on SMP-10 and
carbon fibers. (Nicholas et al., 2012) The cure cycle for each of the PDCs was first developed by
curing resin only samples; small thin samples using basalt fiber were then cured to ensure an
acceptable part could be produced. The final cure cycle used for the test panels is given in Table
6; curing was performed in the autoclave under 28 inHg of vacuum and 20 psi of pressure. Small
specimens with six layers of basalt biaxial fabric were fabricated using a wet layup process; this
involves applying the resin to each layer of fabric and then stacking them. 2” x 3” specimens
were cut from these panels and subsequently pyrolized in a tube furnace. The pyrolysis cycle in
the tube furnace is given in Table 6. The hold time at 850°C ranged from 60 minutes to 150
minutes in order to determine the length of time required to obtain the greatest mass loss, which
correlates to the most ceramic conversion; it was determined that 90 minutes is the optimal hold
time.
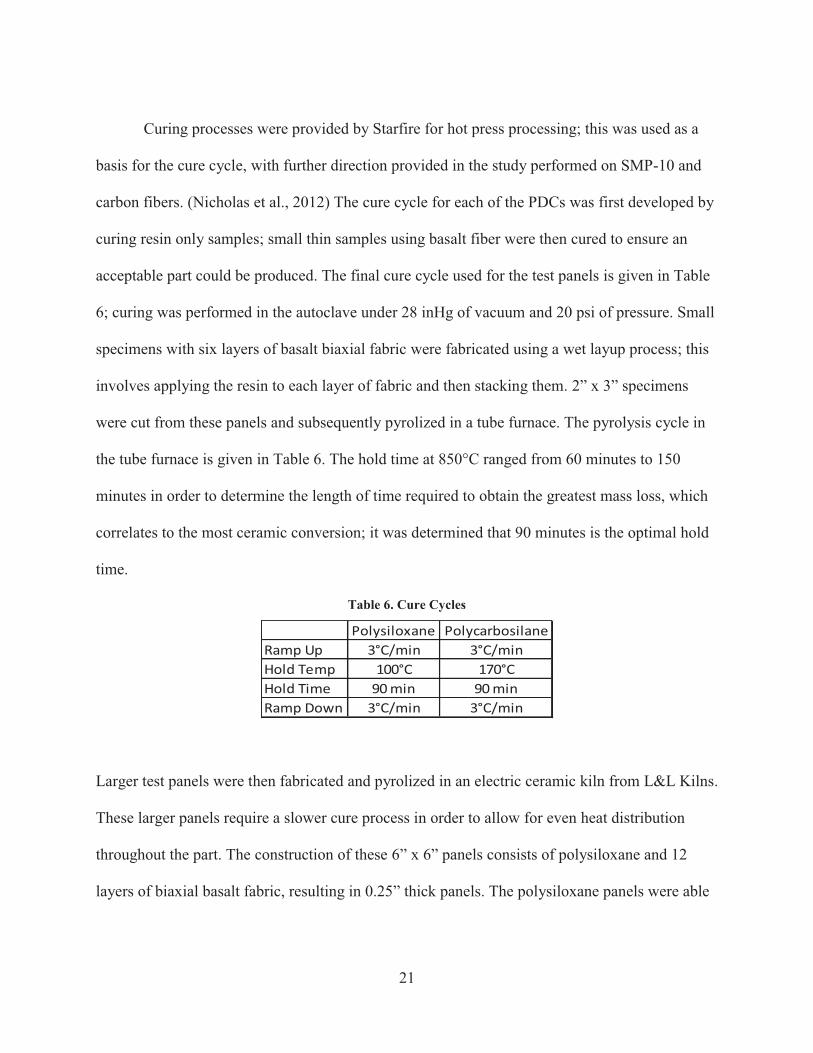
Table 6. Cure Cycles
Polysiloxane PolycarbosilaneRamp Up 3°C/min 3°C/minHold Temp 100°C 170°CHold Time 90 min 90 minRamp Down 3°C/min 3°C/min
Larger test panels were then fabricated and pyrolized in an electric ceramic kiln from L&L Kilns.
These larger panels require a slower cure process in order to allow for even heat distribution
throughout the part. The construction of these 6” x 6” panels consists of polysiloxane and 12
layers of biaxial basalt fabric, resulting in 0.25” thick panels. The polysiloxane panels were able
22
to be pyrolized with the cycle given in Table 6 with minimal shrinkage, as can be seen in Figure
6.
Table 7. Pyrolysis Cycle for Polysiloxane in Kiln
Ramp Up 1°C/minHold Temp 650°CRamp Up 2°C/minHold Temp 850°CHold Time 90 minutesRamp Down 5°C/min
Figure 6. Panel LBF107 after cure (left) and after pyrolysis (right)
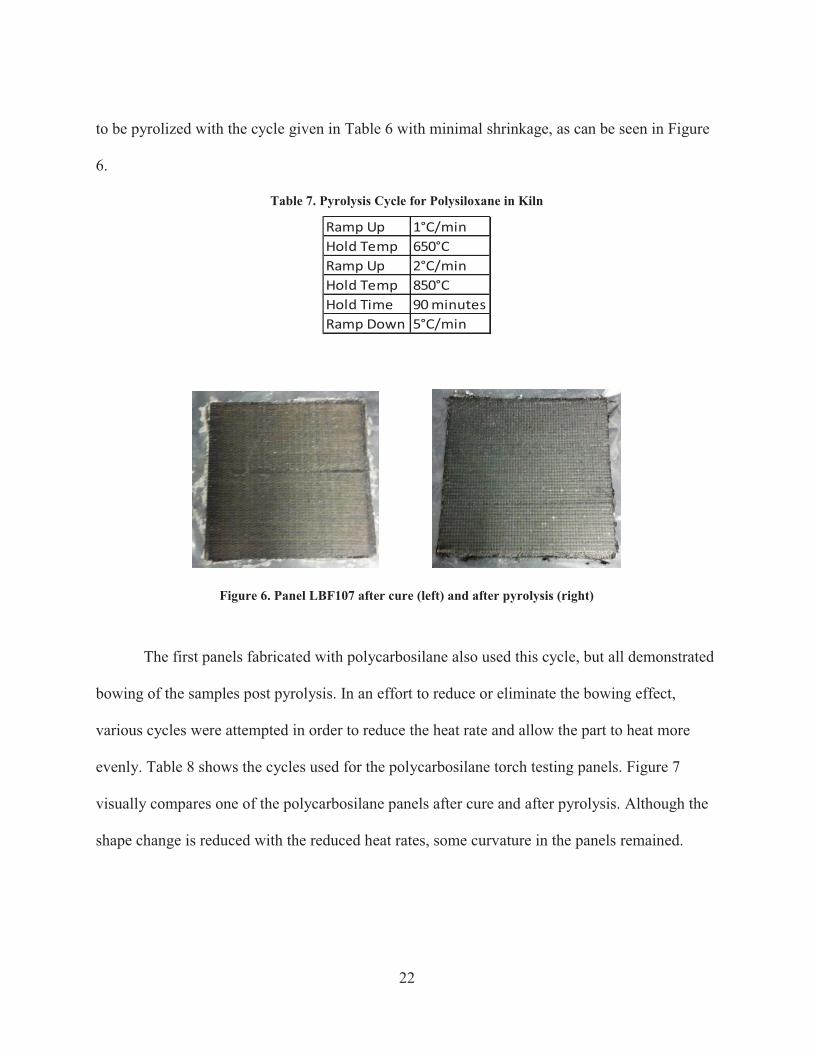
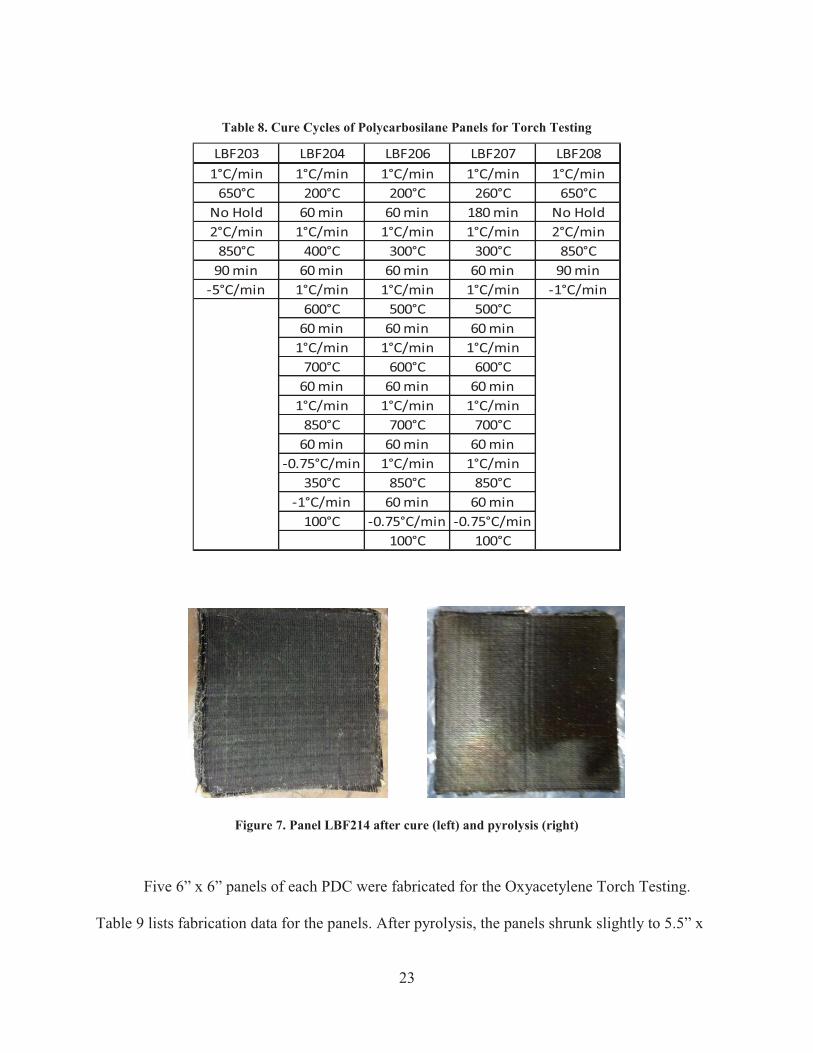
The first panels fabricated with polycarbosilane also used this cycle, but all demonstrated
bowing of the samples post pyrolysis. In an effort to reduce or eliminate the bowing effect,
various cycles were attempted in order to reduce the heat rate and allow the part to heat more
evenly. Table 8 shows the cycles used for the polycarbosilane torch testing panels. Figure 7
visually compares one of the polycarbosilane panels after cure and after pyrolysis. Although the
shape change is reduced with the reduced heat rates, some curvature in the panels remained.
23
Table 8. Cure Cycles of Polycarbosilane Panels for Torch Testing
LBF203 LBF204 LBF206 LBF207 LBF2081°C/min 1°C/min 1°C/min 1°C/min 1°C/min
650°C 200°C 200°C 260°C 650°CNo Hold 60 min 60 min 180 min No Hold2°C/min 1°C/min 1°C/min 1°C/min 2°C/min
850°C 400°C 300°C 300°C 850°C90 min 60 min 60 min 60 min 90 min
-5°C/min 1°C/min 1°C/min 1°C/min -1°C/min600°C 500°C 500°C
60 min 60 min 60 min1°C/min 1°C/min 1°C/min
700°C 600°C 600°C60 min 60 min 60 min
1°C/min 1°C/min 1°C/min850°C 700°C 700°C
60 min 60 min 60 min-0.75°C/min 1°C/min 1°C/min
350°C 850°C 850°C-1°C/min 60 min 60 min
100°C -0.75°C/min -0.75°C/min100°C 100°C
Figure 7. Panel LBF214 after cure (left) and pyrolysis (right)
Five 6” x 6” panels of each PDC were fabricated for the Oxyacetylene Torch Testing.
Table 9 lists fabrication data for the panels. After pyrolysis, the panels shrunk slightly to 5.5” x
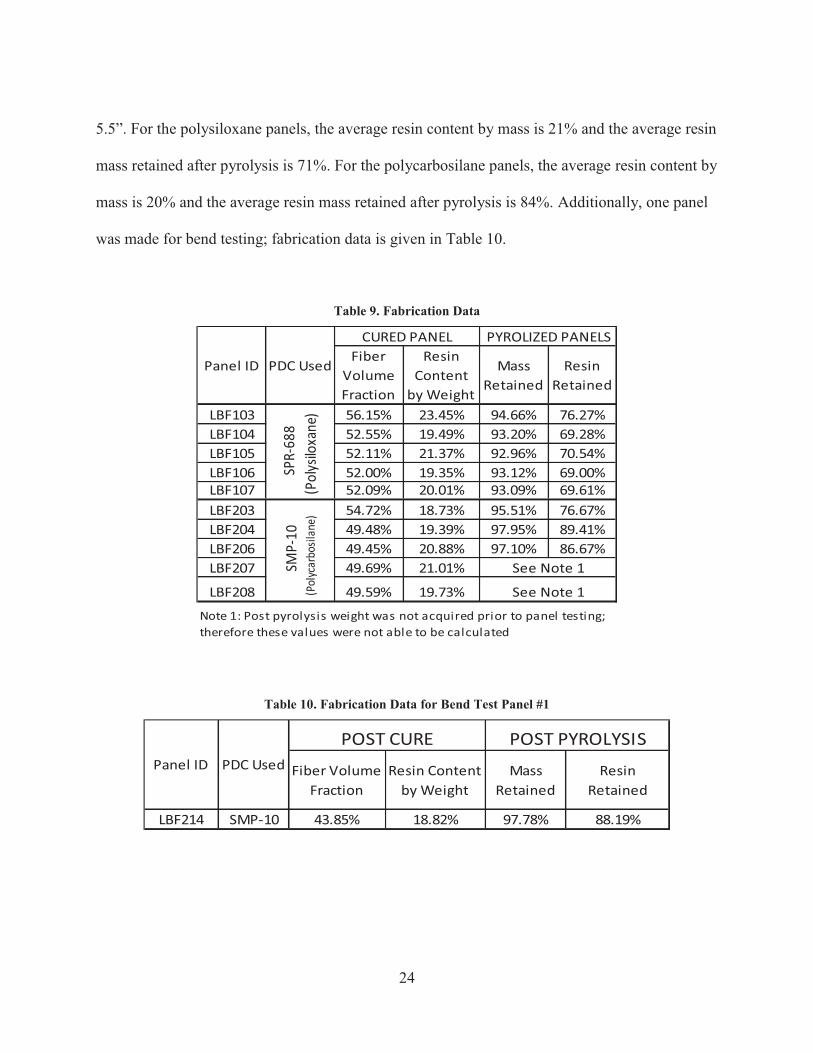
24
5.5”. For the polysiloxane panels, the average resin content by mass is 21% and the average resin
mass retained after pyrolysis is 71%. For the polycarbosilane panels, the average resin content by
mass is 20% and the average resin mass retained after pyrolysis is 84%. Additionally, one panel
was made for bend testing; fabrication data is given in Table 10.
Table 9. Fabrication Data
Fiber Volume Fraction
Resin Content
by Weight
Mass Retained
Resin Retained
LBF103 56.15% 23.45% 94.66% 76.27%LBF104 52.55% 19.49% 93.20% 69.28%LBF105 52.11% 21.37% 92.96% 70.54%LBF106 52.00% 19.35% 93.12% 69.00%LBF107 52.09% 20.01% 93.09% 69.61%LBF203 54.72% 18.73% 95.51% 76.67%LBF204 49.48% 19.39% 97.95% 89.41%LBF206 49.45% 20.88% 97.10% 86.67%LBF207 49.69% 21.01%
LBF208 49.59% 19.73% See Note 1
Note 1: Post pyrolysis weight was not acquired prior to panel testing; therefore these values were not able to be calculated
Panel ID PDC Used
CURED PANEL PYROLIZED PANELS
SPR-
688
(Pol
ysilo
xane
)SM
P-10
(P
olyc
arbo
silan
e)
See Note 1
Table 10. Fabrication Data for Bend Test Panel #1
Fiber Volume Fraction
Resin Content by Weight
Mass Retained
Resin Retained
LBF214 SMP-10 43.85% 18.82% 97.78% 88.19%
PDC UsedPanel ID
POST CURE POST PYROLYSIS
25
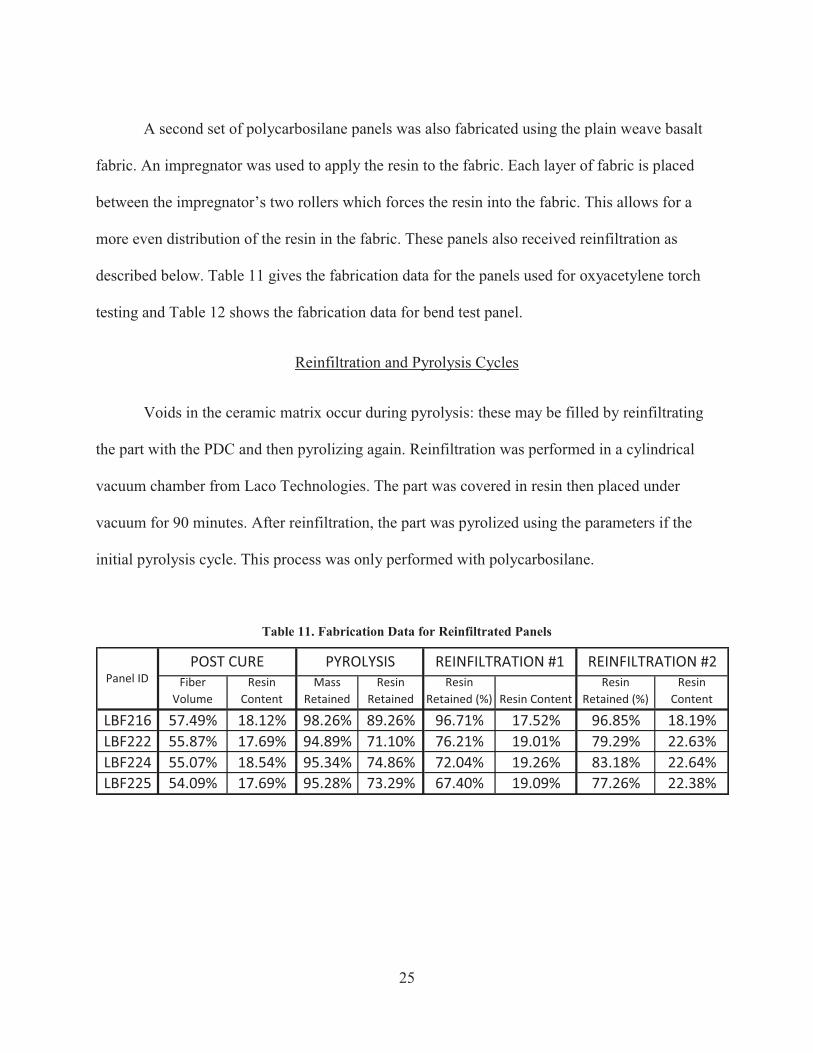
A second set of polycarbosilane panels was also fabricated using the plain weave basalt
fabric. An impregnator was used to apply the resin to the fabric. Each layer of fabric is placed
between the impregnator’s two rollers which forces the resin into the fabric. This allows for a
more even distribution of the resin in the fabric. These panels also received reinfiltration as
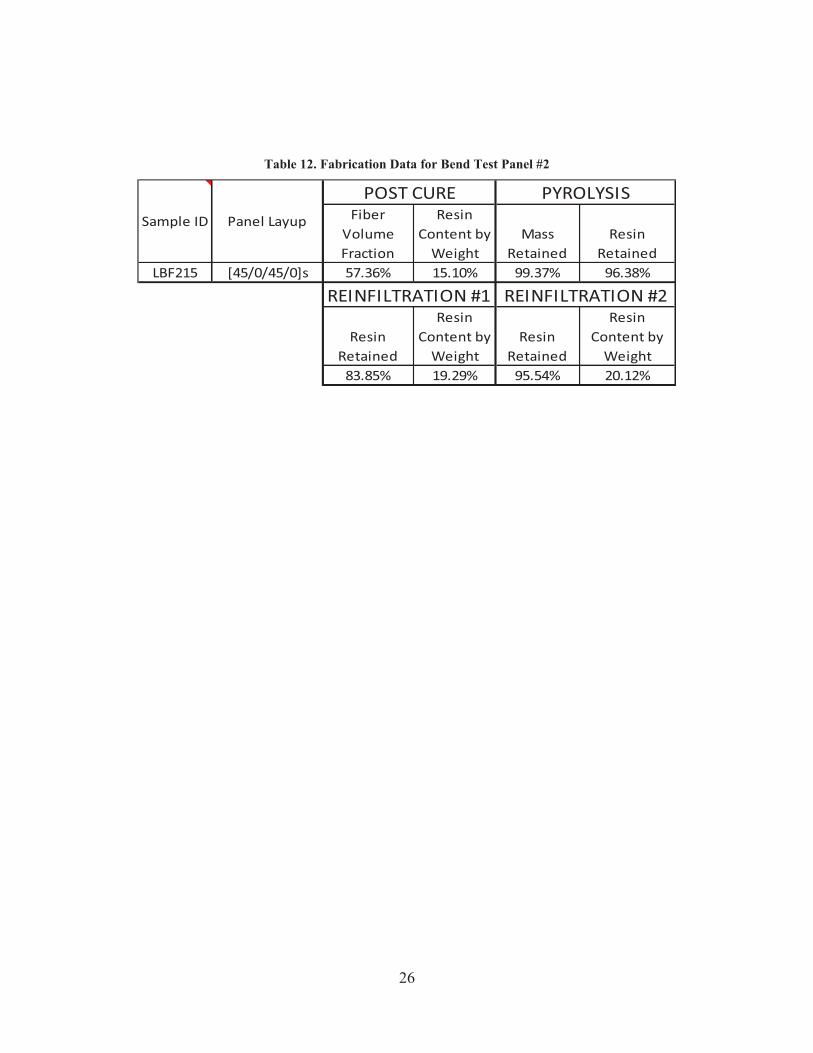
described below. Table 11 gives the fabrication data for the panels used for oxyacetylene torch
testing and Table 12 shows the fabrication data for bend test panel.
Reinfiltration and Pyrolysis Cycles
Voids in the ceramic matrix occur during pyrolysis: these may be filled by reinfiltrating
the part with the PDC and then pyrolizing again. Reinfiltration was performed in a cylindrical
vacuum chamber from Laco Technologies. The part was covered in resin then placed under
vacuum for 90 minutes. After reinfiltration, the part was pyrolized using the parameters if the
initial pyrolysis cycle. This process was only performed with polycarbosilane.
Table 11. Fabrication Data for Reinfiltrated Panels
Fiber Volume
Resin Content
Mass Retained
Resin Retained
Resin Retained (%) Resin Content
Resin Retained (%)
Resin Content
LBF216 57.49% 18.12% 98.26% 89.26% 96.71% 17.52% 96.85% 18.19%LBF222 55.87% 17.69% 94.89% 71.10% 76.21% 19.01% 79.29% 22.63%LBF224 55.07% 18.54% 95.34% 74.86% 72.04% 19.26% 83.18% 22.64%LBF225 54.09% 17.69% 95.28% 73.29% 67.40% 19.09% 77.26% 22.38%
REINFILTRATION #1 REINFILTRATION #2Panel ID
POST CURE PYROLYSIS
26
Table 12. Fabrication Data for Bend Test Panel #2
Fiber Volume Fraction
Resin Content by
WeightMass
RetainedResin
RetainedLBF215 [45/0/45/0]s 57.36% 15.10% 99.37% 96.38%
Resin Retained
Resin Content by
WeightResin
Retained
Resin Content by
Weight83.85% 19.29% 95.54% 20.12%
REINFILTRATION #1 REINFILTRATION #2
Panel Layup
POST CURE PYROLYSISSample ID
27
CHAPTER FOUR: MATERIAL TESTING METHODS
This study analyzed the material’s microstructure, high temperature capability, and
mechanical performance. In order to characterize the fiber/matrix interface and the chemical
composition, Scanning Electron Microscopy/Energy Dispersive Spectroscopy was performed, as
well as X-Ray Diffraction. Thermogravimetric Analysis was also performed on panels. Panels
underwent high temperature thermal testing by performing oxyacetylene torch testing. Three
point bending was also performed to assess the mechanical performance of the composite.
Scanning Electron Microscopy
Scanning electron microscopy (SEM) was performed using a Zeiss ULTRA 55 Field
Emission Gun SEM at the Materials Characterization Facility. This machine also performs
Energy Dispersive Spectroscopy (EDS) with a Noran System 7 EDS system with Silicon Drift
Detector. SEM uses an electron beam to obtain surface features on a nanoscale. EDS determines
the elements in a material by detecting the energy released from atoms as they are hit with an
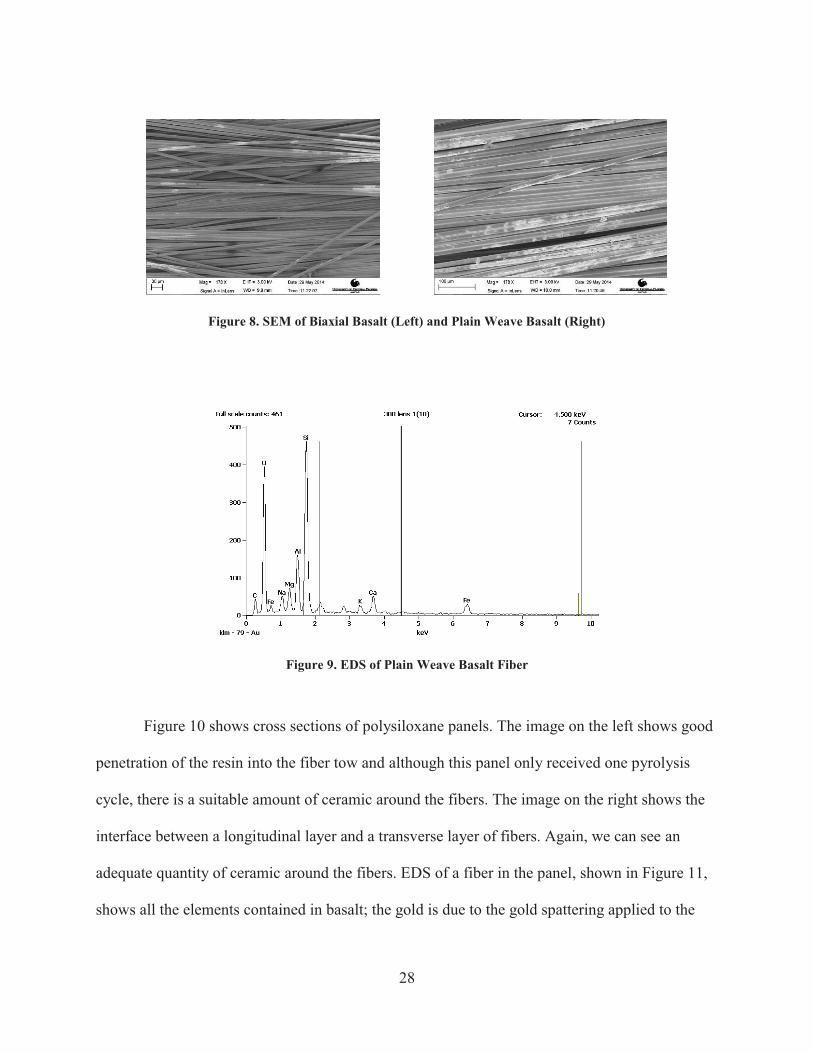
electron beam. Figure 8 shows SEM images of basalt fibers. The image on the left is fibers taken
from the biaxial fabric and the one on the right is from the plain weave fabric. The fibers appear
to be very similar in shape and size. Figure 9 shows the elemental composition of the fibers from
the plain weave basalt. The elements that appear are Carbon, Oxygen, Iron, Sodium, Magnesium,
Aluminum, Silicon, Potassium, and Calcium, which are all expected for basalt.
28
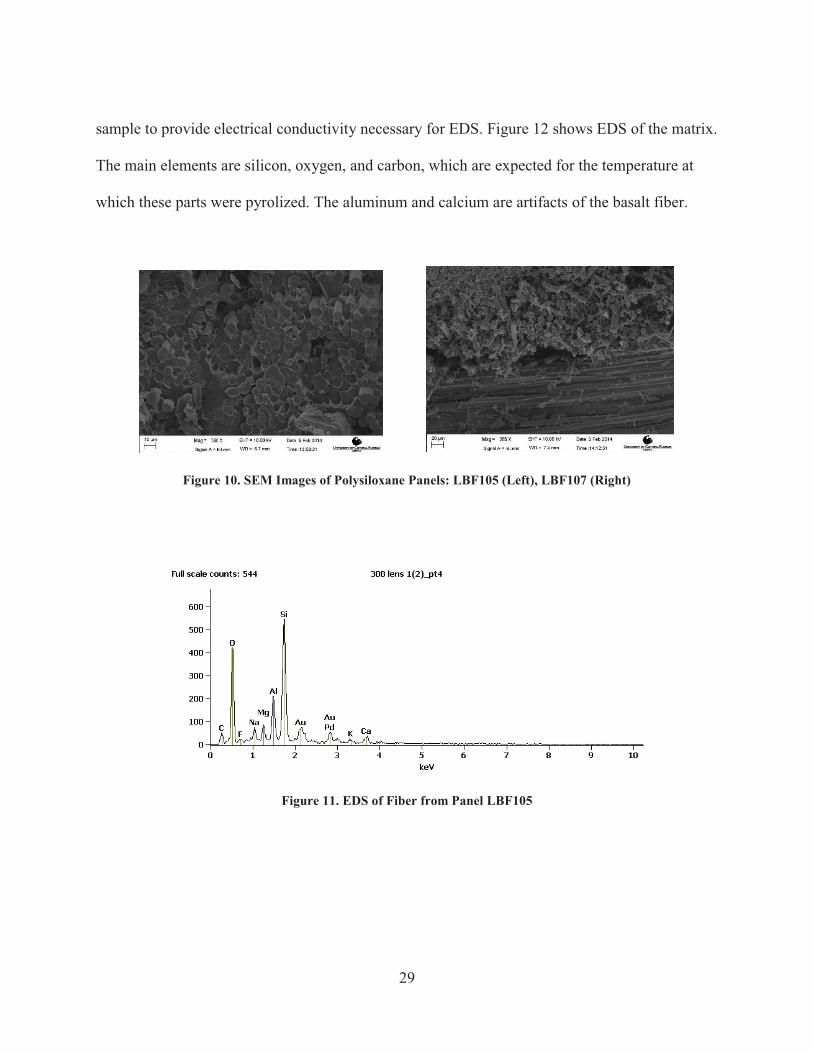
Figure 8. SEM of Biaxial Basalt (Left) and Plain Weave Basalt (Right)
Figure 9. EDS of Plain Weave Basalt Fiber
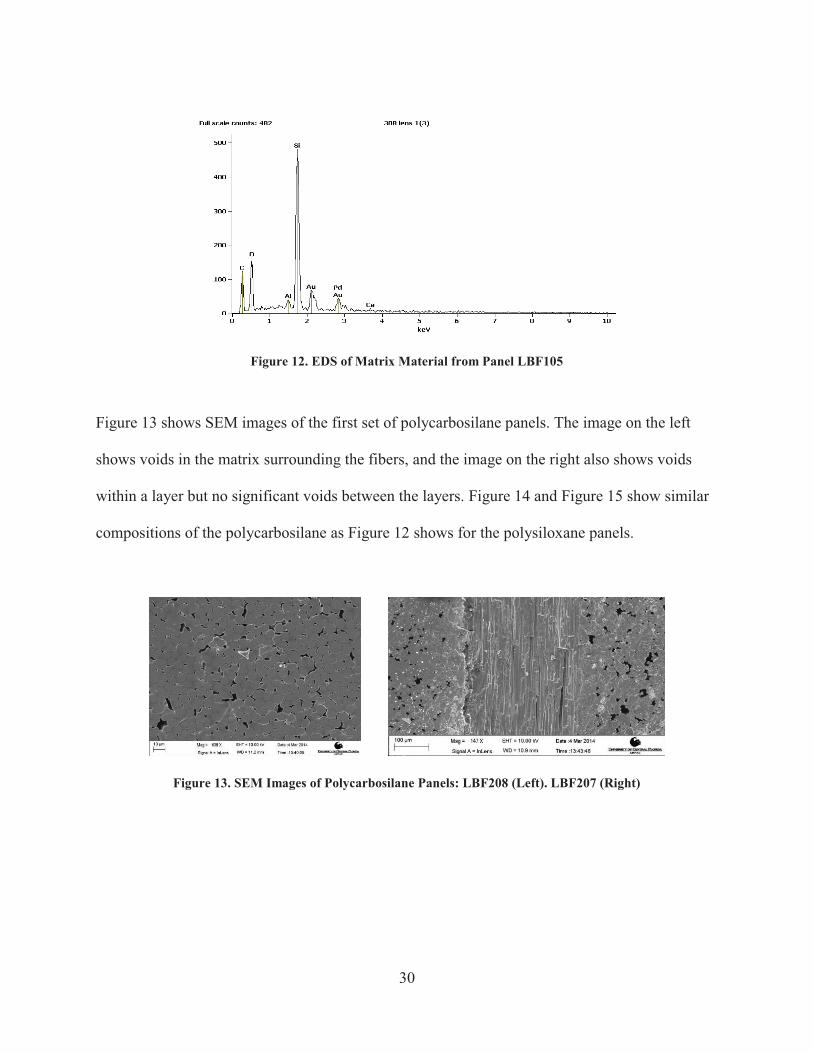
Figure 10 shows cross sections of polysiloxane panels. The image on the left shows good
penetration of the resin into the fiber tow and although this panel only received one pyrolysis
cycle, there is a suitable amount of ceramic around the fibers. The image on the right shows the
interface between a longitudinal layer and a transverse layer of fibers. Again, we can see an
adequate quantity of ceramic around the fibers. EDS of a fiber in the panel, shown in Figure 11,
shows all the elements contained in basalt; the gold is due to the gold spattering applied to the
29
sample to provide electrical conductivity necessary for EDS. Figure 12 shows EDS of the matrix.
The main elements are silicon, oxygen, and carbon, which are expected for the temperature at
which these parts were pyrolized. The aluminum and calcium are artifacts of the basalt fiber.
Figure 10. SEM Images of Polysiloxane Panels: LBF105 (Left), LBF107 (Right)
Figure 11. EDS of Fiber from Panel LBF105
30
Figure 12. EDS of Matrix Material from Panel LBF105
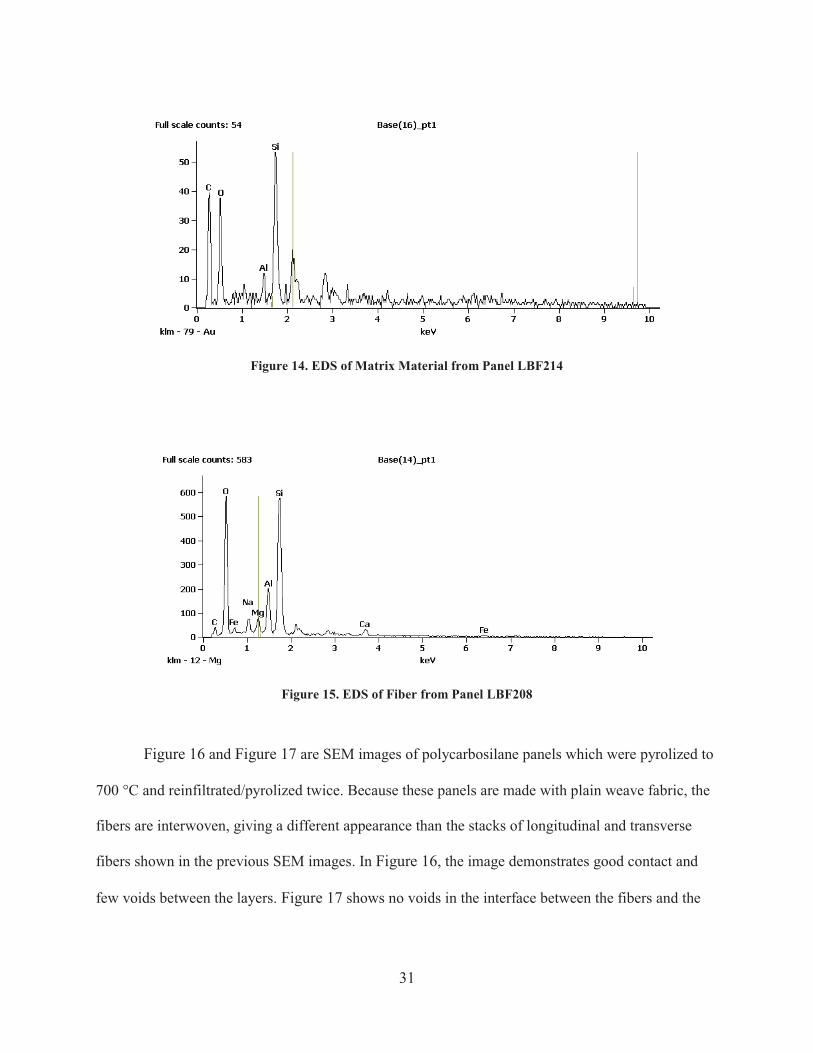
Figure 13 shows SEM images of the first set of polycarbosilane panels. The image on the left
shows voids in the matrix surrounding the fibers, and the image on the right also shows voids
within a layer but no significant voids between the layers. Figure 14 and Figure 15 show similar
compositions of the polycarbosilane as Figure 12 shows for the polysiloxane panels.
Figure 13. SEM Images of Polycarbosilane Panels: LBF208 (Left). LBF207 (Right)
31
Figure 14. EDS of Matrix Material from Panel LBF214
Figure 15. EDS of Fiber from Panel LBF208
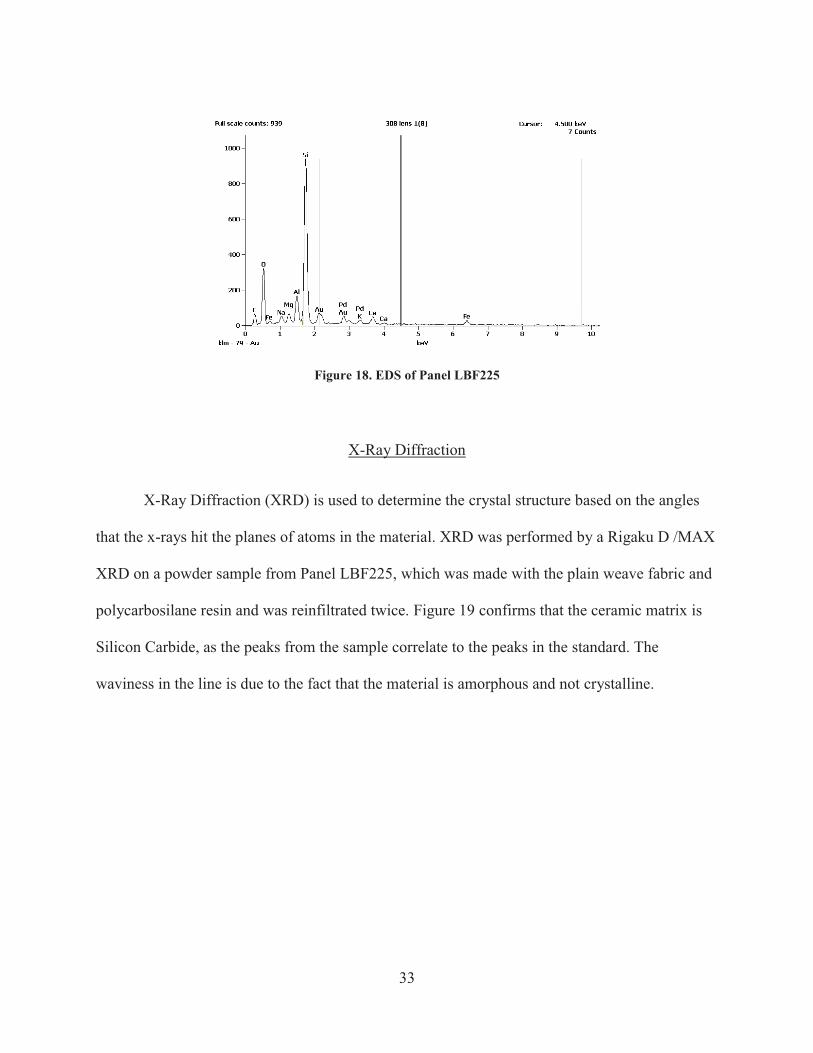
Figure 16 and Figure 17 are SEM images of polycarbosilane panels which were pyrolized to
700 °C and reinfiltrated/pyrolized twice. Because these panels are made with plain weave fabric, the
fibers are interwoven, giving a different appearance than the stacks of longitudinal and transverse
fibers shown in the previous SEM images. In Figure 16, the image demonstrates good contact and
few voids between the layers. Figure 17 shows no voids in the interface between the fibers and the
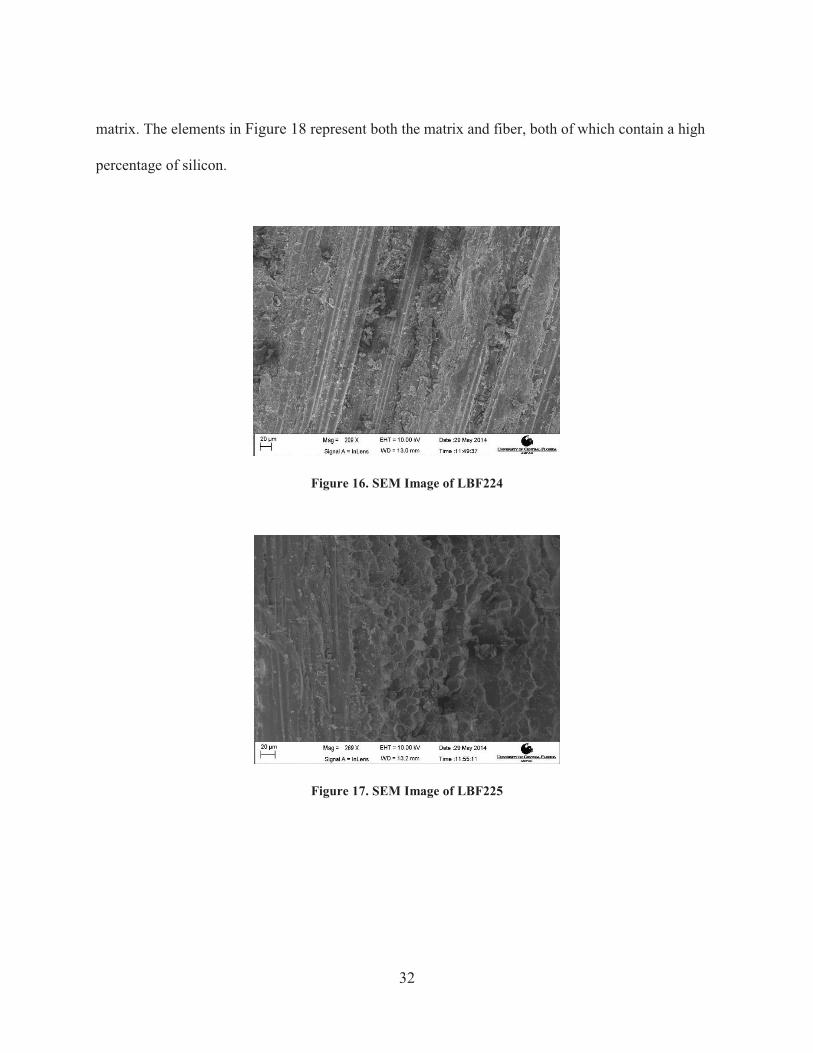
32
matrix. The elements in Figure 18 represent both the matrix and fiber, both of which contain a high
percentage of silicon.
Figure 16. SEM Image of LBF224
Figure 17. SEM Image of LBF225
33
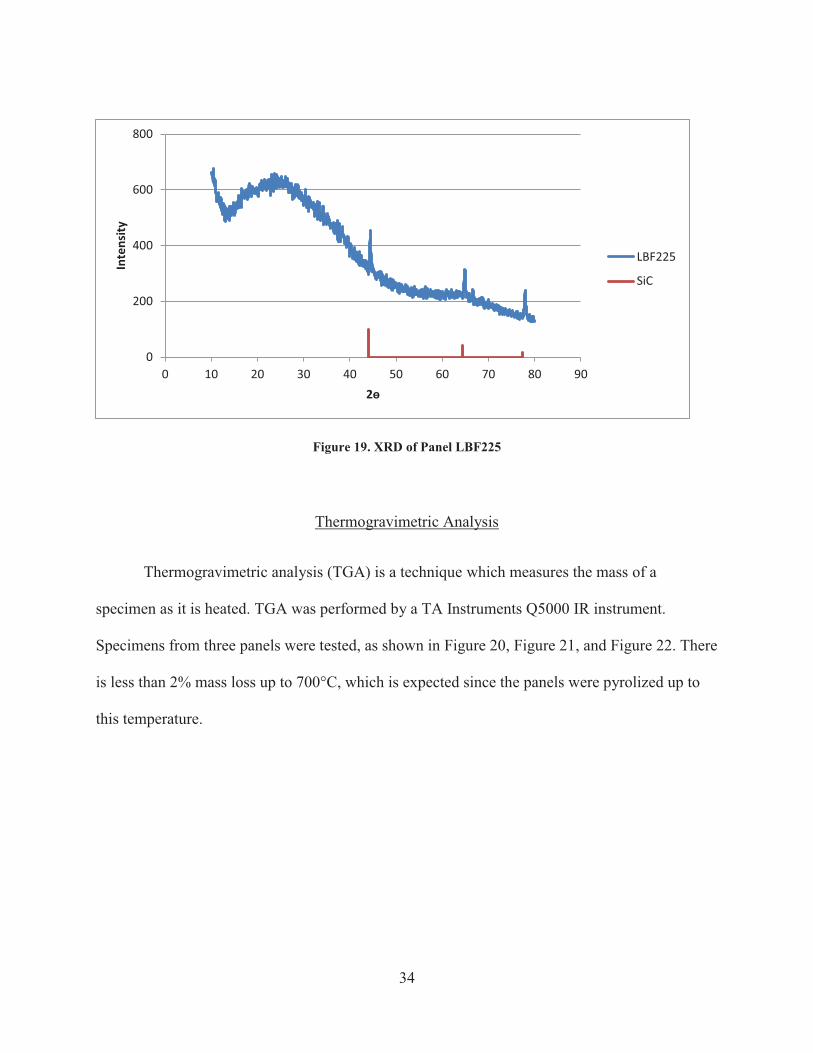
Figure 18. EDS of Panel LBF225
X-Ray Diffraction
X-Ray Diffraction (XRD) is used to determine the crystal structure based on the angles
that the x-rays hit the planes of atoms in the material. XRD was performed by a Rigaku D /MAX
XRD on a powder sample from Panel LBF225, which was made with the plain weave fabric and
polycarbosilane resin and was reinfiltrated twice. Figure 19 confirms that the ceramic matrix is
Silicon Carbide, as the peaks from the sample correlate to the peaks in the standard. The
waviness in the line is due to the fact that the material is amorphous and not crystalline.
34
Figure 19. XRD of Panel LBF225
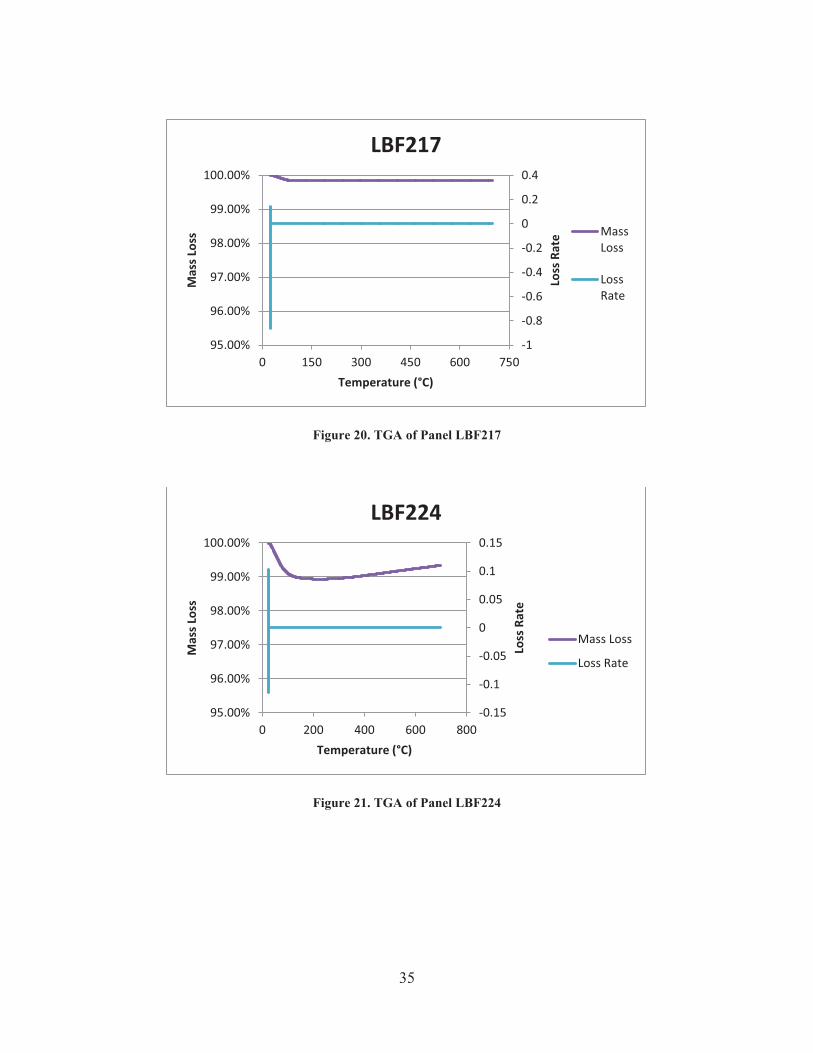
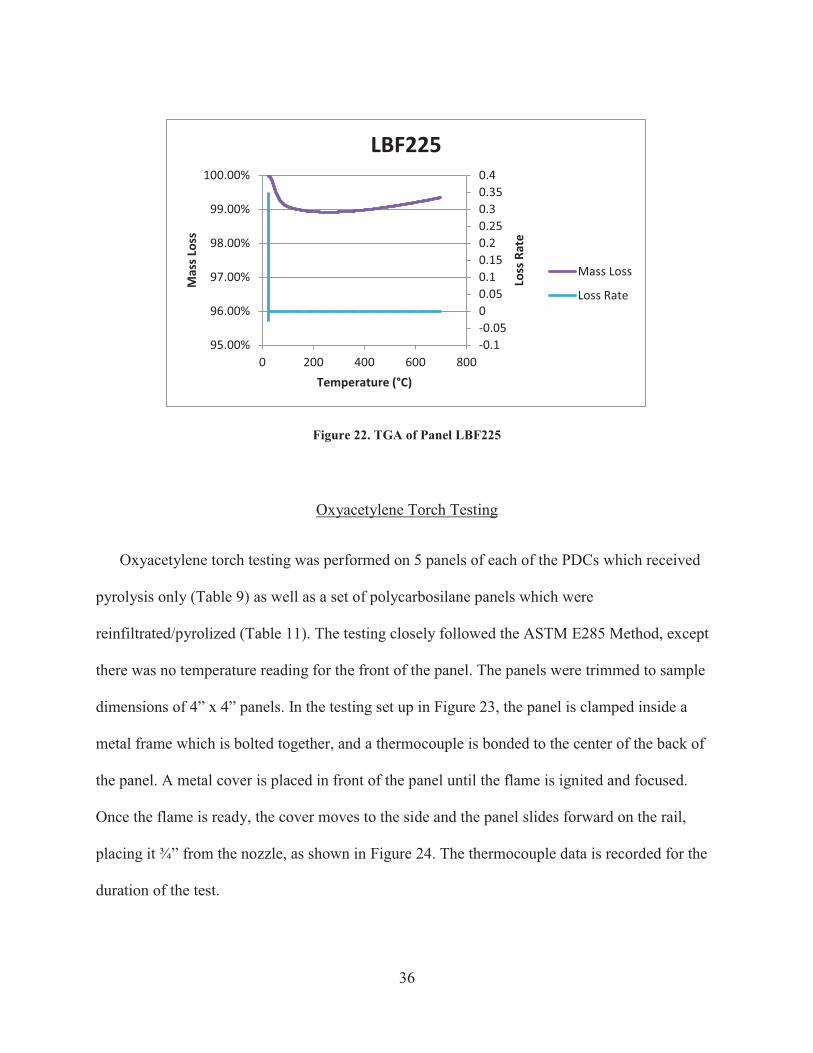
Thermogravimetric Analysis
Thermogravimetric analysis (TGA) is a technique which measures the mass of a
specimen as it is heated. TGA was performed by a TA Instruments Q5000 IR instrument.
Specimens from three panels were tested, as shown in Figure 20, Figure 21, and Figure 22. There
is less than 2% mass loss up to 700°C, which is expected since the panels were pyrolized up to
this temperature.
0
200
400
600
800
0 10 20 30 40 50 60 70 80 90
Inte
nsity
2ɵ
LBF225
SiC
35
Figure 20. TGA of Panel LBF217
Figure 21. TGA of Panel LBF224
-1
-0.8
-0.6
-0.4
-0.2
0
0.2
0.4
95.00%
96.00%
97.00%
98.00%
99.00%
100.00%
0 150 300 450 600 750
Loss
Rat
e
Mas
s Los
s
Temperature (°C)
LBF217
MassLoss
LossRate
-0.15
-0.1
-0.05
0
0.05
0.1
0.15
95.00%
96.00%
97.00%
98.00%
99.00%
100.00%
0 200 400 600 800
Loss
Rat
e
Mas
s Los
s
Temperature (°C)
LBF224
Mass Loss
Loss Rate
36
Figure 22. TGA of Panel LBF225
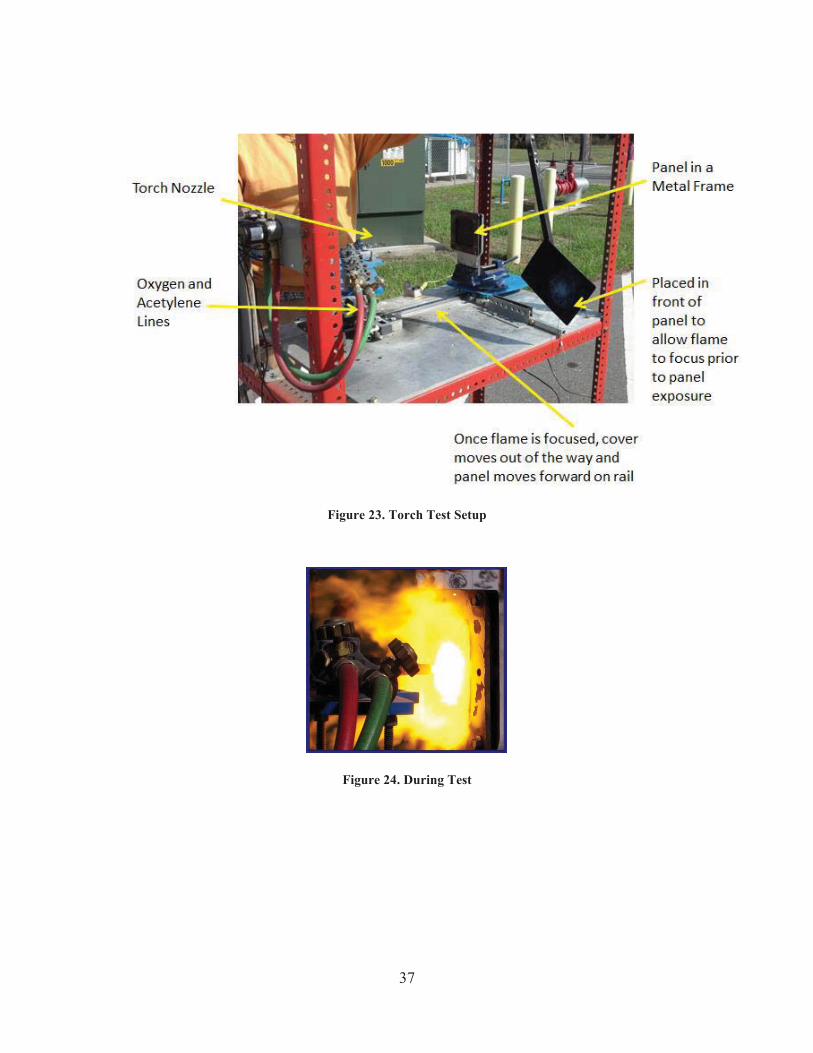
Oxyacetylene Torch Testing
Oxyacetylene torch testing was performed on 5 panels of each of the PDCs which received
pyrolysis only (Table 9) as well as a set of polycarbosilane panels which were
reinfiltrated/pyrolized (Table 11). The testing closely followed the ASTM E285 Method, except
there was no temperature reading for the front of the panel. The panels were trimmed to sample
dimensions of 4” x 4” panels. In the testing set up in Figure 23, the panel is clamped inside a
metal frame which is bolted together, and a thermocouple is bonded to the center of the back of
the panel. A metal cover is placed in front of the panel until the flame is ignited and focused.
Once the flame is ready, the cover moves to the side and the panel slides forward on the rail,
placing it ¾” from the nozzle, as shown in Figure 24. The thermocouple data is recorded for the
duration of the test.
-0.1-0.0500.050.10.150.20.250.30.350.4
95.00%
96.00%
97.00%
98.00%
99.00%
100.00%
0 200 400 600 800
Loss
Rat
e
Mas
s Los
s
Temperature (°C)
LBF225
Mass Loss
Loss Rate
37
Figure 23. Torch Test Setup
Figure 24. During Test
38
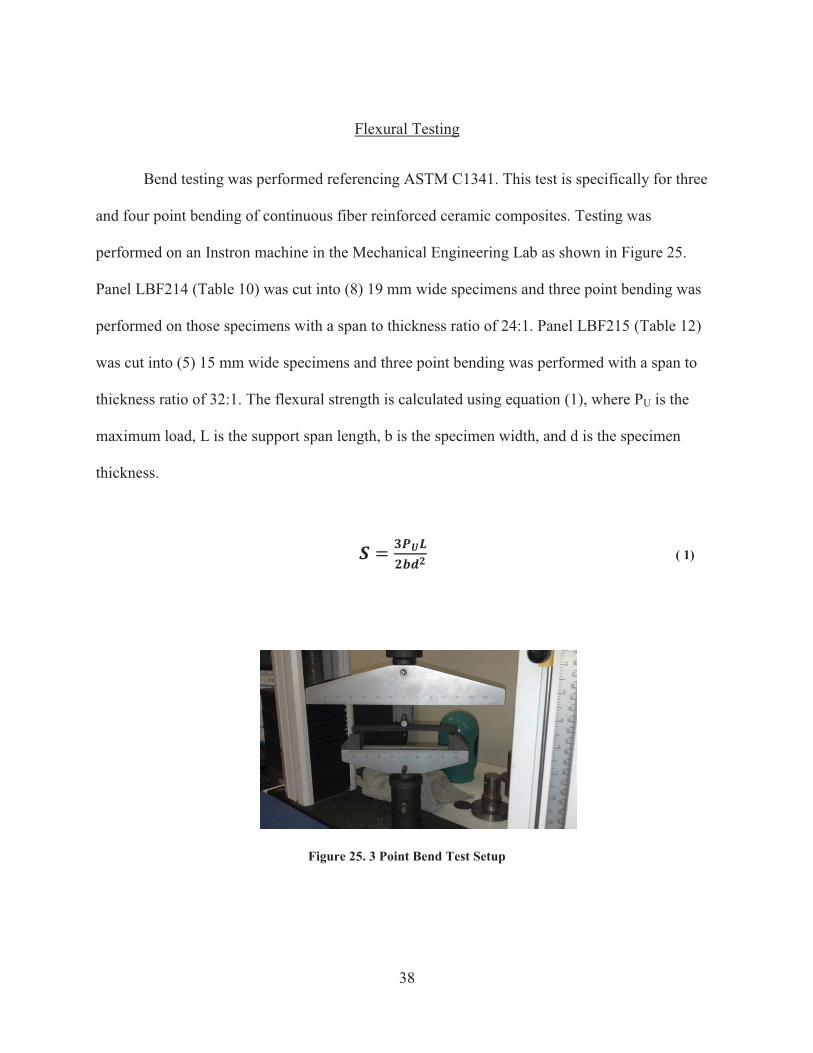
Flexural Testing
Bend testing was performed referencing ASTM C1341. This test is specifically for three
and four point bending of continuous fiber reinforced ceramic composites. Testing was
performed on an Instron machine in the Mechanical Engineering Lab as shown in Figure 25.
Panel LBF214 (Table 10) was cut into (8) 19 mm wide specimens and three point bending was
performed on those specimens with a span to thickness ratio of 24:1. Panel LBF215 (Table 12)
was cut into (5) 15 mm wide specimens and three point bending was performed with a span to
thickness ratio of 32:1. The flexural strength is calculated using equation (1), where PU is the
maximum load, L is the support span length, b is the specimen width, and d is the specimen
thickness.
( 1)
Figure 25. 3 Point Bend Test Setup
39
CHAPTER FIVE: RESULTS AND DISCUSSION
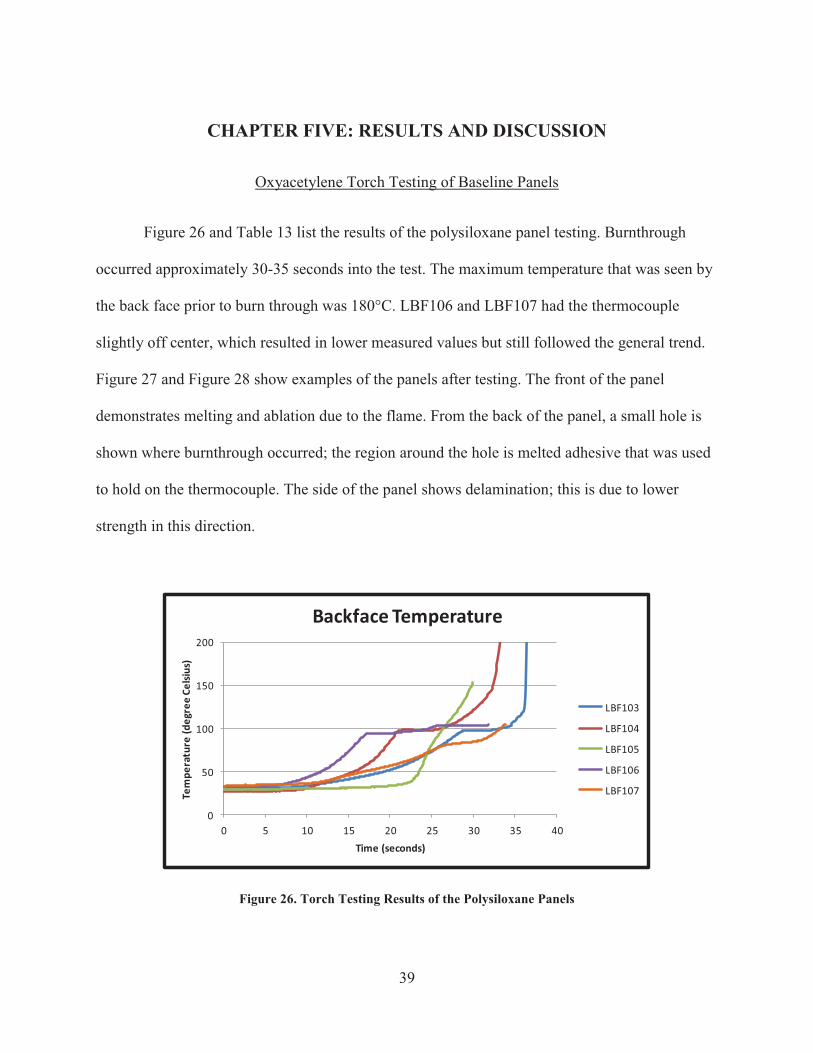
Oxyacetylene Torch Testing of Baseline Panels
Figure 26 and Table 13 list the results of the polysiloxane panel testing. Burnthrough
occurred approximately 30-35 seconds into the test. The maximum temperature that was seen by
the back face prior to burn through was 180°C. LBF106 and LBF107 had the thermocouple
slightly off center, which resulted in lower measured values but still followed the general trend.
Figure 27 and Figure 28 show examples of the panels after testing. The front of the panel
demonstrates melting and ablation due to the flame. From the back of the panel, a small hole is
shown where burnthrough occurred; the region around the hole is melted adhesive that was used
to hold on the thermocouple. The side of the panel shows delamination; this is due to lower
strength in this direction.
0
50
100
150
200
0 5 10 15 20 25 30 35 40
Tem
pera
ture
(deg
ree
Celsi
us)
Time (seconds)
Backface Temperature
LBF103
LBF104
LBF105
LBF106
LBF107
Figure 26. Torch Testing Results of the Polysiloxane Panels

40
Table 13. Recession Rates for Polysiloxane Panels
PANEL IDErosion Rate
(mm/sec)LBF103 0.1868LBF104 0.1814LBF105 0.2117LBF106 0.2048LBF107 0.1924
AVERAGE 0.1954
Figure 27. Panel LBF103 Post Test
Figure 28. Panel LBF106 Post Test
41
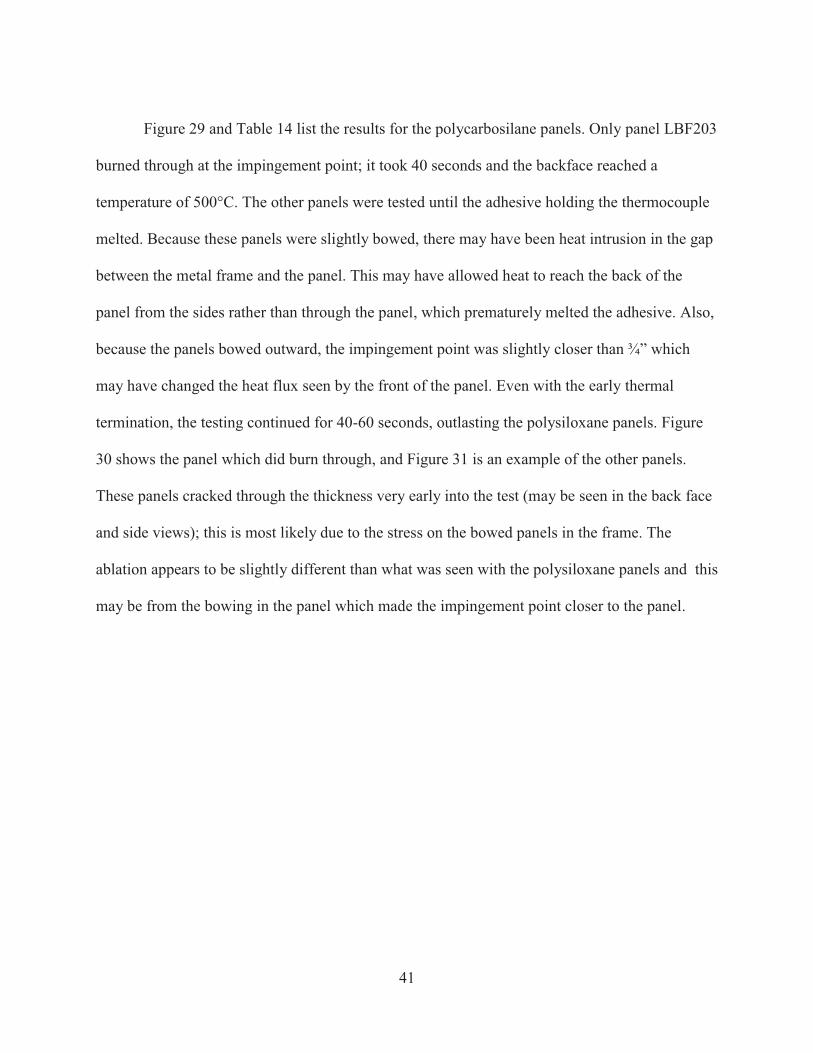
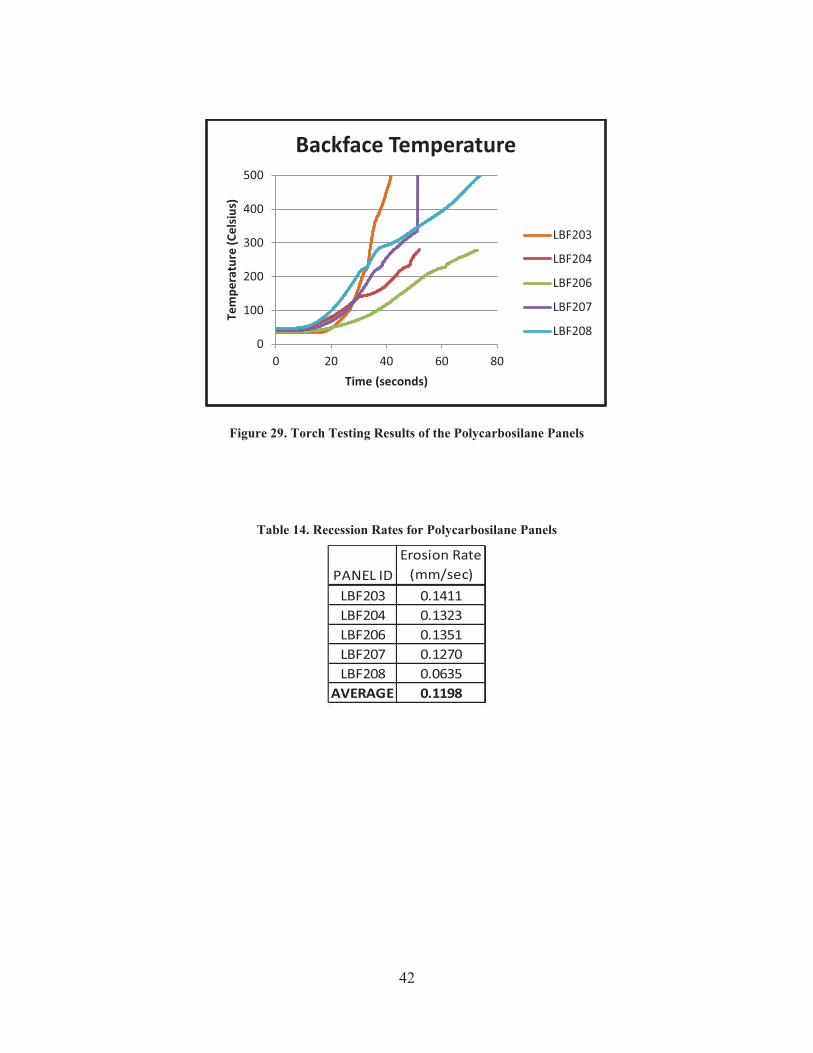
Figure 29 and Table 14 list the results for the polycarbosilane panels. Only panel LBF203
burned through at the impingement point; it took 40 seconds and the backface reached a
temperature of 500°C. The other panels were tested until the adhesive holding the thermocouple
melted. Because these panels were slightly bowed, there may have been heat intrusion in the gap
between the metal frame and the panel. This may have allowed heat to reach the back of the
panel from the sides rather than through the panel, which prematurely melted the adhesive. Also,
because the panels bowed outward, the impingement point was slightly closer than ¾” which
may have changed the heat flux seen by the front of the panel. Even with the early thermal
termination, the testing continued for 40-60 seconds, outlasting the polysiloxane panels. Figure
30 shows the panel which did burn through, and Figure 31 is an example of the other panels.
These panels cracked through the thickness very early into the test (may be seen in the back face
and side views); this is most likely due to the stress on the bowed panels in the frame. The
ablation appears to be slightly different than what was seen with the polysiloxane panels and this
may be from the bowing in the panel which made the impingement point closer to the panel.
42
Figure 29. Torch Testing Results of the Polycarbosilane Panels
Table 14. Recession Rates for Polycarbosilane Panels
PANEL IDErosion Rate
(mm/sec)LBF203 0.1411LBF204 0.1323LBF206 0.1351LBF207 0.1270LBF208 0.0635
AVERAGE 0.1198
0
100
200
300
400
500
0 20 40 60 80
Tem
pera
ture
(Cel
sius
)
Time (seconds)
Backface Temperature
LBF203
LBF204
LBF206
LBF207
LBF208
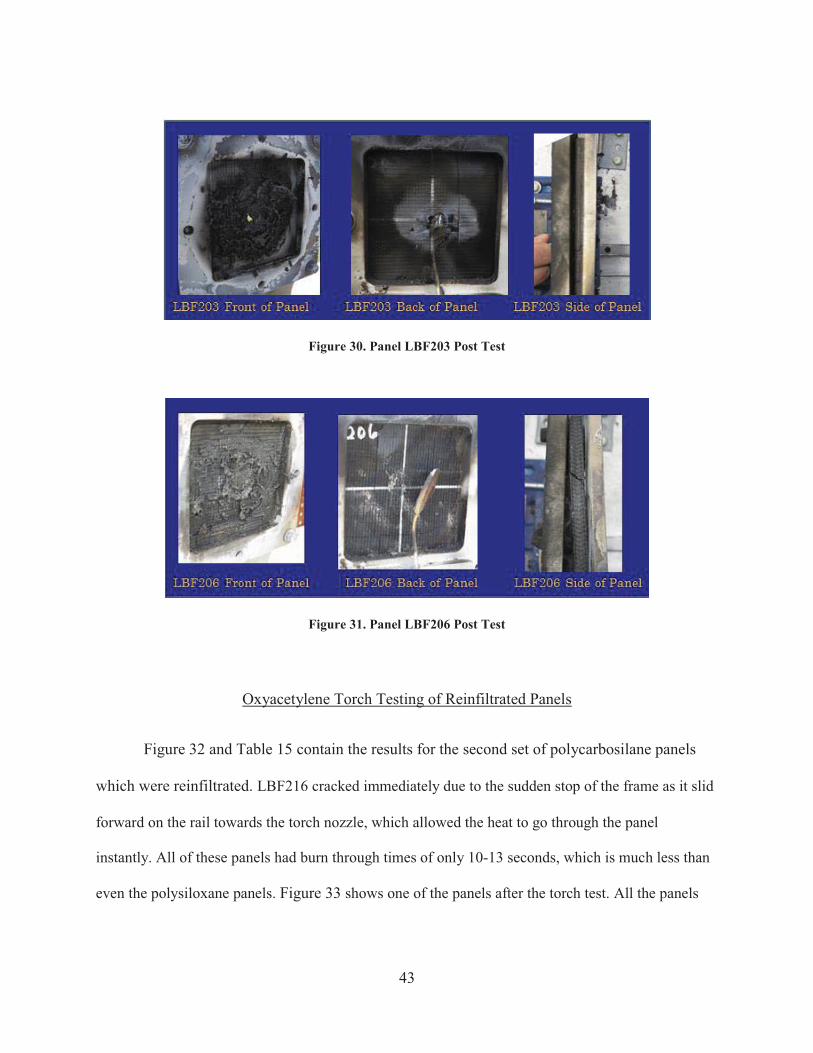
43
Figure 30. Panel LBF203 Post Test
Figure 31. Panel LBF206 Post Test
Oxyacetylene Torch Testing of Reinfiltrated Panels
Figure 32 and Table 15 contain the results for the second set of polycarbosilane panels
which were reinfiltrated. LBF216 cracked immediately due to the sudden stop of the frame as it slid
forward on the rail towards the torch nozzle, which allowed the heat to go through the panel
instantly. All of these panels had burn through times of only 10-13 seconds, which is much less than
even the polysiloxane panels. Figure 33 shows one of the panels after the torch test. All the panels

44
cracked through the thickness, but these did not show interlaminar delamination. The posttest
condition of these panels appears similar to the condition of the first set of polycarbosilane panels,
except the hole at the impingement point appears bigger on these panels.
Figure 32. Torch Testing Results of the Reinfiltrated Panels
Table 15. Recession Rates of Reinfiltrated Panels
PANEL IDErosion Rate
(mm/sec)LBF216 0.5773LBF222 0.3735LBF224 0.3342LBF225 0.3175
AVERAGE 0.4006
0
100
200
300
400
500
0 5 10 15 20
Tem
pera
ture
(Cel
sius
)
Time (seconds)
Backface Temperature
LBF216
LBF222
LBF224
LBF225
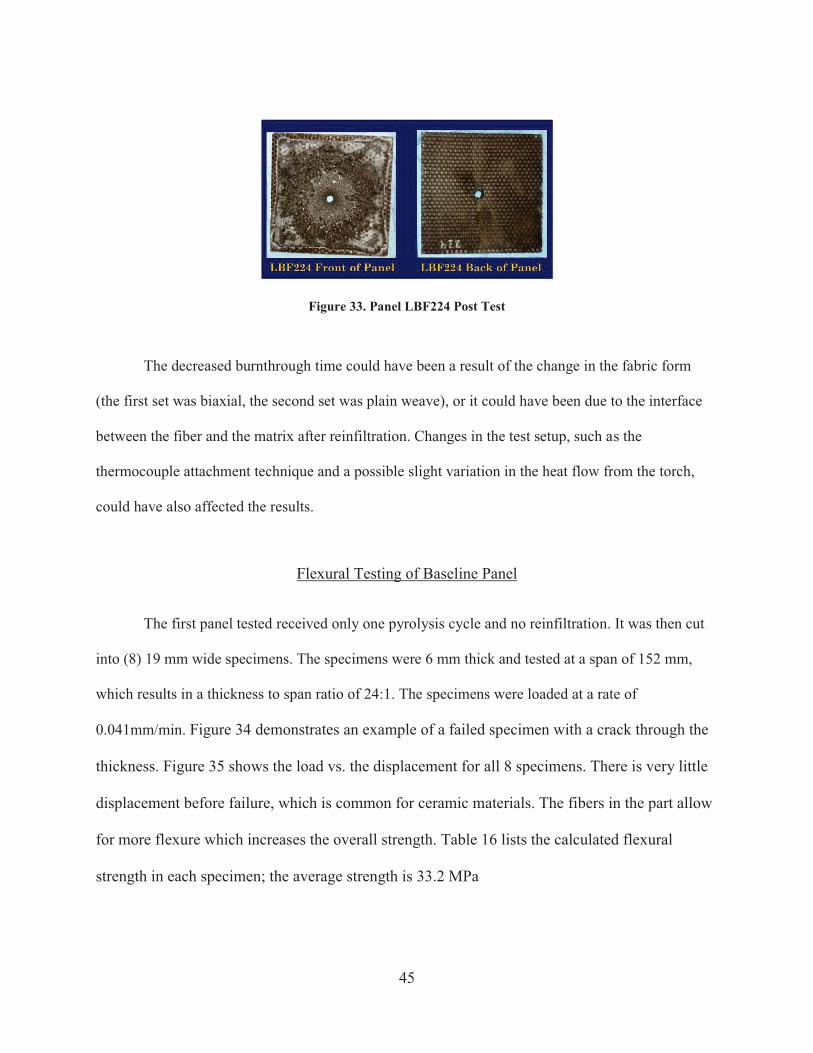
45
Figure 33. Panel LBF224 Post Test
The decreased burnthrough time could have been a result of the change in the fabric form
(the first set was biaxial, the second set was plain weave), or it could have been due to the interface
between the fiber and the matrix after reinfiltration. Changes in the test setup, such as the
thermocouple attachment technique and a possible slight variation in the heat flow from the torch,
could have also affected the results.
Flexural Testing of Baseline Panel
The first panel tested received only one pyrolysis cycle and no reinfiltration. It was then cut
into (8) 19 mm wide specimens. The specimens were 6 mm thick and tested at a span of 152 mm,
which results in a thickness to span ratio of 24:1. The specimens were loaded at a rate of
0.041mm/min. Figure 34 demonstrates an example of a failed specimen with a crack through the
thickness. Figure 35 shows the load vs. the displacement for all 8 specimens. There is very little
displacement before failure, which is common for ceramic materials. The fibers in the part allow
for more flexure which increases the overall strength. Table 16 lists the calculated flexural
strength in each specimen; the average strength is 33.2 MPa
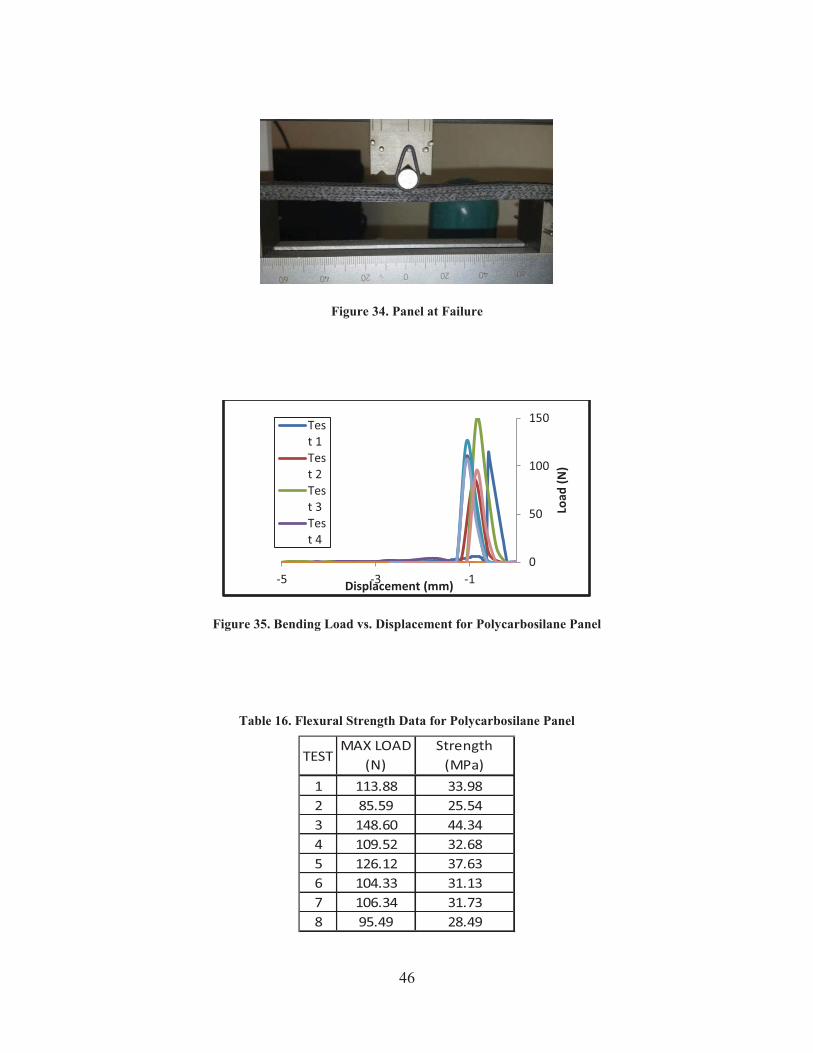
46
Figure 34. Panel at Failure
Figure 35. Bending Load vs. Displacement for Polycarbosilane Panel
Table 16. Flexural Strength Data for Polycarbosilane Panel
TESTMAX LOAD
(N)Strength
(MPa)1 113.88 33.982 85.59 25.543 148.60 44.344 109.52 32.685 126.12 37.636 104.33 31.137 106.34 31.738 95.49 28.49
-5 -3 -10
50
100
150
Displacement (mm)
Load
(N)
Test 1Test 2Test 3Test 4
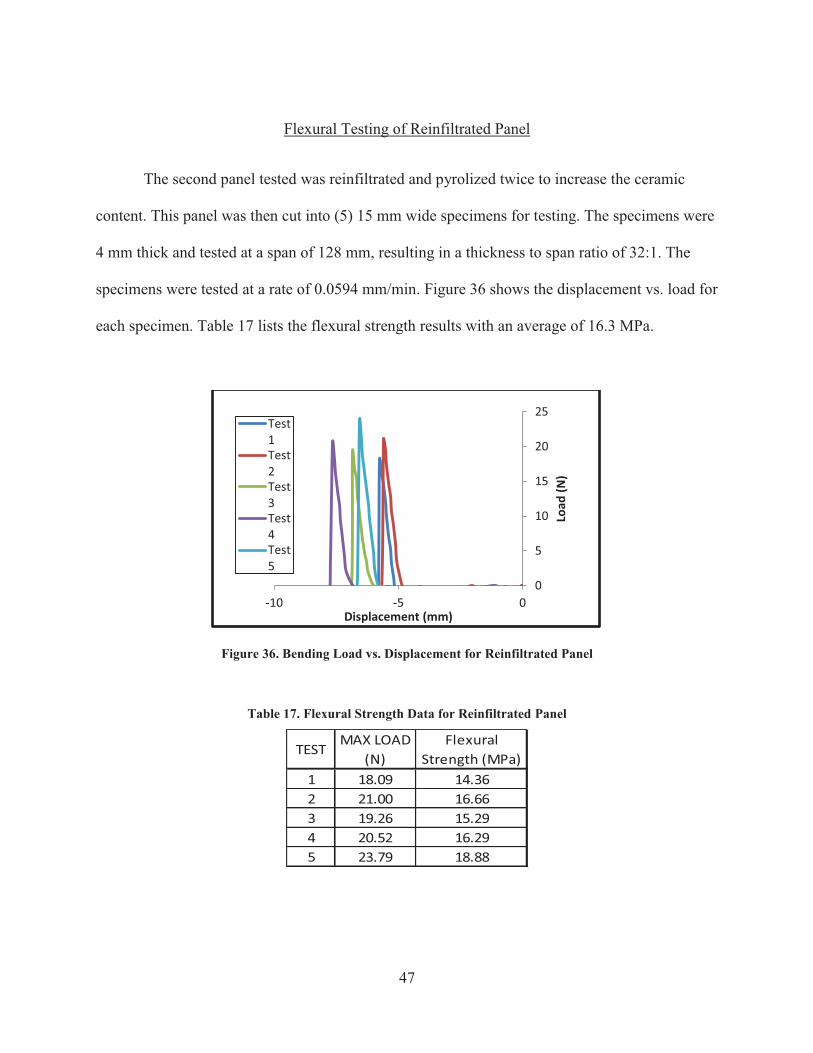
47
Flexural Testing of Reinfiltrated Panel
The second panel tested was reinfiltrated and pyrolized twice to increase the ceramic
content. This panel was then cut into (5) 15 mm wide specimens for testing. The specimens were
4 mm thick and tested at a span of 128 mm, resulting in a thickness to span ratio of 32:1. The
specimens were tested at a rate of 0.0594 mm/min. Figure 36 shows the displacement vs. load for
each specimen. Table 17 lists the flexural strength results with an average of 16.3 MPa.
Figure 36. Bending Load vs. Displacement for Reinfiltrated Panel
Table 17. Flexural Strength Data for Reinfiltrated Panel
TESTMAX LOAD
(N)Flexural
Strength (MPa)1 18.09 14.362 21.00 16.663 19.26 15.294 20.52 16.295 23.79 18.88
-10 -5 00
5
10
15
20
25
Displacement (mm)
Load
(N)
Test1Test2Test3Test4Test5

48
The reinfiltrated specimens have approximately half of the flexural strength of the
pyrolysis only specimens. This could be due to differeing span to thickness ratios, or the
increased crosshead speed used for the reinfiltrated panels. It could also be because a different
fabric form was used, or the reinfiltration cycles strengthened the bond between the fibers and
the matrix causing the fibers to fail in a brittle manner.
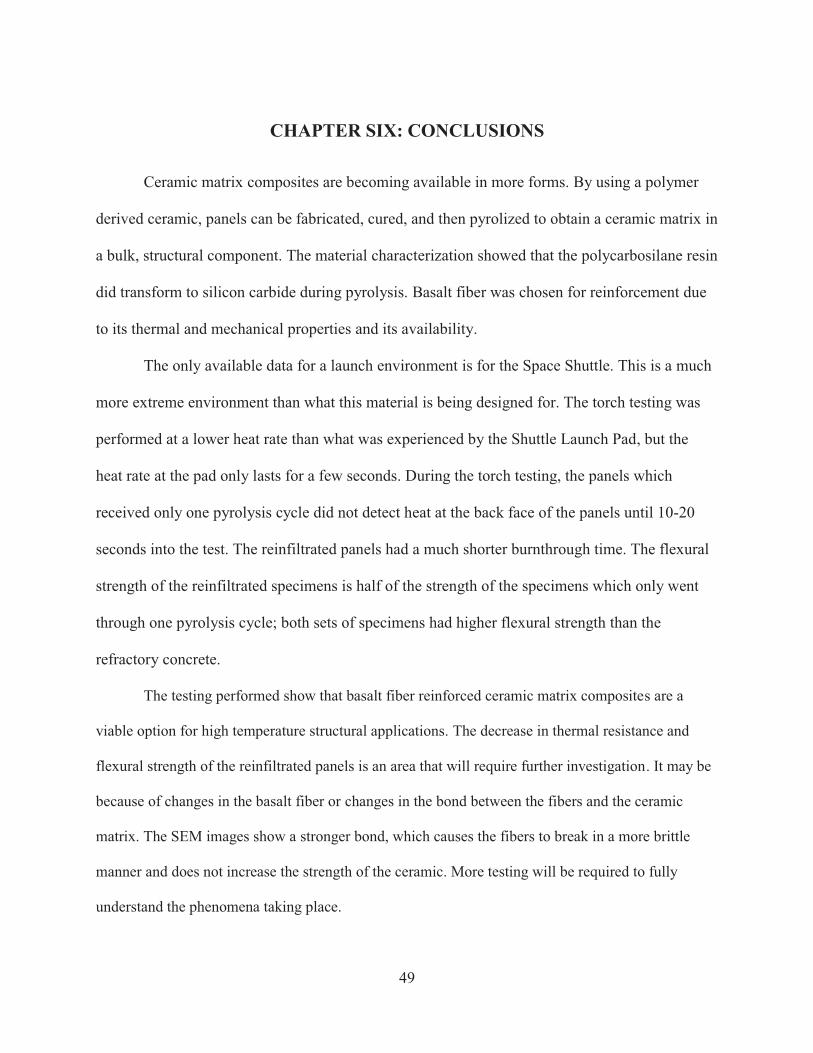
49
CHAPTER SIX: CONCLUSIONS
Ceramic matrix composites are becoming available in more forms. By using a polymer
derived ceramic, panels can be fabricated, cured, and then pyrolized to obtain a ceramic matrix in
a bulk, structural component. The material characterization showed that the polycarbosilane resin
did transform to silicon carbide during pyrolysis. Basalt fiber was chosen for reinforcement due
to its thermal and mechanical properties and its availability.
The only available data for a launch environment is for the Space Shuttle. This is a much
more extreme environment than what this material is being designed for. The torch testing was
performed at a lower heat rate than what was experienced by the Shuttle Launch Pad, but the
heat rate at the pad only lasts for a few seconds. During the torch testing, the panels which
received only one pyrolysis cycle did not detect heat at the back face of the panels until 10-20
seconds into the test. The reinfiltrated panels had a much shorter burnthrough time. The flexural
strength of the reinfiltrated specimens is half of the strength of the specimens which only went
through one pyrolysis cycle; both sets of specimens had higher flexural strength than the
refractory concrete.
The testing performed show that basalt fiber reinforced ceramic matrix composites are a
viable option for high temperature structural applications. The decrease in thermal resistance and
flexural strength of the reinfiltrated panels is an area that will require further investigation. It may be
because of changes in the basalt fiber or changes in the bond between the fibers and the ceramic
matrix. The SEM images show a stronger bond, which causes the fibers to break in a more brittle
manner and does not increase the strength of the ceramic. More testing will be required to fully
understand the phenomena taking place.

50
APPENDIX A: PANEL FABRICATION DATA
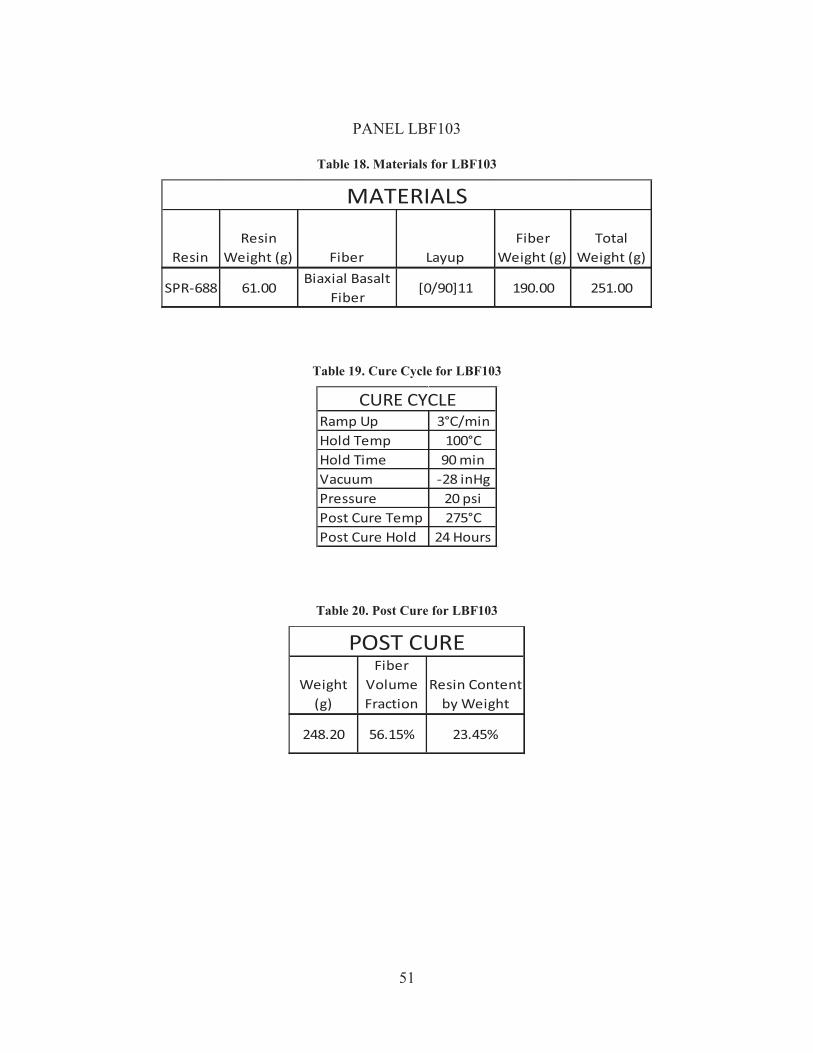
51
PANEL LBF103
Table 18. Materials for LBF103
ResinResin
Weight (g) Fiber LayupFiber
Weight (g)Total
Weight (g)
SPR-688 61.00Biaxial Basalt
Fiber[0/90]11 190.00 251.00
MATERIALS
Table 19. Cure Cycle for LBF103
Ramp Up 3°C/minHold Temp 100°CHold Time 90 minVacuum -28 inHgPressure 20 psiPost Cure Temp 275°CPost Cure Hold 24 Hours
CURE CYCLE
Table 20. Post Cure for LBF103
Weight (g)
Fiber Volume Fraction
Resin Content by Weight
248.20 56.15% 23.45%
POST CURE

52
Table 21. Pyrolysis Cycle for LBF103
Ramp Up 1°C/minHold Temp 650°CHold Time No HoldRamp Up 2°C/minHold Temp 850°CHold Time 90 minutesRamp Down 5°C/min
PYROLYSIS CYCLE
Table 22. Post Pyrolysis for LBF103
Initial Weight
(g)
Post Weight
(g)
Resin Retained
(%)
245.20 232.10 76.27%
PYROLYSIS
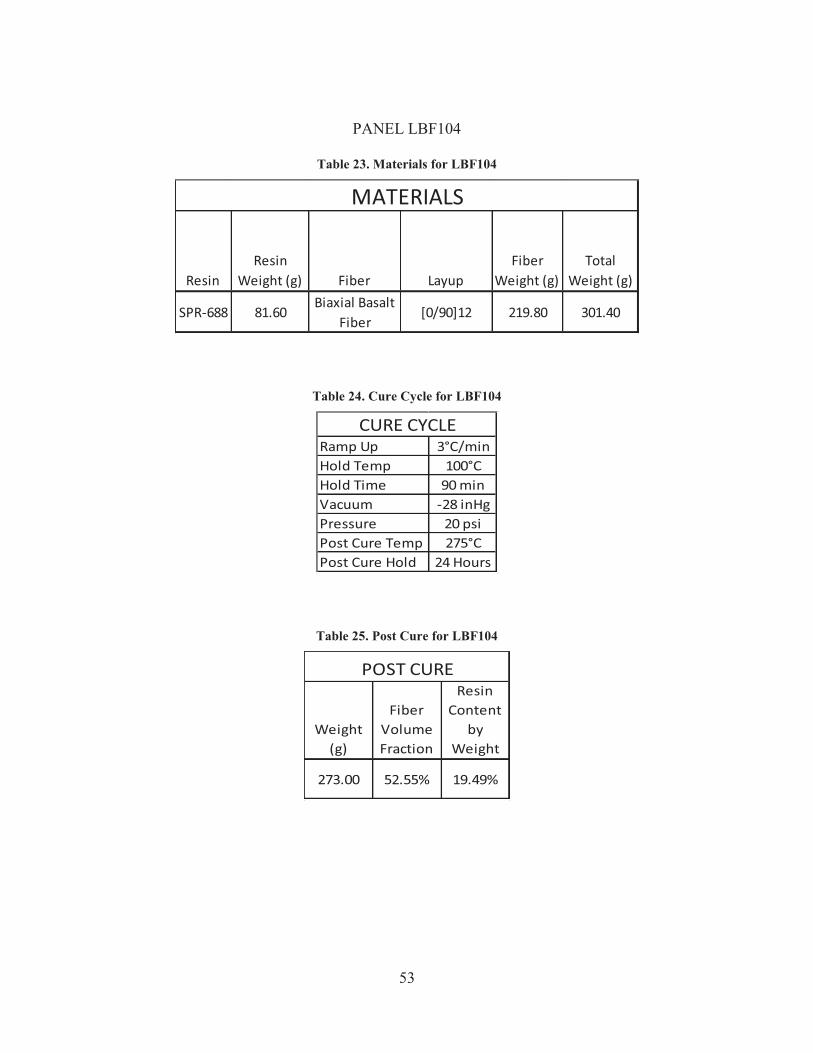
53
PANEL LBF104
Table 23. Materials for LBF104
ResinResin
Weight (g) Fiber LayupFiber
Weight (g)Total
Weight (g)
SPR-688 81.60Biaxial Basalt
Fiber[0/90]12 219.80 301.40
MATERIALS
Table 24. Cure Cycle for LBF104
Ramp Up 3°C/minHold Temp 100°CHold Time 90 minVacuum -28 inHgPressure 20 psiPost Cure Temp 275°CPost Cure Hold 24 Hours
CURE CYCLE
Table 25. Post Cure for LBF104
Weight (g)
Fiber Volume Fraction
Resin Content
by Weight
273.00 52.55% 19.49%
POST CURE
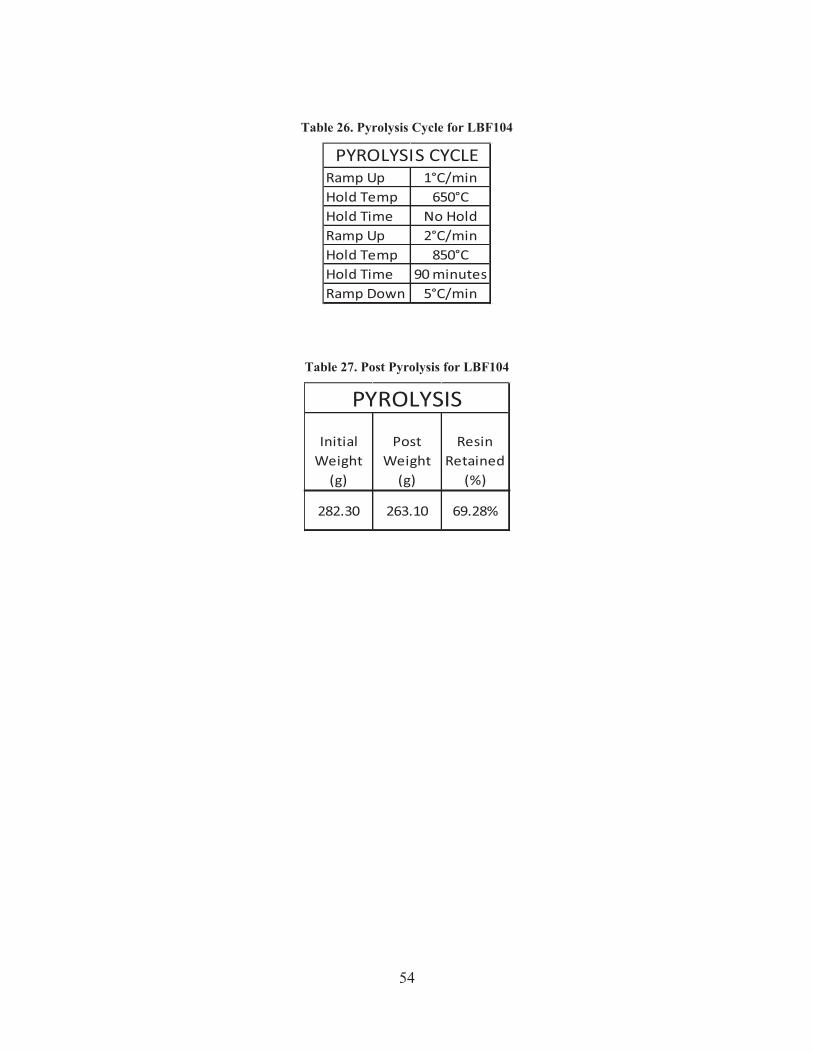
54
Table 26. Pyrolysis Cycle for LBF104
Ramp Up 1°C/minHold Temp 650°CHold Time No HoldRamp Up 2°C/minHold Temp 850°CHold Time 90 minutesRamp Down 5°C/min
PYROLYSIS CYCLE
Table 27. Post Pyrolysis for LBF104
Initial Weight
(g)
Post Weight
(g)
Resin Retained
(%)
282.30 263.10 69.28%
PYROLYSIS
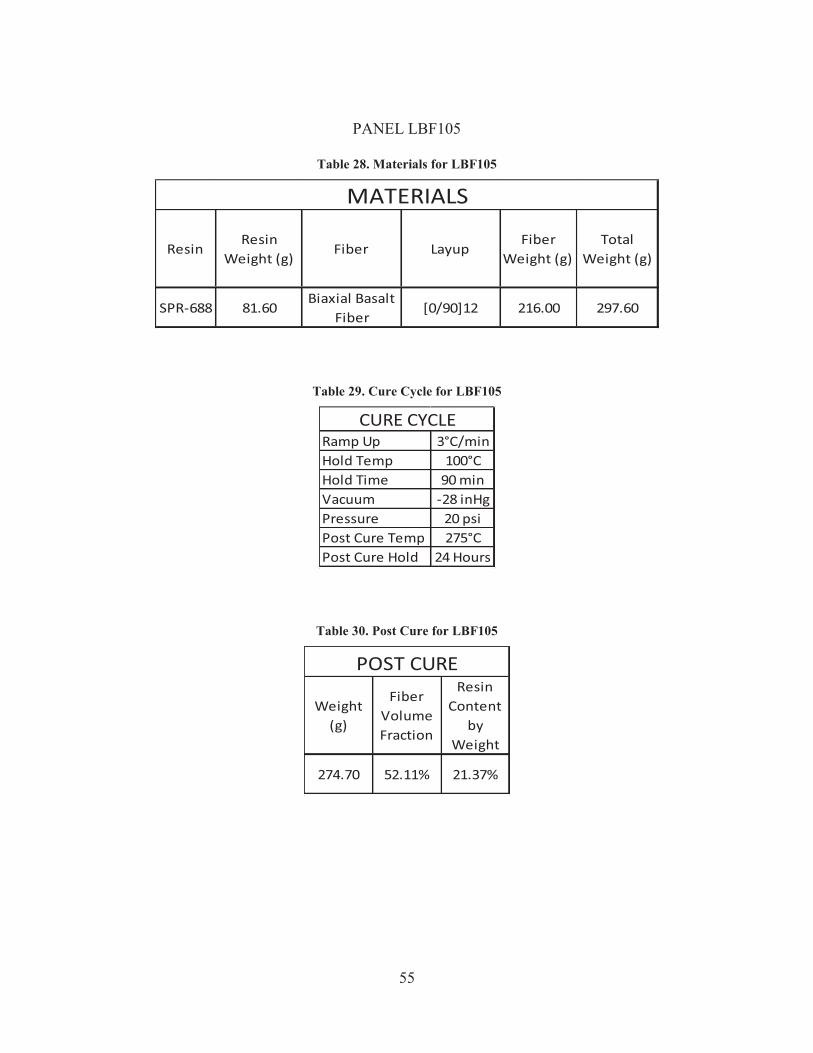
55
PANEL LBF105
Table 28. Materials for LBF105
ResinResin
Weight (g)Fiber Layup
Fiber Weight (g)
Total Weight (g)
SPR-688 81.60Biaxial Basalt
Fiber[0/90]12 216.00 297.60
MATERIALS
Table 29. Cure Cycle for LBF105
Ramp Up 3°C/minHold Temp 100°CHold Time 90 minVacuum -28 inHgPressure 20 psiPost Cure Temp 275°CPost Cure Hold 24 Hours
CURE CYCLE
Table 30. Post Cure for LBF105
Weight (g)
Fiber Volume Fraction
Resin Content
by Weight
274.70 52.11% 21.37%
POST CURE
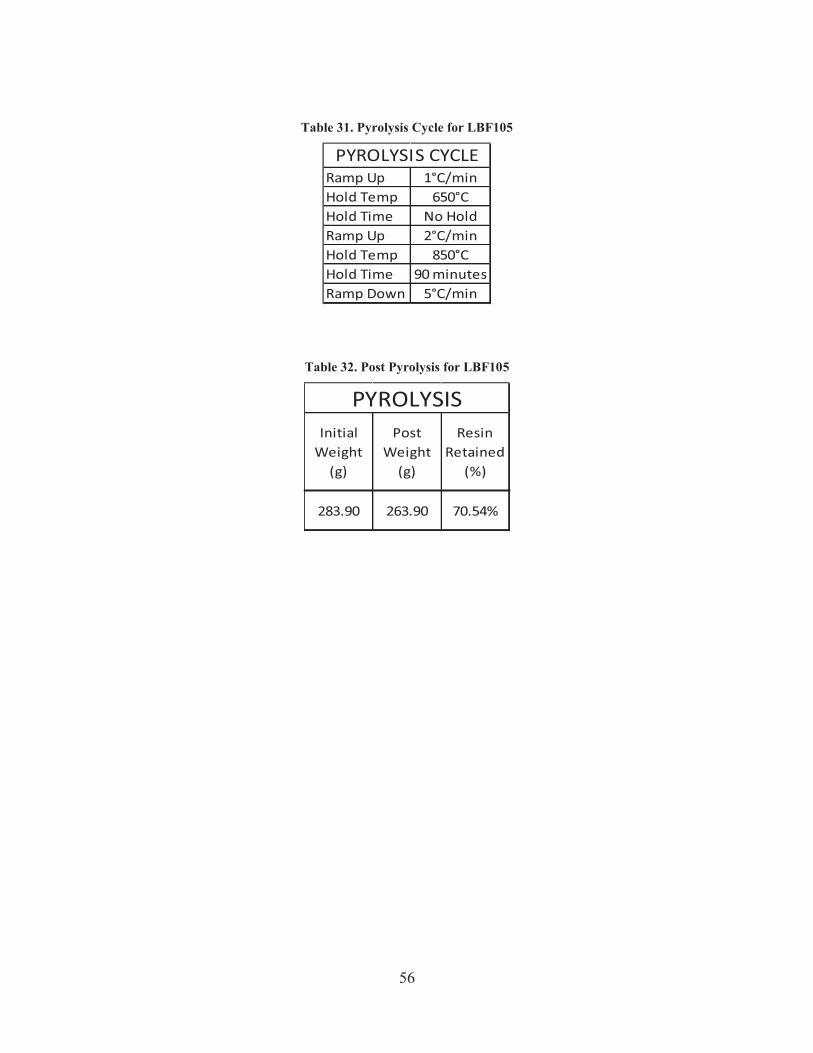
56
Table 31. Pyrolysis Cycle for LBF105
Ramp Up 1°C/minHold Temp 650°CHold Time No HoldRamp Up 2°C/minHold Temp 850°CHold Time 90 minutesRamp Down 5°C/min
PYROLYSIS CYCLE
Table 32. Post Pyrolysis for LBF105
Initial Weight
(g)
Post Weight
(g)
Resin Retained
(%)
283.90 263.90 70.54%
PYROLYSIS
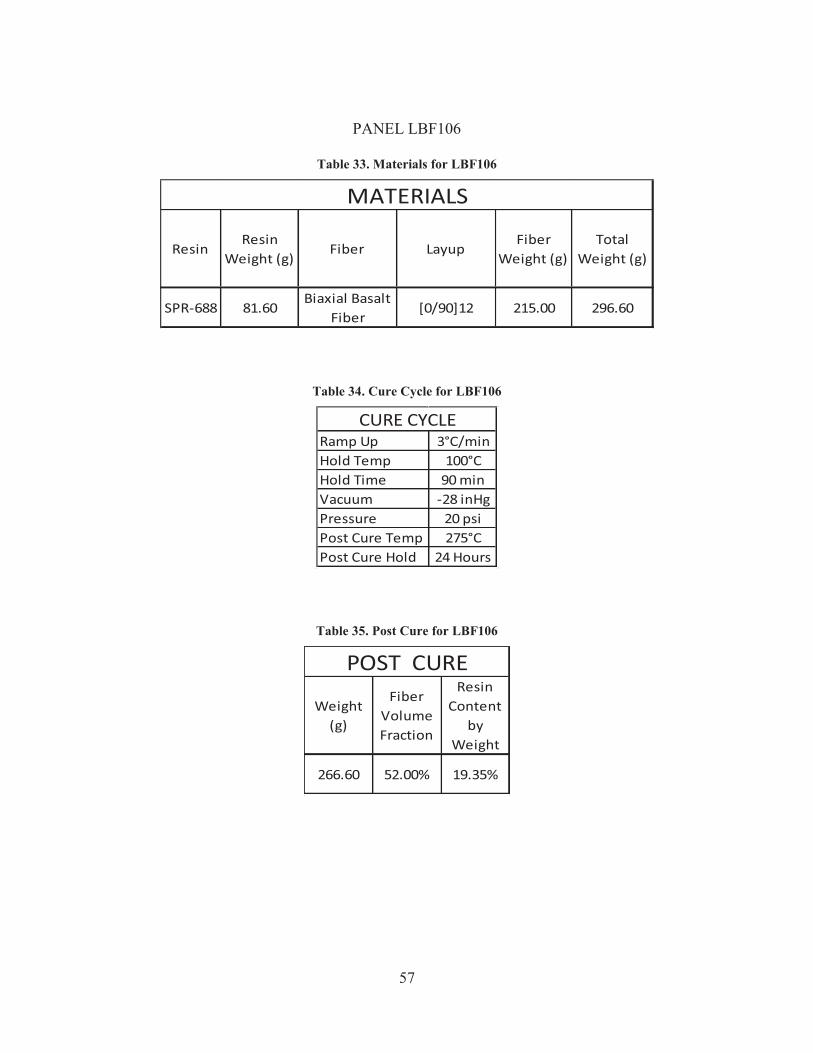
57
PANEL LBF106
Table 33. Materials for LBF106
ResinResin
Weight (g)Fiber Layup
Fiber Weight (g)
Total Weight (g)
SPR-688 81.60Biaxial Basalt
Fiber[0/90]12 215.00 296.60
MATERIALS
Table 34. Cure Cycle for LBF106
Ramp Up 3°C/minHold Temp 100°CHold Time 90 minVacuum -28 inHgPressure 20 psiPost Cure Temp 275°CPost Cure Hold 24 Hours
CURE CYCLE
Table 35. Post Cure for LBF106
Weight (g)
Fiber Volume Fraction
Resin Content
by Weight
266.60 52.00% 19.35%
POST CURE

58
Table 36. Pyrolysis Cycle for LBF106
Ramp Up 1°C/minHold Temp 650°CHold Time No HoldRamp Up 2°C/minHold Temp 850°CHold Time 90 minutesRamp Down 5°C/min
PYROLYSIS CYCLE
Table 37. Post Pyrolysis for LBF106
Initial Weight
(g)
Post Weight
(g)
Resin Retained
(%)
276.30 257.30 69.00%
PYROLYSIS
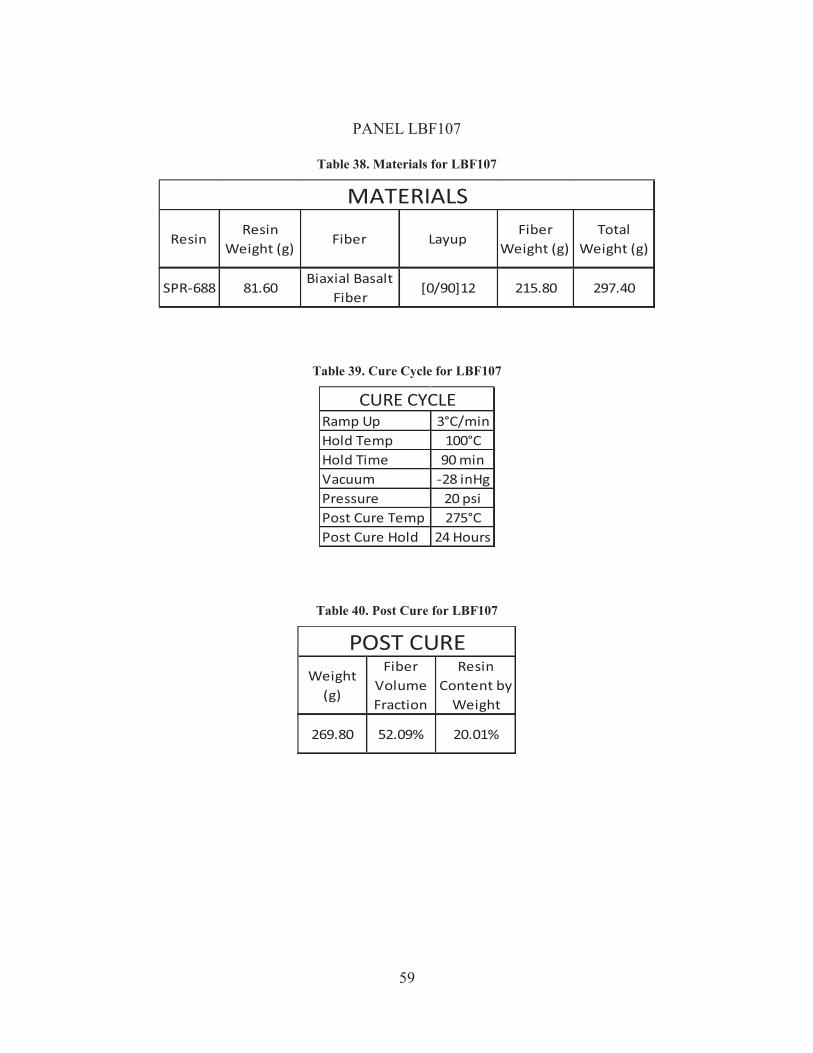
59
PANEL LBF107
Table 38. Materials for LBF107
ResinResin
Weight (g)Fiber Layup
Fiber Weight (g)
Total Weight (g)
SPR-688 81.60Biaxial Basalt
Fiber[0/90]12 215.80 297.40
MATERIALS
Table 39. Cure Cycle for LBF107
Ramp Up 3°C/minHold Temp 100°CHold Time 90 minVacuum -28 inHgPressure 20 psiPost Cure Temp 275°CPost Cure Hold 24 Hours
CURE CYCLE
Table 40. Post Cure for LBF107
Weight (g)
Fiber Volume Fraction
Resin Content by
Weight
269.80 52.09% 20.01%
POST CURE

60
Table 41. Pyrolysis Cycle for LBF107
Ramp Up 1°C/minHold Temp 650°CHold Time No HoldRamp Up 2°C/minHold Temp 850°CHold Time 90 minutesRamp Down 5°C/min
PYROLYSIS CYCLE
Table 42. Post Pyrolysis for LBF107
Initial Weight
(g)
Post Weight
(g)
Resin Retained
(%)
279.30 260.00 69.61%
PYROLYSIS
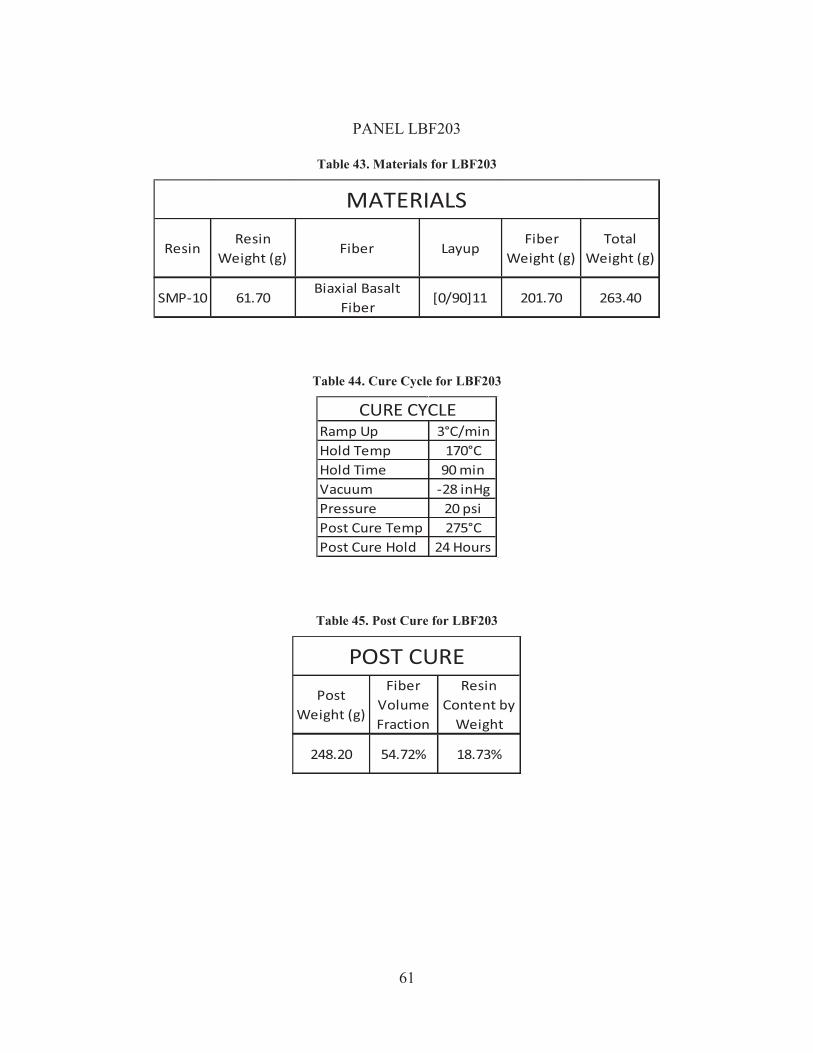
61
PANEL LBF203
Table 43. Materials for LBF203
ResinResin
Weight (g)Fiber Layup
Fiber Weight (g)
Total Weight (g)
SMP-10 61.70Biaxial Basalt
Fiber[0/90]11 201.70 263.40
MATERIALS
Table 44. Cure Cycle for LBF203
Ramp Up 3°C/minHold Temp 170°CHold Time 90 minVacuum -28 inHgPressure 20 psiPost Cure Temp 275°CPost Cure Hold 24 Hours
CURE CYCLE
Table 45. Post Cure for LBF203
Post Weight (g)
Fiber Volume Fraction
Resin Content by
Weight
248.20 54.72% 18.73%
POST CURE
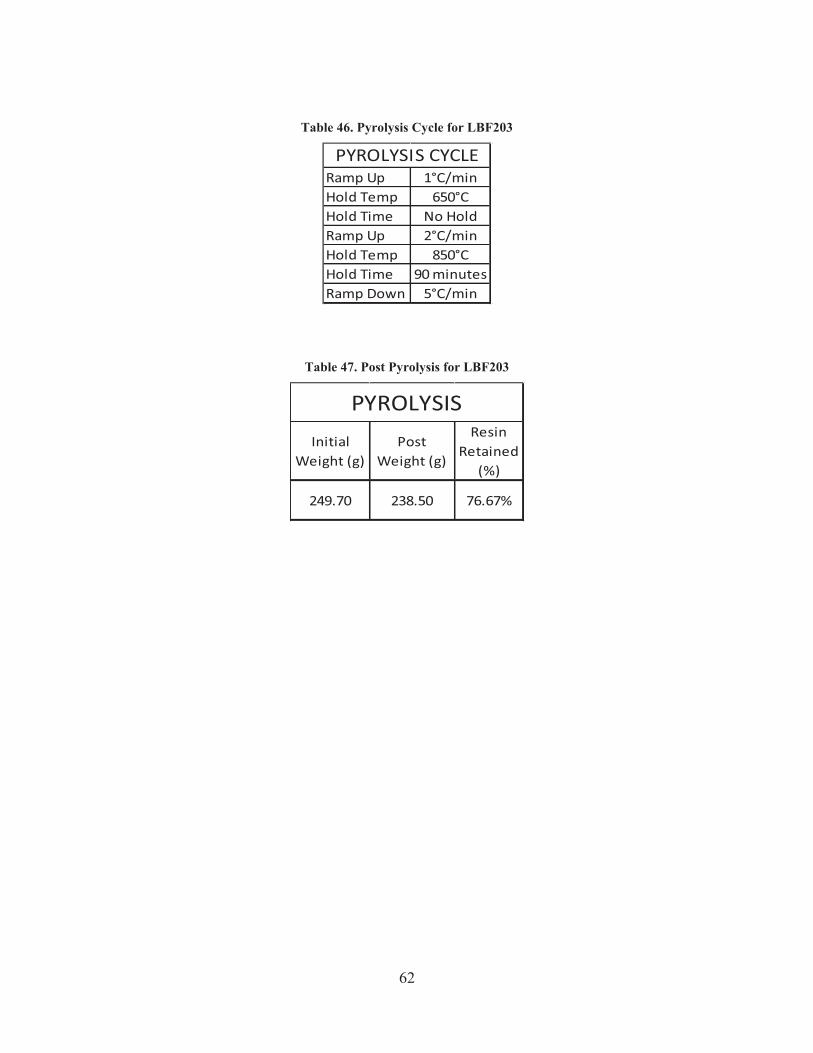
62
Table 46. Pyrolysis Cycle for LBF203
Ramp Up 1°C/minHold Temp 650°CHold Time No HoldRamp Up 2°C/minHold Temp 850°CHold Time 90 minutesRamp Down 5°C/min
PYROLYSIS CYCLE
Table 47. Post Pyrolysis for LBF203
Initial Weight (g)
Post Weight (g)
Resin Retained
(%)
249.70 238.50 76.67%
PYROLYSIS
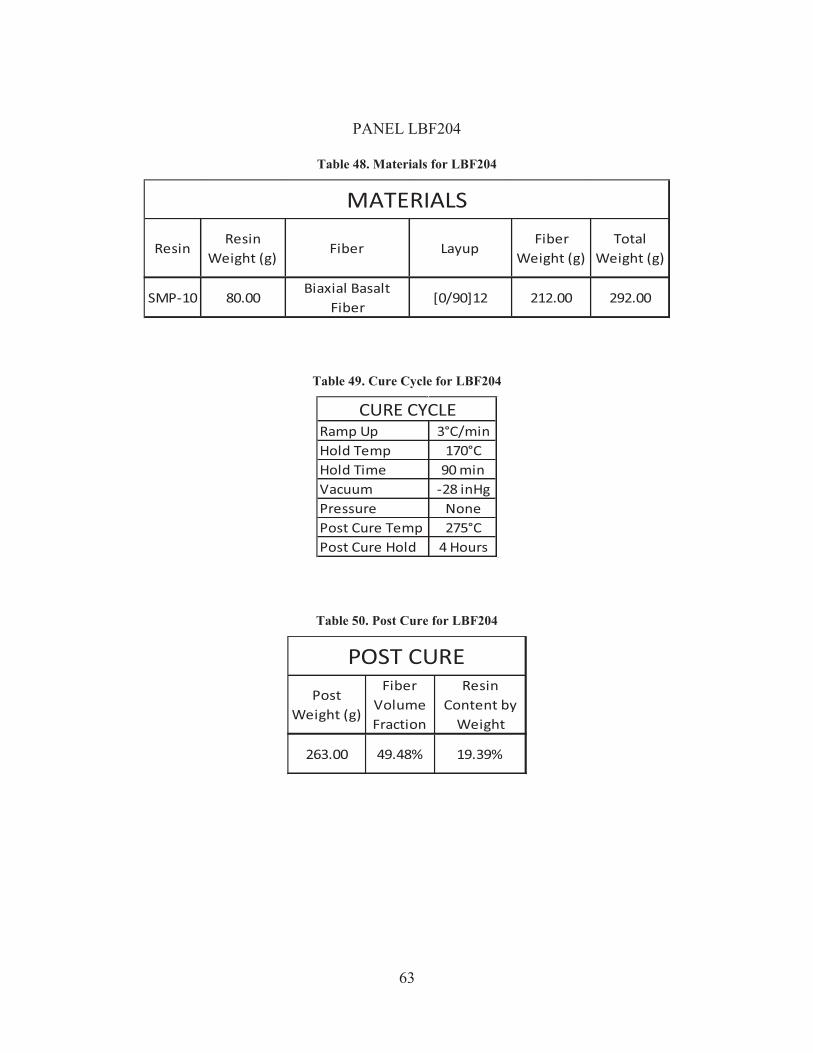
63
PANEL LBF204
Table 48. Materials for LBF204
ResinResin
Weight (g)Fiber Layup
Fiber Weight (g)
Total Weight (g)
SMP-10 80.00Biaxial Basalt
Fiber[0/90]12 212.00 292.00
MATERIALS
Table 49. Cure Cycle for LBF204
Ramp Up 3°C/minHold Temp 170°CHold Time 90 minVacuum -28 inHgPressure NonePost Cure Temp 275°CPost Cure Hold 4 Hours
CURE CYCLE
Table 50. Post Cure for LBF204
Post Weight (g)
Fiber Volume Fraction
Resin Content by
Weight
263.00 49.48% 19.39%
POST CURE

64
Table 51. Pyrolysis Cycle for LBF204
Ramp Up 1°C/minHold Temp 200°CHold Time 60 minRamp Up 1°C/minHold Temp 400°CHold Time 60 minRamp Up 1°C/minHold Temp 600°CHold Time 60 minRamp Up 1°C/minHold Temp 700°CHold Time 60 minRamp Up 1°C/minHold Temp 850°CHold Time 60 minRamp Down -0.75°C/minHold Temp 350°CHold Time No HoldRamp Down -1°C/minTemp 100°C
PYROLYSIS CYCLE
Table 52. Post Pyrolysis for LBF204
Initial Weight (g)
Post Weight (g)
Resin Retained
(%)
263.00 257.60 89.41%
PYROLYSIS
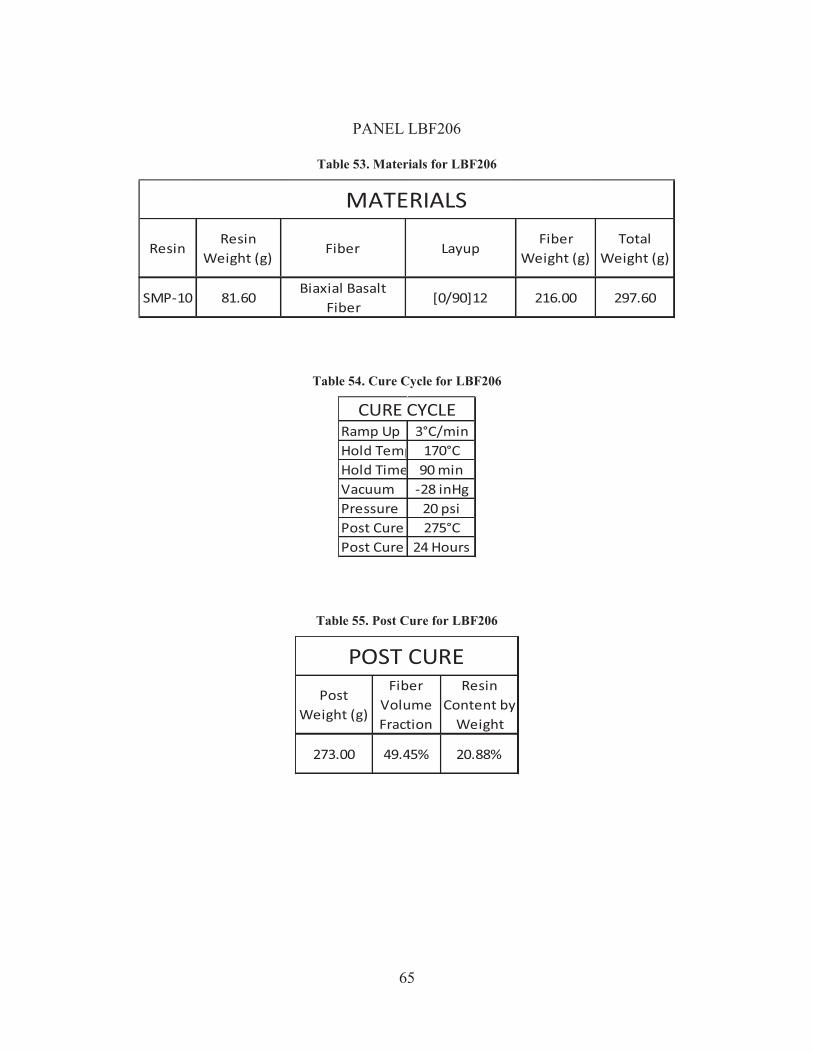
65
PANEL LBF206
Table 53. Materials for LBF206
ResinResin
Weight (g)Fiber Layup
Fiber Weight (g)
Total Weight (g)
SMP-10 81.60Biaxial Basalt
Fiber[0/90]12 216.00 297.60
MATERIALS
Table 54. Cure Cycle for LBF206
Ramp Up 3°C/minHold Temp 170°CHold Time 90 minVacuum -28 inHgPressure 20 psiPost Cure 275°CPost Cure 24 Hours
CURE CYCLE
Table 55. Post Cure for LBF206
Post Weight (g)
Fiber Volume Fraction
Resin Content by
Weight
273.00 49.45% 20.88%
POST CURE

66
Table 56. Pyrolysis Cycle for LBF206
Ramp Up 1°C/minHold Temp 200°CHold Time 60 minRamp Up 1°C/minHold Temp 300°CHold Time 60 minRamp Up 1°C/minHold Temp 500°CHold Time 60 minRamp Up 1°C/minHold Temp 600°CHold Time 60 minRamp Up 1°C/minHold Temp 700°CHold Time 60 minRamp Up 1°C/minHold Temp 850°CHold Time 60 minRamp Down -0.75°C/minTemp 100°C
PYROLYSIS CYCLE
Table 57. Post Pyrolysis for LBF206
Initial Weight (g)
Post Weight
(g)
Resin Retained
(%)
276.00 268.00 86.67%
PYROLYSIS
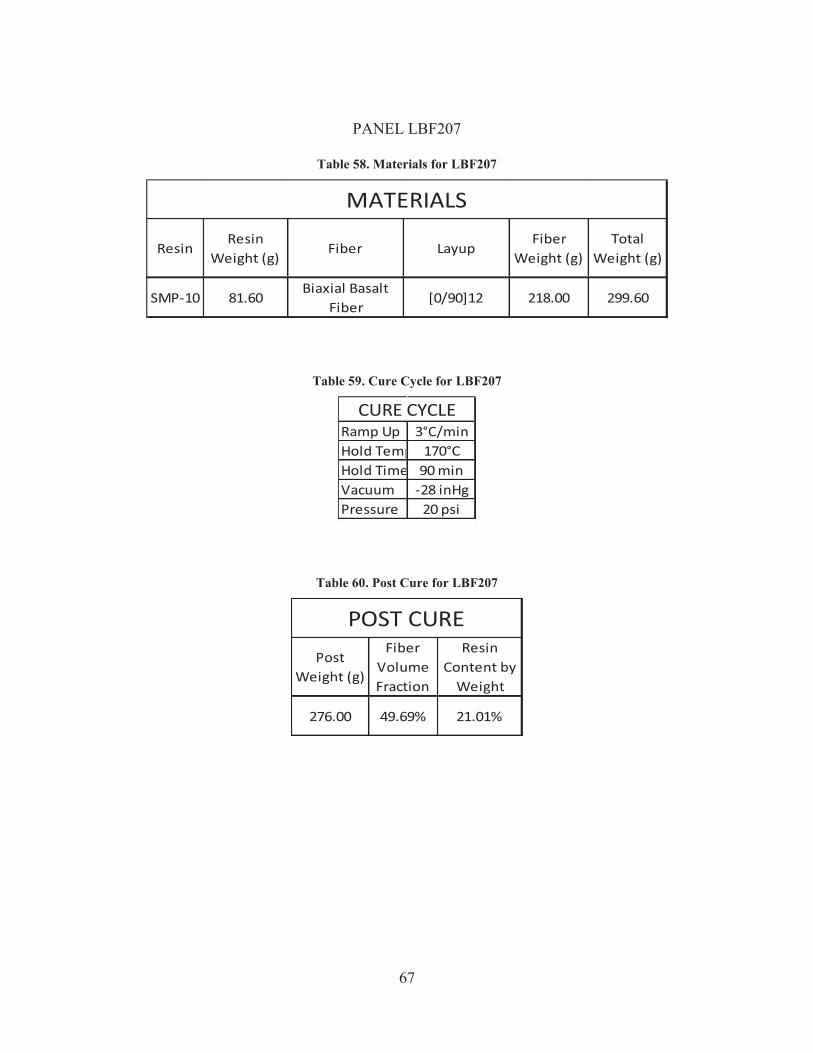
67
PANEL LBF207
Table 58. Materials for LBF207
ResinResin
Weight (g)Fiber Layup
Fiber Weight (g)
Total Weight (g)
SMP-10 81.60Biaxial Basalt
Fiber[0/90]12 218.00 299.60
MATERIALS
Table 59. Cure Cycle for LBF207
Ramp Up 3°C/minHold Temp 170°CHold Time 90 minVacuum -28 inHgPressure 20 psi
CURE CYCLE
Table 60. Post Cure for LBF207
Post Weight (g)
Fiber Volume Fraction
Resin Content by
Weight
276.00 49.69% 21.01%
POST CURE
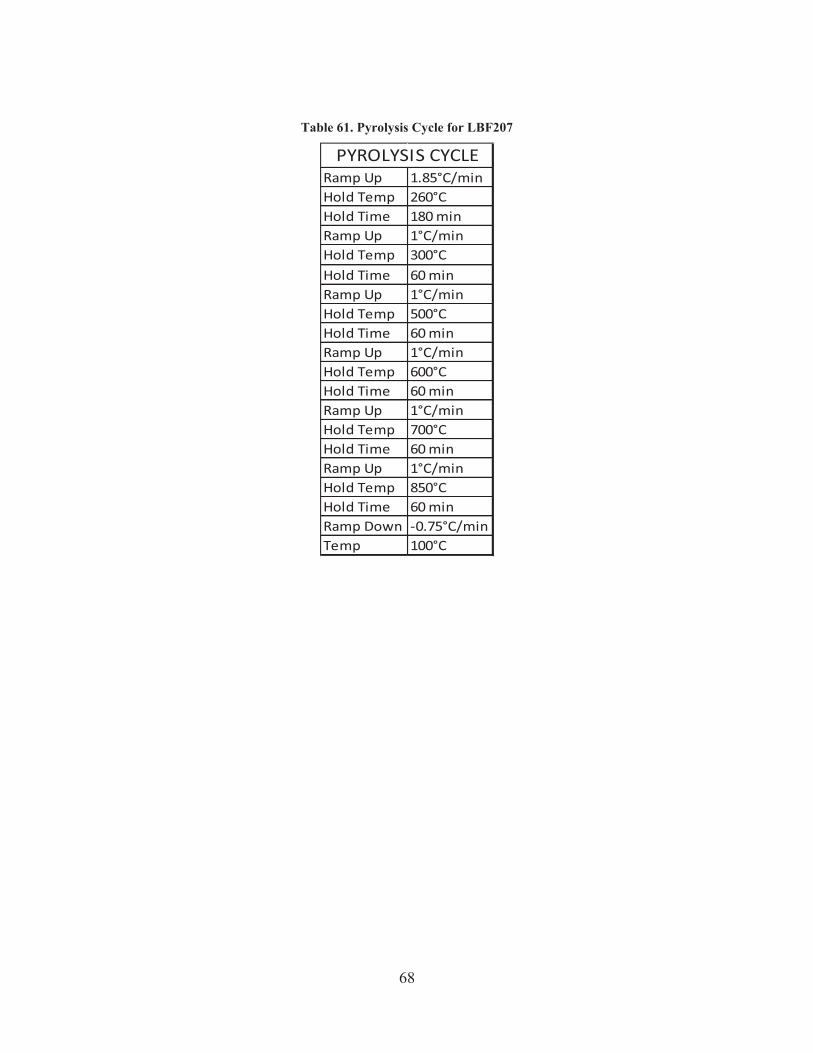
68
Table 61. Pyrolysis Cycle for LBF207
Ramp Up 1.85°C/minHold Temp 260°CHold Time 180 minRamp Up 1°C/minHold Temp 300°CHold Time 60 minRamp Up 1°C/minHold Temp 500°CHold Time 60 minRamp Up 1°C/minHold Temp 600°CHold Time 60 minRamp Up 1°C/minHold Temp 700°CHold Time 60 minRamp Up 1°C/minHold Temp 850°CHold Time 60 minRamp Down -0.75°C/minTemp 100°C
PYROLYSIS CYCLE
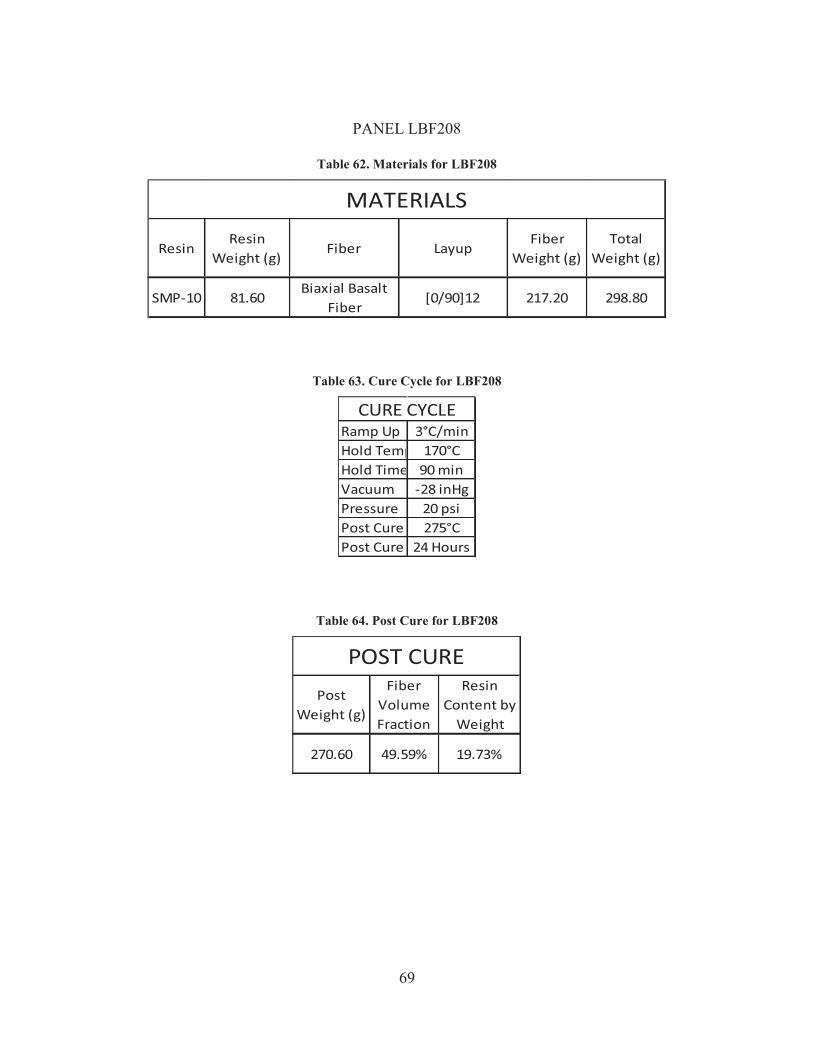
69
PANEL LBF208
Table 62. Materials for LBF208
ResinResin
Weight (g)Fiber Layup
Fiber Weight (g)
Total Weight (g)
SMP-10 81.60Biaxial Basalt
Fiber[0/90]12 217.20 298.80
MATERIALS
Table 63. Cure Cycle for LBF208
Ramp Up 3°C/minHold Temp 170°CHold Time 90 minVacuum -28 inHgPressure 20 psiPost Cure 275°CPost Cure 24 Hours
CURE CYCLE
Table 64. Post Cure for LBF208
Post Weight (g)
Fiber Volume Fraction
Resin Content by
Weight
270.60 49.59% 19.73%
POST CURE
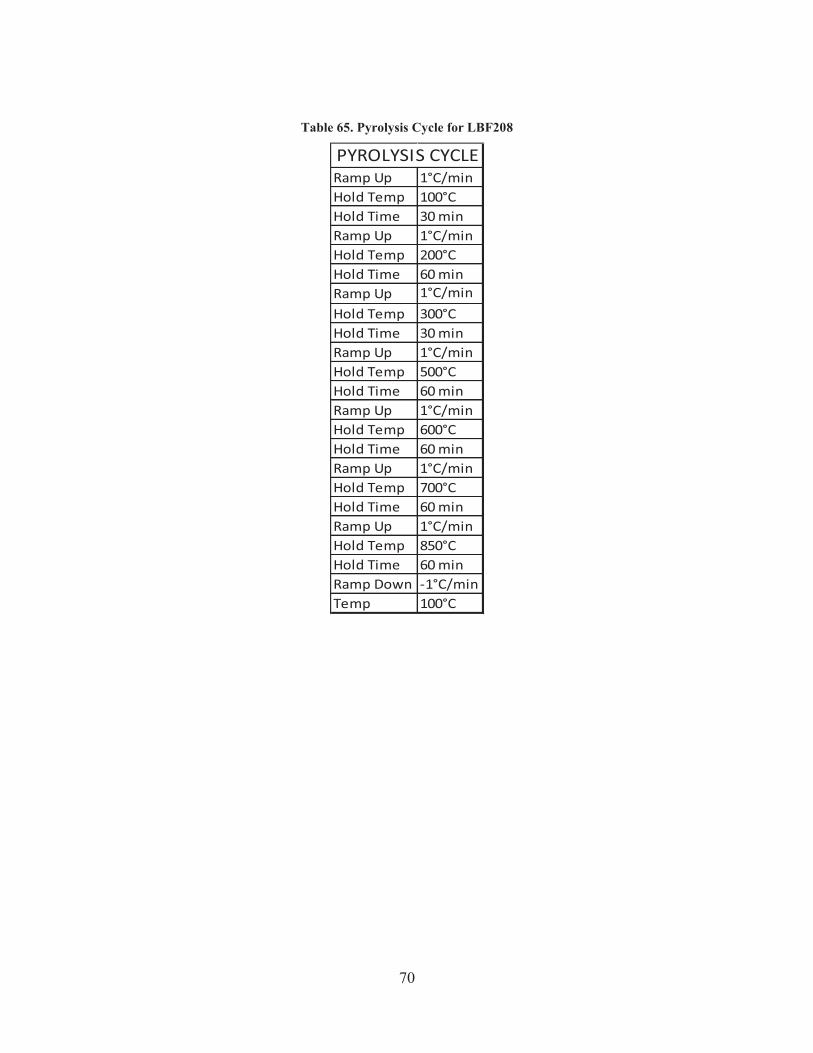
70
Table 65. Pyrolysis Cycle for LBF208
Ramp Up 1°C/minHold Temp 100°CHold Time 30 minRamp Up 1°C/minHold Temp 200°CHold Time 60 minRamp Up 1°C/minHold Temp 300°CHold Time 30 minRamp Up 1°C/minHold Temp 500°CHold Time 60 minRamp Up 1°C/minHold Temp 600°CHold Time 60 minRamp Up 1°C/minHold Temp 700°CHold Time 60 minRamp Up 1°C/minHold Temp 850°CHold Time 60 minRamp Down -1°C/minTemp 100°C
PYROLYSIS CYCLE
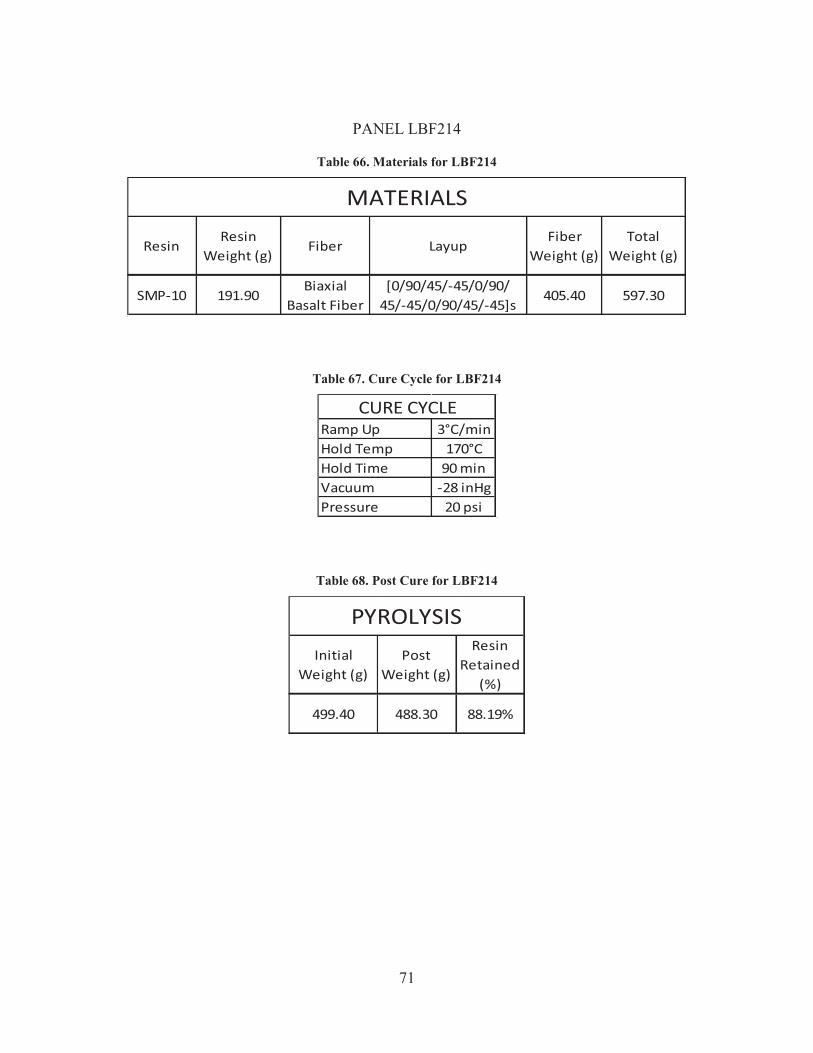
71
PANEL LBF214
Table 66. Materials for LBF214
ResinResin
Weight (g)Fiber Layup
Fiber Weight (g)
Total Weight (g)
SMP-10 191.90Biaxial
Basalt Fiber[0/90/45/-45/0/90/
45/-45/0/90/45/-45]s405.40 597.30
MATERIALS
Table 67. Cure Cycle for LBF214
Ramp Up 3°C/minHold Temp 170°CHold Time 90 minVacuum -28 inHgPressure 20 psi
CURE CYCLE
Table 68. Post Cure for LBF214
Initial Weight (g)
Post Weight (g)
Resin Retained
(%)
499.40 488.30 88.19%
PYROLYSIS
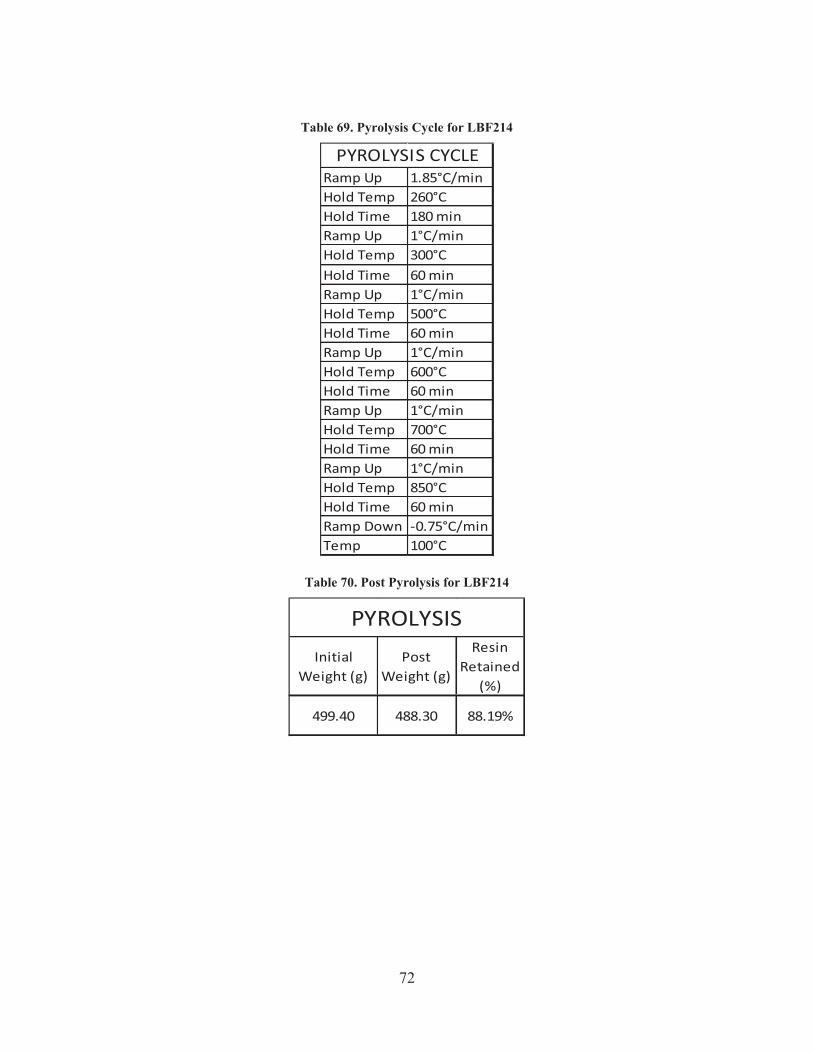
72
Table 69. Pyrolysis Cycle for LBF214
Ramp Up 1.85°C/minHold Temp 260°CHold Time 180 minRamp Up 1°C/minHold Temp 300°CHold Time 60 minRamp Up 1°C/minHold Temp 500°CHold Time 60 minRamp Up 1°C/minHold Temp 600°CHold Time 60 minRamp Up 1°C/minHold Temp 700°CHold Time 60 minRamp Up 1°C/minHold Temp 850°CHold Time 60 minRamp Down -0.75°C/minTemp 100°C
PYROLYSIS CYCLE
Table 70. Post Pyrolysis for LBF214
Initial Weight (g)
Post Weight (g)
Resin Retained
(%)
499.40 488.30 88.19%
PYROLYSIS
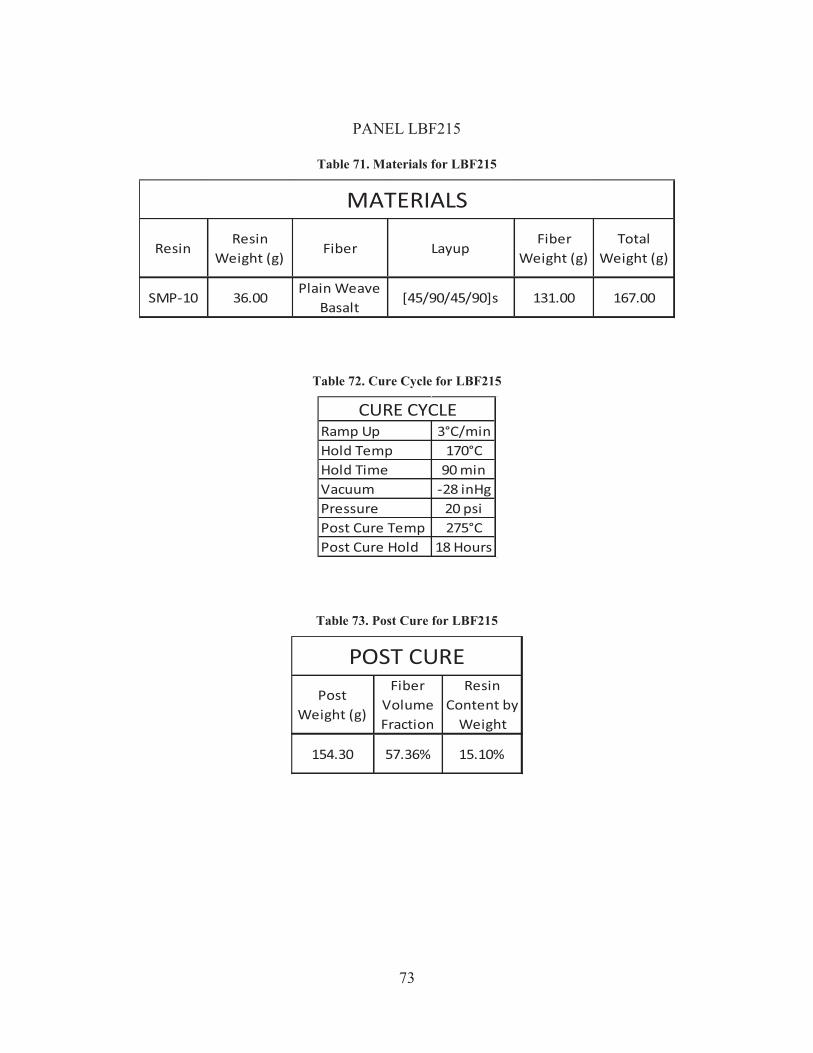
73
PANEL LBF215
Table 71. Materials for LBF215
ResinResin
Weight (g)Fiber Layup
Fiber Weight (g)
Total Weight (g)
SMP-10 36.00Plain Weave
Basalt[45/90/45/90]s 131.00 167.00
MATERIALS
Table 72. Cure Cycle for LBF215
Ramp Up 3°C/minHold Temp 170°CHold Time 90 minVacuum -28 inHgPressure 20 psiPost Cure Temp 275°CPost Cure Hold 18 Hours
CURE CYCLE
Table 73. Post Cure for LBF215
Post Weight (g)
Fiber Volume Fraction
Resin Content by
Weight
154.30 57.36% 15.10%
POST CURE
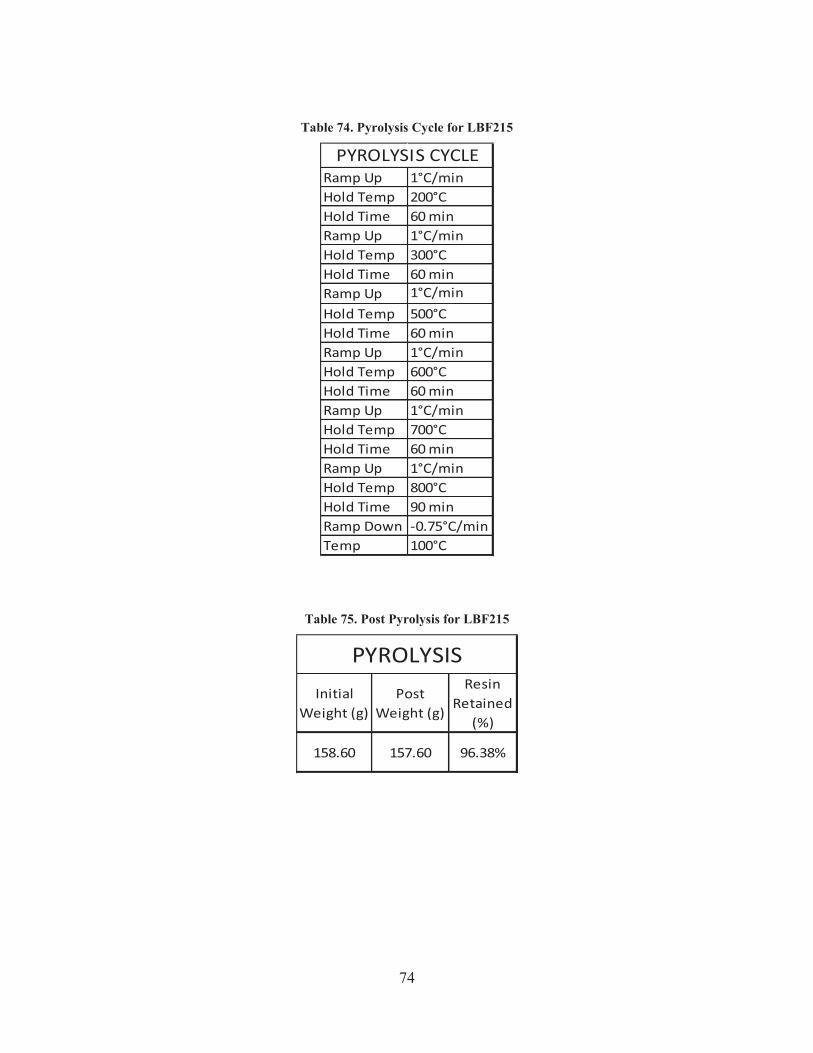
74
Table 74. Pyrolysis Cycle for LBF215
Ramp Up 1°C/minHold Temp 200°CHold Time 60 minRamp Up 1°C/minHold Temp 300°CHold Time 60 minRamp Up 1°C/minHold Temp 500°CHold Time 60 minRamp Up 1°C/minHold Temp 600°CHold Time 60 minRamp Up 1°C/minHold Temp 700°CHold Time 60 minRamp Up 1°C/minHold Temp 800°CHold Time 90 minRamp Down -0.75°C/minTemp 100°C
PYROLYSIS CYCLE
Table 75. Post Pyrolysis for LBF215
Initial Weight (g)
Post Weight (g)
Resin Retained
(%)
158.60 157.60 96.38%
PYROLYSIS
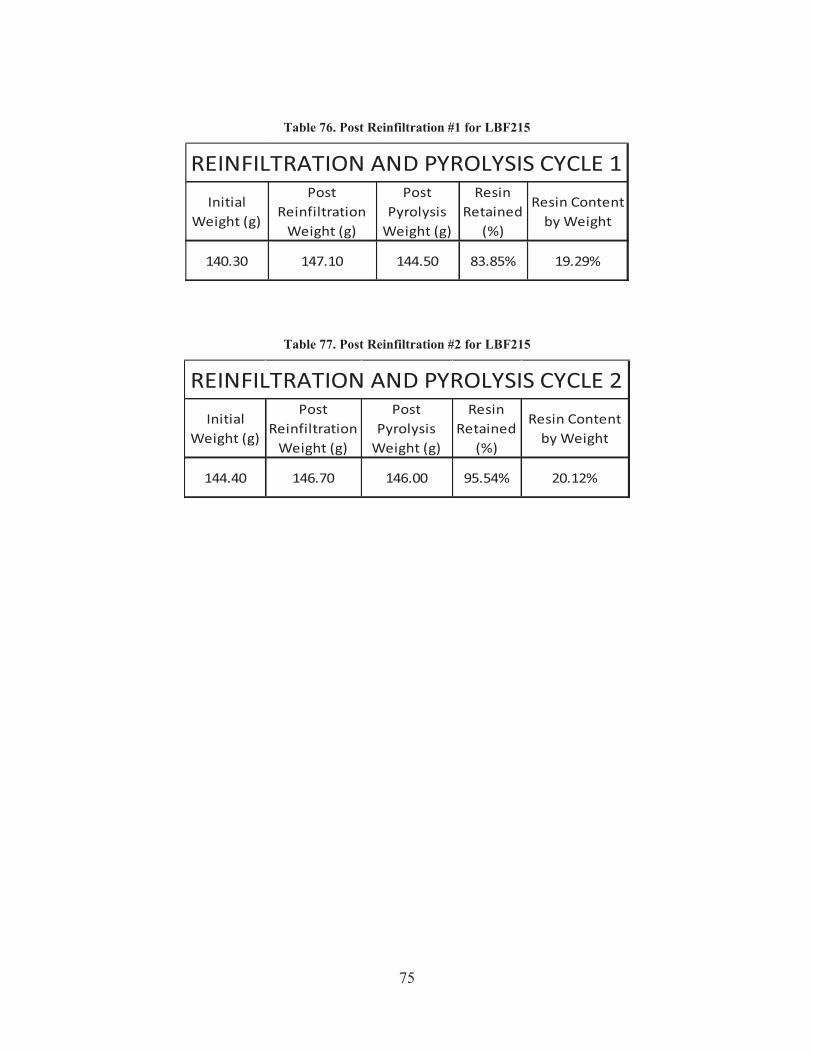
75
Table 76. Post Reinfiltration #1 for LBF215
Initial Weight (g)
Post Reinfiltration
Weight (g)
Post Pyrolysis
Weight (g)
Resin Retained
(%)
Resin Content by Weight
140.30 147.10 144.50 83.85% 19.29%
REINFILTRATION AND PYROLYSIS CYCLE 1
Table 77. Post Reinfiltration #2 for LBF215
Initial Weight (g)
Post Reinfiltration
Weight (g)
Post Pyrolysis
Weight (g)
Resin Retained
(%)
Resin Content by Weight
144.40 146.70 146.00 95.54% 20.12%
REINFILTRATION AND PYROLYSIS CYCLE 2
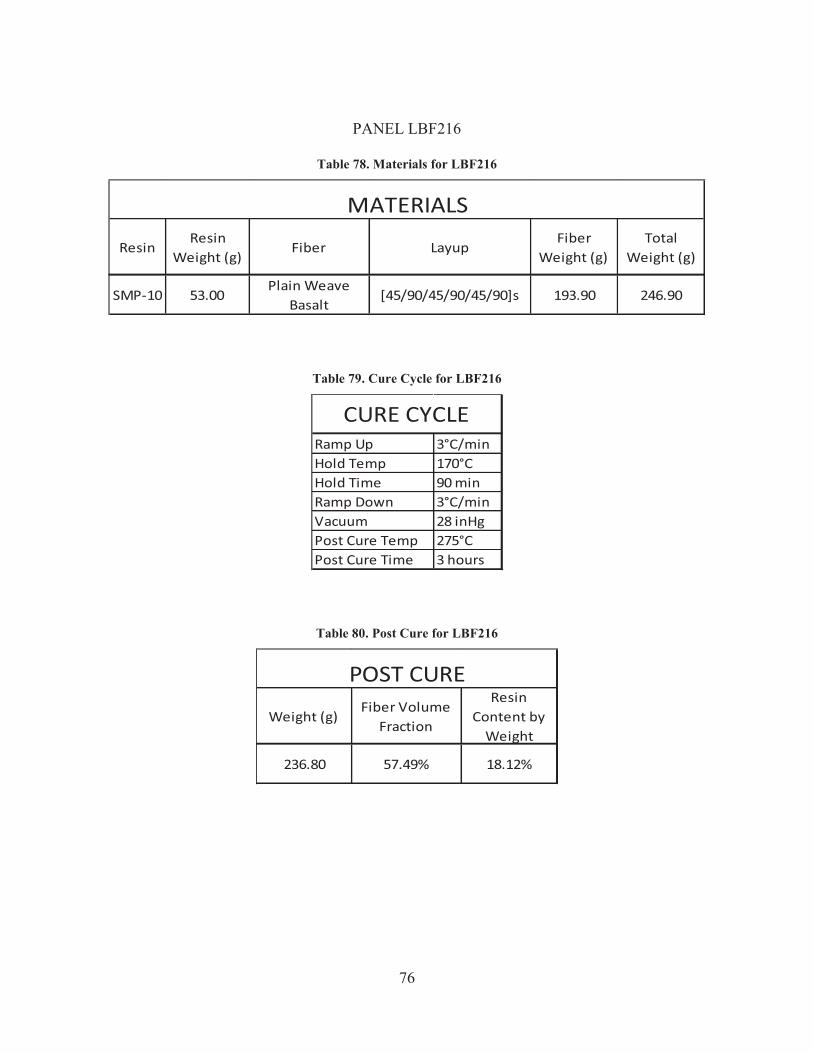
76
PANEL LBF216
Table 78. Materials for LBF216
ResinResin
Weight (g)Fiber Layup
Fiber Weight (g)
Total Weight (g)
SMP-10 53.00Plain Weave
Basalt [45/90/45/90/45/90]s 193.90 246.90
MATERIALS
Table 79. Cure Cycle for LBF216
Ramp Up 3°C/minHold Temp 170°CHold Time 90 minRamp Down 3°C/minVacuum 28 inHgPost Cure Temp 275°CPost Cure Time 3 hours
CURE CYCLE
Table 80. Post Cure for LBF216
Weight (g)Fiber Volume
Fraction
Resin Content by
Weight
236.80 57.49% 18.12%
POST CURE
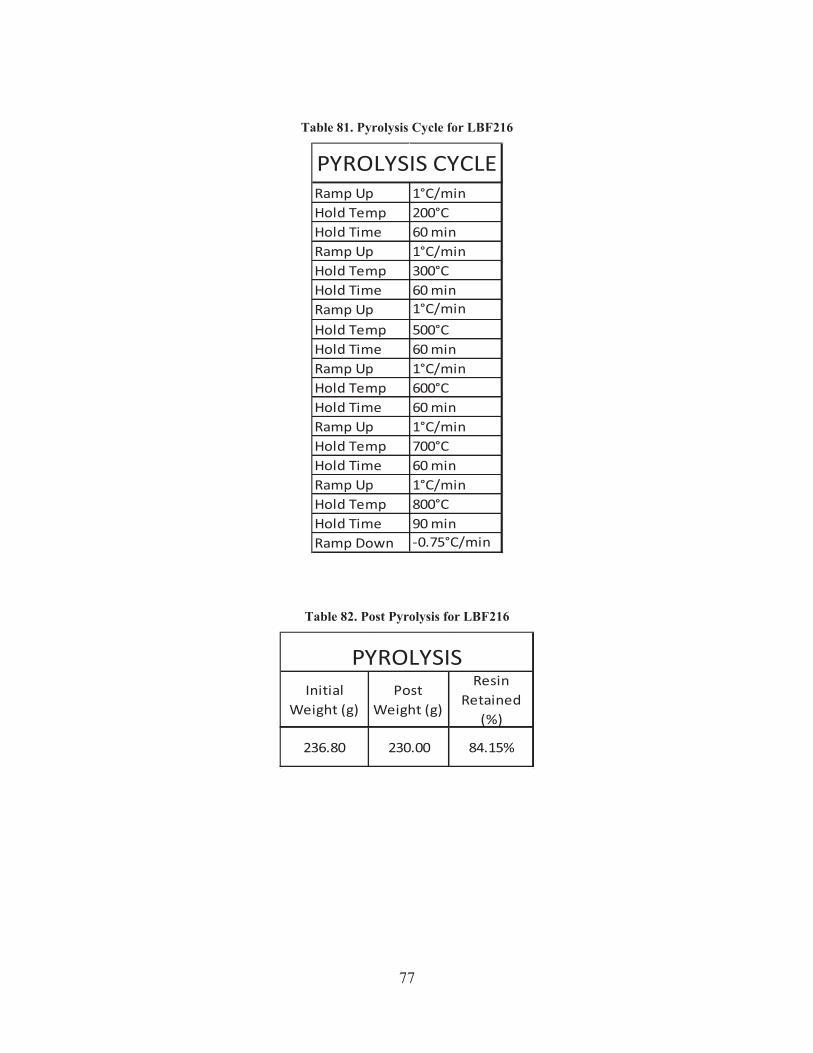
77
Table 81. Pyrolysis Cycle for LBF216
Ramp Up 1°C/minHold Temp 200°CHold Time 60 minRamp Up 1°C/minHold Temp 300°CHold Time 60 minRamp Up 1°C/minHold Temp 500°CHold Time 60 minRamp Up 1°C/minHold Temp 600°CHold Time 60 minRamp Up 1°C/minHold Temp 700°CHold Time 60 minRamp Up 1°C/minHold Temp 800°CHold Time 90 minRamp Down -0.75°C/min
PYROLYSIS CYCLE
Table 82. Post Pyrolysis for LBF216
Initial Weight (g)
Post Weight (g)
Resin Retained
(%)
236.80 230.00 84.15%
PYROLYSIS
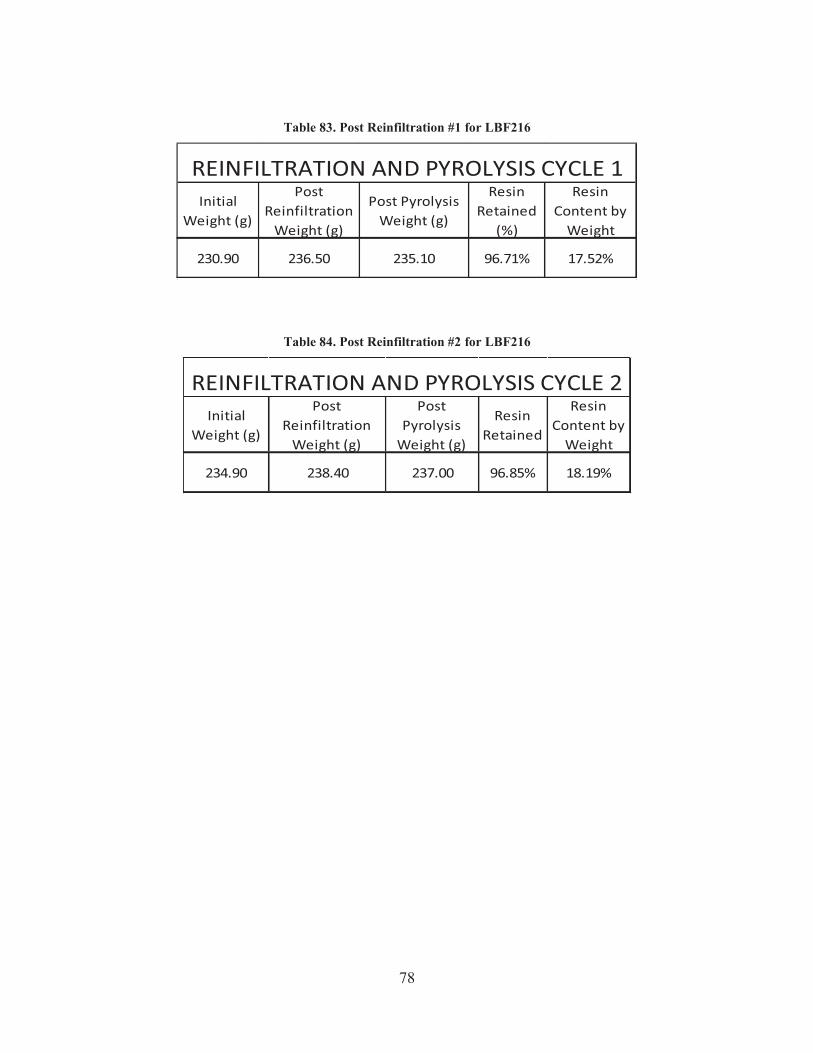
78
Table 83. Post Reinfiltration #1 for LBF216
Initial Weight (g)
Post Reinfiltration
Weight (g)
Post Pyrolysis Weight (g)
Resin Retained
(%)
Resin Content by
Weight
230.90 236.50 235.10 96.71% 17.52%
REINFILTRATION AND PYROLYSIS CYCLE 1
Table 84. Post Reinfiltration #2 for LBF216
Initial Weight (g)
Post Reinfiltration
Weight (g)
Post Pyrolysis
Weight (g)
Resin Retained
Resin Content by
Weight
234.90 238.40 237.00 96.85% 18.19%
REINFILTRATION AND PYROLYSIS CYCLE 2
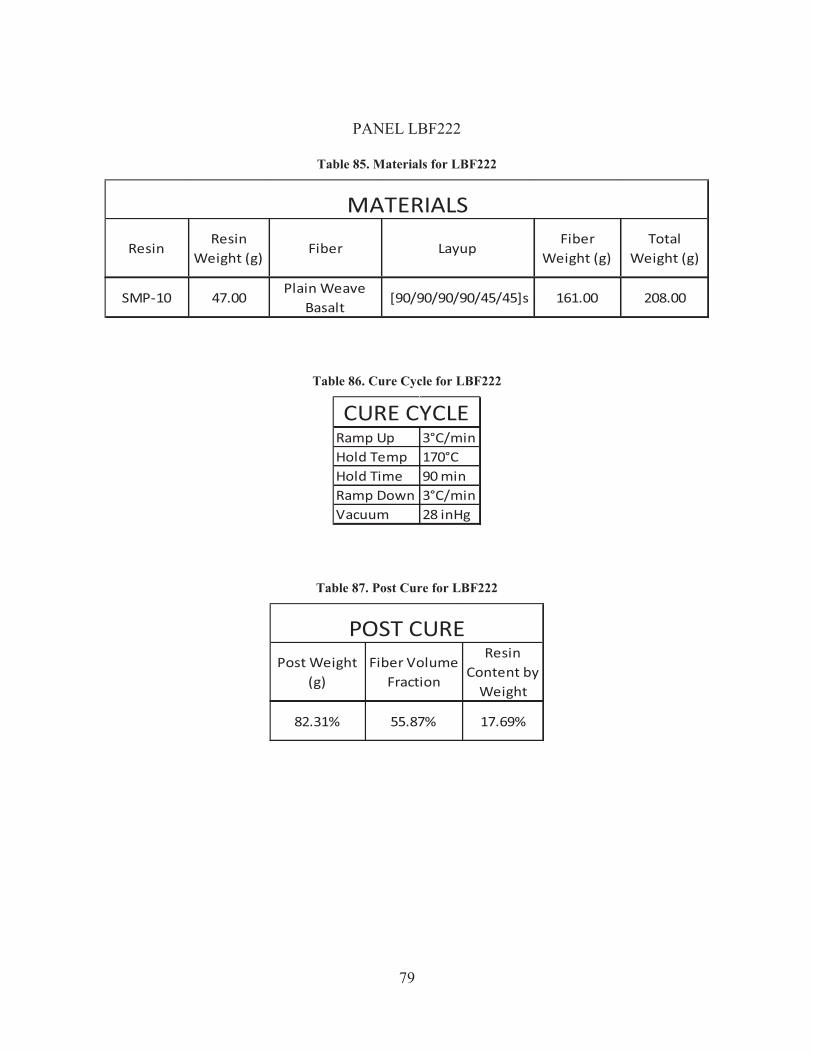
79
PANEL LBF222
Table 85. Materials for LBF222
ResinResin
Weight (g)Fiber Layup
Fiber Weight (g)
Total Weight (g)
SMP-10 47.00Plain Weave
Basalt [90/90/90/90/45/45]s 161.00 208.00
MATERIALS
Table 86. Cure Cycle for LBF222
Ramp Up 3°C/minHold Temp 170°CHold Time 90 minRamp Down 3°C/minVacuum 28 inHg
CURE CYCLE
Table 87. Post Cure for LBF222
Post Weight (g)
Fiber Volume Fraction
Resin Content by
Weight
82.31% 55.87% 17.69%
POST CURE
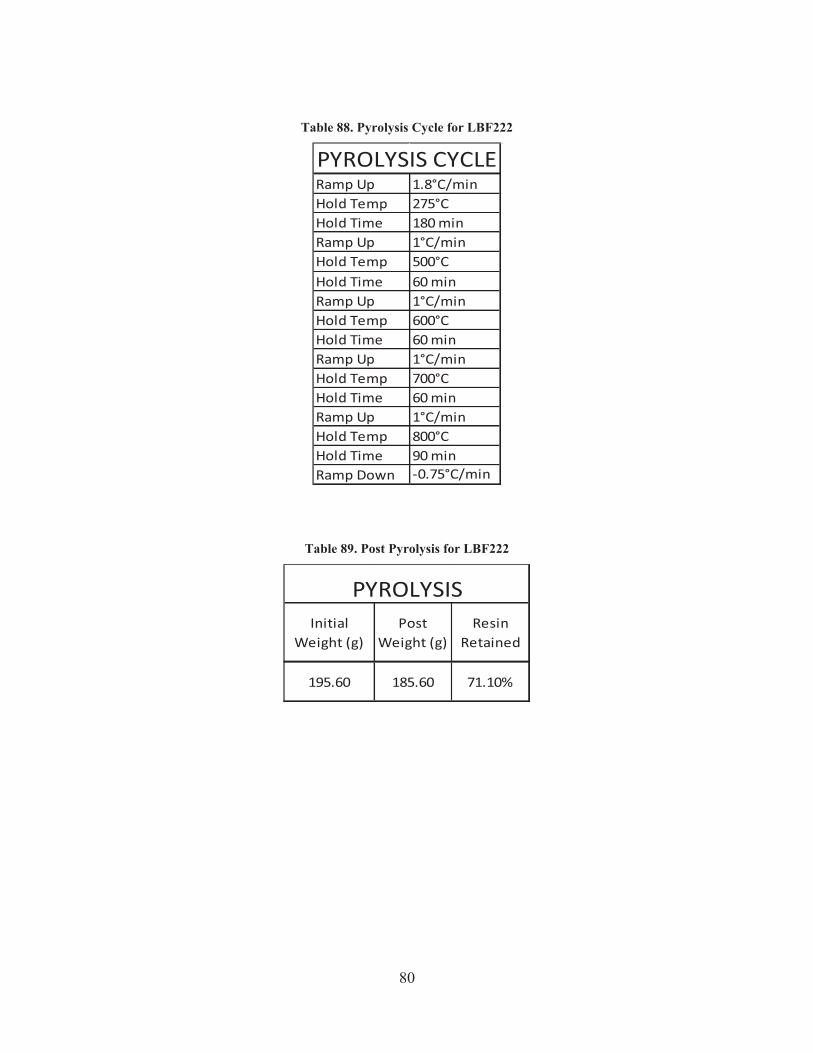
80
Table 88. Pyrolysis Cycle for LBF222
Ramp Up 1.8°C/minHold Temp 275°CHold Time 180 minRamp Up 1°C/minHold Temp 500°CHold Time 60 minRamp Up 1°C/minHold Temp 600°CHold Time 60 minRamp Up 1°C/minHold Temp 700°CHold Time 60 minRamp Up 1°C/minHold Temp 800°CHold Time 90 minRamp Down -0.75°C/min
PYROLYSIS CYCLE
Table 89. Post Pyrolysis for LBF222
Initial Weight (g)
Post Weight (g)
Resin Retained
195.60 185.60 71.10%
PYROLYSIS
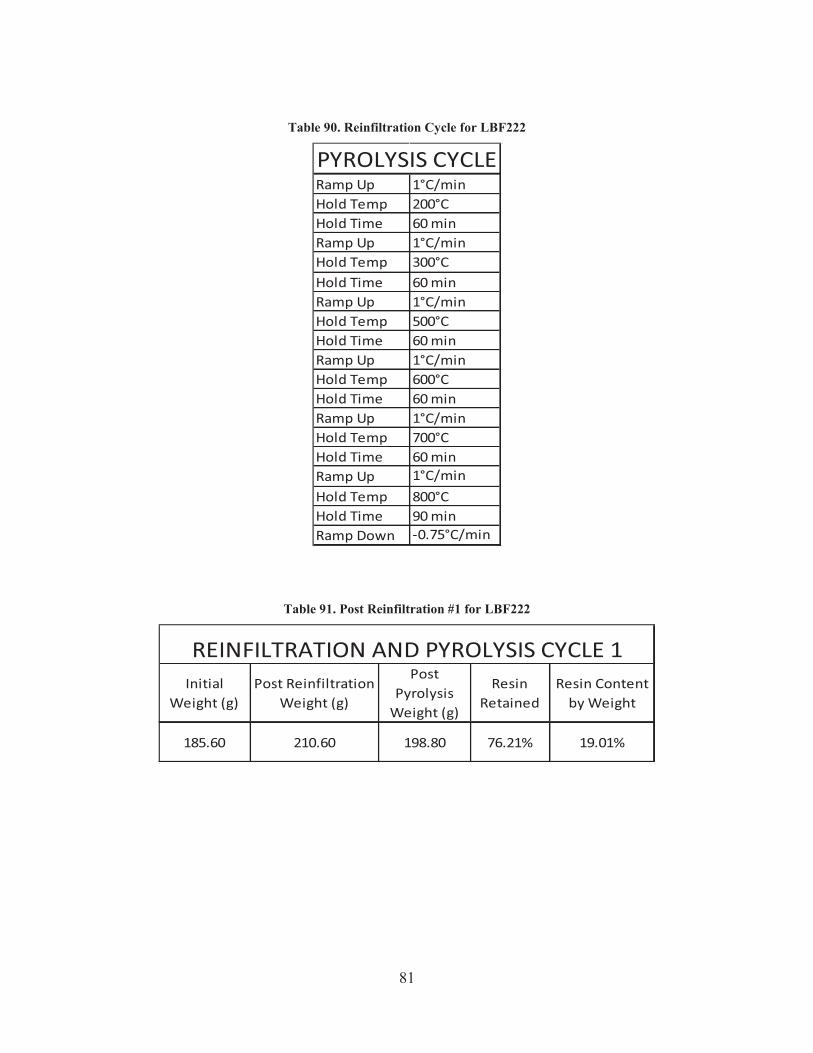
81
Table 90. Reinfiltration Cycle for LBF222
Ramp Up 1°C/minHold Temp 200°CHold Time 60 minRamp Up 1°C/minHold Temp 300°CHold Time 60 minRamp Up 1°C/minHold Temp 500°CHold Time 60 minRamp Up 1°C/minHold Temp 600°CHold Time 60 minRamp Up 1°C/minHold Temp 700°CHold Time 60 minRamp Up 1°C/minHold Temp 800°CHold Time 90 minRamp Down -0.75°C/min
PYROLYSIS CYCLE
Table 91. Post Reinfiltration #1 for LBF222
Initial Weight (g)
Post Reinfiltration Weight (g)
Post Pyrolysis
Weight (g)
Resin Retained
Resin Content by Weight
185.60 210.60 198.80 76.21% 19.01%
REINFILTRATION AND PYROLYSIS CYCLE 1

82
Table 92. Post Reinfiltration #2 for LBF222
Initial Weight (g)
Post Reinfiltration Weight (g)
Post Pyrolysis
Weight (g)
Resin Retained
Resin Content by Weight
198.80 220.40 208.10 79.29% 22.63%
REINFILTRATION AND PYROLYSIS CYCLE 2
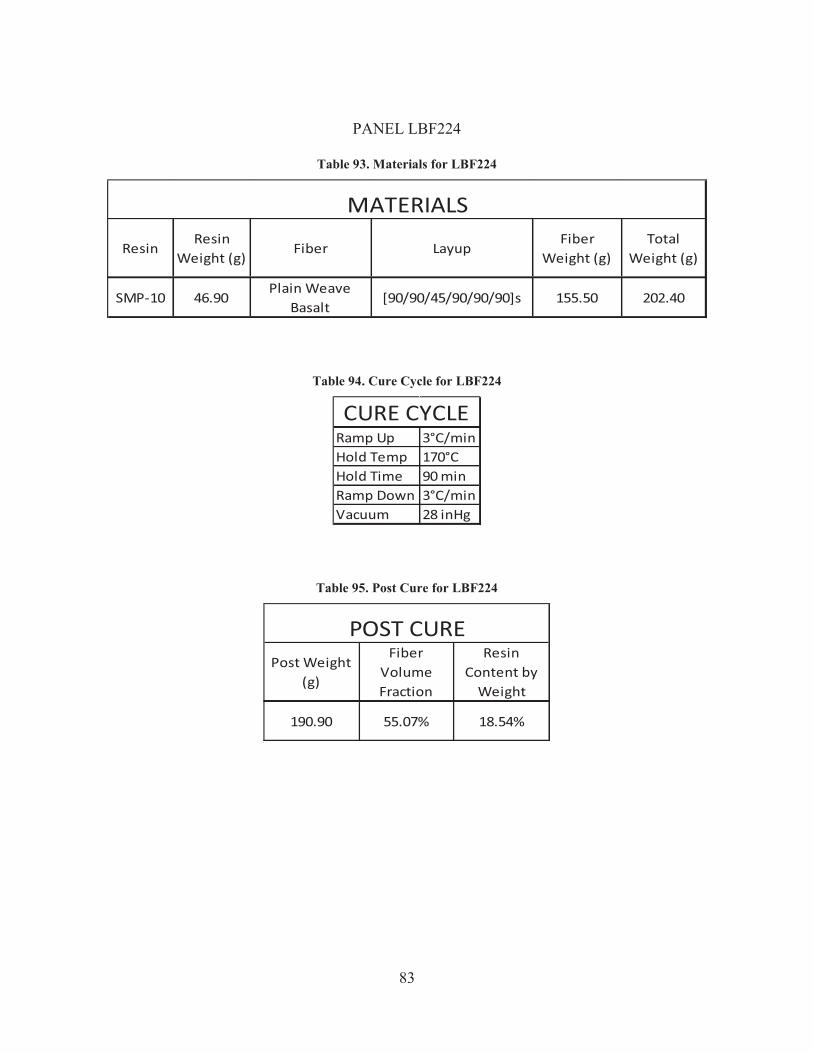
83
PANEL LBF224
Table 93. Materials for LBF224
ResinResin
Weight (g)Fiber Layup
Fiber Weight (g)
Total Weight (g)
SMP-10 46.90Plain Weave
Basalt[90/90/45/90/90/90]s 155.50 202.40
MATERIALS
Table 94. Cure Cycle for LBF224
Ramp Up 3°C/minHold Temp 170°CHold Time 90 minRamp Down 3°C/minVacuum 28 inHg
CURE CYCLE
Table 95. Post Cure for LBF224
Post Weight (g)
Fiber Volume Fraction
Resin Content by
Weight
190.90 55.07% 18.54%
POST CURE
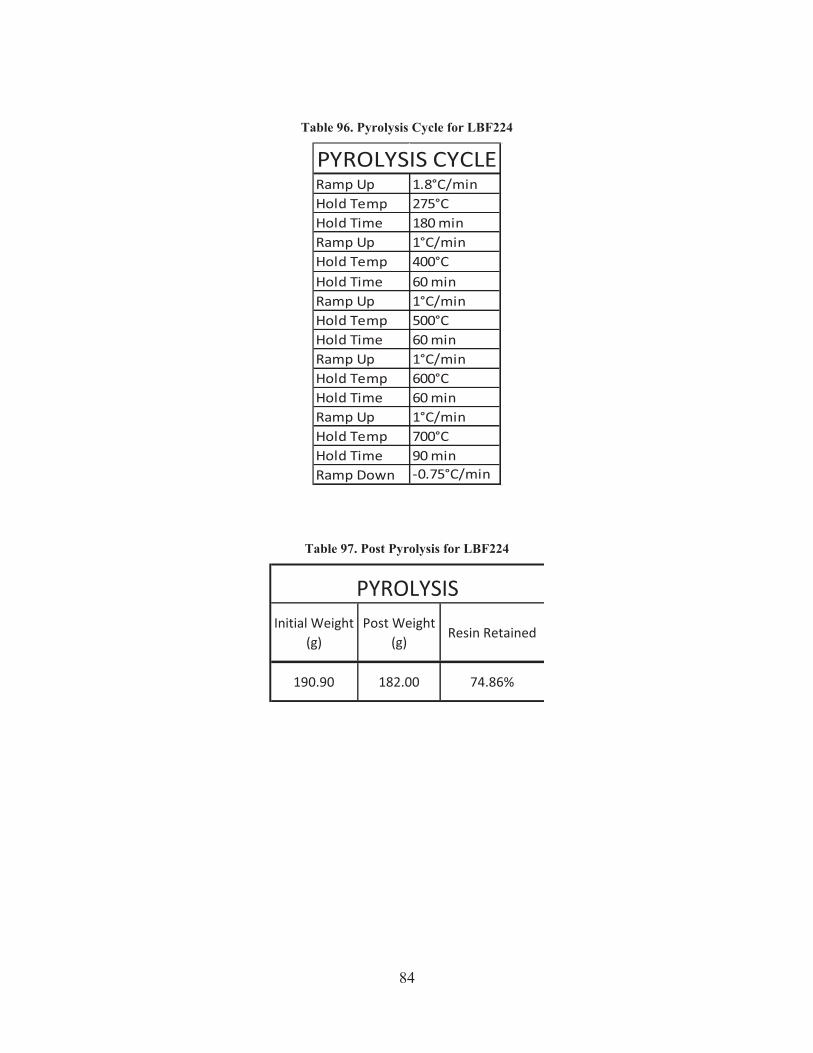
84
Table 96. Pyrolysis Cycle for LBF224
Ramp Up 1.8°C/minHold Temp 275°CHold Time 180 minRamp Up 1°C/minHold Temp 400°CHold Time 60 minRamp Up 1°C/minHold Temp 500°CHold Time 60 minRamp Up 1°C/minHold Temp 600°CHold Time 60 minRamp Up 1°C/minHold Temp 700°CHold Time 90 minRamp Down -0.75°C/min
PYROLYSIS CYCLE
Table 97. Post Pyrolysis for LBF224
Initial Weight (g)
Post Weight (g)
Resin Retained
190.90 182.00 74.86%
PYROLYSIS
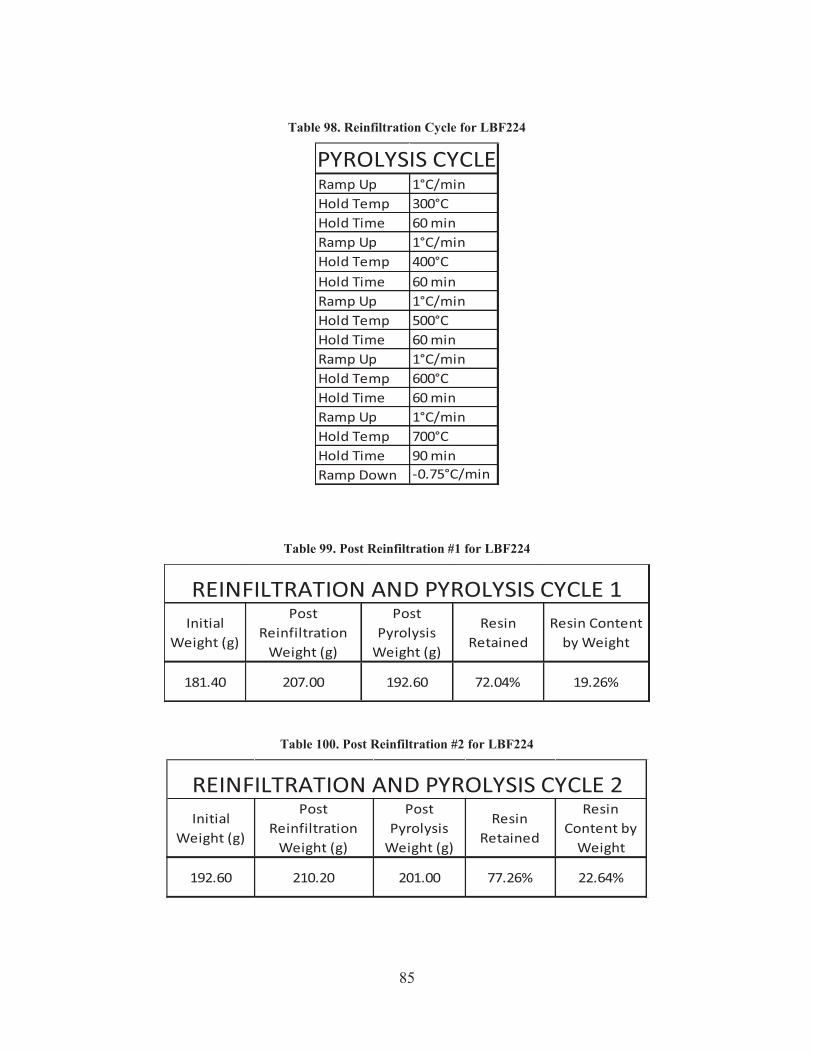
85
Table 98. Reinfiltration Cycle for LBF224
Ramp Up 1°C/minHold Temp 300°CHold Time 60 minRamp Up 1°C/minHold Temp 400°CHold Time 60 minRamp Up 1°C/minHold Temp 500°CHold Time 60 minRamp Up 1°C/minHold Temp 600°CHold Time 60 minRamp Up 1°C/minHold Temp 700°CHold Time 90 minRamp Down -0.75°C/min
PYROLYSIS CYCLE
Table 99. Post Reinfiltration #1 for LBF224
Initial Weight (g)
Post Reinfiltration
Weight (g)
Post Pyrolysis
Weight (g)
Resin Retained
Resin Content by Weight
181.40 207.00 192.60 72.04% 19.26%
REINFILTRATION AND PYROLYSIS CYCLE 1
Table 100. Post Reinfiltration #2 for LBF224
Initial Weight (g)
Post Reinfiltration
Weight (g)
Post Pyrolysis
Weight (g)
Resin Retained
Resin Content by
Weight
192.60 210.20 201.00 77.26% 22.64%
REINFILTRATION AND PYROLYSIS CYCLE 2

86
PANEL LBF225
Table 101. Materials for LBF225
ResinResin
Weight (g)Fiber Layup
Fiber Weight (g)
Total Weight (g)
SMP-10 49.20Plain Weave
Basalt [90/90/45/90/90/90]s 156.80 206.00
MATERIALS
Table 102. Cure Cycle for LBF225
Ramp Up 3°C/minHold Temp 170°CHold Time 90 minRamp Down 3°C/minVacuum 28 inHg
CURE CYCLE
Table 103. Post Cure for LBF225
Post Weight (g)
Fiber Volume Fraction
Resin Content (%)
190.50 54.09% 17.69%
POST CURE
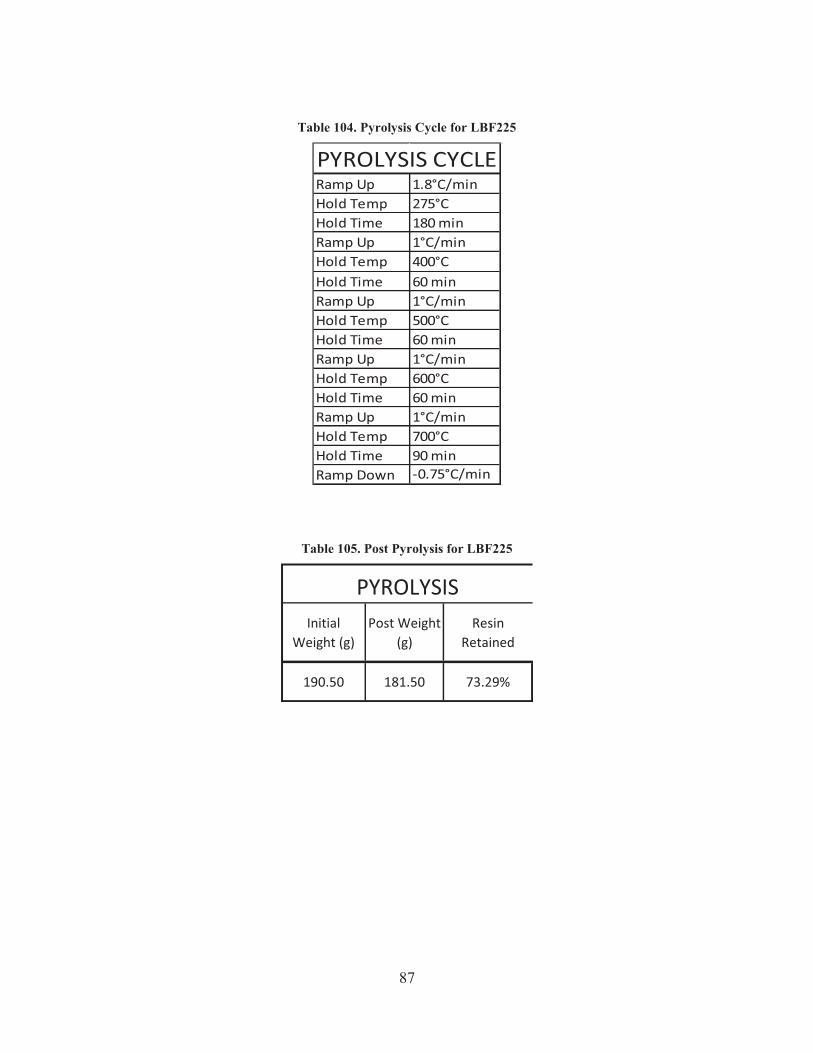
87
Table 104. Pyrolysis Cycle for LBF225
Ramp Up 1.8°C/minHold Temp 275°CHold Time 180 minRamp Up 1°C/minHold Temp 400°CHold Time 60 minRamp Up 1°C/minHold Temp 500°CHold Time 60 minRamp Up 1°C/minHold Temp 600°CHold Time 60 minRamp Up 1°C/minHold Temp 700°CHold Time 90 minRamp Down -0.75°C/min
PYROLYSIS CYCLE
Table 105. Post Pyrolysis for LBF225
Initial Weight (g)
Post Weight (g)
Resin Retained
190.50 181.50 73.29%
PYROLYSIS
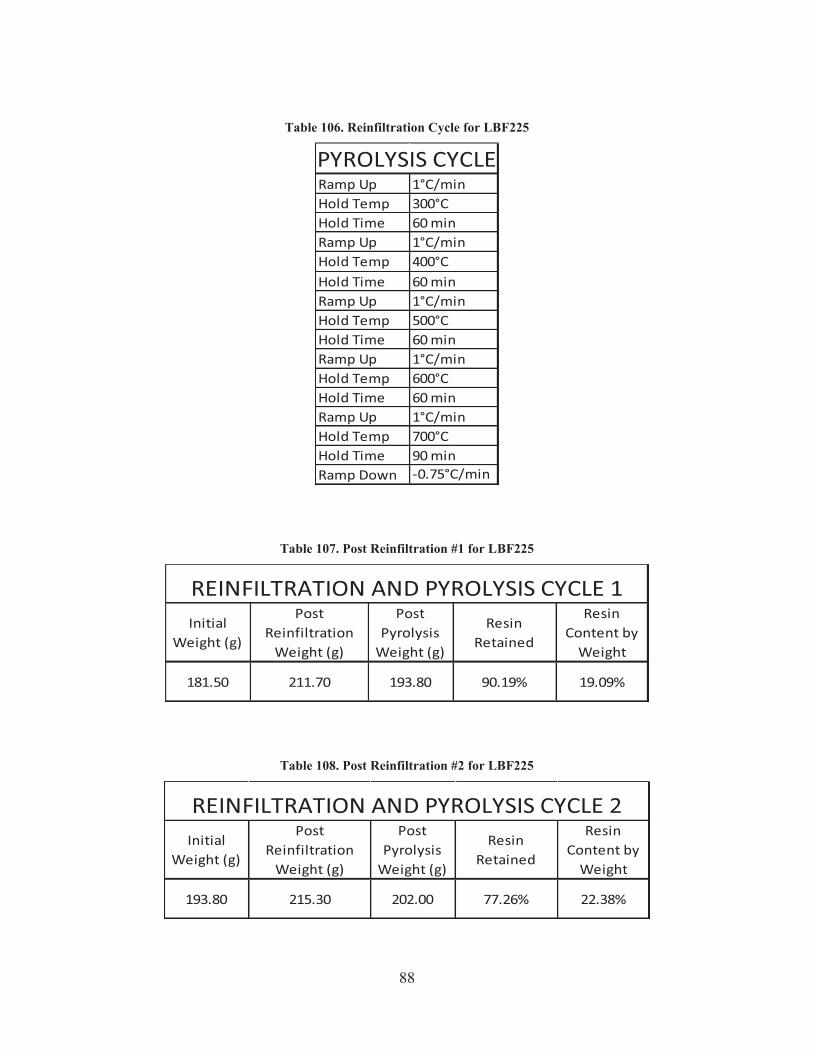
88
Table 106. Reinfiltration Cycle for LBF225
Ramp Up 1°C/minHold Temp 300°CHold Time 60 minRamp Up 1°C/minHold Temp 400°CHold Time 60 minRamp Up 1°C/minHold Temp 500°CHold Time 60 minRamp Up 1°C/minHold Temp 600°CHold Time 60 minRamp Up 1°C/minHold Temp 700°CHold Time 90 minRamp Down -0.75°C/min
PYROLYSIS CYCLE
Table 107. Post Reinfiltration #1 for LBF225
Initial Weight (g)
Post Reinfiltration
Weight (g)
Post Pyrolysis
Weight (g)
Resin Retained
Resin Content by
Weight
181.50 211.70 193.80 90.19% 19.09%
REINFILTRATION AND PYROLYSIS CYCLE 1
Table 108. Post Reinfiltration #2 for LBF225
Initial Weight (g)
Post Reinfiltration
Weight (g)
Post Pyrolysis
Weight (g)
Resin Retained
Resin Content by
Weight
193.80 215.30 202.00 77.26% 22.38%
REINFILTRATION AND PYROLYSIS CYCLE 2

89
APPENDIX B:COPYRIGHT LICENSE AGREEMENTS
90
91
92

93
94
95
96

97
98
REFERENCES
1. Calle, L., Hintze, P., Parlier, C., Sampson, J., Curran, J., Kolody, M., & Perusich, S. (2010).
Refractory materials for flame deflector protection. AIAA SPACE 2010 Conference and
Exposition,
2. Cerny, M., Glogar, P., Golias, V., Hruska, J., Jakes, P., Sucharda, Z., & Vavrova, I. (2007).
Comparison of mechanical properties and structural changes of continuous basalt and glass
fibres at elevated temperatures. CERAMICS-SILIKATY, 51(2), 82-88. Retrieved from
http://ezproxy.net.ucf.edu/login?url=http://search.ebscohost.com/login.aspx?direct=true&db
=edswsc&AN=000249498400003&site=eds-live&scope=site
3. Cerny, M., Halasova, M., Schwaigstillova, J., Chlup, Z., Sucharda, Z., Glogar, P., . . .
Ryglova, S. (2014). Mechanical properties of partially pyrolysed composites with plain
weave basalt fibre reinforcement. Ceramics International, 40(5), 7507-7521. Retrieved from
http://ezproxy.net.ucf.edu/login?url=http://search.ebscohost.com/login.aspx?direct=true&db
=edswsc&AN=000333488100141&site=eds-live&scope=site
4. Czigány, T. (2005). Discontinuous basalt fiber-reinforced hybrid composites. Polymer
Composites (9780387241760), , 309. Retrieved from
http://ezproxy.net.ucf.edu/login?url=http://search.ebscohost.com/login.aspx?direct=true&db
=edb&AN=76801963&site=eds-live&scope=site
5. Glogar, P., Sucharda, Z., Cerny, M., Puchegger, S., & Peterlik, H. (2007). Microstructure and
mechanical properties of heat resistant composites reinforced with basalt fibres.
CERAMICS-SILIKATY, 51(4), 190-197. Retrieved from
99
http://ezproxy.net.ucf.edu/login?url=http://search.ebscohost.com/login.aspx?direct=true&db
=edswsc&AN=000252181900002&site=eds-live&scope=site
6. Gumula, T., & Blazewicz, S. (2013). Thermal conversion of carbon fibres/polysiloxane
composites to carbon fibres/ceramic composites. Ceramics International, 39(4), 3795-3802.
doi:http://dx.doi.org/10.1016/j.ceramint.2012.10.219
7. Gumula, T., Paluszkiewicz, C., & Blazewicz, S. (2009). Study on thermal decomposition
processes of polysiloxane polymers—From polymer to nanosized silicon carbide. Journal of
Analytical and Applied Pyrolysis, 86(2), 375-380.
doi:http://dx.doi.org.ezproxy.net.ucf.edu/10.1016/j.jaap.2009.09.001
8. Hague, M. H., Upadhyaya, P., Roy, S., Ware, T., Voit, W., & Lu, H. B. (2014). The changes
in flexural properties and microstructures of carbon fiber bismaleimide composite after
exposure to a high temperature Retrieved from
http://ezproxy.net.ucf.edu/login?url=http://search.ebscohost.com/login.aspx?direct=true&db
=edswsc&AN=000329881500007&site=eds-live&scope=site
9. Ivanitskii, S. G., & Gorbachev, G. F. (2011). Continuous basalt fibers: Production aspects and
simulation of forming processes. I. state of the art in continuous basalt fiber technologies.
POWDER METALLURGY AND METAL CERAMICS, 50(3-4), 125-129. Retrieved from
http://ezproxy.net.ucf.edu/login?url=http://search.ebscohost.com/login.aspx?direct=true&db
=edswsc&AN=000293469700001&site=eds-live&scope=site
10. Landucci, G., Rossi, F., Nicolella, C., & Zanelli, S. (2009). Design and testing of innovative
materials for passive fire protection. Fire Safety Journal, (8), 1103.
doi:10.1016/j.firesaf.2009.08.004
100
11. Ly, H. Q., Taylor, R., & Day, R. J. (2001a). Conversion of polycarbosilane (PCS) to SiC-
based ceramic. part 1. characterisation of PCS and curing products. Journal of Materials
Science, 36(16), 4037-4043. Retrieved from
http://ezproxy.net.ucf.edu/login?url=http://search.ebscohost.com/login.aspx?direct=true&db
=asf&AN=500789299&site=eds-live&scope=site
12. Ly, H. Q., Taylor, R., & Day, R. J. (2001b). Conversion of polycarbosilane (PCS) to SiC-
based ceramic. part II. pyrolysis and characterisation. Journal of Materials Science, 36(16),
4045-4057. Retrieved from
http://ezproxy.net.ucf.edu/login?url=http://search.ebscohost.com/login.aspx?direct=true&db
=asf&AN=500789292&site=eds-live&scope=site
13. Ma, Y., & Chen, Z. H. (2013). Microstructures and properties of the C/zr-O-si-C composites
fabricated by polymer infiltration and pyrolysis. JOURNAL OF MATERIALS
ENGINEERING AND PERFORMANCE, 22(9), 2510-2514. Retrieved from
http://ezproxy.net.ucf.edu/login?url=http://search.ebscohost.com/login.aspx?direct=true&db
=edswsc&AN=000323425100010&site=eds-live&scope=site
14. Mangalgiri, P. (2005). Polymer-matrix composites for high-temperature applications.
Defence Science Journal, 55(2) Retrieved from
http://publications.drdo.gov.in/ojs/index.php/dsj/article/view/1980
15. Militky, J., & Kovacic, V. (2000). Ultimate mechanical properties of thermally exposed
basalt filament yarns. MOLECULAR CRYSTALS AND LIQUID CRYSTALS, 354, 643-650.
Retrieved from
101
http://ezproxy.net.ucf.edu/login?url=http://search.ebscohost.com/login.aspx?direct=true&db
=edswsc&AN=000168131800007&site=eds-live&scope=site
16. Naslain, R. (1999). Materials design and processing of high temperature ceramic matrix
composites: State of the art and future trends. ADVANCED COMPOSITE MATERIALS,
8(1), 3-16. Retrieved from
http://ezproxy.net.ucf.edu/login?url=http://search.ebscohost.com/login.aspx?direct=true&db
=edswsc&AN=000079219400002&site=eds-live&scope=site
17. Nicholas, J. L., Menta, V. G. A., Chandrashekhara, K., Watts, J., Lai, B., Hilmas, G., &
Fahrenholtz, W. (2012). Processing of continuous fiber reinforced ceramic composites for
ultra high termperature applications using polymer precursors. Society for the Advancement
of Materials Ad Process Engineering, Baltimore, MD.
18. Novitskii, A., & Efremov, M. (2011). Some aspects of the manufacturing process for
obtaining continuous basalt fiber. Glass & Ceramics, 67(11), 361-365. doi:10.1007/s10717-
011-9299-7
19. Novitskii, A. G., & Efremov, M. V. (2013). Technological aspects of the suitability of rocks
from different deposits for the production of continuous basalt fiber. GLASS AND
CERAMICS, 69(11-12), 409-412. Retrieved from
http://ezproxy.net.ucf.edu/login?url=http://search.ebscohost.com/login.aspx?direct=true&db
=edswsc&AN=000316764200013&site=eds-live&scope=site
20. Project morpheus. Retrieved, 2013, Retrieved from http://morpheuslander.jsc.nasa.gov/about/
21. Refractory concrete, specification for (1979). NASA.
102
22. Singha, K. (2012). A short review on basalt fiber. International Journal of Textile Science,
1(4), 19.
23. SWORDS: Soldier-warfighter operationally responsive deployer for space. Retrieved, 2013,
Retrieved from http://www.smdc.army.mil/FactSheets/SWORDS.pdf
24. System failure case studies: Hit the bricks. (2010). Retrieved, 2013, Retrieved from
http://nsc.nasa.gov/SFCS/Index/SortByDate/Descending/Page3
25. Torrey, J. D., Bordia, R. K., Henager, J.,Charles H., Blum, Y., Shin, Y., & Samuels, W. D.
(2006). Composite polymer derived ceramic system for oxidizing environments. Journal of
Materials Science, 41(14), 4617-4622. doi:10.1007/s10853-006-0242-1
26. von Eckroth, W., Struchen, L., Trovillion, T., Perez, R., Nerolich, S., & Parlier, C. (2012).
Space shuttle solid rocket motor plume pressure and heat rate measurements. 28th
Aerodynamic Measurement Technology, Ground Testing, and Flight Testing Conference,
New Orleans, LA. doi:10.2514/6.2012-3293
27. YAJIMA, S., SHISHIDO, T., KAYANO, H., OKAMURA, K., OMORI, M., & HAYASHI,
J. (1976). SiC sintered bodies with three-dimensional polycarbosilane as binder. Nature,
264(5583), 238. Retrieved from
http://ezproxy.net.ucf.edu/login?url=http://search.ebscohost.com/login.aspx?direct=true&db
=edb&AN=61731814&site=eds-live&scope=site
28. Ying, S., & Zhou, X. (2013). Chemical and thermal resistance of basalt fiber in inclement
environments. Journal of Wuhan University of Technology (Material Science Edition), (3),
560. Retrieved from
103
http://ezproxy.net.ucf.edu/login?url=http://search.ebscohost.com/login.aspx?direct=true&db
=edsgao&AN=edsgcl.331993671&site=eds-live&scope=site
29. Zheng, G. B., Sano, H., Suzuki, K., Kobayashi, K., Uchiyama, Y., & Cheng, H. M. (1999). A
TEM study of microstructure of carbon fiber/polycarbosilane-derived SiC composites.
CARBON, 37(12), 2057-2062. Retrieved from
http://ezproxy.net.ucf.edu/login?url=http://search.ebscohost.com/login.aspx?direct=true&db
=edswsc&AN=000083985000022&site=eds-live&scope=site


