
Private placements and investor
involvement
Examining the short-term abnormal returns to equity private
placements depending on the investor’s involvement in the
issuing company
Master Thesis (15 ECTS) M.Sc. Corporate & Financial Management
School of Economics & Management
Lund University
Lund, May 2015
Authors: Supervisor: Camilla Into (860310-5902) Håkan Jankensgård
Magdalena Treyer (901012-T268)

i
ABSTRACT
Title: Private placements and investor involvement
Date: 2015-05-27
Course: BUSN 89 - Degree Project in Corporate and Financial
Management – Master Level, 15 ECTS
Authors: Camilla Into & Magdalena Treyer
Supervisor: Håkan Jankensgård
Key words: Private placement, short-term abnormal return, discount, information
asymmetry, information hypothesis, agency theory, monitoring hypothesis,
managerial entrenchment hypothesis
Purpose: The purpose of this study is to investigate if there is a difference in the
short-term announcement effects of equity private placements depending on
the relationship of the investor with the issuing firms in terms of
information asymmetry and agency conflicts.
Methodology: An event study is conducted to study if there are abnormal returns. The
abnormal returns will be used as the dependent variable in a regression
which allows us to include more variables of interest.
Theoretical Information asymmetry, information hypothesis, agency theory, monitoring
perspective: hypothesis, managerial entrenchment hypothesis, signalling theory,
convergence-of-interest
Empirical 59 Private placements issued in Sweden between 2009-2014 by listed firms.
foundation:
Conclusion: We come to the conclusion that the investor type in a private placement has
an effect on how the market reacts to the announcement of this issue. The
announcement of an insider buyer results in a low positive abnormal return.
There is weak support in our study that active buyers get the highest
abnormal returns. The market reactions are therefore best supported by the
managerial entrenchment hypothesis whereas the information and
monitoring hypotheses gain weak support.

ii
ACKNOWLEDGMENTS
The authors would like to thank their supervisor Håkan Jankensgård for the professional
support and helpful comments throughout the process of writing this thesis. The advice the
authors received were always highly useful and straightforward. The authors would also like
to thank everybody who was involved in the process and increased the quality of this thesis,
especially all the wonderful people in Alpha.

iii
TABLE OF CONTENTS
1. INTRODUCTION ............................................................................................................. 1
1.1. BACKGROUND ......................................................................................................... 1
1.2. PROBLEM DISCUSSION .......................................................................................... 2
1.3. PURPOSE AND RESEARCH QUESTION ............................................................... 2
1.4. LIMITATIONS ........................................................................................................... 3
1.5. OUTLINE .................................................................................................................... 3
2. THEORETICAL FRAMEWORK .................................................................................. 5
2.1. SEO MOTIVATIONS & ISSUE TYPES ................................................................... 5
2.1.1. Rights issue .......................................................................................................... 5
2.1.2. Public offering ...................................................................................................... 6
2.1.3. Private placement ................................................................................................. 6
2.2. PRIVATE PLACEMENT MOTIVATIONS ............................................................... 6
2.2.1. Information asymmetry ........................................................................................ 7
2.2.1.1. Signaling theory ................................................................................................. 7
2.2.1.2. Information hypothesis ....................................................................................... 7
2.2.2. Agency theory ...................................................................................................... 8
2.2.2.1. Monitoring hypothesis ........................................................................................ 8
2.2.2.2. Managerial entrenchment hypothesis ................................................................. 9
2.3. EMPIRICAL IMPLICATIONS ................................................................................ 10
3. EMPIRICAL FINDINGS OF ABNORMAL RETURNS ........................................... 11
3.1. SEASONED EQUITY OFFERINGS ........................................................................ 11
3.2. PRIVATE PLACEMENTS ....................................................................................... 11
3.3. PRIVATE PLACEMENT BUYERS ......................................................................... 12
3.3.1. Insider buyer ....................................................................................................... 12
3.3.2. Active buyer ....................................................................................................... 13
3.3.3. Passive buyer ...................................................................................................... 13
3.3.4. Mixed buyer ....................................................................................................... 14
3.4. DEVELOPMENT OF HYPOTHESES ..................................................................... 14

iv
4. METHODOLOGY ......................................................................................................... 16
4.1. RESEARCH APPROACH ........................................................................................ 16
4.2. RESEARCH DESIGN ............................................................................................... 16
4.3. LITERATURE STUDY ............................................................................................ 17
4.4. DATA COLLECTION .............................................................................................. 17
4.4.1. Data selection criteria ......................................................................................... 17
4.4.2. Categorization of the buyer type ........................................................................ 19
4.5. EVENT STUDY ........................................................................................................ 20
4.5.1. Normal return models ......................................................................................... 20
4.5.2. Market model ..................................................................................................... 21
4.5.3. Event and estimation window ............................................................................ 22
4.5.4. Abnormal returns ................................................................................................ 23
4.6. CROSS-SECTIONAL REGRESSION ..................................................................... 25
4.6.1. Description of regression variables .................................................................... 25
4.6.1.1. Dependent variable ........................................................................................... 26
4.6.1.2. Independent variables ....................................................................................... 27
4.7. VALIDITY & RELIABILITY .................................................................................. 28
4.7.1. Validity ............................................................................................................... 28
4.7.1.1. Internal validity ................................................................................................ 29
4.7.1.2. External validity ............................................................................................... 29
4.7.2. Reliability ........................................................................................................... 30
5. EMPIRICAL RESULTS ................................................................................................ 31
5.1. EVENT STUDY RESULTS ..................................................................................... 31
5.1.1. Abnormal returns for total sample...................................................................... 31
5.1.2. Categorization per buyer group .......................................................................... 32
5.2. DISCOUNTS AND PREMIUMS ............................................................................. 34
5.2.1. Pricing of total sample ........................................................................................ 34
5.2.2. Differences between market places .................................................................... 34
5.3. ADJUSTMENTS OF ABNORMAL RETURNS ...................................................... 35
5.3.1. Adjustment for discounts ................................................................................... 35
5.3.2. Adjustment for outliers ....................................................................................... 36
5.4. DESCRIPTIVE STATISTICS AND TESTS OF REGRESSION VARIABLES ..... 36
5.4.1. Normality test ..................................................................................................... 36
5.4.2. Multicollinearity test .......................................................................................... 37

v
5.5. REGRESSION RESULTS ........................................................................................ 38
5.5.1. Initial regression output ...................................................................................... 38
5.5.2. Heteroskedasticity test ........................................................................................ 39
5.5.3. Regression robustness tests ................................................................................ 40
5.5.3.1. Excluding financial industry ............................................................................ 41
5.5.3.2. Excluding multiple SEO announcements ......................................................... 41
5.5.3.3. Including outliers .............................................................................................. 41
5.5.3.4. Excluding mixed buyers ................................................................................... 41
5.5.3.5. Change of the base group ................................................................................. 42
5.5.3.6. Other event window as dependent variable ...................................................... 42
5.5.4. Regression for all significant event windows .................................................... 42
6. ANALYSIS AND DISCUSSION ................................................................................... 44
6.1. ABNORMAL RETURNS ......................................................................................... 44
6.1.1. Event study results for total sample ................................................................... 44
6.1.2. Private placement buyers ................................................................................... 45
6.2. DISCOUNTS AND PREMIUMS ............................................................................. 46
6.3. INTERPRETATION OF REGRESSION RESULTS ............................................... 46
6.3.1. Insider buyers show the lowest abnormal returns .............................................. 46
6.3.2. Active buyers have insignificant results ............................................................. 47
7. CONCLUSION ............................................................................................................... 49
7.1. RESEARCH AIM AND RESEARCH OBJECTIVES ............................................. 49
7.2. FURTHER RESEARCH ........................................................................................... 50
REFERENCES ....................................................................................................................... 51
APPENDICES ........................................................................................................................ 55
Appendix A: Seasoned Equity Offerings in Sweden 2008-2014 per issue type .................. 55
Appendix B: Detailed data about the gathered private placements 2009-2014 ................... 56
Appendix C: Abnormal return calculations .......................................................................... 58
Appendix D: Market model compared to market adjusted model ........................................ 59
Appendix E: Aggregated abnormal returns per buyer and day ............................................ 59
Appendix G: Calculation of Abnormal Returns adjusted for discounts ............................... 61
Appendix H: Excluded outliers ............................................................................................ 62
Appendix I: Correcting standard errors to mitigate heteroskedasticity ................................ 63

vi
LIST OF TABLES
Table 1: Empirical implications of abnormal returns predicted by the theory ........................ 10
Table 2: Cumulative abnormal returns for private placements in US & Sweden ................... 11
Table 3: Private equity placements per buyer in Sweden between 2009 and 2014 ................ 20
Table 4: Cumulative abnormal returns (CAR) for different event windows .......................... 32
Table 5: CAR per buyer over event window: ±1 day .............................................................. 33
Table 6: Discounts and premiums per buyer ........................................................................... 34
Table 7: CARadj for discounts and premiums over the event window: ±1 day ....................... 35
Table 8: CARadj after adjustment for outliers over the event window: ±1 day ....................... 36
Table 9: Descriptive statistics of the main regression variables ............................................. 37
Table 10: Correlation matrix ................................................................................................... 38
Table 11: Regression of abnormal returns for private placements in Sweden 2009-2014 ...... 39
Table 12: Heteroskedasity Test (White Test) .......................................................................... 39
Table 13: Regression of abnormal returns for private placements in Sweden 2009-2014 ...... 40
Table 14: Cumulative abnormal returns for two new event windows .................................... 42
Table 15: Cumulative abnormal returns for two new event windows ..................................... 43
Table 16: Comparing our results to previous findings of short-term AR ............................... 44
Table 17: CAR after adjustment for outliers over the event window: ±1 day ........................ 45
LIST OF FIGURES
Figure 1: Equity issue activities in Sweden between 2008 and 2014 ..................................... 18
Figure 2: Mean CAR as a function of event windows ............................................................ 31
Figure 3: Abnormal returns aggregated per event day ............................................................ 33
Figure 4: Discount and premium per market .......................................................................... 35

1
1. INTRODUCTION
This first chapter introduces the topic by explaining the background of the problem this study
is based on. A detailed problem discussion and the identification of the research gap follows
leading to the specific purpose and research question established for this study. A short
overview of the limitations that set the frames for the data collection follows before ending
this chapter with an outline, guiding the reader through the report.
1.1. BACKGROUND
In this thesis the short-term market reaction to equity private placement will be examined.
Private placement is a sub-category to Seasoned Equity Offerings (SEO). Private placements
are defined as equity issues which target only a small group of current or new shareholders of
a public firm (Molin, 1996; Cronqvist & Nilsson, 2003). According to many studies the
announcement of SEOs generates a negative stock price movement (Asquith & Mullins, 1986;
Masulis & Korwar, 1986; Smith, 1986; Kim & Purnanandam, 2006). However, private
placements generate a positive stock price effect as investigated by Wruck (1989) and Hertzel
and Smith (1993). It is interesting that a sub-category of SEOs result in a different market
reaction than SEOs in general. The positive effect to private placements is captivating because
one would expect that the market reacts negatively to dilution effects and discounts to private
placement issues. The research community explains the positive market reaction to private
placements mainly with two hypotheses: the information hypothesis and the monitoring
hypothesis.
The information hypothesis is originated from Myers and Majluf’s (1984) adverse selection
model suggesting that management has superior information about the true value of a firm.
Under the assumption that insiders know more, they can conceivably make decisions for their
advantage such as issuing overvalued securities leading to a negative stock price reaction to
SEOs. Myers and Majluf’s (1984) hypothesis is later extended by Hertzel and Smith (1993) in
the private placement context to the information hypothesis. They add that private placements
help to communicate some of management’s private information. When a well-informed
investor is willing to commit funds, it sends a positive signal to the market (Hertzel & Smith,
1993). Wruck (1989) argues in the monitoring hypothesis, that private placement buyers
monitor the management leading to reduced agency conflicts. When a private placement is
purchased by an active investor, who is both willing and able to monitor management in order
to make sure that the companies’ resources are used more efficiently, a positive market
reaction is generated (Wruck, 1989).

2
1.2. PROBLEM DISCUSSION
While the information hypothesis and the monitoring hypothesis are extensively investigated
in the private placement context, Barclay et al. (2007) introduce an alternative hypothesis, the
managerial entrenchment hypothesis. This hypothesis contrasts the two others in terms of
market reactions to private placements since it states that the market reaction could be
negative. According to the managerial entrenchment hypothesis, the management favors
investors who do not want to get actively involved, allowing managers to solidify their
control. As a result, the existing non-participating shareholders might be disadvantaged since
the increased monitoring as argued in the monitoring hypothesis will not be realized (Barclay
et al., 2007). The managerial entrenchment hypothesis introduces that the relationship the
buyer has with the issuing company, could explain the different market reactions of private
placements. As already mentioned, the monitoring hypothesis assumes that an actively
involved buyer should generate a positive reaction. In contrast, the managerial entrenchment
hypothesis predicts a negative market reaction. Considering this, the relevant question is how
the private placement investor’s relationship with the issuing company impacts the market
reactions (Wruck, 1989; Barclay et al., 2007).
1.3. PURPOSE AND RESEARCH QUESTION
The research on the private placement buyer’s relationship with the issuing company and its
respective market reaction is limited so far. Barclay et al.’s (2007) study conducted for the US
is one reference study in this research field. To our knowledge, only one study has been
likewise done for Sweden. However, this study only investigates the insider’s relationship
with the issuing company and its impact on the market reaction (Molin, 1996). Barclay et al.’s
(2007) study is based on US companies which usually have a low initial ownership
concentration. In contrast to this study, Sweden has different institutional characteristics. In
Sweden, the average initial ownership concentration is very high as stated by Molin (1996).
The underlying assumption for the monitoring hypothesis is that the ownership concentration
increases because of private placements. Since the initial ownership concentration is already
high in Sweden, private placements will lead to a decreased ownership concentration (Molin,
1996). By considering the different market dynamics in the US and Sweden, it is interesting to
investigate if Barclay et al.’s (2007) findings can explain the market reaction for a setting with
initial high ownership concentration. This study will therefore investigate how the
relationship of the private placement investors with the issuing company affects the short-
term market reactions in Sweden. The information, monitoring and managerial entrenchment

3
hypotheses will be tested for the different buyer groups of a private placement in the Swedish
market environment. To our knowledge, no study has been done so far investigating this
topic. The findings of this study will therefore contribute to the existing research by
answering the following research question:
Is there a difference in the short-term announcement effects of equity private
placements depending on the investor’s involvement with the issuing firms in terms of
information asymmetry and agency conflicts?
In order to investigate this research question, we are going to do an event study followed up
by a regression which allows us to include more variables of interest.
1.4. LIMITATIONS
Since this study only investigates the equity private placements in Sweden, the number of
events is limited but it is estimated by us to be sufficient. In order to get a large enough
sample, both regulated and unregulated markets are included. By including several market
places, a larger variety of companies will be included. The time range covers one business
cycle namely 2008 to 2014. The start of the current business cycle is defined by Bergman
(2011) to begin in 2008, measured as the classical cycle top-to-top. It is not investigated how
the abnormal returns develop over time since this study investigates the short-term effects.
The reason for this is that we want to have the most recent data and a large enough sample.
By investigating long term-effects, too many private placements would have been excluded.
1.5. OUTLINE
The thesis is divided into seven main sections: Introduction, theoretical framework, empirical
findings on abnormal returns, methodology, empirical results, analysis and discussion and a
conclusion. The first chapter, the introduction, describes the background of the study, the
problem discussion and what the purpose of the study is. The second chapter, the theoretical
framework section introduces the SEO topic and presents the main aspects of information
asymmetry and agency theory related to private placements. The third chapter on the
empirical findings of abnormal returns of private placements and in particularly the different
private placement buyers completes the theoretical framework. As a result, this serves as a
basis for the development of the research hypotheses for this study. The fourth chapter, the
methodology, contains the scientific methodological approaches that have been applied.
Besides that, the data collection process, the event study methodology and the OLS regression

4
are presented. The fifth chapter, the empirical results chapter points out the results from the
conducted descriptive tests, the event study and the OLS regression with a broad discussion.
In the sixth chapter, the analysis and discussion chapter, the empirical results are set in a
context in order to interpret the findings in a critical way. The purpose of the section is to
answer the research question by referring to the theory and the empirical outcomes. The thesis
finishes up with a concluding discussion to summarize what has emerged in the analysis and
ends with suggestions for further research.

5
2. THEORETICAL FRAMEWORK
This chapter aims to present the relevant theories starting with a short overview of Seasoned
Equity Offerings (SEO). The main focus is however on the equity private placements, the SEO
issue type of interest. The respective theories of both the information asymmetry theory and
the agency theory explaining the announcement effects to private placements will be likewise
presented. Finally, an overview on the empirical implications the theories are suggesting is
given.
2.1. SEO MOTIVATIONS & ISSUE TYPES
A company which is already listed on the stock exchange can raise supplementary capital by
issuing additional shares through Seasoned Equity Offerings (SEO). The academic literature
provides various issue motives for raising additional capital associated with the different SEO
issue types. SEOs address different investors and can therefore be classified into three issue
types: rights issues, public issues and private placements (Molin, 1996). These three different
issue types and its respective issue motives will be presented in the following sections.
2.1.1. Rights issue
There is a commonly accepted and used definition of rights issues among the research
community. In rights issues, existing shareholders get the right or warrant to purchase new
shares on a pro rata basis (Eckbo & Masulis, 1995; Molin, 1996; Cronqvist & Nilsson, 2005;
Gao & Ritter, 2007). Thus, current shareholders can maintain their equity stake without
sustaining damage from dilution. Sometimes, investors are allowed to sell their pro rata rights
if they do not want to make use of it (Hillier & Ross, 2013). According to the information
asymmetry theory, managers conduct rights issues since they consider the firm to be
overvalued and take advantage of this over-valuation (Modigliani & Miller, 1958; Eckbo &
Masulis, 1992, Kim & Weisbach, 2008).
The predominating SEO issue types on the Stockholm Stock Exchange are rights issues and
private placements (Molin, 1996). This is supported by a more recent paper of Cronqvist and
Nilsson (2003) and Bortoletti et al. (2008) who argue that SEOs are particularly conducted as
rights offerings or private placements for stock markets outside the USA. In Sweden for
instance the precedence right for current shareholders has traditionally had a strong position in
the law and is still used in the majority of the SEOs (Skog, 2004).

6
2.1.2. Public offering
Public offerings, also known as public issues, are offerings to the investment public (Nasdaq,
2015). Since shares are not only sold to existing shareholders but also to new investors, this
offering type leads to dilution. As far as the reasons for this issue type are concerned, Lee and
Kocher (2001) state that public issues are done because of overvaluation. This is consistent
with Myers and Majluf (1984) pointing out that managers might have incentives to sell
overvalued securities because they want the existing shareholders to benefit at the expense of
new shareholders.
Since public issue is the most commonly used issue type in the US, the research is extensive
compared to Europe where private placements and rights issues are mainly used for protecting
shareholders as it is the case for Sweden. Hence, public offerings are rarely used for SEOs on
the Stockholm Stock Exchange. (Molin, 1996)
2.1.3. Private placement
Private placements target only a small group of current or new shareholders. That is why
managers can significantly influence the ownership structure according to their preferences.
(Molin, 1996; Cronqvist & Nilsson, 2003) Furthermore, it is assumed that smaller firms have
higher information asymmetry than bigger companies and therefore are more likely to issue
private placements (Wruck, 1989; Wu, 2004). Since private placement issues lead to dilution
effects for existing shareholders, the board of directors and the shareholders have to approve
the private placement issue in Sweden (Molin, 1996). The predominating issue types on the
Stockholm Stock Exchange are either rights issues or private placements (Molin, 1996). This
is supported by Cronqvist and Nilsson (2003) stating that SEOs are particularly conducted as
rights offerings or private placements for stock markets outside the US. In the next section,
the explicit motivations for private placements are explained extensively since this study only
focuses on private placements.
2.2. PRIVATE PLACEMENT MOTIVATIONS
The main theoretical motivations explaining private placements, information asymmetry and
agency theory, will be described in the following section. The information asymmetry section
will focus on the different levels of information available to investors. The agency theory
section concentrates on the investor’s ability and willingness to monitor the management of
the issuing firm.
7
2.2.1. Information asymmetry
Information asymmetry is one of the most important reasons for announcement effects
besides agency theory according to the research community explaining an extensive corporate
finance literature on this topic (Harjoto & Garen, 2003). In the following sections,
information asymmetry as an explanation for the announcement effect to private placements
is divided into two parts, signaling theory and information hypothesis.
2.2.1.1. Signaling theory
Leland and Pyle (1977) argue in their famous signaling model that positive signs of firm value
are transferred to the market if insiders increase their equity stake in a firm. Since they base
their model on all kind of equity issues and do not concentrate on private placements, their
model has to be considered cautiously in the private placement context. In addition, recent
studies challenge Leland and Pyle’s (1977) signaling theory in general. Hull et al. (2010)
cannot confirm Leland and Pyle’s signaling model when investigating in particularly short-
term abnormal returns to SEOs. They argue that the market reaction does not always depend
on the level of insider ownership (Hull et al., 2010). Again, since Hull et al. (2010) investigate
all SEO issue types, their findings have to be considered cautiously in the private placement
context. However, Molin (1996) who particularly investigates private placements in Sweden,
challenges the signaling model as well. He finds out that equity issues are not used as
signaling devices since he does not find any significant announcement effect of private
placements which are used for financing new projects. However, there is a large positive
abnormal return if the private placement proceeds are used for financial restructuring. The
signaling effect explaining positive abnormal returns to private placements are therefore not
as sophisticated as believed. (Molin, 1996) Hertzel and Smith (1993), have a greater focus on
private placements with regards to information asymmetry. In the next section their
information hypothesis will be presented.
2.2.1.2. Information hypothesis
According to the information hypothesis developed by Hertzel and Smith (1993), private
placements help to solve some of the information asymmetry about firm value between
insiders and external investors. They explain this by extending Myers and Majluf’s (1984)
adverse selection model that management has superior knowledge about a company’s true
value compared to an external investor. Private placement investors can access at some cost
the management’s superior knowledge about firm value while negotiating with the

8
management team. In case a well-informed investor invests in a company through a private
placement, the market considers this as a sign of undervaluation and it results in positive
abnormal returns. (Hertzel & Smith, 1993) Private placements which are used as a source for
external capital by well-informed managers also transfer a positive sign to the market because
it can be assumed that a firm has favorable prospects due to investments financed through a
capital increase (Hertzel & Smith, 1993; Lee & Kocher, 2001). However, Barclay et al.
(2007) challenge the information hypothesis by stating that the information hypothesis
together with the monitoring hypothesis only motivate a minority of the positive market
reactions to private placements. They argue that managerial entrenchment is more important
for motivating private placements than commonly believed (Barclay, et al., 2007).
2.2.2. Agency theory
In the following sections, agency theory further explains why firms issue private placements.
Several researchers argue that private placements align interests between managers and
shareholders (Wruck, 1989; Molin, 1996; Barclay et al., 2007). The presented theory
hypotheses are the monitoring hypothesis and the managerial entrenchment hypothesis.
2.2.2.1. Monitoring hypothesis
Wruck (1989) introduces the monitoring hypothesis in the private placement context stating
that investors who buy private placements are both willing and competent to monitor
management. Wruck assumes that these investors often purchase a significant equity stake
giving them access to the firm’s board. Thus, management can be monitored closely ensuring
to some extent that resources are used efficiently. This in turn can lead to an increase in firm
value. Assuming that agency costs are reduced, the market reacts with positive stock prices.
Hence, shareholder’s wealth is increased meaning that current shareholders are not penalized.
(Wruck, 1989)
In contrast, the positive effect of the monitoring hypothesis is not been confirmed by Lee and
Kocher (2001). They investigate that firms issuing private placements have lower free cash
flows and higher managerial ownership than firms issuing public offerings. Considering that,
agency problems between managers and shareholders might therefore not be aligned. (Lee &
Kocher, 2001)

9
2.2.2.2. Managerial entrenchment hypothesis
Dann and DeAngelo (1988) and Wruck (1989) were among the first researchers explaining
managerial entrenchment as a reason for issuing private placements and how this could lead
to negative abnormal returns. Dann and DeAngelo (1988) consider private placements as a
manager’s means for avoiding takeovers. As a result, existing shareholders do not have the
chance to benefit from favorable takeover bids. Wruck (1989) relates managerial
entrenchment more to the general fact of ownership concentration. Negative abnormal returns
are generated through the fact that an investor gains a controlling ownership position or for
middle range ownership stakes (Wruck, 1989).
Molin (1996) develops the managerial entrenchment hypothesis further and argues that
solidified management control is linked to “insider opportunism”. The opportunism is arising
from self-serving private placement deals done by large existing shareholders or management.
Since private placements only address a few investors, the existing non-participating
shareholders may be disadvantaged concerning the pricing of the issue. This could lead to a
wealth transfer from existing shareholders to new shareholders resulting in negative market
reactions. Barclay et al. (2007) confirm Molin (1996) and add that the issuing firm’s
managers choose investors who do not aim to be actively involved in the company. As a
result, the management can solidify their control which might not be positive for existing non-
participating shareholders leading to a negative market reaction (Barclay et al., 2007).
In contrast to the managerial entrenchment hypothesis, which is associated with negative
market returns, the convergence-of-interest hypothesis by Jensen and Meckling (1976) equity
issues predicts positive market reactions. This is because an increase in the ownership
concentration of insiders results in aligned interests between managers and shareholders.
(Jensen & Meckling, 1976) It is important to mention that conclusions from this study have to
be drawn cautiously since this study does not only relate to private placements but all SEOs.
After having presented the relevant theories related to information asymmetry and agency
theory, the next section summarizes their predicted announcement effect to private
placements.

10
2.3. EMPIRICAL IMPLICATIONS
The following table gives an overview of the previously presented theories and hypotheses
and predicts the positive or negative market reaction to the announcement of private
placements.
Table 1: Empirical implications of abnormal returns predicted by the theory
After this overview on the abnormal returns predicted by the theory, the exact empirical
findings of abnormal returns to private placements are presented and discussed in the
following chapter.
Hypotheses & mechanisms
INFORMATION ASYMMETRY
Signaling theory
Leland & Pyle, 1977
Molin, 1996
Hull et al., 2010
Information hypothesis
Hertzel & Smith, 1993
Lee & Kocher, 2001
AGENCY THEORY
Monitoring hypothesis
Wruck, 1989
Lee & Kocher, 2001
Managerial entrenchment hypothesis
Jensen & Meckling, 1976
Dann & DeAngelo, 1988
Wruck, 1989
Molin, 1996
Barclay et al., 2007
Positive Negative

11
3. EMPIRICAL FINDINGS OF ABNORMAL RETURNS
After having presented the most important theories related to private placements and their
prediction on the abnormal returns, this chapter focuses on the exact empirical findings on
the short-term abnormal returns to private placements. At the end of this chapter, the
research hypotheses of this study will be presented. They are developed by combining both the
theoretical framework and the empirical findings of abnormal returns.
3.1. SEASONED EQUITY OFFERINGS
Before focusing on the empirical findings for private placement, the empirical evidence for
Seasoned Equity Offerings in general is shortly presented. The announcement effects of SEOs
from publicly traded firms have been thoroughly investigated in the USA with an overall
agreement on a negative market reaction. Asquith and Mullins (1986) were among the first
researchers examining the announcement effects of SEOs from 1963 to 1981 and detect an
average stock price decrease of 2% to 3% at the SEO announcement date. Both Masulis and
Korwar (1986) and Eckbo and Masulis (1992) confirm an average equity price decrease of
around 3% for the time range 1963-1981. These studies mostly focus on public issues since
this has been and still is the most dominating issue type in the USA (Molin, 1996).
3.2. PRIVATE PLACEMENTS
Despite dilution effects of private placements and large discounts, private placements in
general generate a positive short-term stock price effect investigated by Wruck (1989),
Hertzel and Smith (1993) and Barclay et al. (2007) for the US and Molin (1996) and Nilsson
and Cronqvist (2005) for Sweden as shown in table 2. The results of these studies are
statistically significant, however small in magnitude.
Table 2: Cumulative abnormal returns for private placements in US & Sweden
The significance level is divided into three levels: * -10% level; ** -5% level; *** -1% level.
As already shown in chapter 2, the research community explains these positive stock reactions
with information asymmetry and agency theory. In addition, several researchers such as
Wruck (1989) and Barclay et al. (2007) have proven that the stock price reactions depend on
Authors Market Sample period Sample size CAR (-3,0) CAR (-1,1) CAR (-1,0)
Wruck (1989) US 1979-1985 99 4,5%** - 1,9%*
Hertzel & Smith (1993) US 1980-1987 106 1,7%** - -
Molin (1996) Sweden 1986-1994 76 - 3,2%*** -
Cronqvist & Nilsson (2005) Sweden 1986-1999 136 - 7,3%*** -
Barclay et al. (2007) US 1979-1997 594 - - 1,7%***

12
the buyer’s relationships with the issuing firm. Since this study investigates the private
placement’s relationship with the issuing firm and its effect on the abnormal returns, the
empirical findings for the different buyer categories will be presented in the following section.
3.3. PRIVATE PLACEMENT BUYERS
The positive short-term stock reaction to private placements depends heavily on buyer type
meaning how much the investor is involved in the issuing firm (Barclay et al., 2007).
Information asymmetry is here an overall important explanation why there are differences in
the stock price reactions depending on the buyer’s relationships with the issuing firm. In other
words the amount of information the buyer possesses of the true firm value compared to the
information available to the market matters. (Wruck, 1989; Barclay et al., 2007)
Krishnamurthy et al. (2005) find out that the short-term abnormal returns in private
placements are higher when the shares are issued to insider investors compared to other
investors. The authors refer to Leland and Pyle (1977) who have already explained that
insider investors most probably know more about a firm’s future cash flows and the true firm
value. Therefore, such an investment can be considered firstly as a certification of firm value
and secondly reduces agency problems (Krishnamurthy et al., 2005). This is consistent with
Hertzel and Smith (1993) who argue that managers have knowledge about investment projects
with positive NPVs. In order to realize this investment opportunity, cash in form of an equity
issue is raised (Hertzel & Smith, 1993).
In this study, we will focus on three different buyer categories: insider; active and passive
buyers. Besides these three main categories, for some private placements there is a mix
between those buyer categories. In the following section, the three main buyer groups as well
as the mixed buyer group are presented. In addition, the empirical findings in terms of
abnormal returns are presented for each buyer category.
3.3.1. Insider buyer
An insider buyer is characterized by Barclay et al. (2007) in the private placement context as
an investor who is either a manager or a director of the issuing firm. Barclay et al. (2007) find
out that insider placements or managerial placements show the lowest short-run abnormal
returns (-0,7% but statistically insignificant) of all private placement buyers but the highest
discounts.

13
It is not a surprise that insider buyers who have the highest amount of information available
show the lowest positive abnormal returns since insider ownership is not always associated
with positive aspects as it has been shown in the managerial entrenchment hypothesis section.
Solidified management control can lead to possible self-serving private placement deals by
large existing shareholders or management. By issuing private placements at a discount,
insiders can especially benefit on private placement deals to themselves. Since the market is
also aware of that, this in return leads to negative market reactions. It is therefore assumed
that the overall positive market reactions to private placements is somewhat outweighed by
this insider opportunism. (Molin, 1996; Barclay et al., 2007)
3.3.2. Active buyer
Active buyers are defined as external investors who are both willing and competent to
monitor management. This is often another corporation buying a large-percentage of stocks in
order to get involved in the firm. (Barclay et al., 2007) Wu (2004) shows that active investors
are often institutional investors, such as funds or venture capitalists, who have a certain
interest to monitor their portfolio companies.
As already presented in the monitoring hypothesis section, private placements are mainly
associated with positive abnormal returns if investors want to monitor. This is consistent with
Barclay et al. (2007) who investigate that an active investor is perceived more favorably by
the market than passive buyers. They find out that active placements are associated with a
positive abnormal return of 5% at a 1% significance level. Those buyers who become active
in the issuing company pay more than passive buyers when it comes to discounts of private
placements. However, active buyers only made up 12% of their sample and therefore their
conclusions have to be considered cautiously. (Barclay et al., 2007)
3.3.3. Passive buyer
According to several researchers, private placement buyers are often passive (Wu, 2004:
Barclay et al., 2007). Barclay et al. (2007) categorize a private placement as passive when the
buyer does not have any reported activity with the issuing firm. Therefore, their amount of
information is the most limited of the three buyer categories. Since passive buyers do not
participate in the current management, this helps management to solidify their control. As
presented in the managerial hypothesis section, this might not be positive for non-
participating existing shareholders leading to a negative market reaction. As far as the exact
market reaction to private placements of passive buyers is concerned, there are positive short-

14
term abnormal stock returns of 1,4% at a 5% significance level as investigated by Barclay et
al. (2007). However, they challenge this result since only 51% of the returns are positive. It is
interesting to mention that their sample consists of more than 80% of passive private
placements. Subsequently, it can be concluded that both the monitoring hypothesis and the
information hypothesis can only explain a minority of private placements. (Barclay et al.,
2007)
3.3.4. Mixed buyer
Besides the above presented three main buyer categories, several buyer groups are mixed for
some private placements. To our knowledge, there has not been much research on the mixed
buyer group related to the private placement context. Yeh and Ma (2012) mention in their
study that only main buyer categories should be included in order to obtain more accurate
results. Furthermore, Barclay et al. (2007) also include the mixed buyer category in their
study.
3.4. DEVELOPMENT OF HYPOTHESES
By referring to the previously presented empirical evidence and the theoretical framework of
chapter two, the following research hypotheses are developed. The first hypothesis is based on
the presented empirical evidence that private placements lead to positive short-term abnormal
returns (Wruck, 1989; Hertzel & Smith, 1993) as presented in the following:
H1: The announcement of private placements leads to positive short-term abnormal returns.
The managerial entrenchment hypothesis motivates our second hypothesis. Private
placements to insiders can lead to a solidified management control which is linked to “insider
opportunism” (Molin, 1996). Molin explains that the opportunism is arising from self-serving
private placement deals done by large existing shareholders or management negative market
reactions. To weight up the negative reactions, the signaling theory of Leland and Pyle (1977)
is used as an explanation. This is due to their assumption that a positive signal is sent to the
market when insiders increase their equity stake. With an emphasis on the managerial
entrenchment hypothesis, the second hypothesis is developed:
H2: Insider buyers lead to lower abnormal returns than passive and mixed buyers.

15
The third hypothesis is based on the monitoring and information hypotheses. The monitoring
hypothesis states that the identity of the buyer influences the abnormal returns. For an active
buyer, a high positive abnormal return can be expected as explained by the monitoring
hypothesis assuming that active buyers are both willing and competent to monitor
management (Wruck, 1989). In addition, the information hypothesis states that a well-
informed private placement investor investing in a company, results in a positive market
reaction because the market considers this as a sign of undervaluation. These theoretical
assumptions lead us to the third hypothesis:
H3: Active buyers are expected to lead to higher abnormal returns than passive and mixed
buyers.

16
4. METHODOLOGY
This chapter aims to provide a description of the procedure chosen for carrying out this
study. Firstly, the research approach and research design are presented before moving on to
the data collection. The used empirical models, the event study and the OLS regression are
further presented. This chapter finishes with the validity and reliability sections.
4.1. RESEARCH APPROACH
The two most common methods in research are the inductive and the deductive research
approach. The inductive approach is applied when the results are drawn from research
whereas the deductive approach builds up on earlier theories. (Patel & Davidson, 2003) In this
study, the deductive approach is used. According to Bryman and Bell (2011) the deductive
approach is best suited for developing hypotheses to test the validity of several theories.
Therefore, several hypotheses based on the theory have been developed as shown previously.
These research hypotheses will be investigated through an event study and an OLS regression
which will be later presented in more detail.
4.2. RESEARCH DESIGN
According to Lewis et al. (2009) a research can be conducted as exploratory, descriptive or
explanatory design. Malhotra and Grover (1998) explain that the purpose of an exploratory
research is to become more familiar with an area or problem. A descriptive research has the
aim to describe a specific situation or problem, whereas an explanatory is devoted of finding a
relationship between variables from theory based expectations (Malhotra & Grover, 1998).
The explanatory research is usually used together with quantitative data collection (Lewis et
al., 2009). We have chosen an explanatory design since we aim to explain the relationship
between abnormal returns and the buyers’ relationship with the firm issuing the security in a
private placement.
Aliaga and Gunderson (2002) define the quantitative research method as an ‘explaining
phenomena by collecting numerical data that are analysed using mathematically based
methods (…)’. The quantitative method is chosen in this study since both an event study and a
regression are done whereas a qualitative study is rejected since it often lacks objectivity
which is highly relevant for statistical analysis than this study.

17
4.3. LITERATURE STUDY
Material has been collected by searching for articles in the journal databases. To get a deeper
knowledge in the area being studied, scientific articles and books were selected. Scientific
articles undergo a rigorous review process before they are published and can therefore usually
be considered to be reliable. It is also important to consider where the article is published
since the quality of the publisher can therefore vary. In general, articles get published faster
than books and due to this articles contain more recent research. Due to the above mentioned
arguments, the theoretical framework mainly consists of scientific articles. The search was
performed by discussing key concepts of the topic and then key words were used to find
relevant theories. The key words used are: SEO, Seasoned equity offer, Secondary equity
offer, announcement effect, abnormal return, private placement, information asymmetry,
buyer identity, managerial entrenchment hypothesis, information hypothesis, monitoring
hypothesis. This literature review helped then to construct a theoretical framework and the
empirical findings chapter on which the research hypotheses are based.
4.4. DATA COLLECTION
In this study data has been collected using existing literature, articles, data bases, press
releases and annual reports. The specific data selection criteria are explained in the following
section.
4.4.1. Data selection criteria
Data is gathered from various databases to ensure data quality. There are several stock
markets in Sweden. Some are regulated and some have less strict rules which are called
Multilateral Trading Facilities (MTF). Our sample consists of observations from the regulated
markets NASDAQ OMX Stockholm and NGM Equity, as well as the MTFs including First
North, Aktietorget and Nordic MTF. We believe that it adds value and depth to our analysis to
include companies from the smaller marketplaces since then we can collect a larger variety of
firms. The MTF lists are often market places where companies first list before deciding to be
listed on larger regulated markets. Smaller lists are also characterized by a greater SEO
activity in the recent years which leads to a larger sample for this study. Transactions
containing warrants or options are difficult to value and are therefore excluded in our sample.
We gathered all the SEO's from the mentioned lists above from Nyemissioner.se between
2008 and 2014 and put it into a table. This table served as a basis and then more issues were

18
added on by identifying SEOs from other sources. One of these was Thomson Reuters Eikon
where only SEOs for the time range from 2011 onwards could be identified. Therefore, data
was further gathered from the SDC database from Thomson Reuters, the standard database
when it comes to equity transactions. Further information was gathered through press releases
and annual reports to determine if it the issue was cancelled, a public offering, rights offering,
a private placement or an IPO. The IPO category also contains the transactions that included a
list change. The development of the issue activity is shown in figure 1 and the exact numbers
and definitions can be found in the appendix A.
Further information was gathered through press releases and annual reports to determine if it
the issue was cancelled, a public offering, rights offering, a private placement or an IPO. The
IPO category also contains the transactions that included a list change. The development of
the issue activity is shown in figure 1 and the exact numbers and definitions can be found in
appendix A.
Figure 1: Equity issue activities in Sweden between 2008 and 2014
The total sample consists of 970 events. The biggest group is rights offering with 565 events, in second place are the IPO/list
change activities with 169 events. The private placements are 128 in total, closely followed by public offerings with 100
events. A small number of the investigated issues were never completed, 8 in total. There are most certainly more issues that
are cancelled during this period but they are not captured in our list.
This process produces a sample of 128 private placements. To determine if the issues could be
included in our event study we gathered stock prices and announcement days. After that, all
private placements with another event such an IPO, list change or SEO happening within the
previous 251 trading days of the announcement day were excluded. This was done to avoid
that previous events affect the normal return calculation in the estimation window in the event
study. According to MacKinlay (1997), it is important that the estimation window and event
window do not overlap otherwise the estimators for the parameters of the normal return model
0
20
40
60
80
100
120
2008 2009 2010 2011 2012 2013 2014
Rights offering
IPO
Private placement
Public offering
CANCELLED

19
would be influenced by the returns around the window. By excluding private placement with
other event windows in the estimation window we avoid normal return measurements to be
biased. Some other events were excluded since the trading day data was not sufficient for
creating an estimation window. After all these adjustments, the final event study sample
consists of 64 events. This is comparable with the sample size in earlier studies of private
placements such as Wruck (1989).Wruck’s core analysis involves between 48 and 128
observations. Hertzel and Smith (1993) have 106 observations. All the relevant data gathered
for the private placements can be found in appendix B.
4.4.2. Categorization of the buyer type
We divide the sample into four different categories: active buyer, insider buyer, passive buyer
and mixed buyer. The definitions of the buyers are the same as used by Barclay et al. (2007)
and as presented in chapter three.
Active buyers are defined as outside investors who are both willing and able to monitor
management (Barclay et al., 2007). The words we searched for during the data gathering was:
"strategic partner" or "long term commitment". Furthermore, we checked and these investors
became larger shareholders with an ownership limit of 10% based on the post issue ownership
percentage. Insider buyers are investors who are either involved in the management as
managers, directors of the issuing firm or large shareholders with more than 10% ownership
before the issue. The insider categorization is the strictest one where we have followed the
classification drawn up by NASDAQ and Aktietorget. Passive buyers are investors, who are
not currently involved in the issuing firm, and neither announce they are going to get
involved. Mixed buyers are private placements including more than one of the
abovementioned buyers. By introducing the mixed group, we create the possibility to have
exclusive and exhaustive groups. Press releases and annual reports are used to categorize the
buyers in the respective category. The categorization is distributed as it can be seen in the
following table.

20
Table 3: Private equity placements per buyer in Sweden between 2009 and 2014
The active buyers are the largest group with 27 placements or 42% of the total sample. The
passive buyer group is the second biggest group with 22 placements or 34% of the total
sample. The insider buyers and the mixed group are the smallest categories.
4.5. EVENT STUDY
After having gathered all relevant data, an event study has been chosen in order to analyse the
announcement effect to private placements which relates to the first research hypothesis.
According to Binder (1998), the event study methodology has become the standard
methodology for measuring the security price reaction to events such as the issue of private
placements. This is measured by calculating abnormal returns which is later explained in
more detail. Fama et al. (1969) introduce the event study methodology in their paper which is
considered as one of the reference methodologies among the research community. This event
study methodology offers several advantages. Firstly, it allows testing if the market efficiently
considers information as it has been developed by Fama et al. (1969). Secondly, event studies
aim to examine the impact of the event on the share price or in other words event studies
investigate the effect on the wealth of the firm’s shareholders (Binder, 1998). The event study
methodology has been developed constantly over time implying that there are different ways
of proceeding. However, in the present event study, the approach of MacKinlay (1997) is used
since it is considered as one of the most recent reference papers (Eckbo, 2006).
4.5.1. Normal return models
MacKinlay (1997) suggests starting the event study methodology by calculating the abnormal
returns. A normal return model is necessary for doing so. There are various approaches
available how to calculate the normal return of a security. They can be divided in two
categories, the statistical and the economic approach. The statistical models only incorporate
statistical assumptions concerning the behavior of asset returns. The underlying assumption is
that the asset returns are jointly normal and independently distributed through time. Even if
Year Number Proceeds Number Proceeds Number Proceeds Number Proceeds Number Proceeds
All 64 3 563 27 1 106 8 43 7 84 22 2 330
2009 3 243 2 200 1 43
2010 5 190 1 19 1 3 1 17 2 152
2011 7 109 1 17 2 22 2 41 2 30
2012 19 2 053 8 185 2 7 2 6 7 1 855
2013 17 528 9 369 1 3 7 156
2014 13 439 6 317 2 9 2 20 3 93
PassiveMixInsiderAll private placements Active

21
the distributional assumption is strong, it generally does not lead to problems in practice
considering the fact that it is empirically reasonable. Examples for this category are the
market model, the market-adjusted return model or the constant mean return model. In
contrast to statistical normal return models, economic normal return models are based on both
statistical and economic assumptions. Therefore, economic models offer on the one hand the
opportunity to calculate the normal returns more precisely but on the other the underlying
restrictions are more constrained. (MacKinlay, 1997) The economic normal return model is
not further specified since a statistical model, the market model is used for the present event
study. The market model is presented in the following section.
4.5.2. Market model
Several event study methodology models have been assessed, but the market model has been
chosen for various reasons. Firstly, the market model is known for its simplicity since it is a
linear statistical model which assumes a linear relationship between the stock returns and the
market returns. Secondly, the market model is the commonly used methodology for
investigating stock price reactions to announcements of private placements as it has been used
by Wruck (1989), Molin (1996) and Barclay et al. (2007). Thirdly, this model reduces the
variance of the abnormal return by removing exactly that portion of the return that is related
to the variation in the market’s return. The benefit of this variance reduction depends on R2
since the higher R2
is, the greater the variation reduction of the abnormal return. (MacKinlay,
1997) The market model formula is presented below.
Rit = αi + βiRmt + εit
E(εit = 0) var(εit) = σε2
The market model in formula 1 above is for any security i where Rit is the observed arithmetic
daily return for the private placement i at day t, whereas Rmt is the return on the market
portfolio at day t (MacKinlay, 1997). Daily returns are said to to perform well with daily
stock returns (Brown and Warner, 1985). Furthermore, εit is the zero mean disturbance term.
The other variables of the market model namely αi, βi, and σε2 are parameters of the market
model. The intercept âi and the coefficients β^i are computed by OLS regressions of Rit on Rmt.
In other words, both α and β of each stock are calculated by regressing the return of the stock
on every day in the estimation window to the return of the market. This, in turn, provides the
(1)

22
parameters for estimating the normal return for every stock and day in the event window.
(MacKinlay, 1997) The parameters are calculated as following:
The market portfolio returns are estimated by means of a linear regression of the company’s
stock return on the Affärsvärldens Generalindex (AFGX). According to Molin (1996), AFGX
is the oldest and most well-known value-weighted index of the Stockholm Stock Exchange.
The AFGX has been extracted from Datastream using the OMX Affärsvärldens Generalindex
with the shortcut OMXAFGX in Thomson Reuters Datastream.
4.5.3. Event and estimation window
In order to apply the previously presented market model, both the event window and the
estimation window have to be defined. The event window is the ‘period of interest over which
the security prices of the firms involved in this event will be examined (…) including the event
announcement’ (MacKinlay, 1997). In other words, it is necessary to define the time period
over which the abnormal returns are measured. MacKinlay (1997) further specifies that the
event window is commonly defined to be larger than the period of interest including days
before and after the event. He specifies that event windows which are too narrow do not fully
capture the full effect of the event whereas too broad event windows might capture
information and reactions which are not connected to the studied event. For the present event
study, the event window is conducted from 1 day before the announcement of the private
placement to 1 day after the private placement has been announced. By doing so, the
possibility that some information have leaked before the announcement is taken into account.
In addition, the possibility that the market needs some time to react is included as well. It is
assumed that the event day and one day after the event day is sufficient taking into
consideration today's speed of information. The same event window is used by relevant event
studies in the private placement field done by Molin (1996) and Cronqvist and Nilsson (2005)
in Sweden.
(2)
(3)

23
The estimation window, the time period on which the estimation of the normal return is based,
has to be fixed as well. A balance in the trade-off between improved accuracy of the
parameters (β and α) and the possibility of significant parameter shifts over time has to be
found. On the one hand, a longer estimation window leads to more accurate parameters but on
the other hand this increases the risk that structural breaks such as stock splits have caused the
current parameters to be significantly different from the parameters in the past. (MacKinlay,
1997)
For the present event study, an estimation window of 251 days before the event up to 11 days
before the event day is chosen. Observations are only included in the sample if the stock is
traded during all of the days in the estimation window. This length corresponds approximately
one calendar year and is further assumed to be large enough to neutralize any seasonality that
could occur during a year and therefore effect the calculations. In addition, data quality
checks have been done in order to identify possible structural breaks such as stock splits
leading to biased parameters (Skatteverket, 2015). Skatteverket gathers all stock splits for
listed companies and it has been used as a source to adjust the stock prices in the calculations.
This is consistent with MacKinlay (1997) who insists on the fact that stock splits can
influence the data heavily with a long estimation window. Mitigation was done by adjusting
for stock splits and making sure that we used adjusted stock price data.
It is important that the event window and the estimation window do not overlap otherwise the
estimators for the parameters of the normal return model would be influenced by the returns
around the window. The normal return measurement would then be biased since both the
returns of the estimation window and the event window would capture the event impact.
Subsequently, one of the main assumptions of the event study methodology that the abnormal
returns capture the event impact would be violated. (MacKinlay, 1997)
4.5.4. Abnormal returns
After having identified the time windows allowing calculating the normal returns by means of
the market model, the abnormal returns can be calculated for the event window. The abnormal
return is defined as disturbance term of the market model which is the difference between the
actual return and the expected return calculated with the market model. The formula to
calculate it is presented in formula 4. (MacKinlay, 1997)
ARit = Rit - αi - βiRmt (4)

24
In order to draw inferences of the impact of the event, MacKinlay (1997) suggests that the
individual abnormal returns have to be cumulated through time and across securities by means
of appropriate techniques. This is necessary in order to examine whether the announcement of
private placements has an effect on the stock price. The following formula is used for doing
so
where N is the number of observations and ARit are the abnormal returns for the individual
securities. The variance of the abnormal returns is then calculated by means of the following
formula
where σε2 is the disturbance variance which is calculated with formula 7.
With a large enough estimation window, L1 solves the sampling error arising from αi and βi
since the sampling error approaches zero meaning that the variance of the abnormal returns is
σε2
and the abnormal returns become independent through time. (MacKinlay, 1997) Since we
use a large estimation window of 240 trading days this sampling error can be assumed to be
marginal and can be neglected for our event study. The variance for each firm is then
cumulated with formula 8 and the average Cumulative Abnormal Returns is calculated with
formula 9.
(6)
(5)
(7)
(8)
(9)

25
Finally, inferences about the cumulative abnormal returns, CAR, are drawn by testing the null
hypothesis Ho that the abnormal returns are zero under the assumption that the daily abnormal
returns are normally distributed. The Ho hypothesis can be tested by the following formula
The cumulative abnormal returns are significant if the Ho hypothesis can be rejected. It is
commonly recommended to test the used normal return model for robustness. Molin (1996)
uses the market-adjusted abnormal return model for testing if the private placement’s market
reaction is not biased by the model used. This can be tested by means of the following
formula
ARit = Rit - Rmt (11)
The market-adjusted return model can be considered as a restricted market model since the
parameter αi is zero whereas βi is one. Since these restrictions could lead to biases, it is
generally recommended to use such a restricted model only if necessary as for comparing the
results of the market model to another model. (MacKinlay, 1997)
4.6. CROSS-SECTIONAL REGRESSION
In order to test the impact of the specific impact of the different buyer categories on the
abnormal returns, a cross-sectional regression is done. This can be helpful when it is
interesting to investigate how different variables affect an outcome, e.g. how abnormal returns
are affected by the type of buyer. The basic approach is to run a cross-sectional regression
with abnormal returns as the dependent variable and the characteristics of interest as
independent variables. It can be estimated using the widely used Ordinary Least Squares
(OLS) regression. In the following the regression and its respective variables are explained.
4.6.1. Description of regression variables
The focus is to investigate the effect of the buyer type on the abnormal returns. In this
regression several control variables will be included in order to check if other variables also
have an effect on the abnormal returns. The regression that will be tested is the following:
CARadj = αi + β1*active buyer + β2*insider buyer + β3*firm size + β4*issue size +
β5*(issue size/firm size) + β6*financial restructuring + β7*regulated market + εi
(10)
(12)

26
Where αi is the intercept of the regression, β is the slope coefficient, εi is the error term and the
rest of the variables are explained in the following text. In the categorization of the buyer type
section we defined four different groups of private placement buyers: active buyer, passive
buyer, insider buyer and mixed. To avoid the dummy variable trap in the regression, we drop
the passive buyers and the mixed group and use these variables as our base group. The
reasoning is that the abnormal return from the insider should generate the lowest result and
the active buyer should generate the highest abnormal return which is consistent with the
developed research hypotheses. By dropping both passive and mixed buyers, the regression
results can be analyzed through the change from the base groups.
4.6.1.1. Dependent variable
A discount-adjusted abnormal return variable, CARadj
, is used as the dependent variable for
the event window ±1 day. The abnormal return from an announcement of a private placement
consists of two components; the first is the abnormal return resulting from new information.
The second component is the abnormal return representing the compensation of the purchaser
for contributing positively to the firm value (Wruck, 1989). In other words, event study results
are strongly impacted by pricing effects, which is called compensation to the buyer by Wruck
(1989). Therefore, the abnormal return variable is adjusted for discounts. The pricing effects
arise from the difference of the offer price of private placements and the market price of the
stock on the announcement day. Discounts to private placement investors lead to dilution of
current shareholders who do not participate in the private placements deal. The stock market
reaction reflects such a dilution effect from the private placement discount. In contrast,
premiums to private placements relative to the market price lead to a wealth transfer from new
investors to non-participating shareholders (Molin, 1996). By adjusting AR for discounts, the
abnormal return reactions without pricing effect can be isolated and we can study the
abnormal part that is a result of new information released to the market. To calculate the
adjustment the formula used by Molin (1996) is applied as it can be seen in the following:
where ΔS is the number of securities of the private placement deal, S0 is the number of shares
before the sale, p-1 is the market price on the day before the announcement, p0 is the event
market price, poffer is the price of the private placement offer.
(13)

27
The adjusted AR from the event day is added together with the day before and after to get
CARadj
.
CARadj
= AR-1+AR0adj
+AR1
4.6.1.2. Independent variables
In the following section, the chosen independent variables in the regression are explained.
They have been chosen by examining respective private placement studies such as those of
Wruck (1989), Hertzel and Smith (1993), Molin (1996) and Barclay et al. (2007). The
different buyers are the variables of interest whereas the other important variables are control
variables.
Active buyers are outside investors who are both willing and able to monitor management. A
dummy variable is used which equals one if the buyer of the private placement becomes
active in the company or zero otherwise. Insider buyers are investors who are either involved
in the management as managers, directors of the issuing firm or a large shareholder with more
than 10% ownership. This variable takes a value of one if the buyer is a member of the
management prior to the private placement or zero otherwise. In order to make sure that the
regression only examines these variables of interest, control variables are included in the
regression as explained in the following section.
Several control variables are included in the regression since it can be assumed that there are
other factors affecting the short-term abnormal returns than the identity of the buyer. That is
why control variables are included to check if there are other parameters that are important
and if the abnormal results still hold.
Firm size is defined as the market value of equity 30 days prior to the announcement. The
market value measured as market capitalization has been likewise used by prior studies as a
proxy for information asymmetry (Molin, 1996; Barclay et al., 2007). As shown by Asquith
and Mullins (1986), the firm size impacts the abnormal returns of an equity issue
announcement. It is assumed that information asymmetry is larger in small firms leading to
larger information effects (Freeman, 1987; Corwin, 2003).
Issue size is measured as the gross process from the private placement offer and is an
alternative proxy for size effects. Mikkelson and Partch (1985) and Asquith and Mullins
(1986) discover a significant relationship between issue size and abnormal returns on the
(14)

28
announcement day. This could not entirely be confirmed since other researchers only find a
sporadic effect between issue size and announcement effects. They entirely reject any
significant impact of issue size on announcement effects (Masulis and Korwar, 1986; Barclay
& Litzenberger, 1988; Korajczyk et al., 1990; Barclay et al., 2007).
The relative offer size, defined as issue size/firm size, captures the issue size relative to the
total market value of the firm prior to an equity offer. Hertzel and Smith (1993) show that
information effects are large when the degree of undervaluation is high. This is then captured
by the relative issue size.
Since private placement offers can also be used for a firm’s financial restructuring,
announcement effects can result from restructuring reasons as it has been tested in previous
studies such as those of Molin (1996). A dummy variable is therefore included which equals
one if the private placement proceeds are used for a firm’s restructuring and zero otherwise.
In this present study both regulated and non-regulated markets are included and we want to
control for it. To do this, we include the variable regulated market. This is due to the fact that
information asymmetry is greater on unregulated marketplaces such as First North;
Aktietorget; NGM Nordic MTF. On the non-regulated markets, firms do not face as strict
regulations as on regulated markets, Nasdaq OMX Stockholm and NGM Equity
(Finansinspektionen, 2015). In case of a private placement offer is made on a regulated
market, the dummy variable is one, otherwise zero.
4.7. VALIDITY & RELIABILITY
In the following section, validity is discussed for this study. After that the reliability section
explains what has been done to ensure that the results can be repeated.
4.7.1. Validity
Validity concerns how the factors selected to study a phenomenon really describes the
phenomenon (Bryman, 2004). According to Wiedersheim and Eriksson (1991), the term may
be divided into internal and external validity. The internal validity is firstly presented making
sure that the right phenomena has been investigated in our study. This is followed by the
external validity section meaning the degree of which the results can be generalized.

29
4.7.1.1. Internal validity
The internal validity ensures that the constructed model and gathered capture the reality that
exists and if the researcher is studying what she or he believes to study (Wiedersheim &
Eriksson, 1991). Our internal validity is mostly affected by the categorization of the buyers.
We recognize that the categorization of buyers, as any categorization, has its limitations. The
difficulty with repeating the exactly same classification is that the researcher can bias it. If
another person would repeat the classification, they might classify some of the buyers in a
different way. The insider categorization is the strictest one for which we follow the
classification drawn up by NASDAQ and Aktietorget, i.e. to top manager, member of the
board, auditor or a larger shareholder holding more than 10% before the private placement or
related to one of the above. For the classification of an active buyer we have looked for words
as: "strategic partner", "long term commitment" and if they become a larger shareholder with
over 10% based on post issue ownership percentage. The definition between active and a
passive buyer is heavily dependent on the communicated information. Unless we have
misclassified some placements, the classification mistakes should be quite small since we
followed strict rules while gathering the data and making the classifications.
4.7.1.2. External validity
The external validity consists of the degree of which the results can be generalized, if the
results of the work are applicable to more than one case (Wiedersheim & Eriksson, 1991). If
the purpose of a research is to generalize the result over a population, the question is if the
sample that is used is appropriate (Lewis et al., 2009). To mitigate this issue, several tests
have been conducted on the gathered data to minimize faulty conclusions and generalizations.
In order to test data quality and the power of the results, several empirical results and
diagnostics were done. In a study with limited number of observations, which is the case for
the present study, the empirical results can be heavily influenced by a few observations only.
To avoid skewness of data, any kind of outliers will be excluded. We define outliers as an
issue that deviate more than two standard deviations (outside 95 percent of observations) from
the mean of the sample. In the empirical results chapter, various tests are made to investigate
whether the Ordinary-Least-Square assumptions hold: The Jaque-Berra test is conducted to
investigate if the variables are normally distributed. Multicollinearity is checked by
examining whether there are correlations between the independent variables. A test for

30
heteroskedasticity is likewise conducted. It has to be noted that if the underlying OLS
assumptions do not hold, inferences on the standard t-test will be less certain (Brooks, 2008).
In empirical corporate finance studies, endogeneity is one of the most important and pervasive
issues that have to be controlled for (Roberts & Whited, 2012). In this study we have
identified two issues that could lead to endogeneity: omitted variables and selection bias.
Regarding omitted variables, there are likely to be factors we have not controlled for leading
to omitted variables. Since private placements are motivated by a various amount of reasons
according to Barclay et al. (2007), this makes it difficult to include all relevant variables.
Selection bias derives from the type of firms issuing a private placement. We assume that
firms with specific firm characteristics, e.g. within a certain industry, are more likely to issue
private placements leading a non-random selection. We acknowledge the possibility of
selection biases and omitted variables and then try to mitigate the effects from them. The
selection bias is mitigated to some extent by including all the stock markets in Sweden to get
a great variety of companies. For the omitted variables we challenge our result in different
regression scenarios to investigate if our variables should be included in our model based on
the theory available for private placements.
4.7.2. Reliability
Reliability is according to Merriam (1988) the extent to which the results can be repeated. To
ensure the reliability, the work process consisted of thoroughly documenting the research
process phases presented in the methodology chapter. This makes it possible to conduct the
same study at a later time (Yin, 2003). Our data is collected from well-known databases
which are reliable and updated such as Thomson Reuters Eikon, Thomson Reuters SDC,
Thomson Reuters Datastream, Nyemissioner, NASDAQ OMX, NGM and Aktietorget. The
gathered data is documented and put together in a systematic way in Excel. In order to ensure
data quality the authors of this paper had it as a routine to double check each other’s work
during the whole process.
The methodology concerning the empirical part of this study is described in the following
chapter presenting the empirical results of both the event study and the OLS regression.

31
5. EMPIRICAL RESULTS
This chapter provides the empirical results of the research conducted. It starts with the results
from the event study meaning the calculations of the adjusted abnormal returns for both the
total sample and respective sub-samples. Afterwards, the descriptive statistics and the
regression results will be presented.
5.1. EVENT STUDY RESULTS
The event study results are divided in two sections starting with the total sample and then
followed by the different private placement buyer categories.
5.1.1. Abnormal returns for total sample
The market-model was used as event-study methodology to study the stock price reaction to
the announcements of private placements. The estimation period includes day −251 until day
−11, which is approximately one calendar year. Day 0 is the trading day when the
announcement actually affected the stock price, e.g. if the information was published after the
stock exchange was closed, the next trading day is day 0. Several event windows were
cumulated in order to investigate how the cumulative abnormal return (CAR) changes for a
different time period. In figure 2, the average CAR is presented as a function of the different
event windows.
Figure 2: Mean CAR as a function of event windows
The results indicate a positive average abnormal return following the announcement of private
placements. In the table below, the average CAR and its respective significance levels are
presented for different event windows.
0%
2%
4%
6%
8%
10%

32
Table 4: Cumulative abnormal returns (CAR) for different event windows
The significance level is divided into three different levels, t-statistics for 2-tailed test with 63 degrees
of freedom in parenthesis: * - 10% level (1,6706), ** - 5% level (2,0003); *** - 1% level (2,6603).
The null hypothesis tested in the event study is that the event has no impact on the firm value.
The t-statistics is calculated by dividing the CAR mean by the root of the variance of CAR
mean as described in the methodology chapter. The null hypothesis can be rejected for eight
of the event windows because of significant results. When only including both the event day
or ±7 days and more, the event study results are no longer significant. All calculations of
abnormal returns for the event study can be found in appendix C. To check the robustness of
the event study results, we also use the market-adjusted abnormal return model to test if the
market reaction is biased by the model used. The results from the market-adjusted abnormal
return model are consistent with the results from the market model. A comparison is included
in appendix D.
5.1.2. Categorization per buyer group
The aggregated results of all private placements hide considerable differences among the
private placement buyers. Dividing the event study results in the different buyer groups gives
more nuanced results. This helps to identify patterns which have not been recognized in the
total sample. In figure 3 the aggregated abnormal returns per private placement buyer group is
presented for three days before and three days after the event day.
Event
window
Variance
(mean CAR) CAR mean T-statistics
Significance
level
CAR 0 0,000 3,3% 1,48
CAR 0, +1 0,000 4,0% 2,55 **
CAR +-1 0,000 4,5% 2,37 **
CAR -1,+2 0,000 5,6% 2,51 **
CAR +-2 0,001 5,9% 2,37 **
CAR +-3 0,001 5,4% 1,83 *
CAR +-4 0,001 6,1% 1,83 *
CAR +-5 0,001 7,7% 2,10 **
CAR +-6 0,002 8,8% 2,21 **
CAR +-7 0,002 4,6% 1,08
CAR +-8 0,002 6,1% 1,34
CAR +-9 0,002 4,6% 0,95
CAR +-10 0,003 3,5% 0,69

33
Figure 3: Abnormal returns aggregated per event day
Aggregated, market-model abnormal stock returns for 64 private placements in Sweden between 2009 and 2014. Day 0 is the
announcement day of the placement or the day after is the press release was done after the stock exchange was closed.
The graph shows that insider buyer results in a very negative stock price reaction on the event
day and the mixed group follows the same pattern. Both passive and active buyers show a
positive stock price reaction on the announcement day. More details about the aggregated
abnormal returns per day and buyer can be found in appendix E. For the event window ±1 day
the cumulative abnormal returns per buyer group and its significance levels are presented in
the table below.
Table 5: CAR per buyer over event window: ±1 day
Degrees of freedom are calculated by taking the number of events -1. The significance level is divided into three different
levels, t-statistics for 2-tailed test with different degrees of freedom: * - 10% level ** - 5% level; *** - 1% level.
The passive buyer group is the only group showing a significant result with a mean of 8,06%
at a 1% significance level. The announcement effect for the active and the mixed buyers is
positive while it is negative for the insider buyers. Since the results for those three buyer
groups are insignificant and small in number of events for both the insider and mixed buyers,
no strong conclusion can be drawn.
-15%
-10%
-5%
0%
5%
10%
-3 -2 -1 0 1 2 3
Insider buyer Active buyer Passive buyer Mixed
Buyer Insider buyer Active buyer Passive buyer Mixed
Degrees of freedom 7 26 21 6
Var(meanCAR) 0,0031 0,0012 0,0004 0,0050
CAR mean -7,68% 4,83% 8,06% 6,33%
T-statistics -1,3874 1,4053 3,9507 0,8958
Significance level ***

34
5.2. DISCOUNTS AND PREMIUMS
Discounts and premiums can influence the abnormal returns heavily. To understand how
much we will have a closer look at our sample. In the following sections the discounts and
premiums will be presented, firstly for the total sample and then for the different market
places.
5.2.1. Pricing of total sample
Firstly, the discounts and premiums are presented for the total sample. Table 6 gives an
overview on the total sample by comparing the closing price of the event day with the issue
price. A negative number (-) indicates a premium and a positive number (+) a discount.
Table 6: Discounts and premiums per buyer
Discount is the per share closing price of the placement on the announcement day minus the offer price and then put in
relation to the announcement day price (Barclay et al, 2007).
The data in table 6 suggests that the pricing of private placements varies with the buyer
category. This is yet another of several empirical findings that differ across the four categories
of private placements. The passive buyer is the only group that on average gets a discount and
the other groups have to pay a premium. Since there is a big difference between the minimum
and maximum values, the average number might be a bit misleading. It is therefore necessary
to consider both the median and the number of events. It can be seen that for most of the
buyers the number of discounts is bigger than the number of premiums. About 60% of the
total sample gets a discount. This is reflected in the median number which is higher than the
average.
5.2.2. Differences between market places
The smaller market places are characterized by more illiquid stocks and prices under 1 SEK
according to our sample. On smaller market places a small change in the price can result in a
big premium or discount. The following figure shows the discounts and premiums for the five
analysed market places. A detailed table with the discounts and premiums and divided per
market can be found in appendix F.
All buyers
(n=59)
Insider buyers
(n=7)
Active buyers
(n=25)
Passive buyers
(n=21)
Mix buyers
(n=6)
# Premium 25 5 9 8 3
# Discount 34 2 16 13 3
Mean -2% -2% -3% 4% -12%
Median 3% -10% 5% 5% 2%
Min -157% -31% -130% -53% -157%
Max 56% 56% 54% 44% 50%

35
Figure 4: Discount and premium per market
The discount is the per share closing price of the placement on the announcement day minus the offer price and then put in
relation to the announcement day price (Barclay et al, 2007). A negative number (-) indicates a premium and a positive
number (+) a discount. Total number of events is 59, divided per market the number is: 12 on NASDAQ Stockholm; 3 on
NGM Equity; 24 on Aktietorget; 17 on First North; 3 Nordic MTF.
It can be seen that there is a big difference in the discounts or premiums for most of the
market places. For Aktietorget these values are even more extreme. This market place has a
lot of stock which is traded under 1 SEK, which means that a small difference between the
stock price and offer price results in some extreme values. The most extreme minimum values
are -130% and -157% as presented in figure 4. More details about the prices can be found in
appendix F.
5.3. ADJUSTMENTS OF ABNORMAL RETURNS
This section explains how the data is adjusted for discounts and premiums. This is done to
draw conclusions from the regression focusing on the information and not on the pricing
effect.
5.3.1. Adjustment for discounts
As described in the methodology chapter, the cumulative abnormal returns (CAR) from the
event study within the event window ±1 day will be adjusted for discounts and premiums. In
the table below, the adjustments are presented and a more detailed calculation can be found in
appendix G.
Table 7: CARadj for discounts and premiums over the event window: ±1 day
-160%
-110%
-60%
-10%
40%
Nasdaq OMXStockholm
NGM Equity Aktietorget First North Nordic MTF
Mean Median Min Max
All buyers
(n=64)
Insider buyers
(n=8)
Active buyers
(n=27)
Passive buyers
(n=22)
Mix buyers
(n=7)
Mean 6,29% -9,18% 6,13% 9,84% 13,48%
Median 1,04% -5,18% 5,50% 1,74% 2,12%
Min -93,21% -93,21% -60,72% -13,04% -27,72%
Max 125,75% 40,93% 66,93% 125,75% 84,96%

36
The average CAR for the whole sample was 4,5% and after adjusting for discounts and
premiums it changed a lot, to 6,29%.
5.3.2. Adjustment for outliers
The skewness of the event study data is minimized by excluding outliers in order to have a
better dependent variable for the regression. We define it as an event with an abnormal return
that deviates more than two standard deviations from the mean of the sample. When analyzing
the data, this definition can be applied to five events. A more detailed description of the
outliers can be found in appendix H. After excluding these outliers, the sample consists of 59
events and the adjusted data is presented in the table below.
Table 8: CARadj after adjustment for outliers over the event window: ±1 day
Degrees of freedom are calculated by taking the number of events -1. The significance level is divided into three different
levels, t-statistics for 2-tailed test with different degrees of freedom: * - 10% level ** - 5% level; *** - 1% level.
After adjusting for outliers, the CAR of the total sample changed a lot again. It changes from
6,29% to 4,64% after the adjustment and the total sample is still significant at a 5% level. The
big change is within the different buyer groups. Insider buyer changes from a very negative
CAR of -9,18% to a more modest one of 2,87% after adjustments. The CAR for the active
buyers decreases from 6,13% to 5,82%. The CAR for both the passive buyers and the mixed
buyers decrease heavily from 9,84% to 3,94% and 13,48% to 2,52%.
5.4. DESCRIPTIVE STATISTICS AND TESTS OF REGRESSION
VARIABLES
In this section the main regression variables will be evaluated by examining the quality of the
gathered data. A normality and multicollinearity test are conducted.
5.4.1. Normality test
Firstly, the mean, median, minimum, maximum and the distribution of the variables are
examined as it can be seen in the following table.
Buyer All Insider buyer Active buyer Passive buyer Mixed
Degrees of free. 58 7 24 20 5
Var(meanCAR) 0,0004 0,0030 0,0013 0,0004 0,0056
CARmean 4,64% 2,87% 5,82% 3,94% 2,52%
T-statistics 2,3379 0,5258 1,6232 1,9289 0,3356
Significance level ** *

37
Table 9: Descriptive statistics of the main regression variables
The variables are: CARadj is the abnormal return adjusted for discount; firm size is the is firm size in millions of SEK
measured by taking the stock price 30 days prior to the announcement times the number of outstanding shares; ln firm size is
the is the logged firm size variable; issue size is the logged issue variable in millions of SEK; issue size is the proceeds from
the private placements before deducting costs in millions of SEK; ln issue size is the logged issue variable in millions of
SEK; issue divided by firm size is exactly what is says, the issue size divided by the firm value 30 days prior to the issue; ln
issue div firm size is the logged variable of issue divided by firm size.
For CARadj, the mean value is much higher than the median which indicates that most of the
events are negative or close to zero. The high mean is the result of some high values that push
up the value. The Jarque-Bera test rejects the null of normality for all variables meaning that
none of the variables are normally distributed in the original test. After logging firm size,
issue size and the issue divided by firm size, the probability improved from zero to a higher
number. Taking logs makes the extreme values in the right tail much closer to the main
density of the distribution. The effect in the left tail is basically the opposite, so the
distributions become more symmetric. By doing so, ln issue size is closer to being normally
distributed but for ln firm size and ln issue divided by firm size, the Jarque-Bera test is still
strongly rejected. Not having normally distributed variables is a limitation to the results but by
using the logged variables instead, some of the problems will be mitigated.
5.4.2. Multicollinearity test
Before running the regression, all the included independent variables should be investigated
for multicollinearity issues. The multicollinearity test is done to make sure that the
independent variables are not correlated. The result from this test is presented in the table
below.
CARadj
FIRM SIZE
(msek)
LN FIRM
SIZE
ISSUE SIZE
(msek)
LN ISSUE
SIZE
ISSUE DIVIDED
BY FIRM SIZE
LN ISSUE DIV
FIRM SIZE
Mean 4,73% 963,1 4,72 60,1 2,42 0,15 -2,30
Median 0,87% 106,4 4,67 8,8 2,17 0,10 -2,31
Maximum 48,04% 20 888,4 9,95 1 577,7 7,36 0,92 -0,08
Minimum -27,72% 1,8 0,59 0,3 -1,39 0,00 -5,38
Std, Dev, 0,16 3 389,98 1,94 208,46 1,79 0,16 1,02
Skewness 0,82 4,99 0,42 6,73 0,21 2,53 -0,61
Kurtosis 3,43 27,40 3,33 49,29 2,82 11,47 3,92
Jarque-Bera 7,07 1 708,41 1,97 5 712,19 0,54 239,22 5,78
Probability 3% 0% 37% 0% 77% 0% 6%

38
Table 10: Correlation matrix
The significance level is divided into three different levels: * - 10% level ** - 5% level; *** - 1% level.
There is a high correlation of 85% between the logged variable of firm size and issue size
which is significant at a 1% level. Given this high correlation, it does not make sense to
include both variables in the regression since the regression can become very sensitive to
small changes in its specification. Additionally, it makes it more difficult to make reliable
overall inferences from the regression. We believe that issue size has a bigger explanation
factor for the market reaction to the private placement announcement. Since issue size is also
more normally distributed, this variable is kept.
5.5. REGRESSION RESULTS
After data adjustments and descriptive tests, in this section we will focus on the multiple
regression results presented in table 11. This allows us to study more closely the variables and
their effect on the abnormal returns. The dependent variable in this regression is the
cumulative adjusted abnormal return, CARadj, taken from the event study. In addition to the
insider and active buyer, we include several control variables to filter out any other
information that is released in an announcement.
5.5.1. Initial regression output
As a result of adjustments to the normality and multicollinearity tests, the following
regression specification is used. The regression results are presented in table 11.
CARadj = αi + β1*active buyer + β2*insider buyer + β3*LN(issue size) +
β4*LN(issue size/firm size) + β5*financial restructuring + β6*regulated market + εi
Correlations
LN FIRM
SIZE
LN ISSUE
SIZE
LN ISSUE DIV
FIRM SIZE
INSIDER
BUYER
ACTIVE
BUYER
FIN
RESTR
REG
MARKET
LN FIRM SIZE 1,00
LN ISSUE SIZE 0,85*** 1,00
LN ISSUE DIV FIRM SIZE -0,40*** 0,13 1,00
INSIDER BUYER -0,18 -0,19 0,01 1,00
ACTIVE BUYER -0,03 0,05 0,15 -0,31** 1,00
FIN RESTR -0,17 -0,18 0,01 -0,05 0,08 1,00
REG MARKET 0,54*** 0,46*** -0,22* 0,15 -0,11 -0,19 1,00
(15)

39
Table 11: Regression of abnormal returns for private placements in Sweden 2009-2014
The dependent variable is the market-model cumulative abnormal stock returns from 1 day before to 1 day following the
initial public announcement of the placement adjusted for discounts. The main variables of interest are insider buyer and
active buyer. The omitted groups are passive and mixed buyers.
The output from the OLS regression indicates that the coefficient for insider buyers is
negative compared to the base group consisting of mixed and passive buyers while it is
positive for active buyers. The coefficient for the regulated market (4,91%) and for the issue
size divided by firm size (1,83%) are positive while the coefficients for the issue size (-
1,08%) and for financial restructuring (-0,30%) are negative. However, none of the variables
in this regression are significant. This means that we should not pay too much attention on the
exact numbers but instead we interpret if the coefficients are positive or negative. It can be
seen that the fit of the regression to the data is very low since R2 is only of 2,8% meaning that
only about 3% of the variations are explained by the regression.
5.5.2. Heteroskedasticity test
In order to challenge the regression, the heteroskedasticity test is done which investigates
whether the variance of errors is constant. The test uses the squared residuals as a proxy for
the variance of the error terms. The null hypothesis of homoskedasticity is that the
coefficients for the independent variables are jointly zero. If the test statistics is greater than
the critical value, the null hypothesis can be rejected. The following table shows our results.
Table 12: Heteroskedasity Test (White Test)
The test is rejected and due to this we can suspect that we have heteroskedasticity issues
meaning that the standard errors could be too big or too small and therefore leading to
incorrect inferences. To mitigate this, the variables can be logged or the standard errors can be
corrected for heteroskedasticity. Since all non-dummy variables are already logged, the
Dependent variable: CARadj Coefficient t-Statistic Prob.
Insider buyer -3,27% -0,447 0,66
Active buyer 2,30% 0,504 0,62
LN (issue size) -1,08% -0,732 0,47
LN (issue size divided by firm size) 1,83% 0,805 0,42
Regulated market 4,91% 0,808 0,42
Financial restructuring -0,30% -0,066 0,95
Intercept 9,84% 1,248 0,22
R-squared 0,028
Observations 59
F-statistic 2,706 Prob, F(22,36) 0,0039
Obs*R-squared 36,766 Prob, Chi-Square(22) 0,0251
Scaled explained SS 40,057 Prob, Chi-Square(22) 0,0106

40
standard errors will be corrected. When doing so, the results do not differ that much from the
original regression. More details on this test can be found in appendix I.
5.5.3. Regression robustness tests
To further challenge the regression, since all the variables were insignificant in the initial
regression, several scenarios will be tested. While constructing the model used for testing our
hypotheses, several assumptions were made. In this section, multiple regressions are run with
a slight modification in order to test the regression for robustness. The following table gives
an overview on the different regressions.
Table 13: Regression of abnormal returns for private placements in Sweden 2009-2014
The significance level is divided into three different levels and marked in the table with: * for 10% level ** for 5% level; ***
for 1% level.
Most of the regressions are consistent with the results from the initial regression. Three
findings are noteworthy. Firstly, there are still no significant results for the buyers. The only
result which is consistent for all regressions is the insider buyer, having a negative coefficient
in relation to the base group. Secondly, using a different event window decreases the p-value
for most variables and the results are similar to the initial regression. Thirdly, the results were
heavily affected by the excluded outliers especially for the active buyer. Below follows a
motivation for testing the different scenarios and a description per scenario of the results
compared to the initial regression.
Dependent variable:
CARadj Coefficient Prob. Coeff. Prob. Coeff. Prob. Coeff. Prob. Coeff. Prob. Coeff. Prob. Coeff. Prob.
Insider buyer -3,3% 0,66 -7,1% 0,33 -10,9% 0,19 -20,6% 0,11 -6,0% 0,42 -4,4% 0,57 -9,0% 0,22
Active buyer 2,3% 0,62 0,0% 0,99 0,0% 0,99 -5,0% 0,54 0,7% 0,88 1,1% 0,82 4,4% 0,34
Mixed buyer -4,5% 0,58
LN (issue size) -1,1% 0,47 -2,4% 0,12 -1,4% 0,34 -0,2% 0,93 -2,0% 0,19 -1,2% 0,44 -1,4% 0,33
LN (issue size divided
by firm size) 1,8% 0,42 4,3%* 0,09 1,8% 0,43 0,9% 0,81 2,9% 0,25 2,2% 0,36 1,4% 0,53
Firm size
Regulated market 4,9% 0,42 7,8% 0,20 8,0% 0,22 1,6% 0,88 6,8% 0,26 4,7% 0,45 7,6% 0,21
Financial restructuring -0,3% 0,95 1,7% 0,70 0,4% 0,94 0,1% 0,99 0,9% 0,84 -0,1% 0,99 -1,2% 0,79
Intercept 9,8% 0,22 19,5%** 0,03 11,2% 0,16 13,2% 0,33 15,25%* 0,10 12,0% 0,18 7,6% 0,33
R-squared 0,03 0,09 0,06 0,05 0,06 0,03 0,08
Adjusted R-squared -0,08 -0,03 -0,07 -0,05 -0,07 -0,10 -0,03
Prob(F-statistic) 0,956 0,616 0,824 0,819 0,828 0,967 0,635
Observations 59 54 51 64 53 59 59
Another event
windowInitial regression
Excl financial
industry
Multiple
announcements
Including
outliers
Excluding mixed
buyers
Change base
group

41
5.5.3.1. Excluding financial industry
The first test excludes financial institutions since it is argued that financial institutions work
under different business circumstances. In our sample, there are five events of financial
institutions announcing a private placement. The result is mostly consistent with the initial
regression. The most noteworthy finding is that the coefficient for active buyer is now 0%
compared to 2,3% in the initial regression and that would indicate that there is no difference
between the base group and active buyers. This regression has one significant variable which
is the logged variable of issue size divided by company size.
5.5.3.2. Excluding multiple SEO announcements
When the company announces a private placement, sometimes they publish that another issue
type is done simultaneously. As explained in the empirical findings, SEO announcements lead
in general to negative market reactions. In case that a rights issue or a public issue is
announced at the same time as a private placement, the announcement effect of the private
placements could be affected. By challenging our regression for such events, we exclude the
events with multiple issue types at the same time. This is consistent with Wruck (1989) who
does the same in her study. The results are very similar to the initial regression and still no
significant variables. The active buyer coefficient is 0%, and the insider buyer coefficient is
-10,9% compared to -3,3% in the initial regression.
5.5.3.3. Including outliers
When excluding outliers, our assumption was that they would disturb the results of the
regression and might lead to faulty coefficients. It can clearly be stated that including outliers
leads to very different results. The biggest difference is that in this regression the active buyer
category has a coefficient of -5% compared to the initial regression where it is 2,3%. This
would lead to a different conclusion when testing the hypothesis.
5.5.3.4. Excluding mixed buyers
According to Yeh and Ma (2012) only main buyer categories should be included in order to
obtain more accurate results. The main categories are insider, active and passive buyers. To
test if this changed our regression output, the six events with mixed buyers were excluded.
Compared to our initial regression the results only changed for the intercept which is now
significant at a 10% level.

42
5.5.3.5. Change of the base group
In our model we included both the mixed group and passive buyers in the base group of the
regression. With this test we want to investigate whether there is a difference by only
including passive investors in the base group. The result shows that the mixed group has a
negative coefficient and would then result in a lower abnormal return than the passive buyers.
For both insider and active buyers the results are consistent with the initial regression.
5.5.3.6. Other event window as dependent variable
The same event window, namely (-1,0), that was used by Barclay et al. (2007) will be applied
to our regression. We will not test the event window of (-3,0) that Wruck (1989) and Hertzel
and Smith (1993) used since it does not produce significant results in our event study. The
table with the different event windows can be found in the theoretical framework. Below the
additional event study results are presented.
Table 14: Cumulative abnormal returns for two new event windows
The significance level is divided into three different levels: * - 10% level ** - 5% level; *** - 1% level. The number of
events is 59, i.e. the outliers identified earlier are excluded here as well.
The results of using a different event window are that the p-values are lowered. The
coefficients generate roughly the same results as in the initial regression that had much higher
p-values. The result tells us that it makes sense to run the regression with other event windows
than the ±1 day CARadj used in the initial regression. In the next section all significant event
windows will be tested.
5.5.4. Regression for all significant event windows
In the table below the regression is presented for all the significant event windows from the
event study. This is to investigate if the significance of the variables is changing depending on
the number of days included. All dependent variables are adjusted for discounts.
Event window
Variance
(mean CAR) CAR mean T-statistics
Significance
level
CARadj
mean
CAR -1, 0 0,000 3,11% 1,92 * 3,20%
CAR -3, 0 0,001 2,29% 1,00 2,38%

43
Table 15: Cumulative abnormal returns for two new event windows
The significance level is divided into three different levels: * - 10% level ** - 5% level; *** - 1% level.
The results show that the insider buyer variable becomes significant for three of the larger
event windows. The control variable, LN(issues size), generates significant results for the two
largest windows and the intercept is also significant for some windows compared to the initial
regression. By testing larger event windows the insider buyer variable shows statistically
significant lower abnormal returns compared to passive and mixed buyers. By completing the
description of the empirical results we can now move on to the analysis chapter.
Dependent variable: CARadj
(-1,1)
CARadj
(0,1)
CARadj
(-1,2)
CARadj
(-2,2)
CARadj
(-3,3)
CARadj
(-4,4)
CARadj
(-5,5)
CARadj
(-6,6)
Coefficient Coeff. Coeff. Coeff. Coeff. Coeff. Coeff. Coeff.
Insider buyer -3,3% -0,2% -8,1% -8,4% -3,2% -16,64%* -22,12%** -22,71%*
Active buyer 2,3% 5,4% 3,7% 3,3% 8,1% 5,9% 5,6% 2,6%
LN (issue size) -1,1% -0,3% -1,2% -2,96%* -1,1% -2,5% -3,49%* -4,28%*
LN (issue size divided
by firm size) 1,8% 0,0% 2,2% 3,9% 2,1% 3,0% 4,5% 3,4%
Regulated market 4,9% 3,6% 5,7% 11,13%* 5,8% 8,5% 8,9% 6,7%
Financial restructuring -0,3% -6,5% -7,2% -7,5% 0,1% -3,0% -6,4% -10,9%
Intercept 9,8% 2,4% 11,5% 18,38%** 7,0% 15,72%* 24,20%** 26,76%*
R-squared 0,03 -0,06 0,07 0,11 0,07 0,13 0,16 0,11
Adjusted R-squared -0,08 0,15 -0,04 0,01 -0,04 0,03 0,07 0,01
Prob(F-statistic) 0,956 0,373 0,678 0,399 0,719 0,287 0,143 0,373
Observations 59 59 59 59 59 59 59 59

44
6. ANALYSIS AND DISCUSSION
In this chapter both the empirical results of the event study and the regression are analysed
and set in a context. Similarities and differences of the results compared with the theoretical
framework and previous empirical findings are identified and discussed. By doing so, the
developed research hypotheses are either confirmed or rejected.
6.1. ABNORMAL RETURNS
The first part of the analysis relates the empirical results of the event study to the theoretical
framework. By doing so, the first research hypothesis is answered. For this purpose the total
sample and the different buyer groups are analysed separately.
6.1.1. Event study results for total sample
Our first research hypothesis H1 states that the announcement of private placements leads to
positive short-term abnormal returns. As described in the empirical findings chapter, previous
studies have resulted in positive short-term abnormal returns to private placements both in the
US (Wruck, 1989; Hertzel & Smith, 1993) and in Sweden (Molin, 1996; Cronqvist & Nilsson,
2005). However, the stock price reactions of previous studies differ heavily in magnitude. The
table below sums up previous findings compared to the result of the event study in this thesis.
Table 16: Comparing our results to previous findings of short-term AR
The significance level is divided into three levels: * -10% level; ** -5% level; *** -1% level.
Our event study results in the empirical results chapter show that there are positive abnormal
returns for the event window (-1,1) of 4,64% for the whole sample which are statistically
significant at a 5% significance level. Hypothesis H1 can thus be confirmed. By comparing
the different event windows our cumulative abnormal returns can be compared to other
studies to some extent. Nevertheless, it is difficult to compare the results since the different
studies distinguish among other in sample size, firm characteristics and market settings. To
improve comparability, the same methodology as the mentioned authors in table 15 has been
applied to our sample. By doing so, the results become more comparable. Our findings for
Authors Market Sample period Sample size CAR (-3,0) CAR (-1,1) CAR (-1,0)
Wruck (1989) US 1979-1985 99 4,5%** - 1,9%*
Hertzel & Smith (1993) US 1980-1987 106 1,7%** - -
Molin (1996) Sweden 1986-1994 76 - 3,2%*** -
Cronqvist & Nilsson (2005) Sweden 1986-1999 136 - 7,3%*** -
Barclay et al. (2007) US 1979-1997 594 - - 1,7%***
Into & Treyer (2015) Sweden 2009-2014 59 3,11%* 4,64%** 2,29%

45
CAR (-3,0) range between the previous studies which is likewise the case for CAR (-1,1).
However, for CAR (-1,0) our findings are higher than those investigated by previous studies
but also insignificant.
6.1.2. Private placement buyers
Information asymmetry and agency theory is explained by the research community to impact
the short-term abnormal returns differently for each buyer group. By analysing the event
study results and comparing them to the theories, a first step can be taken to investigate if the
theoretical assumptions hold.
Table 17: CAR after adjustment for outliers over the event window: ±1 day
Degrees of freedom are calculated by taking the number of events -1. The significance level is divided into three different
levels, t-statistics for 2-tailed test with different degrees of freedom: * - 10% level ** - 5% level; *** - 1% level.
Active buyers show the highest average CAR (5,82%) while insider buyers (2,87%) and
mixed buyers (2,52%) show the lowest ones. According to Barclay et al. (2007), positive
results are expected for active buyers who are perceived more favourably by the market than
passive buyers which is consistent with our results. Comparing our results for the passive
buyers with those of Barclay et al. (2007), we find likewise that passive buyers have higher
average CAR than insider buyers. Both Barclay et al. (2007) and we find that the passive
buyer group is the only group showing significant results.
Insiders together with the mixed buyers show the lowest abnormal returns among the different
buyer categories. The low insider CAR is consistent with Barclay et al. (2007) which
investigate for insiders a result of -0,7%, however statistically insignificant. The portion of
insiders is about the same in both studies, we have 14% insiders in our sample which is
likewise the case for Barclay et al.’s (2007) sample with 13%. There are no previous results
for mixed buyers on abnormal returns. Since we have insignificant results and a small sample,
it makes it difficult to draw any general conclusions. The average CAR for the mixed buyers
are the lowest (2,52%) in the whole sample which is a bit surprising since one could expect
that the average CAR for mixed buyers is close to the average CAR of the whole sample
(4,64%).
Buyer All Insider buyer Active buyer Passive buyer Mixed
Degrees of free. 58 7 24 20 5
Var(meanCAR) 0,0004 0,0030 0,0013 0,0004 0,0056
CARmean 4,64% 2,87% 5,82% 3,94% 2,52%
T-statistics 2,3379 0,5258 1,6232 1,9289 0,3356
Significance level ** *

46
Our results of the event study divided per buyer are a first indication that there are differences
among the different buyer groups. In order to find out if the presented theories apply to this
study, it is not enough to do only an event study. By analysing discounts and premiums, as
well as regressions, more sophisticated insights can be gained.
6.2. DISCOUNTS AND PREMIUMS
Our results show that private placements are on average made at a premium to the stock price
which contrasts previous studies such as those of Wruck (1989), Hertzel and Smith (1993)
and Barclay et al. (2007) who all find discounts. Our findings are not straightforward because
the majority of the private placement buyers, 58% in our sample, gets a discount. When
analysing the different buyer categories, Barclay et al. (2007) state that insiders can benefit
from self-interested private placement deals by issuing private placements at a discount.
However, our results do not confirm that since insiders pay on average a premium in our
sample. Our results show that the active buyers pay more than the passive buyers which is
however consistent with the theory.
The effect from the discount or premium on the abnormal returns is filtered out in order to
enable us to study the effect from the information asymmetry and agency theories on the AR
for the different buyers. This is also done by Molin (1996) and Wruck (1989) but not by
Barclay et al. (2007). By doing so, we add another dimension to Barclay et al.’s paper, which
is one of the reference papers for this study.
6.3. INTERPRETATION OF REGRESSION RESULTS
This section is divided in two parts, to reject or confirm the second and third hypothesis. The
first section evaluates if insider buyers have the lowest abnormal returns. The second section
discusses if the active buyers have the highest abnormal returns.
6.3.1. Insider buyers show the lowest abnormal returns
The second hypothesis H2 states that insider buyers have lower abnormal returns than passive
and mixed buyers. In our regression, we find that insider placements have the statistically
significant lowest adjusted abnormal returns for larger event windows. This is confirming the
hypothesis. When running the original regression for a narrow event window we do not get
significant results. We challenged if the ±1 day event window was the most appropriate event

47
window to study the market’s reaction to different private placement buyers. By doing so and
testing larger event windows as the dependent variable, significant results were obtained.
The announcement effect to insider buyers is described in the theory as a mix between the
positive reaction from the signalling theory from Leland and Pyle (1977) and negative
reactions due to managerial entrenchment as described by Molin (1996) and Barclay et al.
(2007). With our results in mind the market's reaction can best be explained by the managerial
entrenchment hypothesis stating that there is a risk for insider opportunism when private
placements are directed to insiders. The theory is that they are trying to benefit from deal on
the behalf of the current shareholders leading to a wealth transfer (Molin, 1996). The positive
effect from Leland and Pyle’s (1977) signalling theory is weak. The theory highlights that
when insiders increase ownership, it transfers a positive signal to the market. The negative
impact in our regression of insider buyers compared to mixed and passive buyers does not
support Jensen and Meckling’s (1976) convergence-of-interest theory. They argue that
increased insider ownership leads to more aligned interests between managers and
shareholders and therefore results in positive market reactions.
6.3.2. Active buyers have insignificant results
This section relates to the third hypothesis H3 stating that active buyers are expected to lead to
higher abnormal returns than passive and mixed buyers. We do not find any significant results
for the active buyers in the initial regression and due to this the hypothesis is rejected. Due to
the insignificant results from the regression some robustness tests are done to challenge the
model. The rejection of the hypothesis after the initial regression is strengthened by the mixed
results in the robustness test.
The third hypothesis is built on the monitoring hypothesis (Wruck, 1989) and the information
hypothesis (Hertzel & Smith, 1993). The monitoring hypothesis (Wruck, 1989) states that the
buyers in this category take an active role in the company, either by becoming a larger
shareholder, a strategic partner or an investor with a long-term commitment. With these roles
the buyer is in a position to monitor management (Wruck, 1989). The information hypothesis
is when a well-informed investor invests in the company through a private placement, it
transfers a positive sign to the market (Hertzel & Smith, 1993; Lee & Kocher, 2001). By
rejecting our hypothesis, we conclude that these two theories provide weak evidence on the
market's reaction to private placement announcement in the Swedish market environment.
The weak support for the monitoring hypothesis and the information hypothesis is consistent

48
with Barclay et al.'s (2007) findings. Due to the high initial ownership concentration in the
Swedish equity market, the private placement most likely will result in a decrease of
ownership concentration rather than in an increase. This is why less weight should be put on
the monitoring hypothesis as an explanatory hypothesis for the reaction of the market.

49
7. CONCLUSION
This chapter sums up the main conclusions of this study. The research aims and the research
objectives are firstly presented. Suggestions for future research on the studied topic are
finally proposed.
7.1. RESEARCH AIM AND RESEARCH OBJECTIVES
This thesis investigates the following research question: Is there a difference in the short-
term announcement effects of equity private placements depending on the investor’s
involvement with the issuing firms in terms of information asymmetry and agency
conflicts?
To answer this question, an event study methodology was used to get first findings on the
abnormal returns for private placements for the total sample and for the investigated buyer
groups: insider buyer, active buyer, passive buyer and mixed. We find positive abnormal
returns for the total sample of the private placements. As a result, the first hypothesis that the
announcement of private placements leads to positive short-term abnormal returns, can be
confirmed. Different abnormal returns for the different buyer groups were investigated,
among those the active buyers show the highest abnormal returns and the passive and mixed
buyers the lowest ones.
To filter out the pricing effects from the abnormal returns we adjust the abnormal returns for
discounts and premiums. This allows to better evaluate how the different theories explain the
abnormal returns. The adjusted abnormal return is then used as the dependent variable in a
cross-sectional regression. The regression is used to control how other variables, besides the
buyers, affect the abnormal returns.
To answer our second hypothesis, stating that insider buyers have lower abnormal returns
than passive and mixed buyers, we analyze the results from the regression. What we find is,
that insider placements have the lowest abnormal returns compared to passive and mixed
buyers. The second hypothesis can therefore be confirmed. The results are explained by the
managerial entrenchment hypothesis pointing out that there is a risk for insider opportunism
when private placements are purchased by insiders (Molin, 1996). Our findings show weak
support for the signaling theory (Leland & Pyle, 1977) and for the convergence of interest
theory (Jensen & Meckling, 1976).
50
The third hypothesis states that active buyers lead to higher abnormal returns than passive and
mixed buyers to a private placement. We find conflicting results in our initial regression
compared to the robustness checks and due to this the hypothesis is rejected. By not being
able to confirm it, we consider that the monitoring hypothesis and the information hypothesis
support weak evidence to the market's reaction to private placement announcement in the
Swedish market environment. According to the monitoring hypothesis, a private placement
increases the ownership concentration. The weak support for the monitoring hypothesis can
be explained by the high initial ownership concentration for the Swedish market.
We come to the conclusion that the type of investor in a private placement has an effect on
how the market reacts to the announcement. The announcement of an insider buyer results in
a low positive abnormal return. We cannot confirm that active buyers result in the highest
abnormal returns compared to the others. The market reactions are therefore best supported by
the managerial entrenchment hypothesis whereas the information and monitoring hypotheses
gain weak support.
This study investigates how the relationship of the private placement investors with the
issuing company affects the short-term market reactions in Sweden. By rejecting that the
active investor gets the highest abnormal returns we dismiss that the monitoring hypothesis
explains the market’s reaction when the initial ownership is high, which is the case for
Sweden. Therefore the managerial entrenchment hypothesis is concluded to provide a better
explanation to the abnormal returns in this specific market setting.
7.2. FURTHER RESEARCH
Further research is recommended for two different dimensions:
1. The different buyer categories of private placement buyers have not been much studied
except by Barclay et al. (2007) in the US. According to Bortoletti et al. (2008), SEOs are
particularly conducted as rights offerings or private placements for stock markets outside the
USA. Therefore, further research would be interesting in order to test the theories for different
market environments. By doing so, stronger evidence can be found for market reactions.
2. Our empirical data shows that companies do not only address one type of buyer in private
placements. Since mixed buyers have not been investigated a lot, it is recommended to
include this private placement buyer categorization in the research.

51
REFERENCES Books
Aliaga, M. & Gunderson, B. (2002). Interactive statistics, New Jersey: Prentice Hall.
Brooks, C. (2008). Introductory Econometrics for Finance, Cambridge: Cambridge University
Press.
Bryman, A. (2004). Social Research Methods, 2nd
edition, Oxford: Oxford University Press.
Bryman, A. & Bell, E. (2011). Business research methods, 3rd
edition, Oxford: Oxford
University Press.
Eckbo, B.E. & Masulis, R.W. (1995). Seasoned Equity Offerings: A Survey, Handbook of
Corporate Finance: Empirical Corporate Finance, 1st edition, North-Holland/Elsevier, Chapter
6.
Eckbo, B. (2006). Handbook of Corporate Finance: Empirical Corporate Finance (A),
Handbooks in Finance Series, Berlin: Elsevier/North-Holland:
Hillier, D. & Ross, S.A. (2013). Corporate Finance, Columbus: McGraw Hill Higher
Education.
Lewis, P.; Thornhill, A.; Saunders, N. (2009). Research Methods for Business Students, 5th
Edition, Essex: Pearson Education Limited.
Merriam, S.B. (1988). Case Study Research in Education: A qualitative approach, San
Francisco: Jossey-Bass.
Patel, R. & Davidson, B. (2003). Forskningsmetodikens grunder – Att planera, gemomföra
och rapportera en undersökning, Lund: Studentlitteratur.
Wiedersheim, P.F. & Eriksson, L.T. (1982). Att utreda och rapportera, 2nd
edition, Malmö:
LiberFörag.
Yin, R.K. (2003). Case study research: Design and methods, 3rd
edition, Thousand Oaks:
Sage.
Articles
Asquith, P. & Mullins D. (1986). Equity issues and offering dilution, Journal of Financial
Economics 15, North Holland, 61-89.
Barclay, M.J.; Holderness C.G.; Sheehan, D.P. (2007). Private placements and managerial
entrenchment, Journal of Corporate Finance 13, 461-484.
Barclay, M.J. & Litzenberger, R.H. (1988). Announcement effects of new equity issues and
the use of intraday price data, Journal of Financial Economics 21, 213-232.
Bergman, M. (2011). Tidsbestämning av svensk konjunktur 1970-2010 – Rapport till
Finanspolitiska rådet 2011/2, Københavns Universitet.
Binder, J. (1998). The event study methodology since 1969, Review of Quantitative Finance
and Accounting (11), 111-137.

52
Brown, S. & Warner, J. (1985). Using daily stock returns: The case of event studies, Journal
of Financial Economics 14, 3-31.
Corwin, S.A. (2003). The Determinants of Underpricing for Seasoned Equity Offers, Journal
of Finance 58, 2249-2279.
Dann, L.Y. & DeAngelo, H. (1988). Corporate financial policy and corporate control: a study
of defensive adjustments in asset and ownership structure, Journal of Financial Economics
20, 87-127.
DeAngelo, H.; DeAngelo, L.; Stulz, R.M. (2010). Seasoned equity offering, market timing,
and the corporate lifecycle, Journal of Financial Economics 95, 275-295.
Eckbo, B.E. & Masulis, R.W. (1992). Adverse selection and the rights offer paradox, Journal
of Financial Economics 32, 293-332.
Fama, E.F; Fisher, L.; Jensen, M.C.; Roll, R. (1969). The Adjustment of Stock Prices to New
Information, International Economic Review, Vol. 10, No. 1, 1-21.
Freeman, R. (1987). The association between accounting earnings and security returns for
large and small firms, Journal of Accounting and Economics 9, 195-228.
Gajewski, J.F.; Ginglinger, E. (2002). Seasoned Equity Issues in a closely held market:
Evidence from France, European Finance Review 6, No. 3, 291-319.
Gao, X. & Ritter, J.R. (2010). The Marketing of Seasoned Equity Offerings, Journal of
Financial Economics, 33-52.
Harjoto, M. & Garen, J. (2003). Why do IPO firms conduct primary Seasoned Equity
Offerings?, The Financial Review 38, 103-125.
Hertzel, M., Smith, R.L. (1993). Market discounts and shareholder gains for placing equity
privately, The Journal of Finance 48, 459-485.
Hull, R.M; Kwak, S.; Walker, R.L. (2010). Insider signaling and seasoned equity offerings,
Managerial Finance 36, 703-721.
Jensen, M.C. & Meckling, W.H. (1976). Theory of the firm: Managerial behavior, agency
costs and capital structure, Journal of Financial Economics 3, 305-360.
Kim E.H. & Purnanandam, A. (2006), Why do investors react negatively to Seasoned Equity
offerings?, Ross School of Business Working Paper Series No. 1043 (2006).
Kim, W. & Weisbach, M. S. (2008). Motivations for Public Equity Offers: An International
Perspective, Journal of Financial Economic 87, 281-307.
Korajczyk R.A., Lucas, D.J., McDonald, R.L. (1990). Understanding stock price behavior
around the time of equity issue, In: R. Glenn Hubbard: Asymmetric Information, Corporate
Finance and Investment, University of Chicago Press, Chicago.
Krishnamurthy, S.; Sindt, P.; Subramaniam, V.; Woidtke, T. (2005). Does investor identity
matter in equity issues? Evidence from private placements, Journal of Financial
Intermediation 14, 210-238.

53
Lee, H.W. & Kocher, C. (2001). Firm Characteristics and Seasoned Equity Issuance Method.
Private Placements versus Public Offering, The Journal of Applied Business Research 17, 23-
36.
Leland, H.E. & D.H. Pyle, (1977). Informational asymmetries, financial structure, and
financial intermediation, The Journal of Finance 32, 371-387.
MacKinlay, C.A. (1997). Event studies in economics and finance, Journal of Economic
Literature, Vol. 35, issue 1, 13-39.
Malhotra, M.K. & Grover, V. (1998). An assessment of survey research in POM: from
constructs to theory, Journal of Operations Management, Vol. 16, No. 17, 407-425.
Masulis, R. & Korwar, A. (1986). Seasoned equity offerings – an empirical investigation,
Journal of Financial Economics 15, North Holland, 91-118.
Mikkelson, W.H. & Partch, M.M. (1985) Stock price effects and costs of secondary
distributions, Journal of Financial Economics 14, 165-194.
Modigliani, F. & Miller, M.H. (1958). The cost of capital, corporation finance, and the theory
of investment, American Economic Review 48, 261-297.
Molin, J. (1996). Shareholder gains from equity private placements: Evidence from the
Stockholm Stock Exchange, Working paper, Stockholm School of Economics.
Myers, S.C. & Majluf, N.S. (1984). Corporate financing and investment decisions when firms
have information that investors do not have, Journal of Financial Economics 13, 187-221.
Ritter, J.R. (1991). The long-run performance of initial public offerings, Journal of Finance
46, 3-28.
Roberts, M.R. & Whited, T.M. (2012). Endogeneity in Empirical Corporate Finance, Simon
School Working Paper, 11-29.
Skog, R. (2004). Kontantemissioner av aktier i svenska aktiemarknadsbolag i nyemissioner av
aktier – de lege lata och de lege ferenda, Stockholm: Stockholm Centre for Commercial Law,
10.
Smith, C. (1986). Investment banking and the capital acquisition process, Journal of
Financial Economics 15 (1986), North Holland, 3-29.
Wruck, K. (1989). Equity ownership concentration and firm value: Evidence from private
equity financings, Journal of Financial Economics 23, 3-28.
Wu, Y. (2004). The choice of equity-selling mechanisms, Journal of Financial Economics 74,
93-119.
Yeh, C.Y. & Ma, T. (2012). Why do insider sometimes pay more and sometimes pay less in
private placements?, The International Journal of Business and Finance Research, Volume 6,
Number 2, 35-52.

54
Internet Sources
Finansinspektionen (2015). Börser och Aktiehandel, [Online] Available at:
http://www.fi.se/Folder-SE/Konsument/Fragor-och-svar/Spara/Borser-och-aktiehandel1/
[Accessed 27 May 2015].
Nasdaq (2015). Definition of public offering, [Online] Available at:
http://www.nasdaq.com/investing/glossary/p/public-offering
[Accessed 16 May 2015].
Nyemissioner (2015). Nyemissioner, [Online] Available at:
http://nyemissioner.se/foretag/nyemissioner/sok
[Accessed 22 May 2015].
Skatteverket (2015). Aktiehistorik, [Online] Available at:
http://www.skatteverket.se/privat/skatter/vardepapper/aktiehistorik.4.dfe345a107ebcc9baf800
09051.html
[Accessed 12 May 2015].
Databases
- Aktietorget
- NASDAQ OMX Stockholm
- NGM
- Thomson Reuters Datastream
- Thomson Reuters Eikon
- Thomson Reuters SDC

55
APPENDICES
Appendix A: Seasoned Equity Offerings in Sweden 2008-2014 per issue type
Definitions used for dividing the sample into the different issue types.
Issue type 2008 2009 2010 2011 2012 2013 2014 Grand Total
Rights offering 46 72 63 79 103 107 95 565
IPO 15 14 29 19 12 19 61 169
Private placement 3 5 12 30 43 35 128
Public offering 1 3 5 9 19 27 36 100
Cancelled 3 1 4 8
Grand Total 65 92 102 119 165 196 231 970
Definition Description
Rights offering To current shareholders with precendence right to the new issued shares
IPO No trading of the stock have been performed on the mentioned market
Private placement To one or a few new shareholders
Public offering To current and new shareholders eithout precendence right for the current
Cancelled Announced issues that later was cancelled
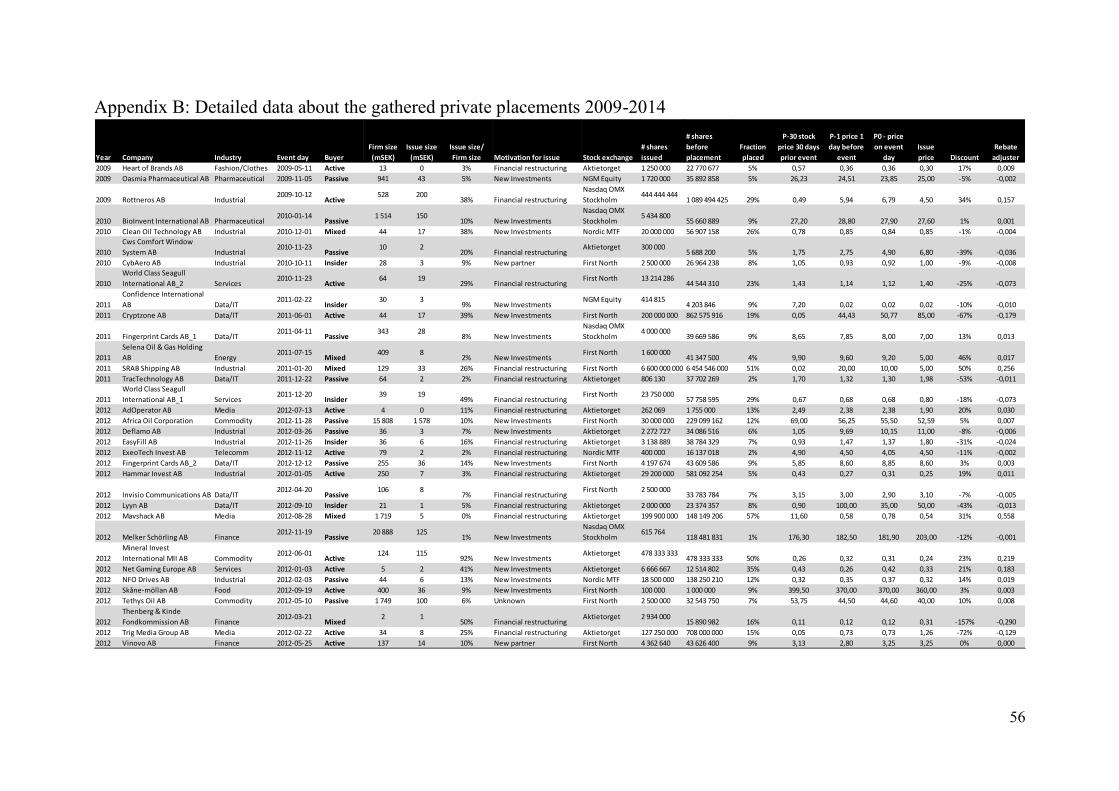
56
Appendix B: Detailed data about the gathered private placements 2009-2014
Year Company Industry Event day Buyer
Firm size
(mSEK)
Issue size
(mSEK)
Issue size/
Firm size Motivation for issue Stock exchange
# shares
issued
# shares
before
placement
Fraction
placed
P-30 stock
price 30 days
prior event
P-1 price 1
day before
event
P0 - price
on event
day
Issue
price Discount
Rebate
adjuster
2009 Heart of Brands AB Fashion/Clothes 2009-05-11 Active 13 0 3% Financial restructuring Aktietorget 1 250 000 22 770 677 5% 0,57 0,36 0,36 0,30 17% 0,009
2009 Oasmia Pharmaceutical AB Pharmaceutical 2009-11-05 Passive 941 43 5% New Investments NGM Equity 1 720 000 35 892 858 5% 26,23 24,51 23,85 25,00 -5% -0,002
2009 Rottneros AB Industrial2009-10-12
Active528 200
38% Financial restructuring
Nasdaq OMX
Stockholm444 444 444
1 089 494 425 29% 0,49 5,94 6,79 4,50 34% 0,157
2010 BioInvent International AB Pharmaceutical2010-01-14
Passive1 514 150
10% New Investments
Nasdaq OMX
Stockholm5 434 800
55 660 889 9% 27,20 28,80 27,90 27,60 1% 0,001
2010 Clean Oil Technology AB Industrial 2010-12-01 Mixed 44 17 38% New Investments Nordic MTF 20 000 000 56 907 158 26% 0,78 0,85 0,84 0,85 -1% -0,004
2010
Cws Comfort Window
System AB Industrial2010-11-23
Passive10 2
20% Financial restructuringAktietorget 300 000
5 688 200 5% 1,75 2,75 4,90 6,80 -39% -0,036
2010 CybAero AB Industrial 2010-10-11 Insider 28 3 9% New partner First North 2 500 000 26 964 238 8% 1,05 0,93 0,92 1,00 -9% -0,008
2010
World Class Seagull
International AB_2 Services2010-11-23
Active64 19
29% Financial restructuringFirst North 13 214 286
44 544 310 23% 1,43 1,14 1,12 1,40 -25% -0,073
2011
Confidence International
AB Data/IT2011-02-22
Insider30 3
9% New InvestmentsNGM Equity 414 815
4 203 846 9% 7,20 0,02 0,02 0,02 -10% -0,010
2011 Cryptzone AB Data/IT 2011-06-01 Active 44 17 39% New Investments First North 200 000 000 862 575 916 19% 0,05 44,43 50,77 85,00 -67% -0,179
2011 Fingerprint Cards AB_1 Data/IT2011-04-11
Passive343 28
8% New Investments
Nasdaq OMX
Stockholm4 000 000
39 669 586 9% 8,65 7,85 8,00 7,00 13% 0,013
2011
Selena Oil & Gas Holding
AB Energy2011-07-15
Mixed409 8
2% New InvestmentsFirst North 1 600 000
41 347 500 4% 9,90 9,60 9,20 5,00 46% 0,017
2011 SRAB Shipping AB Industrial 2011-01-20 Mixed 129 33 26% Financial restructuring First North 6 600 000 000 6 454 546 000 51% 0,02 20,00 10,00 5,00 50% 0,256
2011 TracTechnology AB Data/IT 2011-12-22 Passive 64 2 2% Financial restructuring Aktietorget 806 130 37 702 269 2% 1,70 1,32 1,30 1,98 -53% -0,011
2011
World Class Seagull
International AB_1 Services2011-12-20
Insider39 19
49% Financial restructuringFirst North 23 750 000
57 758 595 29% 0,67 0,68 0,68 0,80 -18% -0,073
2012 AdOperator AB Media 2012-07-13 Active 4 0 11% Financial restructuring Aktietorget 262 069 1 755 000 13% 2,49 2,38 2,38 1,90 20% 0,030
2012 Africa Oil Corporation Commodity 2012-11-28 Passive 15 808 1 578 10% New Investments First North 30 000 000 229 099 162 12% 69,00 56,25 55,50 52,59 5% 0,007
2012 Deflamo AB Industrial 2012-03-26 Passive 36 3 7% New Investments Aktietorget 2 272 727 34 086 516 6% 1,05 9,69 10,15 11,00 -8% -0,006
2012 EasyFill AB Industrial 2012-11-26 Insider 36 6 16% Financial restructuring Aktietorget 3 138 889 38 784 329 7% 0,93 1,47 1,37 1,80 -31% -0,024
2012 ExeoTech Invest AB Telecomm 2012-11-12 Active 79 2 2% Financial restructuring Nordic MTF 400 000 16 137 018 2% 4,90 4,50 4,05 4,50 -11% -0,002
2012 Fingerprint Cards AB_2 Data/IT 2012-12-12 Passive 255 36 14% New Investments First North 4 197 674 43 609 586 9% 5,85 8,60 8,85 8,60 3% 0,003
2012 Hammar Invest AB Industrial 2012-01-05 Active 250 7 3% Financial restructuring Aktietorget 29 200 000 581 092 254 5% 0,43 0,27 0,31 0,25 19% 0,011
2012 Invisio Communications AB Data/IT2012-04-20
Passive106 8
7% Financial restructuringFirst North 2 500 000
33 783 784 7% 3,15 3,00 2,90 3,10 -7% -0,005
2012 Lyyn AB Data/IT 2012-09-10 Insider 21 1 5% Financial restructuring Aktietorget 2 000 000 23 374 357 8% 0,90 100,00 35,00 50,00 -43% -0,013
2012 Mavshack AB Media 2012-08-28 Mixed 1 719 5 0% Financial restructuring Aktietorget 199 900 000 148 149 206 57% 11,60 0,58 0,78 0,54 31% 0,558
2012 Melker Schörling AB Finance2012-11-19
Passive20 888 125
1% New Investments
Nasdaq OMX
Stockholm615 764
118 481 831 1% 176,30 182,50 181,90 203,00 -12% -0,001
2012
Mineral Invest
International MII AB Commodity2012-06-01
Active124 115
92% New InvestmentsAktietorget 478 333 333
478 333 333 50% 0,26 0,32 0,31 0,24 23% 0,219
2012 Net Gaming Europe AB Services 2012-01-03 Active 5 2 41% New Investments Aktietorget 6 666 667 12 514 802 35% 0,43 0,26 0,42 0,33 21% 0,183
2012 NFO Drives AB Industrial 2012-02-03 Passive 44 6 13% New Investments Nordic MTF 18 500 000 138 250 210 12% 0,32 0,35 0,37 0,32 14% 0,019
2012 Skåne-möllan AB Food 2012-09-19 Active 400 36 9% New Investments First North 100 000 1 000 000 9% 399,50 370,00 370,00 360,00 3% 0,003
2012 Tethys Oil AB Commodity 2012-05-10 Passive 1 749 100 6% Unknown First North 2 500 000 32 543 750 7% 53,75 44,50 44,60 40,00 10% 0,008
2012
Thenberg & Kinde
Fondkommission AB Finance2012-03-21
Mixed2 1
50% Financial restructuringAktietorget 2 934 000
15 890 982 16% 0,11 0,12 0,12 0,31 -157% -0,290
2012 Trig Media Group AB Media 2012-02-22 Active 34 8 25% Financial restructuring Aktietorget 127 250 000 708 000 000 15% 0,05 0,73 0,73 1,26 -72% -0,129
2012 Vinovo AB Finance 2012-05-25 Active 137 14 10% New partner First North 4 362 640 43 626 400 9% 3,13 2,80 3,25 3,25 0% 0,000

57
Appendix B: Detailed data about the gathered private placements 2009-2014 (cont.)
Stock prices – all prices are the closing prices in SEK
Offer price – Have been adjusted for later stock splits after the issue so that discounts could be calculated
Discount = (Price on event day-issue price)/ Price on event day
Rebate adjuster = AR0+(Issued shares/Shares before issue) * ((P0-Issue price)/P-1)
Year Company Industry Event day Buyer
Firm size
(mSEK)
Issue size
(mSEK)
Issue size/
Firm size Motivation for issue Stock exchange
# shares
issued
# shares
before
placement
Fraction
placed
P-30 stock
price 30 days
prior event
P-1 price 1
day before
event
P0 - price
on event
day
Issue
price Discount
Rebate
adjuster
2013 Active Biotech AB Pharmaceutical2013-03-06
Active4 015 270
7% Financial restructuring
Nasdaq OMX
Stockholm6 000 000
68 923 582 8% 58,25 48,80 54,00 45,00 17% 0,016
2013 Aerocrine AB Pharmaceutical2013-04-30
Passive1 751 95
5% Financial restructuring
Nasdaq OMX
Stockholm8 625 000
145 956 405 6% 12,00 11,35 12,00 11,00 8% 0,005
2013 Altero AB Industrial 2013-02-08 Active 4 1 20% Financial restructuring Aktietorget 4 674 999 26 436 122 15% 0,13 0,12 0,17 0,15 12% 0,030
2013 Beowulf Mining plc_1 Commodity 2013-07-10 Active 148 42 28% New Investments Aktietorget 66 190 476 175 800 289 27% 0,84 0,68 0,67 0,63 6% 0,022
2013 Botnia Exploration AB Commodity 2013-06-05 Active 33 6 19% New Investments Aktietorget 11 330 000 49 206 093 19% 0,68 0,57 0,58 0,55 5% 0,012
2013 Dignitana AB Pharmaceutical 2013-09-18 Passive 185 14 7% Financial restructuring First North 900 000 10 778 645 8% 17,20 16,60 17,80 15,00 16% 0,014
2013 Episurf Medical AB Pharmaceutical 2013-04-24 Passive 155 5 3% New partner First North 144 928 3 452 783 4% 45,00 61,50 61,25 34,50 44% 0,018
2013 Latvian Forest Company AB Agriculture2013-07-31
Passive34 3
8% New InvestmentsAktietorget 412 037
5 061 649 8% 6,77 6,67 6,62 6,65 0% 0,000
2013 MedicPen AB Pharmaceutical 2013-09-13 Passive 28 5 18% Financial restructuring Aktietorget 8 500 000 40 476 190 17% 0,69 0,90 1,94 0,60 69% 0,313
2013 Moberg Derma AB Pharmaceutical2013-07-02
Active347 36
10% New Investments
Nasdaq OMX
Stockholm1 080 000
10 812 572 9% 32,10 32,30 34,50 33,54 3% 0,003
2013
NeuroVive Pharmaceutical
AB Pharmaceutical2013-11-21
Passive372 35
9% New Investments
Nasdaq OMX
Stockholm2 500 000
19 159 046 12% 19,40 19,80 18,10 14,00 23% 0,027
2013
New Equity Venture
International AB Finance2013-02-14
Active18 3
18% New InvestmentsFirst North 165 000
1 276 507 11% 14,05 17,00 16,70 20,00 -20% -0,025
2013 Paynova AB Data/IT 2013-08-28 Insider 29 3 10% New partner NGM Equity 8 000 000 87 049 545 8% 0,33 0,39 0,41 0,37 10% 0,009
2013 Recyctec Holding AB Industrial 2013-11-29 Active 141 1 0% Financial restructuring Aktietorget 60 500 10 954 620 1% 12,90 10,10 10,05 10,79 -7% 0,000
2013 Star Vault AB Data/IT 2013-05-23 Active 4 1 24% New Investments Aktietorget 4 169 859 33 704 690 11% 0,12 0,10 0,10 0,23 -130% -0,161
2013
TrustBuddy International
AB Finance2013-02-11
Active72 9
12% New InvestmentsFirst North 8 000 000
72 000 000 10% 1,00 0,96 1,00 1,10 -10% -0,012
2013 VJ Since 1890 Sverige AB Retail 2013-02-11 Passive 5 0 5% New partner Aktietorget 2 500 000 128 550 000 2% 0,04 0,12 0,17 0,10 41% 0,011
2014 Amnode AB Industrial 2014-11-28 Insider 22 2 9% New Investments Aktietorget 666 667 4 951 717 12% 4,43 2,63 2,63 3,00 -14% -0,019
2014 Beowulf Mining plc_2 Commodity 2014-08-21 Mixed 118 18 15% Financial restructuring Aktietorget 53 333 333 282 820 560 16% 0,42 0,37 0,36 0,34 6% 0,011
2014 Brighter AB Pharmaceutical 2014-01-23 Active 121 25 21% New Investments Aktietorget 3 571 429 11 897 480 23% 10,18 15,97 15,13 7,00 54% 0,153
2014 Cavotec SA Industrial2014-09-12
Active2 542 189
7% New partner
Nasdaq OMX
Stockholm7 138 780
71 397 220 9% 35,60 22,00 27,30 26,50 3% 0,004
2014 Dome Energy AB Commodity 2014-03-21 Active 203 23 11% New Investments Aktietorget 2 000 000 17 234 745 10% 11,80 11,90 13,00 11,50 12% 0,015
2014 Eurocine Vaccines AB Pharmaceutical 2014-02-11 Active 85 8 9% Financial restructuring Aktietorget 1 176 371 11 899 539 9% 7,12 6,74 8,43 6,50 23% 0,028
2014 Karo Bio AB Pharmaceutical2014-03-18
Insider342 7
2% New partner
Nasdaq OMX
Stockholm15 000 000
495 947 367 3% 0,69 1,17 1,08 0,47 56% 0,016
2014
Karolinska Development
AB Pharmaceutical2014-11-05
Active697 63
9% New Investments
Nasdaq OMX
Stockholm4 846 154
48 538 404 9% 14,35 13,60 16,10 13,00 19% 0,023
2014 Mobile Loyalty Holding AB Data/IT 2014-09-25 Passive 33 6 18% Financial restructuring Aktietorget 14 750 000 77 105 542 16% 0,43 0,40 0,40 0,40 0% 0,000
2014
Precio Systemutveckling
AB Data/IT2014-08-27
Passive58 2
4% New InvestmentsFirst North 400 000
7 489 546 5% 7,75 7,90 7,25 6,20 14% 0,007
2014 Rejlers AB Services2014-02-19
Passive1 079 85
8% New Investments
Nasdaq OMX
Stockholm900 000
11 421 721 7% 94,50 100,50 103,00 94,50 8% 0,007
2014 Respiratorius AB Pharmaceutical 2014-01-30 Active 52 9 17% New Investments Aktietorget 15 000 000 106 708 423 12% 0,49 0,63 0,67 0,60 10% 0,016
2014
Xtranet Gruppen i
Stockholm AB Data/IT2014-01-17
Mixed5 2
39% New partnerAktietorget 1 860 000
5 212 692 26% 0,91 1,00 0,87 1,00 -15% -0,046
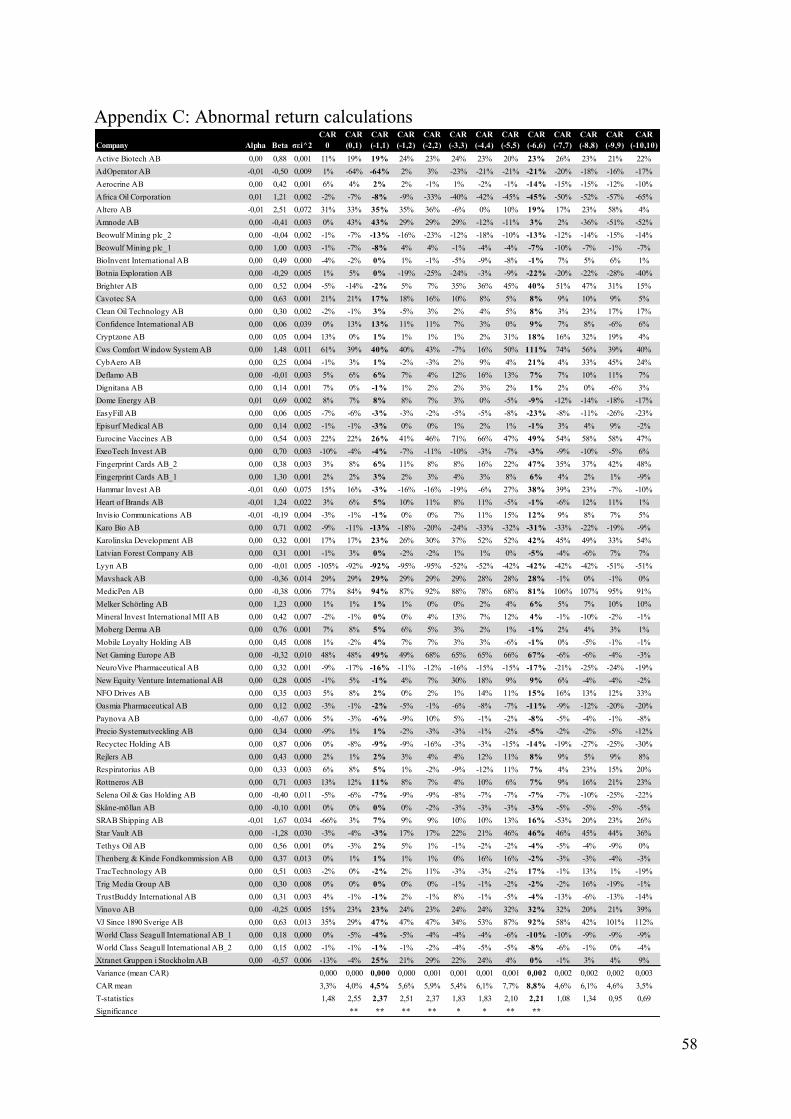
58
Appendix C: Abnormal return calculations
Company Alpha Beta σεi^2
CAR
0
CAR
(0,1)
CAR
(-1,1)
CAR
(-1,2)
CAR
(-2,2)
CAR
(-3,3)
CAR
(-4,4)
CAR
(-5,5)
CAR
(-6,6)
CAR
(-7,7)
CAR
(-8,8)
CAR
(-9,9)
CAR
(-10,10)
Active Biotech AB 0,00 0,88 0,001 11% 19% 19% 24% 23% 24% 23% 20% 23% 26% 23% 21% 22%
AdOperator AB -0,01 -0,50 0,009 1% -64% -64% 2% 3% -23% -21% -21% -21% -20% -18% -16% -17%
Aerocrine AB 0,00 0,42 0,001 6% 4% 2% 2% -1% 1% -2% -1% -14% -15% -15% -12% -10%
Africa Oil Corporation 0,01 1,21 0,002 -2% -7% -8% -9% -33% -40% -42% -45% -45% -50% -52% -57% -65%
Altero AB -0,01 2,51 0,072 31% 33% 35% 35% 36% -6% 0% 10% 19% 17% 23% 58% 4%
Amnode AB 0,00 -0,41 0,003 0% 43% 43% 29% 29% 29% -12% -11% 3% 2% -36% -51% -52%
Beowulf Mining plc_2 0,00 -0,04 0,002 -1% -7% -13% -16% -23% -12% -18% -10% -13% -12% -14% -15% -14%
Beowulf Mining plc_1 0,00 1,00 0,003 -1% -7% -8% 4% 4% -1% -4% -4% -7% -10% -7% -1% -7%
BioInvent International AB 0,00 0,49 0,000 -4% -2% 0% 1% -1% -5% -9% -8% -1% 7% 5% 6% 1%
Botnia Exploration AB 0,00 -0,29 0,005 1% 5% 0% -19% -25% -24% -3% -9% -22% -20% -22% -28% -40%
Brighter AB 0,00 0,52 0,004 -5% -14% -2% 5% 7% 35% 36% 45% 40% 51% 47% 31% 15%
Cavotec SA 0,00 0,63 0,001 21% 21% 17% 18% 16% 10% 8% 5% 8% 9% 10% 9% 5%
Clean Oil Technology AB 0,00 0,30 0,002 -2% -1% 3% -5% 3% 2% 4% 5% 8% 3% 23% 17% 17%
Confidence International AB 0,00 0,06 0,039 0% 13% 13% 11% 11% 7% 3% 0% 9% 7% 8% -6% 6%
Cryptzone AB 0,00 0,05 0,004 13% 0% 1% 1% 1% 1% 2% 31% 18% 16% 32% 19% 4%
Cws Comfort Window System AB 0,00 1,48 0,011 61% 39% 40% 40% 43% -7% 16% 50% 111% 74% 56% 39% 40%
CybAero AB 0,00 0,25 0,004 -1% 3% 1% -2% -3% 2% 9% 4% 21% 4% 33% 45% 24%
Deflamo AB 0,00 -0,01 0,003 5% 6% 6% 7% 4% 12% 16% 13% 7% 7% 10% 11% 7%
Dignitana AB 0,00 0,14 0,001 7% 0% -1% 1% 2% 2% 3% 2% 1% 2% 0% -6% 3%
Dome Energy AB 0,01 0,69 0,002 8% 7% 8% 8% 7% 3% 0% -5% -9% -12% -14% -18% -17%
EasyFill AB 0,00 0,06 0,005 -7% -6% -3% -3% -2% -5% -5% -8% -23% -8% -11% -26% -23%
Episurf Medical AB 0,00 0,14 0,002 -1% -1% -3% 0% 0% 1% 2% 1% -1% 3% 4% 9% -2%
Eurocine Vaccines AB 0,00 0,54 0,003 22% 22% 26% 41% 46% 71% 66% 47% 49% 54% 58% 58% 47%
ExeoTech Invest AB 0,00 0,70 0,003 -10% -4% -4% -7% -11% -10% -3% -7% -3% -9% -10% -5% 6%
Fingerprint Cards AB_2 0,00 0,38 0,003 3% 8% 6% 11% 8% 8% 16% 22% 47% 35% 37% 42% 48%
Fingerprint Cards AB_1 0,00 1,30 0,001 2% 2% 3% 2% 3% 4% 3% 8% 6% 4% 2% 1% -9%
Hammar Invest AB -0,01 0,60 0,075 15% 16% -3% -16% -16% -19% -6% 27% 38% 39% 23% -7% -10%
Heart of Brands AB -0,01 1,24 0,022 3% 6% 5% 10% 11% 8% 11% -5% -1% -6% 12% 11% 1%
Invisio Communications AB -0,01 -0,19 0,004 -3% -1% -1% 0% 0% 7% 11% 15% 12% 9% 8% 7% 5%
Karo Bio AB 0,00 0,71 0,002 -9% -11% -13% -18% -20% -24% -33% -32% -31% -33% -22% -19% -9%
Karolinska Development AB 0,00 0,32 0,001 17% 17% 23% 26% 30% 37% 52% 52% 42% 45% 49% 33% 54%
Latvian Forest Company AB 0,00 0,31 0,001 -1% 3% 0% -2% -2% 1% 1% 0% -5% -4% -6% 7% 7%
Lyyn AB 0,00 -0,01 0,005 -105% -92% -92% -95% -95% -52% -52% -42% -42% -42% -42% -51% -51%
Mavshack AB 0,00 -0,36 0,014 29% 29% 29% 29% 29% 29% 28% 28% 28% -1% 0% -1% 0%
MedicPen AB 0,00 -0,38 0,006 77% 84% 94% 87% 92% 88% 78% 68% 81% 106% 107% 95% 91%
Melker Schörling AB 0,00 1,23 0,000 1% 1% 1% 1% 0% 0% 2% 4% 6% 5% 7% 10% 10%
Mineral Invest International MII AB 0,00 0,42 0,007 -2% -1% 0% 0% 4% 13% 7% 12% 4% -1% -10% -2% -1%
Moberg Derma AB 0,00 0,76 0,001 7% 8% 5% 6% 5% 3% 2% 1% -1% 2% 4% 3% 1%
Mobile Loyalty Holding AB 0,00 0,45 0,008 1% -2% 4% 7% 7% 3% 3% -6% -1% 0% -5% -1% -1%
Net Gaming Europe AB 0,00 -0,32 0,010 48% 48% 49% 49% 68% 65% 65% 66% 67% -6% -6% -4% -3%
NeuroVive Pharmaceutical AB 0,00 0,32 0,001 -9% -17% -16% -11% -12% -16% -15% -15% -17% -21% -25% -24% -19%
New Equity Venture International AB 0,00 0,28 0,005 -1% 5% -1% 4% 7% 30% 18% 9% 9% 6% -4% -4% -2%
NFO Drives AB 0,00 0,35 0,003 5% 8% 2% 0% 2% 1% 14% 11% 15% 16% 13% 12% 33%
Oasmia Pharmaceutical AB 0,00 0,12 0,002 -3% -1% -2% -5% -1% -6% -8% -7% -11% -9% -12% -20% -20%
Paynova AB 0,00 -0,67 0,006 5% -3% -6% -9% 10% 5% -1% -2% -8% -5% -4% -1% -8%
Precio Systemutveckling AB 0,00 0,34 0,000 -9% 1% 1% -2% -3% -3% -1% -2% -5% -2% -2% -5% -12%
Recyctec Holding AB 0,00 0,87 0,006 0% -8% -9% -9% -16% -3% -3% -15% -14% -19% -27% -25% -30%
Rejlers AB 0,00 0,43 0,000 2% 1% 2% 3% 4% 4% 12% 11% 8% 9% 5% 9% 8%
Respiratorius AB 0,00 0,33 0,003 6% 8% 5% 1% -2% -9% -12% 11% 7% 4% 23% 15% 20%
Rottneros AB 0,00 0,71 0,003 13% 12% 11% 8% 7% 4% 10% 6% 7% 9% 16% 21% 23%
Selena Oil & Gas Holding AB 0,00 -0,40 0,011 -5% -6% -7% -9% -9% -8% -7% -7% -7% -7% -10% -25% -22%
Skåne-möllan AB 0,00 -0,10 0,001 0% 0% 0% 0% -2% -3% -3% -3% -3% -5% -5% -5% -5%
SRAB Shipping AB -0,01 1,67 0,034 -66% 3% 7% 9% 9% 10% 10% 13% 16% -53% 20% 23% 26%
Star Vault AB 0,00 -1,28 0,030 -3% -4% -3% 17% 17% 22% 21% 46% 46% 46% 45% 44% 36%
Tethys Oil AB 0,00 0,56 0,001 0% -3% 2% 5% 1% -1% -2% -2% -4% -5% -4% -9% 0%
Thenberg & Kinde Fondkommission AB 0,00 0,37 0,013 0% 1% 1% 1% 1% 0% 16% 16% -2% -3% -3% -4% -3%
TracTechnology AB 0,00 0,51 0,003 -2% 0% -2% 2% 11% -3% -3% -2% 17% -1% 13% 1% -19%
Trig Media Group AB 0,00 0,30 0,008 0% 0% 0% 0% 0% -1% -1% -2% -2% -2% 16% -19% -1%
TrustBuddy International AB 0,00 0,31 0,003 4% -1% -1% 2% -1% 8% -1% -5% -4% -13% -6% -13% -14%
Vinovo AB 0,00 -0,25 0,005 15% 23% 23% 24% 23% 24% 24% 32% 32% 32% 20% 21% 39%
VJ Since 1890 Sverige AB 0,00 0,63 0,013 35% 29% 47% 47% 47% 34% 53% 87% 92% 58% 42% 101% 112%
World Class Seagull International AB_1 0,00 0,18 0,000 0% -5% -4% -5% -4% -4% -4% -6% -10% -10% -9% -9% -9%
World Class Seagull International AB_2 0,00 0,15 0,002 -1% -1% -1% -1% -2% -4% -5% -5% -8% -6% -1% 0% -4%
Xtranet Gruppen i Stockholm AB 0,00 -0,57 0,006 -13% -4% 25% 21% 29% 22% 24% 4% 0% -1% 3% 4% 9%
Variance (mean CAR) 0,000 0,000 0,000 0,000 0,001 0,001 0,001 0,001 0,002 0,002 0,002 0,002 0,003
CAR mean 3,3% 4,0% 4,5% 5,6% 5,9% 5,4% 6,1% 7,7% 8,8% 4,6% 6,1% 4,6% 3,5%
T-statistics 1,48 2,55 2,37 2,51 2,37 1,83 1,83 2,10 2,21 1,08 1,34 0,95 0,69
Significance ** ** ** ** * * ** **

59
Appendix D: Market model compared to market adjusted model
*Market adjusted is the alternative model and around the event window it doesn’t differ that
much from the market model.
Difference in significance is indicated with a ‘Yes’ if it differs for the specified event window
between the two models.
Appendix E: Aggregated abnormal returns per buyer and day
Model
Event window CAR mean T-stat Significance CAR mean T-stat Significance CAR mean Significance
CAR 0 3,3% 1,48 3,2% 1,43 0%
CAR 0, +1 4,0% 2,55 ** 3,9% 2,52 ** 0%
CAR +-1 4,5% 2,37 ** 4,3% 2,24 ** 0%
CAR -1,+2 5,6% 2,51 ** 5,0% 2,28 ** 1%
CAR +-2 5,9% 2,37 ** 5,2% 2,12 ** 1%
CAR +-3 5,4% 1,83 * 4,2% 1,42 1% Yes
CAR +-4 6,1% 1,83 * 4,7% 1,41 1% Yes
CAR +-5 7,7% 2,10 ** 6,3% 1,71 ** 1%
CAR +-6 8,8% 2,21 ** 7,2% 1,80 ** 2%
CAR +-7 4,6% 1,08 2,8% 0,66 2%
CAR +-8 6,1% 1,34 4,1% 0,89 2%
CAR +-9 4,6% 0,95 2,1% 0,44 2%
CAR +-10 3,5% 0,69 0,9% 0,18 3%
Market model abnormal returns Market adjusted abnormal returns* Difference
Days All placements Insider buyer Active buyer Passive buyer Mixed
-6 0,8% 1,3% 1,3% 1,1% -2,4%
-5 0,6% -0,1% -3,4% -0,7% -5,0%
-4 1,2% -4,8% 1,9% 2,3% 1,5%
-3 -0,8% -0,5% -0,7% -0,7% -1,3%
-2 0,3% 2,2% 0,3% -0,7% 1,1%
-1 0,6% -0,5% -0,6% 1,1% 3,7%
0 3,3% -14,6% 7,9% 7,8% -7,2%
1 0,7% 7,4% -2,5% -0,9% 9,1%
2 1,0% -3,7% 3,7% 0,4% -1,7%
3 0,3% -2,2% -0,9% 0,5% 0,1%
4 -0,5% 4,5% 1,4% -3,2% 1,7%
5 1,0% 0,2% 1,2% 1,1% 0,5%
6 0,3% 0,7% -2,2% 3,2% 0,2%

60
Appendix F: Discounts and premiums sorted per market
* A negative number indicates a premium and a positive number a discount
Stock exchange Buyer Year Company
P0 - price on
event day
Issue
price Discount
Aktietorget Active 2009 Heart of Brands AB 0,36 0,30 17%
Aktietorget Active 2012 Hammar Invest AB 0,31 0,25 19%
Aktietorget Active 2012 Mineral Invest International MII AB 0,31 0,24 23%
Aktietorget Active 2012 Trig Media Group AB 0,73 1,26 -72%
Aktietorget Active 2013 Altero AB 0,17 0,15 12%
Aktietorget Active 2013 Beowulf Mining plc_1 0,67 0,63 6%
Aktietorget Active 2013 Botnia Exploration AB 0,58 0,55 5%
Aktietorget Active 2013 Recyctec Holding AB 10,05 10,79 -7%
Aktietorget Active 2013 Star Vault AB 0,10 0,23 -130%
Aktietorget Active 2014 Brighter AB 15,13 7,00 54%
Aktietorget Active 2014 Dome Energy AB 13,00 11,50 12%
Aktietorget Active 2014 Eurocine Vaccines AB 8,43 6,50 23%
Aktietorget Active 2014 Respiratorius AB 0,67 0,60 10%
Aktietorget Insider 2012 EasyFill AB 1,37 1,80 -31%
Aktietorget Insider 2014 Amnode AB 2,63 3,00 -14%
Aktietorget Mixed 2012 Thenberg & Kinde Fondkommission AB 0,12 0,31 -157%
Aktietorget Mixed 2014 Beowulf Mining plc_2 0,36 0,34 6%
Aktietorget Mixed 2014 Xtranet Gruppen i Stockholm AB 0,87 1,00 -15%
Aktietorget Passive 2010 Cws Comfort Window System AB 4,90 6,80 -39%
Aktietorget Passive 2011 TracTechnology AB 1,30 1,98 -53%
Aktietorget Passive 2012 Deflamo AB 10,15 11,00 -8%
Aktietorget Passive 2013 Latvian Forest Company AB 6,62 6,65 0%
Aktietorget Passive 2013 VJ Since 1890 Sverige AB 0,17 0,10 41%
Aktietorget Passive 2014 Mobile Loyalty Holding AB 0,40 0,40 0%
First North Active 2010 World Class Seagull International AB_2 1,12 1,40 -25%
First North Active 2011 Cryptzone AB 50,77 85,00 -67%
First North Active 2012 Skåne-möllan AB 370,00 360,00 3%
First North Active 2012 Vinovo AB 3,25 3,25 0%
First North Active 2013 New Equity Venture International AB 16,70 20,00 -20%
First North Active 2013 TrustBuddy International AB 1,00 1,10 -10%
First North Insider 2010 CybAero AB 0,92 1,00 -9%
First North Insider 2011 World Class Seagull International AB_1 0,68 0,80 -18%
First North Mixed 2011 Selena Oil & Gas Holding AB 9,20 5,00 46%
First North Mixed 2011 SRAB Shipping AB 10,00 5,00 50%
First North Passive 2012 Africa Oil Corporation 55,50 52,59 5%
First North Passive 2012 Fingerprint Cards AB_2 8,85 8,60 3%
First North Passive 2012 Invisio Communications AB 2,90 3,10 -7%
First North Passive 2012 Tethys Oil AB 44,60 40,00 10%
First North Passive 2013 Dignitana AB 17,80 15,00 16%
First North Passive 2013 Episurf Medical AB 61,25 34,50 44%
First North Passive 2014 Precio Systemutveckling AB 7,25 6,20 14%
Nasdaq OMX Stockholm Active 2009 Rottneros AB 6,79 4,50 34%
Nasdaq OMX Stockholm Active 2013 Active Biotech AB 54,00 45,00 17%
Nasdaq OMX Stockholm Active 2013 Moberg Derma AB 34,50 33,54 3%
Nasdaq OMX Stockholm Active 2014 Cavotec SA 27,30 26,50 3%
Nasdaq OMX Stockholm Active 2014 Karolinska Development AB 16,10 13,00 19%
Nasdaq OMX Stockholm Insider 2014 Karo Bio AB 1,08 0,47 56%
Nasdaq OMX Stockholm Passive 2010 BioInvent International AB 27,90 27,60 1%
Nasdaq OMX Stockholm Passive 2011 Fingerprint Cards AB_1 8,00 7,00 13%
Nasdaq OMX Stockholm Passive 2012 Melker Schörling AB 181,90 203,00 -12%
Nasdaq OMX Stockholm Passive 2013 Aerocrine AB 12,00 11,00 8%
Nasdaq OMX Stockholm Passive 2013 NeuroVive Pharmaceutical AB 18,10 14,00 23%
Nasdaq OMX Stockholm Passive 2014 Rejlers AB 103,00 94,50 8%
NGM Equity Insider 2011 Confidence International AB 0,02 0,02 -10%
NGM Equity Insider 2013 Paynova AB 0,41 0,37 10%
NGM Equity Passive 2009 Oasmia Pharmaceutical AB 23,85 25,00 -5%
Nordic MTF Active 2012 ExeoTech Invest AB 4,05 4,50 -11%
Nordic MTF Mixed 2010 Clean Oil Technology AB 0,84 0,85 -1%
Nordic MTF Passive 2012 NFO Drives AB 0,37 0,32 14%

61
Appendix G: Calculation of Abnormal Returns adjusted for discounts
Rebate adjuster = AR0+(Issued shares/Shares before issue) * ((P0-Issue price)/P-1)
CARadj= CAR(-1,1)+Rebate adjuster
Company Buyer # shares issued
# shares before
placement
P-1 price 1
day before
event
P0 - price on
event day
Issue
price
Rebate
adjuster
CAR
(-1,1) CARadj
Lyyn AB Insider 2 000 000 23 374 357 100,00 35,00 50,00 -0,013 -91,9% -93,2%
AdOperator AB Active 262 069 1 755 000 2,38 2,38 1,90 0,030 -63,7% -60,7%
Thenberg & Kinde Fondkommission AB Mixed 2 934 000 15 890 982 0,12 0,12 0,31 -0,290 1,3% -27,7%
Star Vault AB Active 4 169 859 33 704 690 0,10 0,10 0,23 -0,161 -2,9% -19,0%
Cryptzone AB Active 200 000 000 862 575 916 44,43 50,77 85,00 -0,179 0,5% -17,4%
NeuroVive Pharmaceutical AB Passive 2 500 000 19 159 046 19,80 18,10 14,00 0,027 -15,7% -13,0%
Trig Media Group AB Active 127 250 000 708 000 000 0,73 0,73 1,26 -0,129 0,2% -12,7%
Beowulf Mining plc_2 Mixed 53 333 333 282 820 560 0,37 0,36 0,34 0,011 -13,0% -11,9%
World Class Seagull International AB_1 Insider 23 750 000 57 758 595 0,68 0,68 0,80 -0,073 -4,5% -11,7%
Karo Bio AB Insider 15 000 000 495 947 367 1,17 1,08 0,47 0,016 -12,5% -11,0%
Recyctec Holding AB Active 60 500 10 954 620 10,10 10,05 10,79 0,000 -9,1% -9,1%
World Class Seagull International AB_2 Active 13 214 286 44 544 310 1,14 1,12 1,40 -0,073 -1,1% -8,4%
Africa Oil Corporation Passive 30 000 000 229 099 162 56,25 55,50 52,59 0,007 -8,2% -7,6%
Selena Oil & Gas Holding AB Mixed 1 600 000 41 347 500 9,60 9,20 5,00 0,017 -7,3% -5,6%
Beowulf Mining plc_1 Active 66 190 476 175 800 289 0,68 0,67 0,63 0,022 -7,5% -5,3%
EasyFill AB Insider 3 138 889 38 784 329 1,47 1,37 1,80 -0,024 -2,8% -5,2%
Paynova AB Insider 8 000 000 87 049 545 0,39 0,41 0,37 0,009 -6,1% -5,1%
ExeoTech Invest AB Active 400 000 16 137 018 4,50 4,05 4,50 -0,002 -4,0% -4,3%
TracTechnology AB Passive 806 130 37 702 269 1,32 1,30 1,98 -0,011 -2,4% -3,6%
New Equity Venture International AB Active 165 000 1 276 507 17,00 16,70 20,00 -0,025 -0,5% -3,0%
Oasmia Pharmaceutical AB Passive 1 720 000 35 892 858 24,51 23,85 25,00 -0,002 -2,1% -2,4%
TrustBuddy International AB Active 8 000 000 72 000 000 0,96 1,00 1,10 -0,012 -1,1% -2,3%
Hammar Invest AB Active 29 200 000 581 092 254 0,27 0,31 0,25 0,011 -3,1% -2,0%
Episurf Medical AB Passive 144 928 3 452 783 61,50 61,25 34,50 0,018 -3,1% -1,2%
Invisio Communications AB Passive 2 500 000 33 783 784 3,00 2,90 3,10 -0,005 -0,6% -1,1%
Latvian Forest Company AB Passive 412 037 5 061 649 6,67 6,62 6,65 0,000 -0,4% -0,4%
Dignitana AB Passive 900 000 10 778 645 16,60 17,80 15,00 0,014 -1,5% -0,1%
Skåne-möllan AB Active 100 000 1 000 000 370,00 370,00 360,00 0,003 -0,2% 0,1%
CybAero AB Insider 2 500 000 26 964 238 0,93 0,92 1,00 -0,008 1,0% 0,2%
BioInvent International AB Passive 5 434 800 55 660 889 28,80 27,90 27,60 0,001 0,3% 0,4%
Melker Schörling AB Passive 615 764 118 481 831 182,50 181,90 203,00 -0,001 0,8% 0,7%
Botnia Exploration AB Active 11 330 000 49 206 093 0,57 0,58 0,55 0,012 -0,3% 0,9%
Precio Systemutveckling AB Passive 400 000 7 489 546 7,90 7,25 6,20 0,007 0,5% 1,2%
Clean Oil Technology AB Mixed 20 000 000 56 907 158 0,85 0,84 0,85 -0,004 2,5% 2,1%
Aerocrine AB Passive 8 625 000 145 956 405 11,35 12,00 11,00 0,005 1,7% 2,3%
Tethys Oil AB Passive 2 500 000 32 543 750 44,50 44,60 40,00 0,008 2,1% 2,9%
Rejlers AB Passive 900 000 11 421 721 100,50 103,00 94,50 0,007 2,3% 2,9%
Mobile Loyalty Holding AB Passive 14 750 000 77 105 542 0,40 0,40 0,40 0,000 3,6% 3,6%
NFO Drives AB Passive 18 500 000 138 250 210 0,35 0,37 0,32 0,019 2,3% 4,2%
Fingerprint Cards AB_1 Passive 4 000 000 39 669 586 7,85 8,00 7,00 0,013 3,3% 4,6%
Moberg Derma AB Active 1 080 000 10 812 572 32,30 34,50 33,54 0,003 5,2% 5,5%
Deflamo AB Passive 2 272 727 34 086 516 9,69 10,15 11,00 -0,006 6,4% 5,8%
Heart of Brands AB Active 1 250 000 22 770 677 0,36 0,36 0,30 0,009 5,4% 6,3%
Respiratorius AB Active 15 000 000 106 708 423 0,63 0,67 0,60 0,016 4,8% 6,4%
Fingerprint Cards AB_2 Passive 4 197 674 43 609 586 8,60 8,85 8,60 0,003 6,2% 6,5%
Dome Energy AB Active 2 000 000 17 234 745 11,90 13,00 11,50 0,015 8,0% 9,4%
Confidence International AB Insider 414 815 4 203 846 0,02 0,02 0,02 -0,010 12,6% 11,7%
Brighter AB Active 3 571 429 11 897 480 15,97 15,13 7,00 0,153 -1,8% 13,5%
Cavotec SA Active 7 138 780 71 397 220 22,00 27,30 26,50 0,004 16,9% 17,3%
Xtranet Gruppen i Stockholm AB Mixed 1 860 000 5 212 692 1,00 0,87 1,00 -0,046 24,5% 19,9%
Active Biotech AB Active 6 000 000 68 923 582 48,80 54,00 45,00 0,016 19,3% 20,9%
Mineral Invest International MII AB Active 478 333 333 478 333 333 0,32 0,31 0,24 0,219 -0,4% 21,5%
Vinovo AB Active 4 362 640 43 626 400 2,80 3,25 3,25 0,000 23,1% 23,1%
Karolinska Development AB Active 4 846 154 48 538 404 13,60 16,10 13,00 0,023 22,6% 24,9%
Rottneros AB Active 444 444 444 1 089 494 425 5,94 6,79 4,50 0,157 10,6% 26,4%
Eurocine Vaccines AB Active 1 176 371 11 899 539 6,74 8,43 6,50 0,028 26,0% 28,9%
SRAB Shipping AB Mixed 6 600 000 000 6 454 546 000 20,00 10,00 5,00 0,256 7,1% 32,6%
Cws Comfort Window System AB Passive 300 000 5 688 200 2,75 4,90 6,80 -0,036 40,4% 36,7%
Altero AB Active 4 674 999 26 436 122 0,12 0,17 0,15 0,030 35,0% 38,0%
Amnode AB Insider 666 667 4 951 717 2,63 2,63 3,00 -0,019 42,8% 40,9%
VJ Since 1890 Sverige AB Passive 2 500 000 128 550 000 0,12 0,17 0,10 0,011 46,9% 48,0%
Net Gaming Europe AB Active 6 666 667 12 514 802 0,26 0,42 0,33 0,183 48,7% 66,9%
Mavshack AB Mixed 199 900 000 148 149 206 0,58 0,78 0,54 0,558 29,2% 85,0%
MedicPen AB Passive 8 500 000 40 476 190 0,90 1,94 0,60 0,313 94,5% 125,8%

62
Appendix H: Excluded outliers
Histogram and descriptive statistics
0
4
8
12
16
20
-1.0 -0.8 -0.6 -0.4 -0.2 0.0 0.2 0.4 0.6 0.8 1.0 1.2
Series: CARadjSample 1 64Observations 64Mean 6,29%Median 1,05%Maximum 125,75%Minimum -93,21%Std. Dev. 0,289Skewness 0,820Kurtosis 8,859Jarque-Bera 98,72Probability 0,000
The outliers are defined as an issue that deviates more than two standard deviations (outside
95% of observation) from the mean of the sample. The calculations for the limits are shown in
the table below.
Based in the CARadj results in appendix F it results in that the following events are defined as
outliers and due to that excluded from the sample.
Outlier calculation
Mean 6,29%
1 standard deviation 28,92%
2 standard deviations 57,83%
Upper limit of CARadj 64,13%
Lower limit of CARadj -51,54%
Company CARadj
Lyyn AB -93,2%
AdOperator AB -60,7%
Net Gaming Europe AB 66,9%
Mavshack AB 85,0%
MedicPen AB 125,8%

63
Appendix I: Correcting standard errors to mitigate heteroskedasticity
Dependent Variable: CARadj
Method: Least squares
Sample: 1 59 Included
observations: 59
White heteroskedasticity-consistent standard errors & covariance
Variable Coefficient Std. Error t-Statistic Prob.
INSIDER_BUYER -0.032727 0.091013 -0.359584 0.7206
ACTIVE_BUYER 0.022972 0.046309 0.496062 0.6219
LN_ISSUE_SIZE -0.010833 0.019384 -0.558887 0.5786
LN_ISSUE_DIV_FIR
M_SIZE 0.018323 0.024291 0.754319 0.4541
REG_MARKET 0.049099 0.052341 0.938071 0.3525
FIN_RESTR -0.002975 0.049397 -0.060222 0.9522
INTERCEPT 0.098440 0.107157 0.918649 0.3625
R-squared 0.028331 Mean dependent var 0.047309
Adjusted R-squared -0.083785 S.D. dependent var 0.155416
S.E. of regression 0.161796 Akaike info criterion -0.693971
Sum squared resid 1.361247 Schwarz criterion -0.447483
Log likelihood 27.47214 Hannan-Quinn criter. -0.597752
F-statistic 0.252690 Durbin-Watson stat 2.129812
Prob(F-statistic) 0.956029 Wald F-statistic 0.288879
Prob(Wald F-statistic) 0.939622


