
Private Health Insurance Coverage 2011–15New Zealand Health Survey
Released 2016 health.govt.nz

Citation: Ministry of Health. 2016. Private Health Insurance Coverage 2011–15: New Zealand Health Survey. Wellington: Ministry of Health.
Published in October 2016by the Ministry of Health
PO Box 5013, Wellington 6140, New Zealand
ISBN 978-0-947515-60-7 (online)HP 6483
This document is available at health.govt.nz
This work is licensed under the Creative Commons Attribution 4.0 International licence. In essence, you are free to: share ie, copy and redistribute the material in any medium or format; adapt ie, remix, transform and build upon the material. You must give appropriate credit, provide a link to the licence and indicate if changes were made.

ForewordI am pleased to present this report, which profiles New Zealanders who are covered by private health insurance. It examines differences across age, sex, ethnicity, neighbourhood deprivation, household income and district health board. The report also looks at who pays for the insurance, and the trends in private health insurance cover over time.
The report uses data collected between 2011 and 2015 as part of the New Zealand Health Survey. The survey became continuous in 2011, collecting data from about 13,000 adults and 4000 children each year.
I would like to extend a special thank you to the many thousands of New Zealanders who gave their time to take part in the survey. The information they have provided is essential for developing and monitoring health policy and services in New Zealand.
I hope you find this report of interest.
Deb StruthersChief Client Officer (Acting)Ministry of Health
Private Health Insurance Coverage 2011–15 iii

AuthorsThis report was written by Garth MacLeod and Chloe Lynch, with statistical analysis undertaken by Deepa Weerasekera and Steven Johnston. Input into the report and peer review were provided by Bridget Murphy, Martin Tobias, Grant Pittams, Jackie Fawcett and Tim Stevenson.
AcknowledgementsThe New Zealand Health Survey would not have been possible without the support and enthusiasm of many individuals, and the surveyors who worked so diligently to collect the data.
Thank you also to the many thousands of New Zealanders who gave their time to participate in the New Zealand Health Survey. This report would not have been possible without your generosity.
The New Zealand Health Survey is developed by the New Zealand Health Survey team in the Health and Disability Intelligence Group, Ministry of Health, with advice from the Ministry of Health Survey Governance Group. It is conducted by CBG Health Research Ltd.
iv Private Health Insurance Coverage 2011–15

ContentsForeword
Authors
Acknowledgements
IntroductionOverviewBackgroundMethodInterpreting the report
Findings: Who is covered by private health insurance in New Zealand?More than one-third of adults had private health insurance coverMāori and Pacific adults were less likely to be covered by PHIAdults with higher income and better health were more likely to have PHI coverAdults in larger city district health boards were more likely to have PHI coverMore than one-quarter of children were covered by PHIThe proportion of adults and children with PHI coverage has decreased since 1996/97Most adults pay for PHI themselves
References
Appendix 1: NZHS questions on PHIAdult surveyChild survey
Appendix 2: Tables
Appendix 3: Modelling the data
List of FiguresFigure 1: Percentage of adults with PHI coverage, by age group and sexFigure 2: Percentage of adults with PHI coverage, by household income
Figure 3: Percentage of adults with PHI coverage (unadjusted and adjusted), by district health board
Figure 4: Time trends for the percentage of adults and children with PHI coverage (age-standardised prevalence)
Private Health Insurance Coverage 2011–15 v
Figure 5: Percentage of adults with PHI coverage who have it partly or fully paid by the employer, by household income
List of TablesTable 1: Percentage of adults (aged 15 years and over) with PHI cover, by
sociodemographic categories
Table 2: Adjusted rate ratios for adults (aged 15 years and over) with PHI cover
Table 3: Percentage of adults (aged 15 years and over) with PHI cover, by ethnic group and age group
Table 4: Percentage of adults (aged 15 years and over) with PHI cover, by household income and self-rated health
Table 5: Percentage of adults (aged 15 years and over) with PHI cover, by DHB
Table 6: Percentage of children (aged 0 to 14 years) with PHI cover, by sociodemographic category
Table 7: Adjusted rate ratios for children (aged 0 to 14 years) with PHI cover
Table 8: Percentage of children (aged 0 to 14 years) with PHI cover, by DHB
Table 9: Percentage of adults (aged 15 years and over) with PHI cover, over time since 1996/97 (unadjusted prevalence)
Table 10: Significance of difference between years (age-standardised p-values) for percentage of adults (aged 15 years and over) with PHI cover
Table 11: Percentage of children (aged 0 to 14 years) with PHI cover, over time since 1996/97
Table 12: Significance of difference between years (age-standardised p-values) for percent of children (aged 0 to 14 years) with PHI cover
Table 13: Who pays for the PHI for adults (aged 15 years and over) with PHI cover
Table 14: Who pays for the PHI for adults (aged 15 years and over) with PHI cover, by household income
Table 15: Independent effects of demographic and socioeconomic variables on PHI coverage
vi Private Health Insurance Coverage 2011–15
IntroductionOverviewThis report presents findings from the New Zealand Health Survey (NZHS) about the private health insurance (PHI) of adults and children across different population groups (age, sex, ethnicity, neighbourhood deprivation, household income, district health board) in New Zealand.
The NZHS data used for this report was collected from 51,736 adults (aged 15 years and over) between July 2011 and June 2015, and 13,750 parents/caregivers (representing children aged 0–14 years) between July 2012 and June 2015. Each year, as part of the core set of questions, the NZHS asks adults and the parents (or caregivers) of child participants whether they are covered by any health or medical insurance.1 Adult participants are also asked who pays for the insurance. The NZHS questions about PHI can be found in Appendix 1.
BackgroundThe method of funding health varies between countries. In New Zealand, of the $22 billion spent on health a year, about $1.1 billion (5%) is from PHI.2
PHI is a source of funding for private health services. Individuals with PHI may have more timely access to non-urgent treatment than those without insurance. PHI policies in New Zealand range from extensive cover through to basic policies covering surgical treatment only (Health Funds Association of New Zealand 2013).
New Zealand is included in the third of OECD members that have over 30% of their population covered by PHI (Colombo and Tapay 2004). Overseas research has found that higher income is associated with higher PHI coverage (Kiil 2012).
MethodThe NZHS is administered through face-to-face interviews using computer-assisted personal interviewing (CAPI) software. The target population is New Zealand’s usually resident population of all ages (including those living in non-private accommodation). The NZHS sample is selected using a stratified, multi-stage area design.
For more information on NZHS methodology, see:www.health.govt.nz/publication/methodology-report-2014-15-new-zealand-health-survey
1 In 2011/12 the questions about PHI were included in the adult survey but not the child survey.2 Expenditure for 2013 as provided to OECD. Information from Bronwyn Croxson, Chief Economist,
Ministry of Health.
Private Health Insurance Coverage 2011–15 1

For more information on NZHS content, see:www.health.govt.nz/publication/new-zealand-health-survey-content-guide-and-questionnaires-2014-15
Interpreting the reportBy pooling several years of data from the 2011–15 NZHS, this report has been able to provide robust results across different population groups. All results from 2011–15 presented in this report are weighted so that they are representative of the total adult population (those aged 15 years and over) and the total child population (those aged 0–14 years). Where appropriate, an estimate is provided of the total number of New Zealanders in specific categories as at June 2015.
This report uses adjusted rate ratios to compare the prevalence among different population groups to reveal whether the results are less or more likely in the group of interest (less than 1 is less likely, 1 is as likely, greater than 1 is more likely). The rate ratios have been adjusted for demographic factors that may be influencing the comparison, such as age, sex and ethnicity.
Ethnicity is reported using total response ethnicity. The neighbourhood deprivation measure used is the New Zealand Index of Deprivation 2006 (NZDep2006). NZDep2006 is reported in quintiles 1–5 (1 = low; 5 = high) or most deprived versus least deprived areas. The neighbourhood deprivation rate ratio uses data from all the NZDep2006 quintiles to give a relative index of inequality rather than only using the data from quintiles 1 and 5.
All differences reported in the text are statistically significant (where p < 0.05) unless stated otherwise. Ninety-five percent confidence intervals are presented in the figures and data tables to represent the sampling error. Data tables can be found in Appendix 2.
Did you find what you were looking for?Please help us to improve our reports – tell us whether we are giving you the information you want by going to: www.health.govt.nz/nzhs-feedbackIt will only take a minute or two, and we really value your feedback!
2 Private Health Insurance Coverage 2011–15

Findings: Who is covered by private health insurance in New Zealand?More than one-third of adults had private health insurance coverOver one-third of adults (35%) surveyed in the NZHS reported that they were covered by PHI. This is equivalent to 1,215,000 adults in New Zealand.
There was no difference in the percentage of men (36%) and women (34%) covered by PHI.
The PHI coverage rate was highest for the age groups between 35 and 64 years (35–44 years, 41%; 45–54 years, 42%; 55–64 years, 41%) and lowest for those aged 75 years and over (16%), as shown in Figure 1.3
Figure 1: Percentage of adults with PHI coverage, by age group and sex
3 Insurance coverage for children (aged 0–14 years) is shown in Figure 1 to complete the age range. More details on PHI coverage for children are provided later in this report.
Private Health Insurance Coverage 2011–15 3

Māori and Pacific adults were less likely to be covered by PHIPHI was owned by 39% of Asian adults, 37% of NZ European/other adults, 20% of Māori adults and 20% of Pacific adults.
Māori (adjusted rate ratio [ARR] 0.5) and Pacific adults (ARR 0.6) were less likely to report that they were covered by PHI than non-Māori and non-Pacific adults, respectively, after adjusting for age and sex differences.
Asian adults were 1.1 times more likely to report that they were covered by PHI than non-Asian adults, after adjusting for age and sex differences. In particular, young Asian adults had a much higher PHI coverage rate than non-Asian adults. More than half (51%) of the 151,000 Asian adults who had PHI were less than 35 years old. A possible reason for this is that foreign students must have health insurance (Immigration New Zealand 2016).
Adults with higher income and better health were more likely to have PHI coverThose adults with a higher household income were more likely to be covered by PHI, as shown in Figure 2. For example, 60% of adults with a household income over $100,000 were covered by PHI, compared with 12% of those with a household income of less than $20,000.
Figure 2: Percentage of adults with PHI coverage, by household income*
* Excluding respondents who did not report a household income (25% of respondents).
After examining a range of demographic and socioeconomic factors, household income was found to have the strongest association with PHI coverage. That is, there are large differences in PHI coverage between household income categories,
4 Private Health Insurance Coverage 2011–15

even when controlling for other demographic and socioeconomic factors. This is shown by the odds ratios for household income categories in Appendix 3, which are much larger than the odds ratios for the other variables included in the logistic regression model described there.
Adults in the most socioeconomically deprived areas were less likely (ARR 0.4) to be covered by PHI compared with adults in the least deprived areas, after adjusting for age, sex and ethnic differences.4
Surveyors asked adults whether they considered their health to be ‘excellent, very good, good, fair or poor’. In this report, ‘good health’ means good, very good or excellent health. Adults who reported being in good health were more likely to report being covered by PHI (36%) than adults who did not report good health (21%).
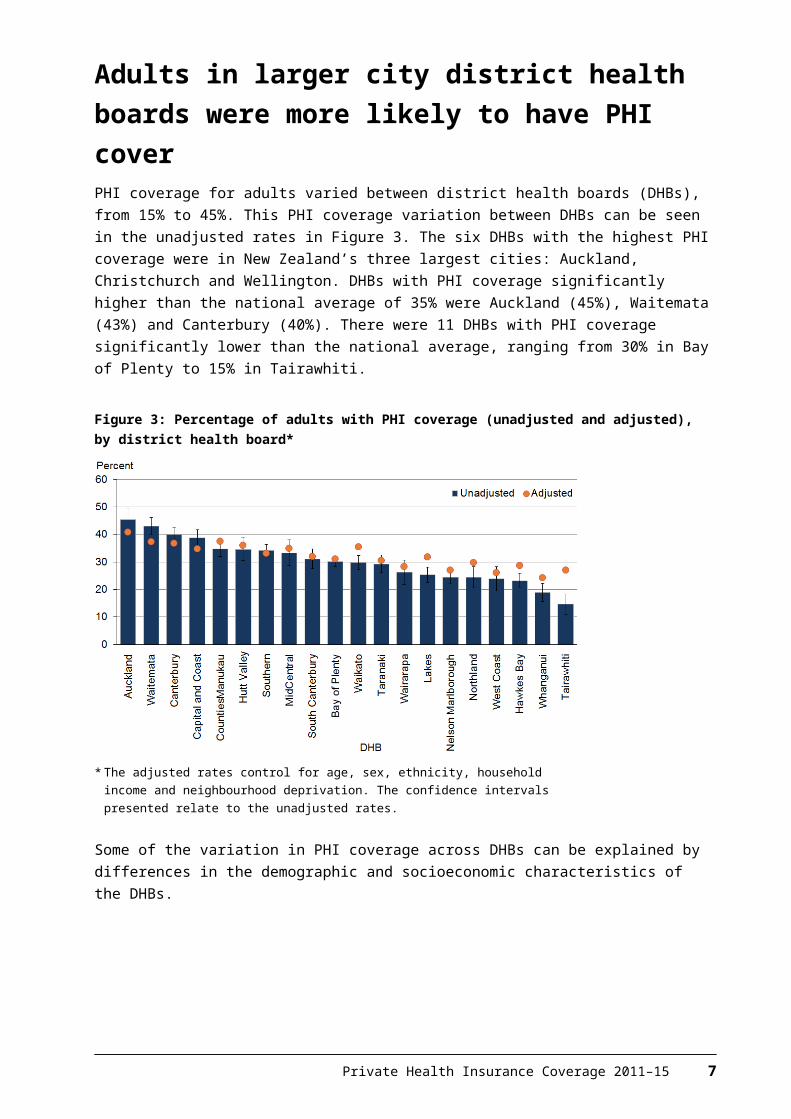
Adults in larger city district health boards were more likely to have PHI coverPHI coverage for adults varied between district health boards (DHBs), from 15% to 45%. This PHI coverage variation between DHBs can be seen in the unadjusted rates in Figure 3. The six DHBs with the highest PHI coverage were in New Zealand’s three largest cities: Auckland, Christchurch and Wellington. DHBs with PHI coverage significantly higher than the national average of 35% were Auckland (45%), Waitemata (43%) and Canterbury (40%). There were 11 DHBs with PHI coverage significantly lower than the national average, ranging from 30% in Bay of Plenty to 15% in Tairawhiti.
Figure 3: Percentage of adults with PHI coverage (unadjusted and adjusted), by district health board*
* The adjusted rates control for age, sex, ethnicity, household income and neighbourhood deprivation. The confidence intervals presented relate to the unadjusted rates.
4 Using the NZDep2006 measure of neighbourhood deprivation.
Private Health Insurance Coverage 2011–15 5

Some of the variation in PHI coverage across DHBs can be explained by differences in the demographic and socioeconomic characteristics of the DHBs.
Figure 3 also displays PHI coverage rates that have been adjusted for age, sex, ethnicity, household income and neighbourhood deprivation, using a logistic regression model. The adjusted rates are estimates of what PHI coverage would be if the population in each DHB had the same age, sex, ethnicity, household income and neighbourhood deprivation distributions as the total New Zealand population.
The adjusted rates show less variation across DHBs than the unadjusted rates, although there are still differences remaining in PHI coverage between DHBs that are not explained by the factors in the model. That is, even after controlling for the demographic and socioeconomic make-up of their populations, larger city DHBs tend to have higher PHI coverage than smaller provincial areas.
See Appendix 3 for more information on the logistic regression model.
More than one-quarter of children were covered by PHIOverall, 28% of children (aged 0–14 years) were reported to be covered, which is lower than the coverage rate for adults (35%). This equates to 256,000 children in New Zealand being covered by PHI.
The PHI coverage rate for boys (29%) and girls (28%) was similar.
Children aged 0–4 years were less likely to be covered by PHI (25%) than 5–9-year-olds (30%) and 10–14-year-olds (30%).
Similar to adults, Māori (ARR 0.4) and Pacific (ARR 0.5) children were less likely to report that they were covered by PHI than non-Māori and non-Pacific children, respectively, after adjusting for age and sex differences.
Children in the most socioeconomically deprived areas were less likely (ARR 0.3) to be covered by PHI compared with children in the least deprived areas, after adjusting for age, sex and ethnic differences.
The proportion of adults and children with PHI coverage has decreased since 1996/97As shown in Figure 4, the proportion of adults who reported being covered by PHI has decreased from 40% in 1996/97 to 35% in 2011–15.
The proportion of children reported to be covered by PHI has also decreased over time, from 31% in 1996/97 to 28% in 2012–15.
6 Private Health Insurance Coverage 2011–15

Figure 4: Time trends* for the percentage of adults and children with PHI coverage (age-standardised prevalence)
* Prior to the 2011/12 NZHS the respondent was asked whether they were covered by any health or medical insurance scheme. The question was worded slightly differently because it included the word ‘scheme’. However, the same meaning is conveyed.
Most adults pay for PHI themselvesFour-fifths (79%) of adults with PHI reported that they either pay for PHI themselves or it is paid by a family member. Of those with PHI cover, it is paid fully by the employer (or employer of a family member) for 11% of adults, and partly paid by the employer for 9% of adults.
As shown in Figure 5, those adults with a high household income are more likely to have some or all of their PHI paid by their employer (or the employer of a family member).
Figure 5: Percentage of adults with PHI coverage who have it partly or fully paid by the employer,* by household income
Private Health Insurance Coverage 2011–15 7
* Includes the PHI being paid by the employer of a family member.
8 Private Health Insurance Coverage 2011–15

ReferencesColombo F, Tapay N. 2004. Private health insurance in OECD countries: the benefits and costs for individuals and health systems. OECD Health Working Papers, No. 15. OECD Publishing. URL: http://dx.doi.org/10.1787/527211067757.
Health Funds Association of New Zealand. 2013. Health Insurance Makes Sense. Wellington: Health Funds Association of New Zealand.
Immigration New Zealand. 2016. Immigration New Zealand Operational Manual. Wellington: Immigration New Zealand.
Kiil A. 2012. What characterises the privately insured in universal health care systems?: a review of the empirical evidence. Health Policy 106(1): 60–75.
Private Health Insurance Coverage 2011–15 9

Appendix 1:NZHS questions on PHIAdult surveyNow I’ll ask you about medical insurance.
A5.20 Are you covered by any health or medical insurance?1 Yes2 No.K Don’t know.R Refused
[Showcard]A5.22 And who pays for this health or medical insurance?
Please ensure respondent reads all response options before choosing1 Self or family members2 Partly self or family and partly employer3 Paid for by employer or employer of family member4 Paid for by some other person or agency.K Don’t know.R Refused
Child surveyNow I’ll ask you about medical insurance.
C4.06a Is [Name] covered by any health or medical insurance?1 Yes2 No.K Don’t know.R Refused
10 Private Health Insurance Coverage 2011–15

Appendix 2: TablesTable 1: Percentage of adults (aged 15 years and over) with PHI cover, by sociodemographic categories
Population group PHI coverage (%, 95% CI) Estimated number of adults
Total Men Women
Total 34.8 (33.8–35.8) 35.6 (34.5–36.7) 34.0 (32.8–35.2) 1,215,000
Age group (years)
15–24 29.4 (27.5–31.4) 29.1 (26.5–31.7) 29.8 (27.0–32.5) 172,000
25–34 32.7 (31.3–34.2) 33.3 (31.2–35.4) 32.2 (30.3–34.1) 182,000
35–44 40.9 (39.3–42.5) 41.9 (39.9–43.9) 40.0 (37.8–42.1) 241,000
45–54 42.3 (40.6–44.0) 43.9 (41.6–46.2) 40.8 (38.5–43.1) 264,000
55–64 41.0 (39.5–42.5) 41.6 (39.2–44.0) 40.4 (38.3–42.5) 211,000
65–74 28.6 (26.6–30.6) 30.4 (27.8–33.1) 26.8 (24.4–29.2) 103,000
75+ 16.1 (14.1–18.0) 15.4 (13.0–17.8) 16.6 (13.6–19.6) 43,000
Ethnic group
Māori 19.9 (18.7–21.0) 22.1 (20.4–23.8) 17.8 (16.5–19.1) 89,000
Pacific 19.8 (18.1–21.5) 22.4 (19.6–25.3) 17.6 (15.5–19.7) 37,000
Asian 38.6 (36.5–40.8) 39.2 (36.3–42.2) 38.1 (34.8–41.3) 151,000
European/Other 37.1 (36.1–38.2) 37.7 (36.4–39.0) 36.6 (35.3–37.9) 1,004,000
Neighbourhood deprivation (NZDep2006)
Quintile 1(least deprived)
50.1 (47.8–52.4) 49.4 (46.9–51.9) 50.7 (47.9–53.6) 347,000
Quintile 2 42.3 (40.3–44.2) 42.6 (40.3–45.0) 41.9 (39.6–44.2) 322,000
Quintile 3 33.3 (32.0–34.7) 33.8 (31.9–35.7) 32.9 (31.1–34.7) 235,000
Quintile 4 28.3 (27.1–29.6) 30.1 (28.1–32.1) 26.7 (25.1–28.3) 194,000
Quintile 5(most deprived)
18.1 (16.5–19.7) 19.0 (17.3–20.8) 17.3 (15.3–19.3) 118,000
Private Health Insurance Coverage 2011–15 11

Table 2: Adjusted rate ratios for adults (aged 15 years and over) with PHI cover
Comparison Adjusted rate ratio (95% CI) Significant (*) Adjustment variables
SexMen vs women 1.0 (1.0–1.1) Age
MāoriMāori vs non-Māori 0.5 (0.5–0.6) * Age, sex
PacificPacific vs non-Pacific 0.6 (0.5–0.6) * Age, sex
AsianAsian vs non-Asian 1.1 (1.0–1.2) Age, sex
Neighbourhood deprivation (NZDep2006)Most deprived vs least deprived
0.4 (0.3–0.4) * Age, sex, ethnicity
Note: An asterisk (*) shows that results are statistically significant at the 95% level of significance (ie, the 95% confidence interval does not contain the value 1).
12 Private Health Insurance Coverage 2011–15
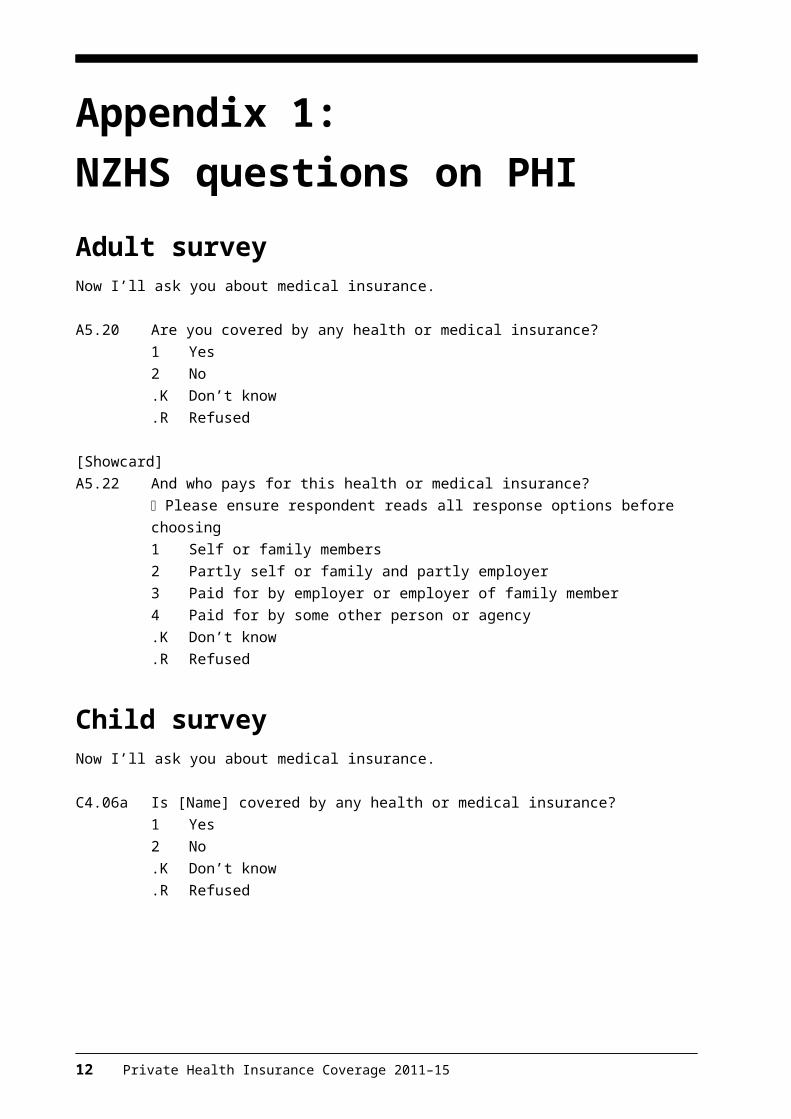
Table 3: Percentage of adults (aged 15 years and over) with PHI cover, by ethnic group and age group
Ethnic group Age group PHI coverage (%, 95% CI) Estimated number of adults
Māori 15–24 14.9 (13.1–16.7) 17,000
25–34 19.3 (17.0–21.6) 17,000
35–44 24.3 (21.6–27.0) 20,000
45–54 25.1 (22.5–27.7) 19,000
55–64 22.6 (19.9–25.4) 11,000
65–74 14.5 (11.1–17.9) 4000
75+ 7.3 (3.7–10.8) 1000
Total 19.9 (18.7–21.0) 89,000
Pacific 15–24 14.1 (10.9–17.3) 7000
25–34 22.4 (19.0–25.8) 9000
35–44 25.2 (20.3–30.1) 8000
45–54 25.8 (20.6–31.0) 8000
55–64 20.2 (12.5–27.9) 3000
65–74 8.5 (2.9–14.2) 1000
75+ 4.4 (0.0–9.5) 200
Total 19.8 (18.1–21.5) 37,000
Asian 15–24 43.3 (37.9–48.7) 38,000
25–34 37.3 (33.6–41.0) 40,000
35–44 45.6 (41.0–50.1) 34,000
45–54 37.6 (32.1–43.1) 23,000
55–64 31.1 (25.4–36.9) 11,000
65–74 20.3 (13.9–26.7) 4000
75+ 19.0 (5.4–32.6) 1000
Total 38.6 (36.5–40.8) 151,000
European/Other 15–24 31.5 (29.2–33.8) 127,000
25–34 34.8 (33.0–36.6) 129,000
35–44 43.6 (41.7–45.6) 194,000
45–54 46.0 (44.1–48.0) 225,000
55–64 44.4 (42.7–46.1) 192,000
65–74 30.5 (28.3–32.7) 97,000
75+ 16.3 (14.5–18.2) 41,000
Total 37.1 (36.1–38.2) 1,004,000
Private Health Insurance Coverage 2011–15 13

Table 4: Percentage of adults (aged 15 years and over) with PHI cover, by household income and self-rated health
PHI coverage (%, 95% CI) Estimated number of adults
Total 34.8 (33.8–35.8) 1,215,000
Household income ($)
20,000 or less 12.0 (10.4–13.6) 26,000
20,001–30,000 11.6 (10.1–13.2) 26,000
30,001–50,000 21.3 (19.8–22.8) 87,000
50,001–70,000 33.5 (31.9–35.2) 145,000
70,001–100,000 44.4 (42.8–46.0) 211,000
100,001 or more 60.4 (58.9–61.8) 466,000
Don’t know 24.3 (23.1–25.6) 214,000
Refused 44.5 (40.4–48.5) 40,000
Total 34.8 (33.8–35.8) 1,215,000
Self-rated health
Excellent, very good or good 36.3 (35.3–37.4) 1,138,000
Poor or fair 21.3 (19.9–22.8) 76,000
Table 5: Percentage of adults (aged 15 years and over) with PHI cover, by DHB
DHB PHI coverage (%, 95% CI) Estimated numberof adults
Adjusted estimates for PHI coverage (%)*
Auckland 45.5 (41.8–49.2) 166,000 40.7
Waitemata 43.0 (39.8–46.2) 169,000 37.3
Canterbury 39.9 (37.2–42.6) 171,000 36.8
Capital & Coast 38.7 (35.7–41.7) 93,000 34.8
Counties Manukau 34.8 (31.9–37.7) 114,000 37.5
Hutt Valley 34.6 (30.5–38.7) 35,000 36.0
Southern 34.2 (32.0–36.4) 89,000 33.0
MidCentral 33.3 (28.6–38.0) 50,000 34.9
South Canterbury 31.1 (27.5–34.7) 17,000 32.0
Bay of Plenty 30.1 (28.2–32.0) 64,000 31.0
Waikato 29.8 (27.1–32.4) 73,000 35.5
Taranaki 29.2 (26.0–32.5) 35,000 30.5
Wairarapa 26.3 (21.9–30.7) 8000 28.4
Lakes 25.3 (22.5–28.1) 21,000 31.8
Nelson Marlborough 24.5 (22.0–27.0) 24,000 27.0
Northland 24.3 (20.5–28.2) 33,000 29.8
West Coast 23.8 (19.4–28.3) 8000 26.0
Hawke’s Bay 23.2 (20.6–25.8) 31,000 28.6
Whanganui 18.9 (15.6–22.2) 10,000 24.3
Tairāwhiti 14.6 (10.7–18.4) 4000 27.0
Total (New Zealand) 34.8 (33.8–35.8) 1,215,000 –
* These are estimates of what the PHI coverage would be if the population in each DHB had the same age, sex, ethnicity, household income and neighbourhood deprivation distributions as the total New Zealand population. See Appendix 3 for more information.
14 Private Health Insurance Coverage 2011–15
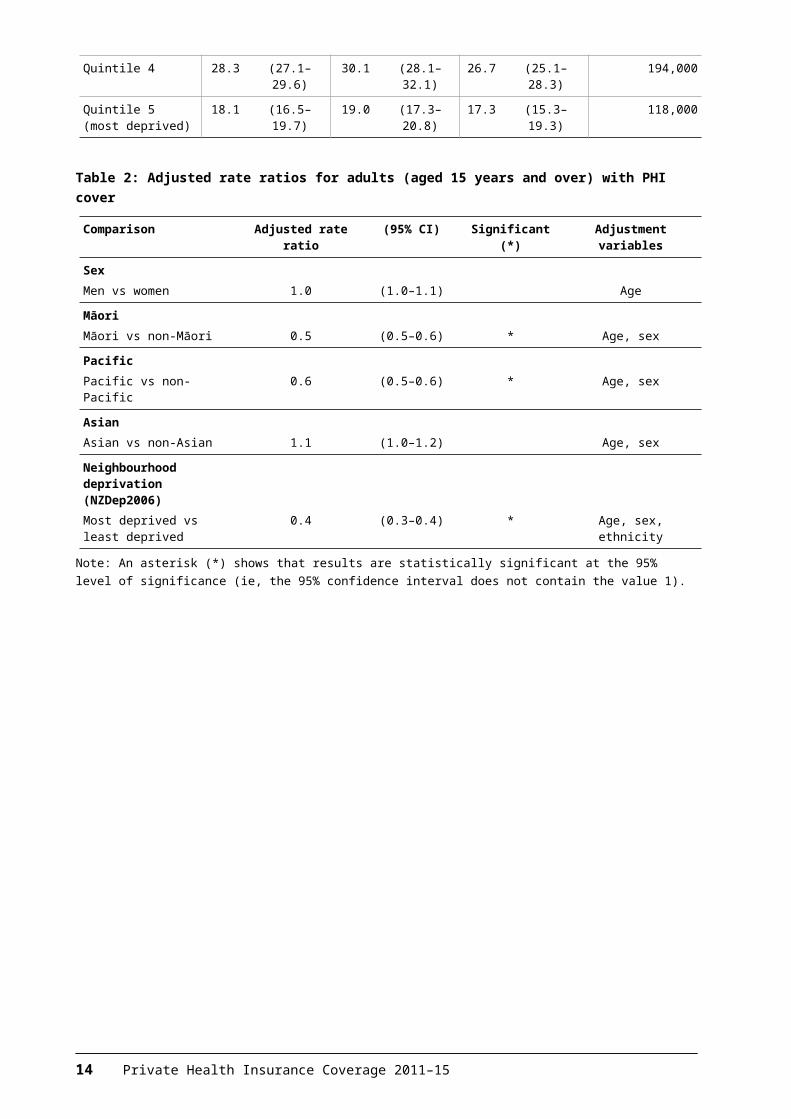
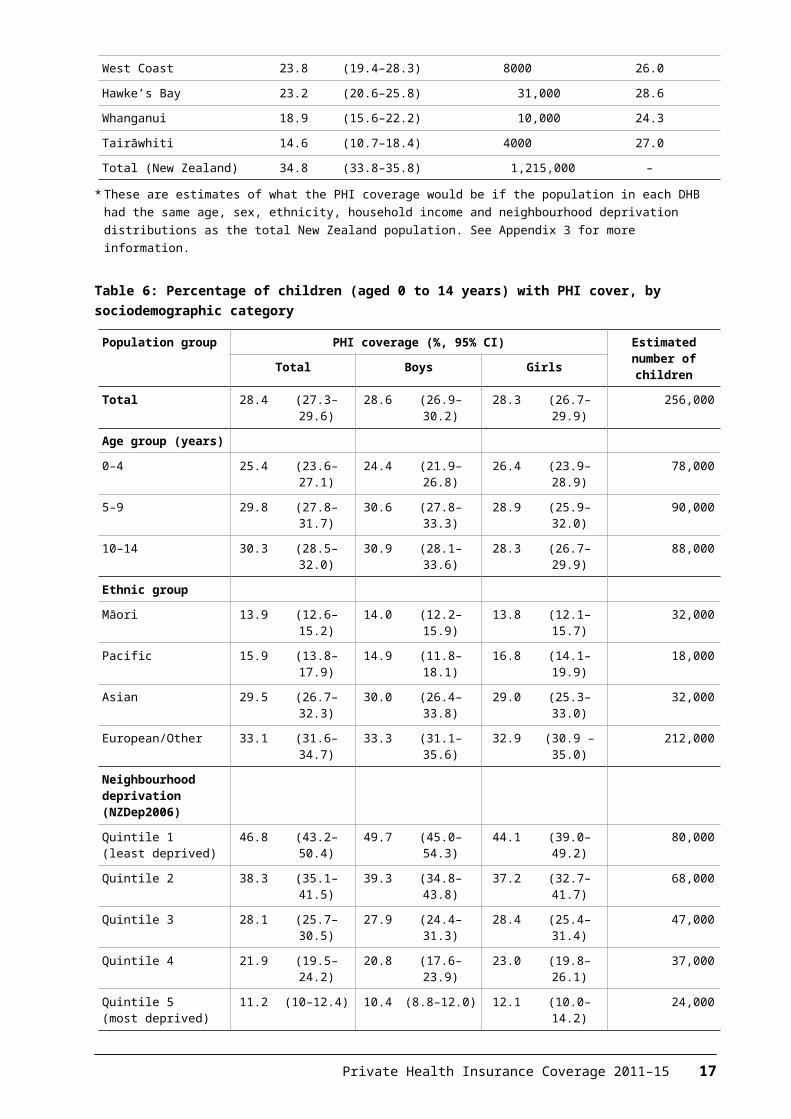
Table 6: Percentage of children (aged 0 to 14 years) with PHI cover, by sociodemographic category
Population group PHI coverage (%, 95% CI) Estimated number of children
Total Boys Girls
Total 28.4 (27.3–29.6) 28.6 (26.9–30.2) 28.3 (26.7–29.9) 256,000
Age group (years)
0–4 25.4 (23.6–27.1) 24.4 (21.9–26.8) 26.4 (23.9–28.9) 78,000
5–9 29.8 (27.8–31.7) 30.6 (27.8–33.3) 28.9 (25.9–32.0) 90,000
10–14 30.3 (28.5–32.0) 30.9 (28.1–33.6) 28.3 (26.7–29.9) 88,000
Ethnic group
Māori 13.9 (12.6–15.2) 14.0 (12.2–15.9) 13.8 (12.1–15.7) 32,000
Pacific 15.9 (13.8–17.9) 14.9 (11.8–18.1) 16.8 (14.1–19.9) 18,000
Asian 29.5 (26.7–32.3) 30.0 (26.4–33.8) 29.0 (25.3–33.0) 32,000
European/Other 33.1 (31.6–34.7) 33.3 (31.1–35.6) 32.9 (30.9 –35.0) 212,000
Neighbourhood deprivation (NZDep2006)
Quintile 1(least deprived)
46.8 (43.2–50.4) 49.7 (45.0–54.3) 44.1 (39.0–49.2) 80,000
Quintile 2 38.3 (35.1–41.5) 39.3 (34.8–43.8) 37.2 (32.7–41.7) 68,000
Quintile 3 28.1 (25.7–30.5) 27.9 (24.4–31.3) 28.4 (25.4–31.4) 47,000
Quintile 4 21.9 (19.5–24.2) 20.8 (17.6–23.9) 23.0 (19.8–26.1) 37,000
Quintile 5(most deprived)
11.2 (10–12.4) 10.4 (8.8–12.0) 12.1 (10.0–14.2) 24,000
Table 7: Adjusted rate ratios for children (aged 0 to 14 years) with PHI cover
Comparison Adjusted rate ratio (95% CI) Significant (*) Adjustment variables
SexBoys vs girls 1.0 (0.9–1.1) Age
MāoriMāori vs non-Māori 0.4 (0.4–0.5 ) * Age, sex
PacificPacific vs non-Pacific 0.5 (0.5–0.6) * Age, sex
AsianAsian vs non-Asian 1.1 (0.9–1.2) Age, sex
Neighbourhood deprivation (NZDep2006)Most deprived vs least deprived
0.3 (0.2–0.3) * Age, sex, ethnicity
Note: An asterisk (*) shows that results are statistically significant at the 95% level of significance (ie, the 95% confidence interval does not contain the value 1).
Private Health Insurance Coverage 2011–15 15

Table 8: Percentage of children (aged 0 to 14 years) with PHI cover, by DHB
DHB PHI coverage (%, 95% CI) Estimated number of children
Auckland 43.0 (37.5–48.6) 37,000
Canterbury 38.7 (34.9–42.6) 33,000
Waitemata 35.8 (30.9–40.6) 35,000
Southern 34.1 (28.0–40.1) 20,000
Capital & Coast 32.8 (28.4–37.1) 19,000
South Canterbury 27.6 (19.1–36.1) 3000
Counties Manukau 27.3 (23.5–31.2) 29,000
MidCentral 26.8 (21.2–32.5) 11,000
Wairarapa 26.5 (12.8–40.2) 2000
Bay of Plenty 26.0 (22.5–29.6) 16,000
Hutt Valley 24.2 (18.3–30.2) 8000
Waikato 19.7 (14.7–24.6) 13,000
Taranaki 18.7 (13.5–24.0) 6000
West Coast 17.3 (9.5–25.0) 1000
Northland 17.2 (13.2–21.2) 7000
Lakes 15.2 (9.7–20.7) 4000
Hawke’s Bay 15.0 (10.4–19.6) 5000
Nelson Marlborough 14.5 (10.9–18.1) 4000
Whanganui 12.8 (7.5–18.0) 2000
Tairāwhiti 11.7 (6.9–16.5) 1000
Total (New Zealand) 28.4 (27.3–29.6) 256,000
Table 9: Percentage of adults (aged 15 years and over) with PHI cover, over time since 1996/97 (unadjusted prevalence)
Year PHI coverage (%) 95% CI
1996/97 40.1 (38.4–41.9)
2002/03 39.0 (37.7–40.4)
2006/07 38.0 (36.8–39.1)
2011–15 34.8 (33.8–35.8)
Table 10: Significance of difference between years (age-standardised p-values) for percentage of adults (aged 15 years and over) with PHI cover
Significance of difference between years(p-value)
1996/97 and 2011–15 0.00*
2006/07 and 2011–15 0.00*
Note: An asterisk (*) shows a statistically significant difference between the years.
16 Private Health Insurance Coverage 2011–15

Table 11: Percentage of children (aged 0 to 14 years) with PHI cover, over time since 1996/97
Year PHI coverage (%) 95% CI
1996/97 31.1 (27.3–34.9)
2006/07 31.2 (29.3–33.0)
2012–15 28.4 (27.3–29.6)
Table 12: Significance of difference between years (age-standardised p-values) for percent of children (aged 0 to 14 years) with PHI cover
Significance of difference between years(p-value)
1996/97 and 2011–15 0.01*
2006/07 and 2011–15 0.18
Note: An asterisk (*) shows a statistically significant difference between the years.
Table 13: Who pays for the PHI for adults (aged 15 years and over) with PHI cover
Percent (%) 95% CI Estimated number of adults
Self or family members 79.2 (78.3–80.0) 961,000
Partly self or family and partly employer 9.4 (8.8–10.1) 115,000
Paid for by employer or employer of family member 10.6 (10–11.2) 128,000
Paid for by some other person or agency 0.8 (0.6–1.1) 10,000
Table 14: Who pays for the PHI for adults (aged 15 years and over) with PHI cover, by household income
Self or family member Partly self or family and partly employer
Paid for by employer or employer of family member
Percent (%, 95% CI) Percent (%, 95% CI) Percent (%, 95% CI)
Total 79.2 (78.3–80.0) 9.4 (8.8–10.1) 10.6 (10–11.2)
Household income
$20,000 or less 90.9 (86.1–95.6) 3.5 (0.2–6.9) 4.3 (0.6–7.9)
$20,001–$30,000 92.1 (88.6–95.7) 3.7 (0.8–6.5) 1.4 (0.4–2.4)
$30,001–$50,000 84.6 (82.3–87.0) 7.0 (5.0–8.9) 6.8 (5.2–8.4)
$50,001–$70,000 79.5 (77.2–81.9) 9.9 (8.2–11.6) 9.6 (8.1–11.0)
$70,001–$100,000 74.0 (71.9–76.2) 10.9 (9.4–12.4) 14.0 (12.4–15.6)
$100,000 or more 74.9 (73.2–76.6) 11.9 (10.8–13.0) 12.9 (11.7–14.2)
Private Health Insurance Coverage 2011–15 17
Appendix 3:Modelling the dataA logistic regression model was fitted to the respondent-level data from the NZHS to better understand the variation in PHI coverage across DHBs. The dependent variable was whether or not the respondent is covered by PHI. The explanatory variables were age, sex, ethnicity, household income, neighbourhood deprivation (NZDep2006 quintile) and DHB.
The odds ratios presented in Table 15 indicate the influence of each of the explanatory variables on the likelihood of a respondent being covered by PHI, while controlling for the other variables in the model.
Table 15: Independent effects of demographic and socioeconomic variables on PHI coverage
Variable Levels Odds ratio 95% confidence intervals
Age group 15–24 1 1–1
25–34 0.92 0.81–1.05
35–44 1.18 1.05–1.32
45–54 1.28 1.14–1.45
55–64 1.35 1.18–1.53
65–74 1.09 0.95–1.24
75+ 0.67 0.58–0.78
Sex Female 1 1–1
Male 0.92 0.87–0.98
Ethnicity Māori 1 1–1
Pacific 0.95 0.82–1.11
Asian 1.93 1.74–2.15
European/Other 1.7 1.57–1.84
Household income $20,000 or less 1 1–1
$20,001–$30,000 0.92 0.75–1.14
$30,001–$50,000 1.76 1.49–2.08
$50,001–$70,000 2.97 2.55–3.45
$70,001–$100,000 4.48 3.79–5.3
$100,000 or more 7.48 6.37–8.79
Don’t know or refused 2.39 2.04–2.79
NZDep2006 Quintile 1 (least deprived) 2.41 2.11–2.75
Quintile 2 1.92 1.68–2.2
Quintile 3 1.51 1.35–1.71
Quintile 4 1.35 1.2–1.52
Quintile 5 (most deprived) 1 1–1
18 Private Health Insurance Coverage 2011–15

Variable Levels Odds ratio 95% confidence intervals
DHB Auckland 1 1–1
Waitemata 0.85 0.7–1.02
Counties Manukau 0.85 0.69–1.05
Canterbury 0.82 0.67–1.01
Hutt Valley 0.79 0.65–0.97
Waikato 0.77 0.63–0.94
MidCentral 0.75 0.57–0.98
Capital & Coast 0.74 0.61–0.91
Southern 0.68 0.55–0.83
South Canterbury 0.64 0.51–0.81
Lakes 0.63 0.51–0.78
Bay of Plenty 0.61 0.51–0.74
Taranaki 0.59 0.48–0.73
Northland 0.57 0.46–0.71
Hawke’s Bay 0.53 0.43–0.66
Wairarapa 0.53 0.4–0.69
Nelson Marlborough 0.49 0.4–0.59
Tairāwhiti 0.49 0.35–0.68
West Coast 0.46 0.35–0.6
Whanganui 0.41 0.32–0.54
Private Health Insurance Coverage 2011–15 19


