Download - Presentation to CHNEP Science
Lemon Bay Watershed
Management Plan
Presentation toCHNEP Science
ForumJuly 8, 2009
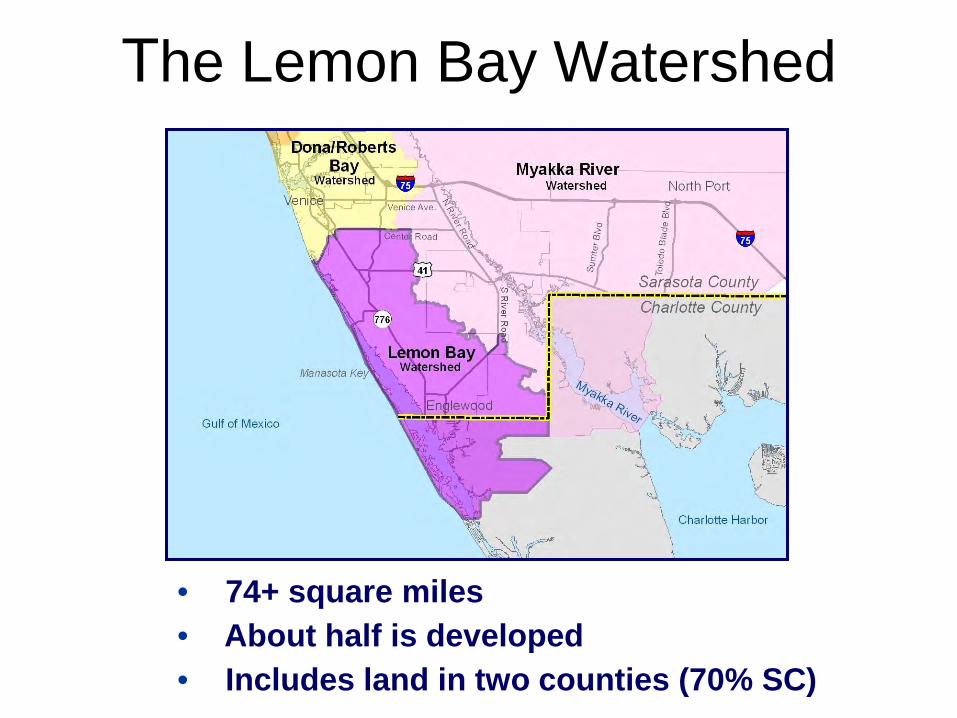
The Lemon Bay Watershed
• 74+ square miles• About half is developed• Includes land in two counties (70% SC)

Lemon Bay Watershed

SWFWMD Manasota Basin –Lemon Bay & Watershed
Charlotte Harbor National Estuary Program

Lemon Bay Watershedlandscape development timeline
• Developed Prior to 1972 Clean Water Act.
• Developed between 1972 and 1984
• Developed After 1984 Statewide ERP permitting
requirements

Sarasota County Lemon Bay Watershed Management Plan Focus
• Build upon 2004 Lemon Bay League Interagency Comprehensive Watershed Management Plan
• Formulate plans and actions to address federal and state water quality standards.

TMDL impairmentsALLIGATOR CREEK
Dissolved OxygenFecal Coliform
Nutrients (Chlorophyll-a)
GOTTFRIED CREEK
Dissolved Oxygen Fecal Coliform
OYSTER CREEK
Dissolved Oxygen
CENTRAL LEMON BAY ESTUARY
Bacteria (Shellfish) Fecal Coliform
SOUTHERN LEMON BAY ESTUARY
Bacteria (Shellfish)
FORKED CREEK
CopperDissolved Oxygen
Nutrients (Chlorophyll-a)
WOODMERE CREEK
Dissolved Oxygen Fecal Coliform
Nutrients (Chlorophyll-a)
AINGER CREEK
Dissolved Oxygen
BUCK CREEK
Dissolved Oxygen Nutrients
(Chlorophyll-a)
NORTHERN LEMON BAY ESTUARY
Nutrients (Chlorophyll-a)

Identify goals
• Minimize water pollution in the creeks and bay
• Maintain water clarity in estuary
• Improve natural habitat
• Conserve water (right water, right use)
• Optimize flood protection
• Reduce sediment
• Involve the community

Assess watershed
Historical and Existing Conditions
• Flows to the bay?
• Pollutants to the bay?
• Habitat/Land-use changes?
• Impacts to the bay?

PracticesLID
fertilizer control
County maintenance
water efficient landscaping
Develop and implement recommendations
ProjectsWQ
Improvement
Sediment abatement
Habitat Improvement
Central sewer
expansion

Developing a watershed plan
1. Collect Existing Information– Historical Information– Data
2. Identify Natural Resources for Protection– Wetlands, Mangroves, Seagrass, Water Quality, Shellfish, Etc.
3. Identify Targets Protective of Resources
4. Develop Goals-Recommendations-Projects to Meet Targets
5. Develop Tools to Evaluate Progress Towards Goals

Environmental Indicators• Seagrasses
– Habitat for many species– Limited by light availability influenced by WQ
• Pollutant Loading– Includes oil/grease as well as nitrogen and phosphorus which
influence algal blooms
• Water quality– Dissolved oxygen – Chlorophyll – algae– Light
• Land use– Impervious surfaces

EvaluationPollutant LoadingObserved Data
Identify targets
Compare data to target
Report
Hydrology History

Example: water budgetSteps
1) Identify Historic Flows• 1948 Land Use – aerial photo’s
2) Identify Current Flows• 2006 Land Use
3) Compare – using same hydrology

Lemon Bay Volume Inputs

Current Total Volume

FORKED CREEK21% ↑
ALLIGATOR CREEK49% ↑
GOTTFRIED CREEK20% ↑
AINGER CREEK3% ↑
WOODMERE CREEK55% ↑
LEMON BAY COASTAL14% ↑
ALLIGATOR CREEK49% ↑
AINGER CREEK3% ↑
Volume Changes: Historic to Current

Volume Changes: Historic to Current

Volume Changes: Current to Future

Runoff Changes: Historic to Current

Runoff Changes: Historic to Current

Current Runoff

Example: seagrass extent
In cooperation with the CHNEP, seagrass targets are being established in Lemon Bay.
Steps:1. Identify baseline:
- 1950’s areal extent of seagrass
2. Compare current seagrass extent to 1950’s- Photo-interpretation

Upper Lemon Bay (draft)

Lower Lemon Bay (draft)

Example: seagrass targets cont’d
3. Evaluate the difference between historical and current seagrass coverage
4. Establish target
5. Identify requirements necessary to achieve goals (e.g. Water Quality Conditions)

Example: water qualityindicators status and trends
Indicators include:• Phosphorus • Nitrogen • Chlorophyll - Phytoplankton• Light Attenuation• Dissolved oxygen

Example: water quality (draft)
02468
101214
1998 1999 2000 2001 2002 2003 2004 2005 2006 2007
Chl
a (u
g/l)
Chlorophyll a (µg/l)
State Threshold

2008 Overall Lemon Bay Score
Good
Other Indicators• No Swim Advisory – 1• Red Tide Cell Counts – Below detection• DEP Assessment showed no impairments
Water Quality–Chlorophyll – a measure of algae in the water; depends upon nutrient loading and water circulation; affects water clarity.– Water Clarity – a measure of the amount of light that reaches the bottom; depends upon chlorophyll, turbidity, water color, and suspended sediments; affects seagrass growth and reproduction.– Dissolved Oxygen – a measure of the amount of O2 in the water; depends upon the amount of algae and decomposing organic matter; affects habitats for fish and bottom-dwelling organisms.– Total Nitrogen – a measure of the amount of nitrogen in the water; depends upon amount of runoff from fertilizer, pet waste, and other sources; affects algae levels. – Pollutant Loading – an estimate on the amount of nutrients flowing off the watershed to the bay; depends upon rainfall, and land use; affects water quality
Seagrass – a critical habitat for many organisms and a good indicator of bay ecological health; depends upon water clarity and physical setting.
Oysters – an important bay resource and indicator of bay ecological health; depends upon good water quality and physical setting.
Report Card Indicators
BAY WATER QUALITY INDEX
Indicator Score
Chlorophyll Good
Water Clarity Good
Dissolved Oxygen
Good
Total Nitrogen Good
Nutrient Loading Fair
TOTAL WQI SCORE
Good
How are these scores calculated?The methods used to calculate these scores and the data used can be found on the Sarasota County Watershed Atlas –http://www.sarasota.wateratlas.usf.edu/
2008Report Card Results
BIOLOGICAL BAY QUALITY INDEX
Indicator Score
Seagrass Good
Oysters Good
TOTAL BQI SCORE
Good
Trends in IndicatorsChlorophyll
0
1
2
3
1998 1999 2000 2001 2002 2003 2004 2005 2006 2007 2008
Seagrass Oysters
0
1
2
3
1998 1999 2000 2001 2002 2003 2004 2005 2006 2007 2008
TN Loading
0
1
2
3
1998 1999 2000 2001 2002 2003 2004 2005 2006 2007 2008
Dissolved Oxygen
0
1
2
3
1998 1999 2000 2001 2002 2003 2004 2005 2006 2007 2008
Total Nitrogen
0
1
2
3
1998 1999 2000 2001 2002 2003 2004 2005 2006 2007 2008
0
1
2
3
1998 1999 2000 2001 2002 2003 2004 2005 2006 2007 2008
Water Clarity
0
1
2
3
1998 1999 2000 2001 2002 2003 2004 2005 2006 2007 2008

-1.5-1
-0.50
0.51
1.52
1994
1995
1996
1997
1998
1999
2000
2001
2002
2003
2004
2005
2006
2007
2008
Fast FactsWatershed Area ~75 square miles - 50% urbanized• Major Tributaries
– Alligator Creek, Woodmere Creek– Forked Creek, Gottfried Creek– Ainger Creek, Buck Creek, Oyster Creek
• Aquatic Preserve
• Extensive seagrass, mangrove and shellfish habitat
2008 Update• The rainfall in 2008 was significantly lower than the long-term average.• Chlorophyll and water clarity were exceptionally good.• Lower pollutant loads followed the lower rainfall.•The most recent aerial survey results show an increase in seagrass coverage.•9 Neighborhood Environmental Stewardship Teams working to improve the watershed•Watershed projects were started in several tributaries.•Scallops have been found for the first time since XXXX in the bay.•Other CIP updates?
Acknowledgementsand
Further Information
The data and information used in the Lemon Bay Report Card were provided by the following monitoring programs:
Support through the Southwest Florida Water Management District was made possible with funding from the Manasota Basin Board’s Cooperative Funding Program.
Further information regarding the contents of this report card can be found on the Sarasota County Water Atlas at http://www.sarasota.wateratlas.usf.edu/
DRAFT
Lemon Bay2008 Report Card
Rainfall
Average
Minimum
Maximum
2008
LINKSwww.scgov.netwww.sarasota.wateratlas.usf.eduwww.swfwmd.state.fl.uswww.lemonbayconservancy.orgwww.sarasotabay.orgwww.chnep.orgwww.dep.state.fl.uswww.ifas.ufl.eduwww.epa.gov
2008HydrologicConditions
HOT LINEINFORMATION:555-123-4567
Freshwater Flows
Wet Years
Dry Years


