
COMPUTER-BASED ANALYTIC METHODS USEFUL IN
CONSIDERATION OF THE
RATEMAKING STANDARDS OF PURPA
prepared by
THE NATIONAL REGULATORY RESEARCH INSTITUTE 2130 Neil Avenue
Columbus, Ohio 43210
for the
U. S. DEPARTMENT OF ENERGY ECONOMIC REGULATORY ADMINISTRATION
DIVISION OF REGULATORY ASSISTANCE
AUGUST 1979


FOREWORD
This report was prepared by The National Regulatory Research Institute (NRRI) under Contract No. EC-77-C-Ol-8683 with the U. S. Department of Energy (DOE), Economic Regulatory Administration, Division of Regulatory Assistance. The opinions expressed herein are solely those of the authors and do not reflect the opinions nor the policies of either the NRRI or the DOE.
The NRRI is making this report available to those concerned with state utility regulatory issues since the subject matter presented here is believed to be of timely interest to regulatory agencies and to others concerned with utility regulation.
Douglas N. Jones Director


TABLE OF CONTENTS
SECTION ONE: INTRODUCTION. . . . . . . . . . . . . . ..
SECTION TWO: IDENTIFICATION OF ANALTYIC METHODS IMPLIED BY PURPA STANDARDS. . ...
Cost of Service .... Declining Block Rates. Time-of-Day Rates ...
Page
1
Seasonal Rates . . . . . . .... .
1
1 3 5 6 6 7 8 9
Interruptible Rates. . . . . . .. . Load Management Techniques .............. . Master Metering .... ,0 • • • • • • • • • ••••
Automatic Adjustment Clauses ....
SECTION THREE: DATA MANIPULATIONS PERFORMED BY ANALYTIC METHODS IDENTIFIED ..
Load Forecast i n9 . . . . Price/Demand Elasticity .. . Load Characteristics ... . Class Responsibility Production Costing ...... . Facility Planning Plant Financing Cost Allocation .. FAC Monitor ....
SECTION FOUR: EXTANT CO~1PUTERIZED PROGRAMS SUPPORTING THE
. . .. 10
10 . . . . 11
13 15 16 17 18 19 21
ANALYTICAL METHODS . . . . . . . . . . . . . . . . . 23
LIST OF FIGURES
Figure 1: INFORMATION FLOW DIAGRAM ...... . Figure 2: ILLUSTRATION OF DISPERS]ON EFFECTS OF
TIME-DIFFERENTIATED RATES . . . . . .... Figure 3: SUPPORTIVE COMPUTER PROGRAMS .. Figure 4: SOURCES OF COMPUTER PROGRAMS.
4
14 25
. . . . 30


I. INTRODUCTION
Title I of the Public Utility Regulatory Policies Act[lJ of 1978
(PURPA) has established a number of electric utility ratemaking standards
which must be considered for adoption by each state1s regulatory authority.
Since the fair consideration of these standards requires the collection,
organization, and manipulation of quantities of numerical data, it is
appropriate to examine in detail the computer-based programs which can
systematize the processing of such data. It is not the objective here
either to discuss the relative merits of the various accounting method-
ologies or to examine in detail the provisions of PURPA, both of which
tasks have been accomplished in part by the voluminous Electric Utility
Rate Design Study conducted by EPRI[2J. Described in thi's report are the
data man~pulations required by PURPA which are amenable to computerization.
II. IDENTIFICATION OF ANALYTICAL METHODS IMPLIED BY PURPA STANDARDS
It is advantageous from an heuristic approach to review each of the
ratemaking standards for the sake of identifying the analytic methods
required by an objective consideration of adopting that standard. Since
each method identified may be pertinent to several standards, detailed
discussion of methods is withheld from this secti:on.
1) Cost of Service: The electric rates for a class of consumers
should have as their basis the cost of service to that class. This cost
should show a functional dependency upon demand, energy, and customer
levels. Because the demand and energy components generally have a strong 1


variability with time-of-week and time-of-year, the costing method should
identify cost differences incurred by daily and seasonal use. Note that
the demand and energy variables may be viewed collectively as the
exhaustive cause of daily and seasonal cost variations; hence, the mention
of daily and seasonal cost differences serves only to further define the
level of detail required in the cost-component functions: they should be
explicitly functions of time, at least to the level of generic day (e.g.,
winter holiday, summer weekday, spring/autumn weekend). Thus for each
consumer class, it is necessary to have the hourly load curves as
distinguished by season and type of day. Furthermore, the costing method
should consider the costs of additional peaking capacity and base-load
generation incurred in meeting the class demands. This implies that the
costing should include not only historical but also projected data.
To perform a projection of the demand, energy and customer levels
requires a Load Forecasting package that includes demographic and
economic data for the region. The demand and energy projections should
be maintained by class of consumer and voltage level so that class
specific rates can be evaluated throughout the projected years.
The distribution of accounting costs to the demand, energy, and
customer categories requires a Cost Allocation package which is capable
of either an embedded-cost allocation or a marginal-cost calculation.
In support of this, a Load Characterization package is needed to convert
the hourly load curves to load-duration curves appropriate to an aggre
gate-time (as opposed to real-time) simulation methodology; a Production
~


Costing package is needed to relate the generation operations-and
maintenance expenses to the historic and projected demand and energy
functions; a Class Responsibility package is needed to determine the
relative responsibility of each consumer class for the existence and
construction of physical plant; a Plant Financing package is needed to
compute the cost of plant additions in terms of revenue requirements per
unit of load increase; and a Facility Planning package is needed to
project generation, transmission, and distribution plant additions as a
result of retirements and load growth. To convert the cost-function
output of the Cost Allocation package to a tariff is a straightforward
process of apportionment of the class cost-functions among the billed
members of each class. The flow of information among processing
packages is shown in Figure 1.
2) Declining Block Rates: The energy component of a rate for a
consumer class should decrease with energy consumption no faster than do
the energy-related costs. Thus declining block rates may be retained or
imposed to the extent that the energy-related marginal costs for a class
decrease with the consumption of that class.
This standard is seen not as a distinct addition to the ratemaking
formula, but as a clarifying restriction upon the primary standard of
service cost. No analytic methods other than those identified above
will be needed to weigh the equitability of rates with declining energy
block coefficients.
3


load
Load Forecasting
1 ( 1) I
s~veyt i weather
economic & demographic factors
FIGURE 1: INFORMATION
class hourly historic and ~ected loads __ Price/Demand
Elasticity
DIAGRAM
modified class hourly
Load Characteriza
(2) t-~;r-----~i tion (3)
rate structure I
elasticity survey
fairness p,arameters
-*---1 Class Respons i -~_J b i 1 i ty (4) I'
reliability threshold
configuration
system loadduration
existing 1 "[-!t F~Ci~~~'ij~J
plant " Planning O~~M costs ~ (6)
·----l----·--..--··-r---. system
proJected. configuration constructlon . budget t __________
j
responsibility . f I marginal as a funct i on Cost K--.l2l ant c~s t~______ Pl ant
!I
of demand, ---' Allocation I~ Financing energy, and customers (8) k " (7)
lG ttl, -~~:x~;----j! /\ R6R dlts i salaries & wages I I . depreciation
amortization & acquisition 'Ltotal and ma.rgina~-O&~1 costs
.----7i'~--
generation pl ant O&~1 costs --.- ... -.. ~.--, ...
Production Costing
&..-_--
T&D O&~1 costs as functions..J' of demand and energy
4
(5 )
I


3) Time of Day Rates: The rates for each consumer class should
vary with time-of-day to reflect corresponding variations in the cost of
service. However, if for any consumer c"lass the long-term benefits to
its members and to the utility are outweighed by additional metering and
associated costs, the standard is nullified for that class.
In considering this standard, a stream of expenses due to meter
installation and reading is to be compared with a stream of prospective
savings due to reduced operating and maintenance costs and reduced or
delayed capital expenditures for generating, transmission, and distribu
tion plant. For a first-order analysis, the prospective operations and
maintenance savings may be simplified to fuel savings. In either case,
it is clear that the load curves used in the Production Costing package
must carry detail at least to the hourly level, and must be subject to
alteration by the price elasticity of demand. A routine net-present
value calculation is required to bring the elements in the two cash~flow
streams into a single numeric pair for the long-run cost/benefit analysis.
Thus, in addition to a Plant Financing package for evaluation of
plant capacity savings, and to the two costing packages, a Price/Demand
Elasticity package is required to estimate the feedback effect of the
proposed time-of-day rates upon the load curve of each class. This
would logically be placed in series with the load-curve output from the
Load Forecasting package, as shown in Figure 1.
5


4) Seasonal Rates: The rates for service to each class should vary
with the seasonally-incurred costs in providing that service. Since the
seasons may be defined to change at roughly the same time as the meters
are read, very little additional metering and meter-reading expense is
anticipated, and cost-justification is not explicitly required.
If seasonal (as opposed to annual) accounting data were available
for all components of each class cost function, then this standard would
require merely a seasonal iteration of the costing and allocation process
outlined for the first standard. More likely, however, the seasonally-
differentiated load-curve data must be analyzed by the Production Costing
and Class Responsibility packages to determine seasonally-appropriate
factors for allocation of the annual accounting data to each season
defined in the tariff. This requires only a slight complication to be
added to the Cost Allocation package.
5) Interruptible Rates: Rates for interruptible service should be
offered to industrial and commercial consumers. Such rates should
reflect the reduced cost of providing interruptible service compared
with continuous service.
Since the purpose of such rates is the reduction of expenses due to
a leveling of the system load curve, this standard should be considered
using the same analytic methods as the time-of-day rates standard. The
6


possibility of defining the interruptible-service period as inclusive of
emergency situations outside the normal time period of system peaks,
offers the utility system a load-management advantage over that provided
by the diversified response to time-of-day rates: the interruptible load
is predictably responsive to peak-load-pricing whenever the peak (as
defined by the load interrupter) occurs, independent of prescribed
hours. Hence the interruptible consumerBs cost of service should show a
greater peak/base differential than a comparable consumer whose peak-load
signals come only by the clock. In the case of interruptible consumers,
the diversification of response comes in the acceptance or rejection of
the price discount offered for reduced quality of service; it is not
expected that all offers would be accepted. Hence the Price/Demand
Elasticity package must be capable of estimating the response to the
discount offer.
6) Load Management Techniques: Those techniques reliable and
effective in reducing demands upon system capacity should be offered to
consumer classes to the extent that they provide an expected savings to
the utility (and thence to the contributory classes) in long-run costs.
Each such technique under consideration is expected to entail some
capital outlay for energy storage or load-switching devices, in addition
to ongoing expenses for operations and maintenance. The benefits are
expected in the areas of reduced expenses for operations (specifically,
fuel) and maintenance. Depending on the location of the energy-storage
7


device (compare, e.g., residential water tanks with a pumped-storage
reservoir), the fair evaluation of each technique1s cost-efficacy may
involve the consideration of capital plant outside the utility company
proper in the stream of cash flows pertinent to the long-run estimation
of savings. To fit the framework of Figure 1, such exogenous costs
would analytically be considered in aggregate as an endogenous cost
borne by the utility exclusively for the sake of that consumer class
accepting the load-management technique. The consideration of each
diurnal technique requir~s, therefore, the same methods of analysis as did
time-of-day rates; consideration of longer-term (e.g., annual cycle)
energy storage techniques requires these same methods applied to both
daily and appropriately longer-term capacity reductions. For example, a
storage technique capable of smoothing cyclic load variations over a
period of one week should be considered beneficial in impacting not only
the weekday load-factor but also that for the entire week.
Although the next two standards are not pertinent to ratemaking,
they are included here for the sake of orderly discussion.
7) Master Metering: The use of master meters in new buildings is
restricted to those buildings for which the long-run savings to its
consumers due to reduced consumer-related costs and meter expenses is
greater than the savings 'under the alternative unit-metering due to
individual price incentives to minimize consumption.
8


To execute the determinations required by this standard, the Price/
Demand Elasticity package must be used to estimate the reduction in
hourly demand by a group of consumer units when each is given an oppor
tunity to save by curtailing its consumption, over the demand by that
group having a single shared bill. The package should be capable of
predicting load shifts based on input data on the statistical behavior
of consumers in group-pricing situations. The alternative sets of load
data would be processed in separate calculations of the expected annual
bills using existing rates appropriate to each class. The net present
worth of these'billed differences (which include customer-costs), less
the expense of meter purchase and installation, will determine the cost
efficacy of separate metering.
8) Automatic Adjustment Clauses: Each automatic fuel-cost-recovery
clause should provide incentives for economic purchase and use of fuel
and electric energy.
To execute the provisions of this standard, it is expected that a
fuel-adjustment-clause monitoring (FAC Monitor) package would be used
to periodically audit the performance of each utility, alone and in
comparison with others, in the areas of economic purchase of fuel,
thermal efficiency of generating plant, and economic purchase of power
from a pool or network grid. A state regulatory authority may arguably
insist, however, that its adjustment clause provides the mandatory
incentives without performing any such audit of performance.
9


Inasmuch as the consideration of adoption of Lifeline Rates or the
remaining standards of Section 113 does not require cost-justification
by the provisions of Title I, no evaluation of numeric data is apparently
needed. These matters will be decided most likely on the basis of legal
and political ramifications rather than strict economics. Of course the
design of various lifeline rates may require particular data collection
and manipulation.
I I I. DATA t,1ANIPULATIONS PERFORMED BY ANALYTICAL METHODS IDENTIFIED
For each of the analytic methods required by consideration of
adoption of, or by implementation of, the standards reviewed above, a
generic description is given of the input and output data and the
algorithms used. For details specific to an existing computer-based
model, the reader is directed to the documents referenced in section IV.
1) Load Forecasting: Intended to project hourly load curves by
consumer class and by season, for typical and peak days for ten years,
this package requires as input: historic load data in the same detail;
temperature data for normalization of weather~sensitive components;
and sufficient area-specific demographic and economic data to project
industrial load, commercial load, number of residences and their
appliance mix. For each group of consumer classes having distinct
historic load characteristics, the load is broken into base and
temperature-sensitive components. Using data on that group's installed
10


heating and air-cooling capacity, regression techniques are used to deter-
mine coefficients of peak-demand and energy change with temperature.
Consideration of both saturation of installed air-cooling equipment and
mandatory restrictions of operating thresholds should be made before
extrapolating the weather-sensitive components. Given the probabilistic
nature of future weather, account is taken of a range of probably extra-
polations within a confidence band. Using the demographic and economic
data, regressions are performed on historic base-load data, and the
appropriate extrapolations are performed. At this point, daily peak
demand and energy has been projected by class and season for weekdays
and weekends. To project the hourly data, correction factors relating
increases in hourly consumption to daily energy are computed by correlating
historic data for comparable days[3]. Aggregation of projections across
consumer classes ytelds the system load.
Virtually all the output of the Load Forecasting package is
duplicated by the utility-supplied data submitted in conformance with
FERC regulations[4], with the exception of projected class hourly
loads, which may be useful in analysis of time-of-day pricing and
load management techniques. It is anticipated, however, that state
regulatory authorities will pursue an independent projection of the
verifiable historic data, hence will employ their own forecasting
methodology.
2) Price/Demand Elasticity: Three sets of survey data must be
provided to this package. The first will consist of hourly load data
11


from a sample of consumers under experimental time-of-day rates and
comparable data from a control group, as in the Wisconsin Electricity
Pricing Experiment[5]. These data allow calculation of the elasticity
of diversified substitution of off-peak energy for peak energy, as a
function of the duration of the peak period and of the price ratio.
The data for evaluation of interruptible rates is of a similar form,
but can be obtained by a survey of willingness to subscribe at the
various discount rates, without any time-consu~ing experiment. The
third set consists of data comparing consumption of master-metered
units with that of separately metered units under similar circumstances
of tenants' income and appliance stock; such data may be available by
scrutiny of historic bills.
In each case, the derived elasticity function will be used as a
control parameter for,each iteration of the package, which merely
accepts the unmodified historic or projected class load curve as an
input vector, multiplies each element by the load ratio for that hour
appropriate to the rate-policy under investigation, and produces an
output vector of modified hourly loads. In the case of time-af-day
rates, the multiplier is expected to be more complex than a two-valued
diagonal matrix. In general, the hourly loads under time-of-day rates
will be a function also of proximity to the price-switching times. These
effects are taken into account by employing a matrix of multiplier
elements; for modification of a vector of 24 hourly loads for, e.g.,
the seasonal peak day for one class, the matrix need be no larger than
24 square.
12


The general shape of the proximity-sensitive multiplier is illustrated
by Figure 2.
The package will be used repeatedly to generate a family of
hypothetical load curves, one for each proposed combination of price
differential and peak-period duration. Even if greater complexity
than two-valued rates is contemplated (e.g., shoulder-periods) the
approach outlined is sufficient. The package can thus be used, in
conjunction with the packages downstream from it in the data flow of
Figure 1, to define the rate periods and to estimate their net
efficiency in reducing costs.
3) Load Characterization: Intended to reduce hourly class and
system load data to the form of load-duration curves and graphs, this
package requires as input the 60-minute-integrated demand data indexed
by hour of day, day of week, day of month, month, and year (as, e.g.,
supplied to the Edison Electric Institute). Under the direction of
input parameters defining the period and day-types of interest, the
package scans the database for qualifying days, counting frequency of
occurrence at indexed discrete load-levels. The resultant load
frequency array is transformed to a load-duration array by simple
accumulation of the frequencies (hours) counted. An auxiliary graphing
routine may be used to display the load-duration curve or the hourly
average and peak loads for specific days of the week. The latter, while
not of analytic value to downstream packages, may be found useful in
preliminary stages of defining peak-load-pricing periods. The load-
13


FIGURE 2: ILLUSTRATION OF DISPERSION EFFECTS OF TIME-DIFFERENTIATED RATES
System Load With Flat Rates, in Units 6f Power
TOO Rates, in Monetary Units per Unit of Energy
o o Time-of-day, ; n hours
j
o
24
~------------------------------
Resultant Load Multiplier
1 .0
o
o Time-of-dpY, in hours 24
o :Time-of-day, in hours 24
14


duration curve, or its normalized version, the load-probability curve,
provides fundamental input to the Facility Planning and Production
Costing packages.
4) Class Responsibility: The fixed and operating costs of plant
fuel, maintenance, ownership, new construction, taxes, etc., must be
fairly distributed across the consumer classes. The desired output is
thus a set of three vectors (one each for demand, energy, and customer
categories) of responsibility by class, whose elements sum to unity in
each case. In the absence of justifiable bias, it .is expected that the
cost of service standard would imply that elements in the energy vector
be proportional to class energy consumption, and that those in the
customer vector be proportional to number of customers in each class.
It may not, however, be difficult to justify higher-than-average costs
for classes of large-usage or few customers.
The bulk of the processing work is perfo~ed in determination of
the demand vector. This requires judgmental input of parameters
defining a) whether peaks ~hal1 be counted at hours coincident with
system peaks, or simply at class peaks; b) the number of peaks to be
counted to obtain a statistically valid picture of relative demand;
c) the fraction of the summer and winter peaks considered the threshold
for high-energy consum~tion; and d) the relative weighting factors
associated with the peak responsibility, summer high-energy responsi
bility, and winter high-energy responsibility. Implicit in the package
methodology is the decision to consider class peaks' significance on
15


the basis of probability of contribution to system peak, or on the
basis of probability of loss-of-load (LOLP), which probabilities may
differ considerably dependent upon the maintenance schedule for
generation plants. The package scans the hourly-load data over
the seasons and years of interest, accumulating peak demand, LOLP, and
high-energy data for qualifying hours. The ratio of each class sum to
the system total, combined across peak and high-energy categories
using the,weighting factors, yields the demand-responsibility vector.
5) Production Costing: The operations and maintenance costs for
generation of electricity are to be expressed, by FERC accounts, as
functions of the system load. As input, the package requires the
system load-duration curve, the set of plant operating parameters (heat
rates, fuel costs~ block-capacities, forced-outage rates), and the
loading order (including effects of scheduled maintenance). Each unit1s
block-loading under probabilistic simulation of forced outages contrib
utes an increment of energy to the system as it is brought on-line.
Multiplying the energy increment by the fuel cost yields the system
fuel-cost increment. If non-fuel O&M production expenses are assumed
to have some simple relationship, for each type (e.g., hydro, nuclear,
gas turbine) of unit, to the energy produced by that unit, then stepping
through the loading order allows the production cost to be accumulated
for the particular load-duration curve used as input. By iteratively
calculating the total cost for a set of incrementally larger load
duration curves, the production cost is determined as a function of
demand. Numerical differentiation of this continuous function yields
16'


the marginal energy cost as a function of demand (system integrated
hourly load).
6) Facility Planning: Changes in the system load curves are
reflected in changes in the optimal expansion plan for generation, trans
mission, and distribution plant. This package requires as input the
seasonal system load-duration curve (in array form), the set of operating
parameters for existing and anticipated plant-types, the configuration
of the existing plant mix, and the reliability threshold for consideration
of future configurations. The comparative simplicity and short lead-times
of transmission-and-distribution (T&D) planning have concentrated
packaged efforts mainly on generation-facility planning; effects of load
management and peak-pricing upon T&D expansion plans should not be ignored,
however. Some sort of marginal (i.e., correct for small changes to the
existing T&D configuration) relationship must be drawn between a
hypothetical increase in demand and the expected addition of T&D plant
(see Reference 4, paragraphs 290.304 and 290.305).
The generation-planning section uses an optimization approach
to examine the costs of pursuing each of the feasible branches of a
multi-step (long-term) expansion plan; the lowest-cost (up to the
planning horizon) sequence of configurations is defined as optimal.
Note that the type of load-growth (in the base, cycling, or peaker
regions), as well as the existing plant mix, determine to a large extent
the type of plants needed to supply marginal growth; one should not
assume that the marginal cost of increased generation capacity is that
of adding peaking units alone.
17


7) Plant Financing: Given a schedule of plant retirements and
new construction, this package computes revenue requirements to satisfy
parametric constraints (e.g., return on ratebase or common equity).
Supporting data required are historic debt and preferred stock obliga
tions, federal and local tax rates, capitalization and dividend-payout
ratios~ value and depreciation rates of plant by categories, and AFDC
rates and trends. From the Production Costing package, data are needed
on projected running costs categorized by operations, maintenance, fuel,
and purchased power. Under the parametric constraints, the package
projects annually to the planning horizon, issuing debt and stock as
required to finance the new construction program. The marginal cost of
plant capacity is obtained by tracking changes in revenue requirements
due to changes in the construction plan. Since distinct types of plant
(generation, transmission, and distribution) may be allocated differently
to demand, energy, and customer categories, the output marginal cost
should, be maintained in disaggregate form by plant type.
Note that a relaxation of some of the non-linear constraints may
permit the unitized marginal cost of plant to be approximately computed
by considering only a few elements: book and tax depreciation rates,
interest rate of debt, property taxes, insurance, income taxes and
deferrals, investment tax credit, and the required rate of return[6].
Such simplifying approximations may prove useful in performing first
order estimates and in bounding the range of reasonable results from a
more detailed model.
18


8) Cost Allocation: The system-wide annual cost of service is
required to be fairly allocated to a ratemaking matrix having demand,
energy, and customer components for each class of service distinguished
by a separate rate. The FERC Uniform System of Accounts provides that
all operations and maintenance accounts have their data functionalized
by five categories: production, transmission, distribution, customers,
and administrative and general. Other major expense accounts (deprecia
tion, state excise tax, other taxes, net operating income, and amortiza
tion and acquisition expenses) are allocated to the five functional
categories generally according to the distribution of net plant in
service in those categories; the exceptions are payroll taxes (allocated
proportionately to salaries and wages) and taxes other than excise,
federal, property or payroll (assigned entirely to administrative and
general).
Next, the sums in the five functional categories are allocated to
demand, energy, and customer components. This may be accomplished by
consideration of historical cost-incurrence and logical assignment
either by individual accounts or by grouped accounts. For example,
all depreciation and property taxes may reasonably be assigned to the
demand component; steam plant maintenance, which may be assigned to a
particular range of system loads, is reasonably allocated to demand and
energy components using the same load-specific criteria as discussed
under Class Responsibility.
19


Since Section 133 of PURPA requires cost-of-service data pertinent
to consideration of its ratemaking standards to be submitted separately
by components of demand, energy, and customers, the above allocation
steps will be required only for those accounts not pertinent to the
standards. They are still necessary, however, to express the full cost
of service in component terms, so that the hypothetical rates derived
therefrom will be comparable to existing tariffs and will fully recover
the required revenues.
In contrast to the allocation of embedded costs described above,
a marginal-cost approach would express expenses in each of the func-
tional categories (production, transmission, distribution, customers,
and administrative and general) not as fixed fractions allocable
to the three components, but as a generalized function of these com-
ponents as arguments. Note that if this function were linear in
each argument, it would degenerate to imply a 5 x 3 matrix of allo-
cation coefficients, as in the embedded-cost approach. Hence, the
calculation of marginal costs requires the development of five non-
linear cost functions which, for the purposes of numerical compu-
tations, are combined and expressed on a set of discrete three-
dimensional points covering the range of component-space over which
the utility operates. Assuming that this aggregate function is
linearly separable into demand, energy, and customer components,
its three partial derivatives at any point in the component-space
are the short-run marginal cost components. Applications to multi
period pricing have been discussed in the literature [7J
20


The demand, energy, and customer components, as submitted or
derived, must be distributed across the rate-differentiated classes by
using the class-responsibility vectors. The resultant array or rate-
'making deternlinant is used to close the feedback loop around the
information-flow model; a modified rate structure acts as parametric
control of the Price/Demand Elasticity package, causing effects on the
system load curves, which drive each of the other packages (except
Load Forecasting) to a new state.
The portions of the model recommended for breaking the loop to
investigate sensitivity to judgmental input are 1) the cost-allocation
factors relating the functional categories to components; 2) the
.responsibility parameters defining those portions of load to be
considered demand-related; and 3) the highly visible area of rate
structure design as a function of class components. In each case there
is room for considerable latitude of considered opinion. Therefore a
range of parametric values is appropriate for study in the process of
considering each PURPA standard.
9) FAC Monitor: This package is considered separate from the
others because its conclusions are not impacted by hypothetical changes
in the system load characteristics; it covers only historical data on
heat rates, fuel costs, and purchased power. It organizes .the monthly
data, making comparisons with the recent past to call attention to
abnormal purchases or operating conditions. Computation of achieved
21


heat rates allows comparison with target values used in a program of
incentives for improved fuel efficiency. Energy purchases from avail
able pools are checked for economic advantage.
22


IV. EXTANT COMPUTERIZED PROGRAMS
SUPPORTING THE ANALYTIC METHODS
A review of a compendium[8] of abstracts of publicly available
computer programs has produced a number candidates from which
regulatory authorities may choose in implementing the analytic methods
described. The analytic methods of the previous section which each
program covers are presented in tabular form by Figure 3. Since
familiarity with the detailed contents of each listed program is nearly
impossible, the noted comments are necessarily brief, in most cases
being derived from the abstract alone. Having selected the modules
most likely to fill the needs of its state, the regulatory agency should
refer to the contact agency for a more detailed description of
program capabilities and limitations before requesting a source copy_
In organizing the acquisition and use of these programs, it is
recommended that the Plant Financing and Cost Allocation modules be
considered central in the sense of defining the form and quantity of
data requ~red from the other modules; these two should be chosen and
developed fi rst.
23


REFERENCES
1) "Public Utilities Regulatory Policies Act,1l Public Law 95-617,
16 USC 2601, November 9, 1978.
2) Reference Manual and Procedures for Implementing PURPA, Electric Utility Rate Design Study Volume #82, Electric Power Research
Institute, March, 1979.
3) IIWeather Sensitive Electric Demand and Energy Ana1ysis,1i Ronald P. Thompson in IEEE Transactions on Power Apparatus and Systems
Volume PAS-95 #1, January/February, 1976.
4) IIProcedures Governing the Collection and Reporting of Information Associated With the Cost of Providing Electric Service,iI Federal
Energy Regulatory Commission Docket #RM 79-6, June, 1979.
5) "Findings of Fact and Order Establishing Temporary Experimental Rates,1i Public Service Commission of Wisconsin Docket #6690-ER-5,
February 18, 1977.
6) Costing for Peak Load Pricing: Topic 4 Results for Portland General Electric Company, Electric Utility Rate Design Study
Volume #30, pp. 103 ff., Electric Power Research Institute, June, 1977.
7) "Peak Load Pricing with a Diverse Technology", Bell Journal
of Economtts~ pp. 207-231, Spring 1976.
8) Task 2G Deliverable: Regulatory Computer Program Descriptions,
National Regulatory Research Institute, June 20, 1978.
24

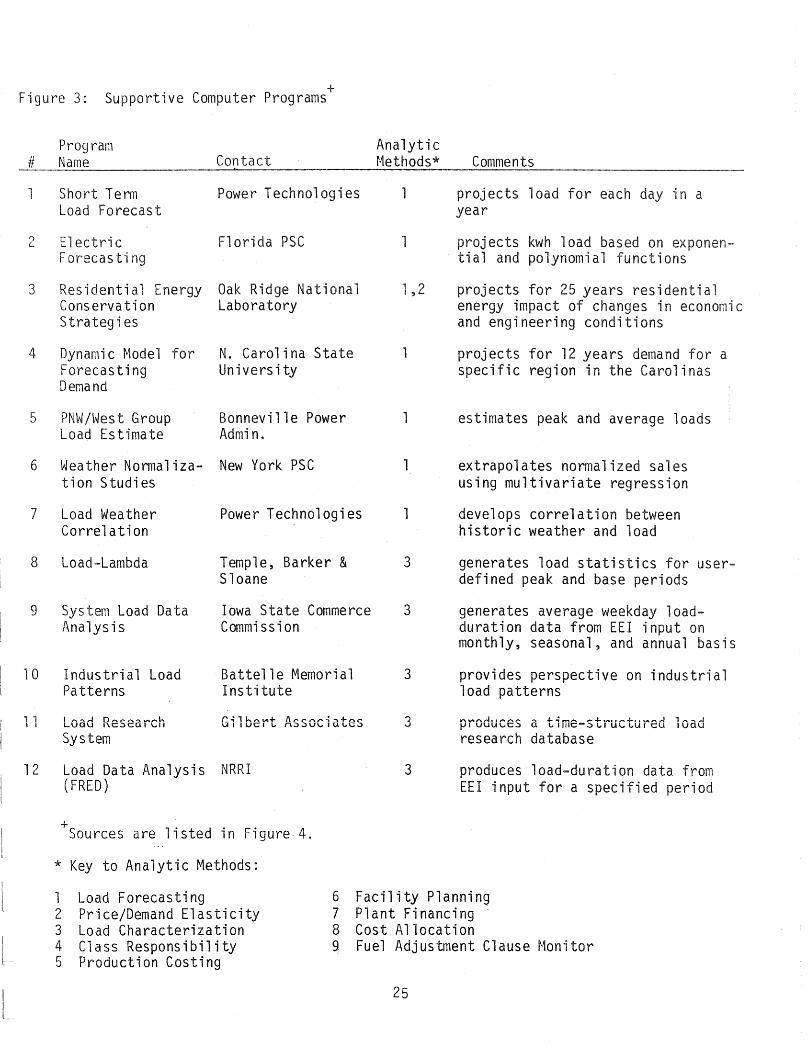
Figure 3: + Supportive Computer Programs
Program # Name
1 Short Term Load Forecast
2 Electric Forecasting
Contact
Power Technologies
Florida PSC
3 Residential Energy Oak Ridge National Conservation Laboratory S trateg i es
4 Dynamic Model for Forecasting Demand
5 PNW/West Group Load Estimate
N. Carolina State University
Bonneville Power Admin.
6 Weather Normaliza- New York PSC tion Studies
7 Load Weather Correlation
8 Load-Lambda
9 System Load Data Analysis
10 Industrial Load Patterns
1 1 Load Research System
Power Technologies
Temple, Barker & Sloane
Iowa State Commerce Commission
Battelle Memorial Institute
Gilbert Associates
12 Load Data Analysis NRRI (FRED)
+ Sources are listed in Figure 4.
Analytic t·1ethods*
1 ,2
1
1
1
3
3
3
3
3
Comments
projects load for each day in a year
projects kwh load based on exponential and polynomial functions
projects for 25 years residential energy impact of changes in economic and engineering conditions
projects for 12 years demand for a specific region in the Carolinas
estimates peak and average loads
extrapolates normalized sales using multivariate regression
develops correlation between historic weather and load
generates load statistics for userdefined peak and base periods
generates average weekday loadduration data from EEl input on monthly, seasonal, and annual basis
provides perspective on industrial load patterns
produces a time-structured research database
'~~...J luau
produces load-duration data from EEl input for a specified period
* Key to Analytic Methods:
1 Load Forecasting 2 Price/Demand Elasticity 3 Load Characterization
6 Facility Planning 7 Plant Financing 8 Cost Allocation
4 Class Responsibility 9 Fuel Adjustment Clause Monitor 5 Production Costing
25


Figure 3: Supportive Computer Programs (continued)
Program # Name
1 3 [';a r gin a 1 Cos t & rricin~ of ~~l cctri ci ty
14 Time-of-Day Pricing
Contact
Planning & Conservation Foundation
Ohio PUC
15 Neoclassical Peak- Bell Telephone Load Pricing Laboratories
16 Rate Structure Tir~e 'of Use, Cost Allocation
17 Cost of Service
FERC
New York PSC
Analytic Methods*
4
4
4
4,8
Comments
methods used are undisclosed
computes monthly bill based on adjusted EEl input and a hypothetical tariff
assigns capacity costs to users in all time periods
assigns revenue responsibility across customer classes
distributes rate increases across customer classes
18 Cost Allocation Gilbert Associates 4,5,7,8 generates a complete cost-of-service study
10 Future Test Year, FERC Cost of Service
20 Marginal Cost of Electricity
21
22
Ma rg ina 1 Cos t
Economic Merit Order and Marginal Costs for Fossil and Nuclear Units
23 Production Cost Simulation
Wisconsin Office of Planning & Energy
NRRI
Oak Ridge National Laboratory
Virginia State Corporation Commission
7,8
5,7
5
5
26
projects cost of service and revenue requirement based on past sales and O&M, and on plant forecasts
methods used are undisclosed
computes marginal capacity and energy costs for generation and T&D using method of Cicchetti, Gillen, and Smolinsky
dispatches units according to loadduration and variable 3-block loading


Figure 3: Supportive Computer Programs (continued)
Program Analytic Methods* # Name Contact Comments
~----~--------------- -----------------------------------------------------24
25
26
27
28~
29
30
31
32
33
34
Generation Reliability and System Expansion
Load Resource COr.1parison
Optimal Expansion Planning
Long-Term Generation Expansion Planning
OPTGEN
WASP
Optimal Generation Planning
Capacity Planning
GEM
OGP
TNET
Power Technologies
Bonneville Power Administration
Systems Control
Carnegie-Mellon Univers i ty
Stone and Webster Engineering
Oak Ridge National Laboratory
Power Technologies
Power Technologies
Massachusetts Institute of Technology
General Electric
General Electric
6
6
6
6
6
6
6
6
6
6
6
27
uses load-frequency/duraction input, computes LOLP and frequency of reserve-margin states
evaluates present worth of a 20-year plan of hydro and thermal plant additions, considers reserve requirements
incorporates model for intermittent generation sources
considers future uncertainty, mix of nuclear, fossil, hydro, and pumpedstorage units
selects most economical generation expansion plan
uses dynamic programming to find the optimal expansion plan
develops sets of expansion patterns in stages
considers 2-block loading, mixed plant types, maintenance scheduling for level risk, LOLP, and load frequency/duration
present worth of costs of expansion patterns are minimized subject to constraints on demand, pollution, reliability, fuel and site availa-1-,.';1';+" U I I I 1..J
long-range optimized generation planning considering alternative load-growth scenarios
long-range transmission planning considering alternatives in loadgrowth, generation plans, and network designs


Figure 3: Supportive Computer Programs (continued)
Prog ram # Name Contact
Analytic Methods*
35 Optimization Oak Ridge National 6 Models for Nuclear & Fossil Plant Planning
36 Long Range Generation Planning
37 Generation Planning (LOADS, PROBS, HPROD, lCOST)
38 GENCAP
39 Capacity Optimization #1
40 None
41 Corporate Model
42 Financial Model
43 F$P
44 Financial Forecast for REA BorrovJers
45 Financial Statement Projections
United Engineers and 6 Constructors
General Electric 3,5,6
U. of Wisconsin 1,3,6 Institute for Environmental Studies
N. Carolina 6 Utilities Commis-sion
Jerome Karaganis 6 EPRI
Power Technologies 5,6
Power Technologies 7
General Electric 7
Rural Electrification Administration
New York PSC
7
7
28
Comments
identifies cost of production plans, including carrying costs
produces operating costs of generation and revenue requirements of alternative expansion plans
computes yearly costs of each generation expansion plan investigated after forecasting load-durations
creates an optimal schedule of capacity additions considering fuel and capital costs
considers reserve margins, outages, fixed and variable costs, environmental costs
submodels provide input to Financial Model below
annual and monthly models consider tax and regulatory constraints
financial simulation considers planning scenarios, rate changes s
earnings, new financing, cash flow
produces statements of operations and ratios, balance sheet, sources and uses of funds; models terms of REA loans
evaluates financial structure of power companies or pools


~Figure 3: Supportive Computer Programs (continued)
#
46
47
48
49
50
51
52
Program Name
RAm
Utility Financial t~ode 1
Corporate Modeling & Financial Planning
Electric Utility Corporate Model
Fuel Adjustment, Fuel Cost·
Fuel Adjustment Data
53 Fuel Adjustment Clause
Contact
Temple, Barker & S 1 oa,ne
NRRI
Michigan PSC
Joskow D. Baughman Massachusetts Institute of Technology
Corporation Commission of Oklahoma
General Electric
FERC
Pennsylvania PUC
Ohio PUC
Analytic ~1ethods *
7
7
1 ,7
7
7
9
9
9
29
Comments
projects financial conditions for a given capital budget and historic O&~1 costs, subject to regul atory constraints, producing balance sheet, sources and uses of funds, and income statements
rate-case oriented system produces rate base, rate of return, revenue deficiency, sources and uses of funds~ and income statements
regional model considers supply, demand, and financing under regulatory constraints
considers alternative growth-patterns, expansion plans, and rates.
projects tax and cash reports, balance sheet and income statements based on regulation of earnings on rate base or common equity
considers adjustments due to changes in fuel costs, generation mix, and heat rates
stores and prints data on fuel type and source
verifies and reports fuel purchase and use data, flagging areas of conflict with regulations


FIGURE 4: SOURCES OF COMPUTER PROGRAMS
Battelle Memorial Institute ~1assachusetts Institute of Technology 505 King Avenue 77 Massachusetts Avenue Columbus OH 43201 Cambridge MA 02139
Bell Telephone laboratories, Inc. 600 Mountain Avenue Murray Hill NJ 07974
Bonneville Power Administration P.O. Box 3621 Portland OR 97208
Carnegie-t~ellon University Frew Avenue & Margaret Morrison Pittsburgh PA 15213
Corporation Commission of Oklahoma 308 Jim Thorpe Building Oklahoma City OK 73105
Electric Power Research Institute Energy Analysis Department P.O. Box 10412 Palo Alto CA 94303
Federal Energy Regulatory Commission 825 North Capitol Street NE Washington DC 20426
Florida Public Service Commission 101 East Gaines Street Tallahassee Fl. 32301
Gilbert Associates, Inc. P .0. Box 1498 Reading PA 19603
Iowa State Commerce Commission Fourth and Walnut Streets Des Moines IA 50319
30
Michigan Public Service Commission P.O. Box 30221 lansing MI 48909
National Regulatory Research Institute 2130 Neil Avenue Columbus OH 43210
New York Public Service Commission Agency Building #3 Empire State Plaza Albany NY 12223
North Carolina State University 2205 Hillsboro Raleigh NC 27607
Oak Ridge National laboratory P.O. Box 117 Oak Ridge TN 37830
Ohio Public Utilities Commission 180 East Broad Street Columbus OH 43215
Pennsylvania Public Utilities Commission
P.O. Box 3265 Harrisburg PA 17120
Planning & Conservation Foundation c/o National Technical Information
Center 5285 Port Royal Springfield VA 22150
Power Technologies, Inc. P .0. Box 1058 Schenectady NY 12301


FIGURE 4: SOURCES OF COMPUTER PROGRAMS (Continued)
National Rural Electric Cooperative Association
2000 Florida Avenue NW Washington DC 20009
Stone and Webster Engineering Corporation 90 Broad Street New York NY 10004
Systems Control Inc. 1801 Page Mill Road Palo Alto CA 94304
Temple, Barker & Sloane, Inc. 33 Hayden Avenue Lexington MA 02173
United Engineers & Constructors, Inc. 100 Su~mer Street Boston MA 02110
University of Wisconsin Institute for Environmental Studies
c/o National Technical Information Center 5285 Port Royal Springfield VA 22150
Virginia State Corporation Commission P.O. Box 1197 Richmond VA 23209
Wisconsin Office of Planning & Energy P.O. Box 511 Madison WI 53701
31


