Download - Preliminary Final Report

This report comprises information given to the ASX under listing rule 4.3A
Appendix 4EPreliminary Final Report
For the year ended 30 June 2013 Released 19 August 2013
ABN 11 068 049 178

Bendigo and Adelaide Bank Ltd Appendix 4E: Preliminary Final Report
Year ended 30 June 2013
1. Appendix 4E: preliminary final report 3
1.1 Company details and reporting period 3
1.2 Results for announcement to the market 3
1.3 Cash earnings results 4
1.4 Net tangible assets per ordinary share 4
1.5 Details of entities over which control has been gained or lost during the period 4
1.6 Details of individual and total dividends 4
1.7 Details of any dividend or distribution reinvestment plans in operation 4
1.8 Details of associates and joint venture entities 4
1.9 Accounting standards used for foreign entities 4
1.10 Dispute or qualifications if audited 4
1.11 Annual general meeting 4
1.12 Subsequent events 4
2. Full year results 5
2.1 Financial highlights 5
2.2 Results at a glance 6
2.2.1 Financial performance 6
2.2.2 Financial position 6
2.2.3 Dividends 6
2.3 Financial statements 7
2.3.1 Income statement 8
2.3.2 Statement of comprehensive income 8
2.3.3 Balance sheet 9
2.3.4 Statement of changes in equity 10
2.3.5 Cash flow statement 11
2.4 Results commentary 12
2.4.1 Profit 12
2.4.2 Specific items 13
2.4.3 Interest margin 14
2.4.4 Income 15
2.4.5 Productivity and operating expenses 17
2.4.6 Segment results 20
2.4.7 Lending 22
2.4.8 Asset quality 23
2.4.9 Bad and doubtful debts 24
2.4.10 Deposits and funds under management 25
2.4.11 Capital and shareholder returns 27
2.4.11.1 Capital adequacy 27
2.4.11.2 Shareholder returns 28
2.4.11.3 Return on equity (RoE) & return on tangible equity (RoTE) – six months 29
2.4.11.4 Dividends 29
2.4.11.5 Earnings in cents per ordinary share 29
2.5 Additional notes 31
2.5.1 Analysis of intangible assets 31
2.5.2 Investments accounted for using the equity method 32
2.5.3 Average balance sheets and related interest 33
2.5.4 Net tangible assets per ordinary share 35
2.5.5 Credit ratings 35
2.5.6 Issued capital 36
Contents

Bendigo and Adelaide Bank Ltd Appendix 4E: Preliminary Final Report
Year ended 30 June 2013
3
1Appendix 4E: Preliminary Final Report1.1 Company details and reporting period
Bendigo and Adelaide Bank Limited
ABN 11 068 049 178
Reporting period - twelve months ended: 30 June 2013
Previous corresponding period - twelve months ended: 30 June 2012
Information contained in this report should be read in conjunction
with the June 2013 annual financial report, when issued.
1.2 Results for announcement to the market$m
Income from operations Up 11.2% to 1,349.3
Profit after tax attributable to members Up 80.7% to 352.3
Net profit after tax attributable to members Up 80.7% to 352.3
Dividends – current year Amount per security
Final Dividend – 2013, fully franked
Payable 30 September 2013
Record date for determining entitlements for final dividend – 29 August 2013
31.0 cents
Interim Dividend – 2013, fully franked
Paid 28 March 2013
30.0 cents
Dividends – previous year Amount per security
Final Dividend – 2012, fully franked
Paid 28 September 2012
30.0 cents
Interim Dividend – 2012, fully franked
Paid 30 March 2012
30.0 cents
Bendigo and Adelaide Bank Ltd Appendix 4E: Preliminary Final Report
Year ended 30 June 2013
4
1.3 Cash earnings results
Cash earnings attributable to members Up 7.7% to $348.0 m
Cash earnings per share Up 1.4% to 85.4 cents
See Note 2.3 for full details.
1.4 Net tangible assets per ordinary share
Refer to page 35.
1.5 Details of entities over which control has been gained or lost during the period
During the financial period, changes in the investment in the
following entity occurred:
1 December 2012 - 100% ownership of Community Telco Australia
became effective. Community Telco Australia is now a wholly owned
subsidiary of Bendigo and Adelaide Bank, previously this was a joint
venture in which Bendigo and Adelaide Bank held 50%.
21 December 2012 - Bendigo and Adelaide Bank acquired business
operations and selected assets of Southern Finance Ltd.
11 June 2013 – Bendigo and Adelaide Bank acquired a loan portfolio
from HD&C Securities Ltd.
1.6 Details of individual and total dividends
Refer to page 29.
1.7 Details of any dividend or distribution reinvestment plans in operation
Refer to page 30.
1.8 Details of associates and joint venture entities
Refer to page 32.
1.9 Accounting standards used for foreign entities
Not applicable.
1.10 Dispute or qualifications if audited
This report is based on financial accounts that are in the process of
being audited by our external auditors. There is not expected to be
any dispute or qualification to the financial accounts.
1.11 Annual general meeting
The annual general meeting will be held as follows:
Place: The Capital Theatre, 50 View Street, Bendigo, Victoria
Date: 28 October 2013
Time: 11.00 am (Eastern Daylight Saving Time)
1.12 Subsequent events
No other matters or circumstances have arisen since the end of
the financial year which significantly affected or may significantly
affect the operations of the economic entity, the results of those
operations, or the state of affairs of the economic entity in
subsequent financial years.
This Appendix 4E: Preliminary Final Report should be read in
conjunction with the media release and results presentation
released to the ASX on 19 August 2013.

Bendigo and Adelaide Bank Ltd Appendix 4E: Preliminary Final Report
Year ended 30 June 2013
5
2012-13 2011-12 Change
2012-13 2012-13 2011-12 2011-12 Full year 2012
1st half 2nd half Total 1st half 2nd half Total to full year 2013
$m $m $m $m $m $m $m %
Profit after tax attributable to parent 189.4 162.9 352.3 57.9 137.1 195.0 157.3 80.7
Profit after tax and before specific items 162.8 174.8 337.6 157.4 154.6 312.0 25.6 8.2
Cash earnings 169.7 178.3 348.0 162.6 160.4 323.0 25.0 7.7
Net interest income 507.5 520.0 1,027.5 478.1 472.0 950.1 77.4 8.1
Non-interest income (before specific items) 143.5 153.7 297.2 129.5 146.3 275.8 21.4 7.8
Expenses (before specific items) 390.3 388.7 779.0 367.5 384.2 751.7 27.3 3.6
Retail deposits 41,867.0 42,245.8 42,245.8 38,567.3 40,663.0 40,663.0 1,582.8 3.9
Ordinary equity 4,216.9 4,297.7 4,297.7 4,001.1 4,109.1 4,109.1 188.6 4.6
Funds under management 3,334.5 3,275.2 3,275.2 3,086.8 3,089.9 3,089.9 185.3 6.0
Loans under management 50,505.5 51,689.2 51,689.2 48,057.6 49,989.0 49,989.0 1,700.2 3.4
New loan approvals 6,834.9 7,266.5 14,101.4 6,476.9 6,188.7 12,665.6 1,435.8 11.3
Residential 4,492.9 4,530.2 9,023.1 4,654.0 4,206.7 8,860.7 162.4 1.8
Non-residential 2,342.0 2,736.3 5,078.3 1,822.9 1,982.0 3,804.9 1,273.4 33.5
2012-13 2011-12 Change
2012-13 2012-13 2011-12 2011-12 Full year 2012
1st half 2nd half Total 1st half 2nd half Total to full year 2013
Cost to income ratio 57.8% 56.2% 57.0% 58.2% 59.8% 59.1% (2.1) (3.6)
Earnings per ordinary share – cents 45.9 39.0 84.9 14.5 33.5 48.6 36.3 74.7
Cash basis earnings per ordinary share – cents 41.9 43.5 85.4 43.9 40.5 84.2 1.2 1.4
Dividend per share – cents 30.0 31.0 61.0 30.0 30.0 60.0 1.0 1.7
2.Full Year Results2.1 Financial highlights

Bendigo and Adelaide Bank Ltd Appendix 4E: Preliminary Final Report
Year ended 30 June 2013
6
2.2.1 Financial performance
Bendigo and Adelaide Bank Ltd announced a statutory profit after
tax of $352.3 million for the 12 months ending 30 June 2013, an
80.7% increase on the corresponding period. The cash earnings
result is $348.0 million for the 12 months ending 30 June 2013, a
7.7% increase on the prior corresponding period.
Further detail
Statutory earnings per ordinary share is 84.9 cents (Jun-12 48.6 cents), an increase of 74.7%.
2.3.1
Statutory return on average ordinary equity is 8.52% (Jun-12 4.84%).
2.4.11.2
Profit before income tax and specific items was $475.8 million (Jun-12 $441.8 million), an increase of 7.7% (see note 2.4.1 for specific item details).
2.4.1
Profit after income tax before specific items was $337.6 million (Jun-12 $312.0 million), an increase of 8.2% (see note 2.4.1 for specific item details).
2.4.1
Cash basis earnings per ordinary share of 85.4 cents (Jun-12 84.2 cents), an increase of 1.4%.
2.4.11.2
Cash basis earnings return on average ordinary equity was 8.58% (Jun-12 8.36%).
2.4.11.2
Cash basis earnings return on average tangible equity was 13.48% (Jun-12 14.05%).
2.4.11.2
Net interest income increased by 8.1% to $1,027.5 million with an interest margin before payments to community banks and alliances increasing from 2.11% to 2.21%. Net of these payments, interest margin increased 8 basis points from 1.78% in June 2012 to 1.86% in the 12 months to June 2013. Refer to 2.4.3 for further analysis.
2.4.4
Non-interest income before specific items was $297.2 million (Jun-12 $275.8 million), an increase of 7.8%.
2.4.4
Expenses before specific items increased by 3.6% to $779.0 million compared to June 2012. The cost to income ratio was 57.0% compared to 59.1% at June 2012.
2.4.5
Bad & Doubtful debts expense was $69.9 million (Jun-12 $32.4 million), an increase of 115.7%.
2.4.9
2.2.2 Financial position
Further detail
Loans under management were $51.7 billion (Jun-12 $50.0 billion), an increase of 3.4%.
2.4.7
Retail deposits were $42.2 billion (Jun-12 $40.7 billion), an increase of 3.9%.
2.4.10
Managed funds were $3.3 billion (Jun-12 $3.1 billion), an increase of 6.0%.
2.4.10
Total provisions and reserves for doubtful debts were $276.9 million – an increase of $13.7 million since June 2012. General and collective provisions were 0.53% of Group risk weighted assets.
2.4.9
2.2.3 Dividends
> Directors announced a final dividend of 31.0 cents per share (fully franked), taking the total dividend for the financial year to 61.0 cents per share.
> Dividend is payable on 30 September 2013 to shareholders registered on the Record Date of 29 August 2013.
> The final dividend proposed totals $125.1 million.
2.2 Results at a glance

Bendigo and Adelaide Bank Ltd Appendix 4E: Preliminary Final Report
Year ended 30 June 2013
7
2.3.1 Income statement
For the year ended 30 June 2013 Consolidated
2013 2012
$m $m
Income
Net interest income
Interest income 3,073.7 3,440.8
Interest expense 2,046.2 2,490.7
Net Interest Income 1,027.5 950.1
Total non interest income (2.4.4) 295.6 275.1
Share of associates net profits accounted for using the equity method (2.5.2) 1.6 0.7
Total income 1,324.7 1,225.9
Expenses
Bad and doubtful debts (2.4.9) 69.9 32.4
Operating expenses (2.4.5) 779.0 751.7
Profit before income tax expense and specific items 475.8 441.8
Specific items before tax 11.8 (115.7)
Profit before income tax expense 487.6 326.1
Income tax expense 135.3 131.1
Profit after income tax expense attributable to members of the parent 352.3 195.0
Adjusted for:
Specific items after income tax expense (2.4.1) (14.7) 117.0
Dividends paid on preference shares (3.1) (3.9)
Dividends paid on step-up preference shares (3.4) (4.6)
After tax intangibles amortisation (excluding amortisation of intangible software) 16.9 19.5
Cash basis earnings 348.0 323.0
Cash basis earnings per ordinary share (cents per share) 85.4 84.2
Basic earnings per ordinary share (cents per share) 84.9 48.6
Diluted earnings per ordinary share (cents per share) 77.9 47.7
Franked dividends per ordinary share (cents per share) 61.0 60.0
2.3 Financial statements

Bendigo and Adelaide Bank Ltd Appendix 4E: Preliminary Final Report
Year ended 30 June 2013
8
2.3.2 Statement of comprehensive income
As at 30 June 2013 Consolidated
2013 2012
$m $m
Items which may be reclassified subsequently to the profit & loss:
Available for sale financial assets revaluation - equity investments 1.1 (9.6)
Transfer to income on sale of available for sale assets (37.1) -
Net gain on cash flow hedges taken to equity 75.8 47.0
Net loss on reclassification from cash flow hedge reserve to income (1.8) (13.0)
Net unrealised gain/(loss) on debt securities in available for sale portfolio 2.9 (1.8)
Income tax effect (13.1) (7.3)
27.8 15.3
Items which will not be reclassified subsequently to the profit & loss:
Actuarial gain/(loss) on superannuation defined benefits plan 2.3 (1.8)
Income tax effect (0.7) 0.4
1.6 (1.4)
Profit for the year 352.3 195.0
Total comprehensive income for the period 381.7 208.9
Total comprehensive income for the period attributable to:
Members of the Parent 381.7 208.9

Bendigo and Adelaide Bank Ltd Appendix 4E: Preliminary Final Report
Year ended 30 June 2013
9
2.3.3 Balance sheet
For the year ended 30 June 2013 Consolidated
Jun-13 Jun-12
2013 2012
$m $m
Assets
Cash and cash equivalents 383.8 288.8
Due from other financial institutions 293.9 272.2
Financial assets held for trading 5,465.2 4,366.1
Financial assets available for sale - debt securities 535.5 444.8
Financial assets held to maturity 323.3 388.4
Other assets 615.4 509.7
Financial assets available for sale - equity investments 18.1 124.7
Derivatives 31.9 48.5
Loans and other receivables - investment 554.1 453.0
Net loans and other receivables 49,957.4 48,217.0
Investments accounted for using the equity method 15.6 12.9
Property, plant and equipment 63.4 69.0
Deferred tax assets 132.1 170.2
Investment property 348.9 298.9
Assets held for sale 25.4 25.4
Intangible assets and goodwill 1,518.2 1,548.2
Total Assets 60,282.2 57,237.8
Liabilities
Due to other financial institutions 379.5 327.2
Deposits 47,439.0 44,572.7
Notes payable 6,400.6 6,411.0
Derivatives 98.4 179.0
Other payables 688.7 731.8
Income tax payable 47.1 86.8
Provisions 93.5 80.7
Deferred tax liabilities 78.2 104.5
Reset preference shares - 89.5
Convertible preference shares 268.9 -
Subordinated debt - at amortised cost 354.3 436.9
Total Liabilities 55,848.2 53,020.1
Net Assets 4,434.0 4,217.7
Equity
Equity attributable to equity holders of the parent
Issued capital - ordinary 3,758.0 3,681.8
Perpetual non-cumulative redeemable convertible preference shares 88.5 88.5
Step-up preference shares 100.0 100.0
Employee Share Ownership Plan (ESOP) shares (18.7) (21.3)
Reserves 108.1 72.2
Retained earnings 398.1 296.5
Total Equity 4,434.0 4,217.7

Bendigo and Adelaide Bank Ltd Appendix 4E: Preliminary Final Report
Year ended 30 June 2013
10
2.3.4 Statement of changes in equity
For the year ended 30 June 2013 Attributable to owners of Bendigo and Adelaide Bank Limited
Issued ordinary capital Shares *
Retained earnings Reserves Total equity
$m $m $m $m $m
At 1 July 2012
Opening balance b/fwd 3,681.8 167.2 296.5 72.2 4,217.7
Comprehensive income:
Profit for the period - - 352.3 - 352.3
Other comprehensive income - - 1.6 27.8 29.4
Total comprehensive income for the period - - 353.9 27.8 381.7
Transactions with owners in their capacity as owners:
Shares issued 76.2 - - - 76.2
Reduction in employee share ownership plan (ESOP) shares - 2.6 - - 2.6
Movement in general reserve for credit losses (GRCL) - - (9.8) 9.8 -
Share based payment - - - (1.7) (1.7)
Equity dividends - - (242.5) - (242.5)
At 30 June 2013 3,758.0 169.8 398.1 108.1 4,434.0
For the year ended 30 June 2012 Attributable to owners of Bendigo and Adelaide Bank Limited
Issued ordinary capital Shares *
Retained earnings Reserves Total equity
$m $m $m $m $m
At 1 July 2011
Opening balance b/fwd 3,408.9 163.9 349.5 37.8 3,960.1
Comprehensive income:
Profit for the year - - 195.0 - 195.0
Other comprehensive income - - (1.4) 15.3 13.9
Total comprehensive income for the period - - 193.6 15.3 208.9
Transactions with owners in their capacity as owners:
Shares issued 274.8 - - - 274.8
Share issue expenses (1.9) - - - (1.9)
Reduction in Employee Share Ownership Plan (ESOP) shares - 3.3 - - 3.3
Movement in general reserve for credit losses (GRCL) - - (17.6) 17.6 -
Share based payment - - - 1.5 1.5
Equity dividends - - (229.0) - (229.0)
At 30 June 2012 3,681.8 167.2 296.5 72.2 4,217.7
*refer to note 2.5.6 Issued Capital for further details

Bendigo and Adelaide Bank Ltd Appendix 4E: Preliminary Final Report
Year ended 30 June 2013
11
2.3.5 Cash flow statement
For the year ended 30 June 2013 Consolidated
2013 2012
$m $m
Cash flows from operating activities
Interest and other items of a similar nature received 3,134.5 3,442.3
Interest and other costs of finance paid (2,132.8) (2,545.0)
Receipts from customers (excluding interest) 263.9 265.6
Payments to suppliers and employees (665.7) (850.5)
Dividends received 0.8 8.1
Income taxes paid (177.2) (120.6)
Net cash flows from operating activities 423.5 199.9
Cash flows from investing activities
Cash paid for purchases of property, plant and equipment (7.1) (12.2)
Cash proceeds from sale of property, plant and equipment 0.8 1.2
Cash paid for purchases of investment property (31.8) (44.4)
Cash proceeds from sale of investment property 20.1 11.0
Cash paid for purchases of intangible assets (4.2) (15.4)
Cash paid for purchases of equity investments - (12.0)
Cash proceeds from sale of equity investments 109.8 -
Net increase in balance of loans and other receivables outstanding (1,841.5) (929.6)
Net (increase)/decrease in balance of investment securities (1,124.7) 208.1
Proceeds from return of capital - 0.4
Net cash paid on acquisition of a business combination (257.1) (213.1)
Net cash flows used in investing activities (3,135.7) (1,006.0)
Cash flows from financing activities
Net proceeds from issue of shares 177.7 195.5
Net increase in balance of retail deposits 1,582.8 2,638.3
Net increase in balance of wholesale deposits 1,283.5 78.9
Repayment of subordinated debt (82.6) (138.7)
Dividends paid (166.1) (149.7)
Net decrease in balance of notes payable (10.4) (2,040.8)
Repayment of ESOP shares 2.6 3.3
Payment of share issue costs (10.9) (1.9)
Net cash flows from financing activities 2,776.6 584.9
Net increase/(decrease) in cash and cash equivalents 64.4 (221.2)
Cash and cash equivalents at the beginning of the period 233.8 455.0
Cash and cash equivalents at the end of period 298.2 233.8

Bendigo and Adelaide Bank Ltd Appendix 4E: Preliminary Final Report
Year ended 30 June 2013
12
2.4.1 Profit
Full year ending Six months ending
Jun-13 Jun-12 Change Jun-13 Dec-12 Change
$m $m $m % $m $m $m %
Profit before tax 487.6 326.1 161.5 49.5 233.2 254.4 (21.2) (8.3)
Specific items before tax (11.8) 115.7 (127.5) (110.2) 14.0 (25.8) 39.8 154.3
Profit before tax and specific items 475.8 441.8 34.0 7.7 247.2 228.6 18.6 8.1
Statutory profit after tax attributable to the parent 352.3 195.0 157.3 80.7 162.9 189.4 (26.5) (14.0)
Specific items after tax (14.7) 117.0 (131.7) (112.6) 11.9 (26.6) 38.5 144.7
Profit after tax before specific items 337.6 312.0 25.6 8.2 174.8 162.8 12.0 7.4
Adjusted for:
Amortisation of acquired intangibles after tax 16.9 19.5 (2.6) (13.3) 6.5 10.4 (3.9) (37.5)
Distributions paid on preference shares (3.1) (3.9) 0.8 20.5 (1.5) (1.6) 0.1 6.3
Distributions paid on step-up preference shares (3.4) (4.6) 1.2 26.1 (1.5) (1.9) 0.4 21.1
Cash basis profit after tax 348.0 323.0 25.0 7.7 178.3 169.7 8.6 5.1
Profit after tax $m
2.4 Results commentary
Statutory Profit Cash basis earnings
June 2011 June 2011
342.1336.2
June 2012 June 2012
195.0
323.0
June 2013 June 2013
352.3348.0
Bendigo and Adelaide Bank Ltd Appendix 4E: Preliminary Final Report
Year ended 30 June 2013
13
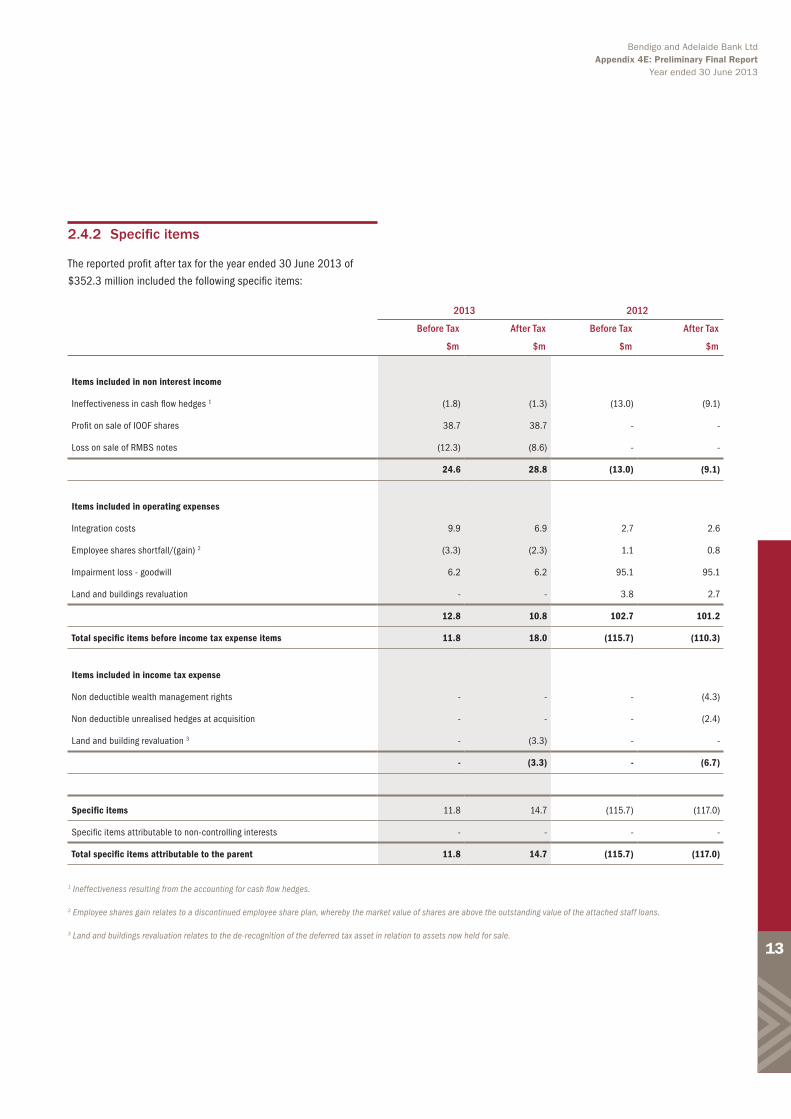
2.4.2 Specific items
The reported profit after tax for the year ended 30 June 2013 of
$352.3 million included the following specific items:
2013 2012
Before Tax After Tax Before Tax After Tax
$m $m $m $m
Items included in non interest income
Ineffectiveness in cash flow hedges 1 (1.8) (1.3) (13.0) (9.1)
Profit on sale of IOOF shares 38.7 38.7 - -
Loss on sale of RMBS notes (12.3) (8.6) - -
24.6 28.8 (13.0) (9.1)
Items included in operating expenses
Integration costs 9.9 6.9 2.7 2.6
Employee shares shortfall/(gain) 2 (3.3) (2.3) 1.1 0.8
Impairment loss - goodwill 6.2 6.2 95.1 95.1
Land and buildings revaluation - - 3.8 2.7
12.8 10.8 102.7 101.2
Total specific items before income tax expense items 11.8 18.0 (115.7) (110.3)
Items included in income tax expense
Non deductible wealth management rights - - - (4.3)
Non deductible unrealised hedges at acquisition - - - (2.4)
Land and building revaluation 3 - (3.3) - -
- (3.3) - (6.7)
Specific items 11.8 14.7 (115.7) (117.0)
Specific items attributable to non-controlling interests - - - -
Total specific items attributable to the parent 11.8 14.7 (115.7) (117.0)
1 Ineffectiveness resulting from the accounting for cash flow hedges.
2 Employee shares gain relates to a discontinued employee share plan, whereby the market value of shares are above the outstanding value of the attached staff loans.
3 Land and buildings revaluation relates to the de-recognition of the deferred tax asset in relation to assets now held for sale.

Bendigo and Adelaide Bank Ltd Appendix 4E: Preliminary Final Report
Year ended 30 June 2013
14
2.4.3 Interest margin
Analysis of net interest margin (movement over twelve months) %
Asset mix – A higher proportion of new residential fixed rate
mortgages has been written in 2013 at a lower headline margin than
standard variable rate mortgages.
Asset pricing – As interest rates have decreased some of this
reduction has been held back to help restore net interest margin to
acceptable levels.
Liability pricing – Lower absolute interest rates and strong
term deposit competition has had a negative impact on net
interest margin.
June-12 Asset Mix Asset Pricing Liability Pricing June-13
0.15%(0.02%)1.78% (0.05%) 1.86%

Bendigo and Adelaide Bank Ltd Appendix 4E: Preliminary Final Report
Year ended 30 June 2013
15
2.4.4 Income
Full year ending Six months ending
Jun-13 Jun-12 Change Jun-13 Dec-12 Change
$m $m $m % $m $m $m %
Net interest income 1,027.5 950.1 77.4 8.1 520.0 507.5 12.5 2.5
Other income comprising:
Fees - asset products 61.3 57.3 4.0 7.0 32.3 29.0 3.3 11.4
- liability products & other 101.0 108.2 (7.2) (6.7) 46.6 54.4 (7.8) (14.3)
- trustee, management & other services 5.3 5.7 (0.4) (7.0) 2.5 2.8 (0.3) (10.7)
Commissions - wealth solutions 29.7 29.1 0.6 2.1 15.0 14.7 0.3 2.0
- insurance 16.2 15.6 0.6 3.8 8.9 7.3 1.6 21.9
- other (1.2) (1.1) (0.1) (9.1) (0.6) (0.6) - -
Dividend income 0.7 7.8 (7.1) (91.0) 0.4 0.3 0.1 33.3
Homesafe trust contribution 25.1 2.5 22.6 904.0 13.2 11.9 1.3 10.9
Other 57.5 50.0 7.5 15.0 34.3 23.2 11.1 47.8
Total other income before specific income items 295.6 275.1 20.5 7.5 152.6 143.0 9.6 6.7
Share of joint ventures profit 1.6 0.7 0.9 128.6 1.1 0.5 0.6 120.0
Total non interest income before specific items 297.2 275.8 21.4 7.8 153.7 143.5 10.2 7.1
Total income before specific items 1,324.7 1,225.9 98.8 8.1 673.7 651.0 22.7 3.5
Specific income items - non interest income 24.6 (13.0) 37.6 289.2 (1.7) 26.3 (28.0) (106.5)
Total income 1,349.3 1,212.9 136.4 11.2 672.0 677.3 (5.3) (0.8)
Comments on Total income when compared to previous corresponding period:
Net interest income increased by $77.4 million or 8.1%. Refer to
2.4.3 for further analysis.
Fees decreased by $3.6 million or 2.1% largely due to a decrease in
transaction fees, interchange fees and credit card income.
Homesafe trust contribution was $25.1 million primarily due to
growth in the portfolio and an increase in the housing price index
over the last twelve months.
Commissions increased by $1.1 million or 2.5% due to increased
volume of third party products sold.
Other Income includes foreign exchange income, factoring income
and franchise fees.
Dividend Income has decreased by $7.1 million due to the sale of
the IOOF shares.
Specific Items increased by $37.6 million due to the sale of IOOF
shares and a reduction in ineffective cashflow hedges. These
increases were offset by a loss on sale of RMBS notes. Refer to
2.4.2 for further detail.

Bendigo and Adelaide Bank Ltd Appendix 4E: Preliminary Final Report
Year ended 30 June 2013
16
Income %
Jun-12 Jun-13
Net Interest Income
Fee Income
Commission Income
Other Income
Homesafe Revaluation
Liability products and other fees
Asset product fees Homesafe revaluation
Trustee, management and other services
Insurance commissions
OtherWealth solutions and other commissions
108.2
57.3
28.0
2.55.7
15.6
58.5
5.3
16.2
59.8
28.5
25.1
101.0
61.3
Non interest Income $m
77.4% 77.5%
14.0%
3.6% 3.4%4.8% 4.5%0.2% 1.9%
12.7%
June 2012 June 2013

Bendigo and Adelaide Bank Ltd Appendix 4E: Preliminary Final Report
Year ended 30 June 2013
17
2.4.5 Productivity and operating expenses
Full year ending Six months ending
Jun-13 Jun-12 Change Jun-13 Dec-12 Change
$m $m $m % $m $m $m %
Staff and related costs 407.0 387.8 19.2 5.0 203.4 203.6 (0.2) (0.1)
Occupancy costs 70.6 65.6 5.0 7.6 35.2 35.4 (0.2) (0.6)
Information technology costs 64.6 55.2 9.4 17.0 32.9 31.7 1.2 3.8
Amortisation of acquired intangibles 24.1 27.8 (3.7) (13.3) 9.8 14.3 (4.5) (31.5)
Amortisation of software intangibles 19.7 16.2 3.5 21.6 10.1 9.6 0.5 5.2
Property, plant & equipment costs 10.6 11.4 (0.8) (7.0) 5.2 5.4 (0.2) (3.7)
Fees and commissions 28.6 30.4 (1.8) (5.9) 14.3 14.3 - -
Communications, postage & stationery 33.0 34.2 (1.2) (3.5) 16.4 16.6 (0.2) (1.2)
Advertising & promotion 32.0 30.6 1.4 4.6 17.8 14.2 3.6 25.4
Other product & services delivery costs 35.4 35.8 (0.4) (1.1) 17.2 18.2 (1.0) (5.5)
Other administration expenses 53.4 56.7 (3.3) (5.8) 26.4 27.0 (0.6) (2.2)
Total operating expenses 779.0 751.7 27.3 3.6 388.7 390.3 (1.6) (0.4)
Specific items 12.8 102.7 (89.9) (87.5) 12.3 0.5 11.8 2,360.0
Total expenses 791.8 854.4 (62.6) (7.3) 401.0 390.8 10.2 2.6
Expenses to income 57.0% 59.1% (2.1%) (3.6) 56.2% 57.8% (1.6%) (2.8)
Expenses to average assets 1.29% 1.29% (0.0%) (0.0) 1.28% 1.30% (0.02%) (1.54)
Number of staff (full-time equiv) 4,251 4,189 62 1.5 4,251 4,227 24 0.6
Staff & related costs to income* 30.6% 31.6% (1.0%) (3.2) 30.0% 31.3% (1.3%) (4.2)
* Excludes any redundancy costs
Expenses used in the above ratios are expenses less specific expense items and acquired intangibles amortisation.
Income used in the above ratios is income less specific income items.
Comments on individual expense categories when compared to the previous corresponding period are:
Occupancy costs increased by $5.0 million or 7.6% mainly due to an
overall increase in rent payments.
Information technology costs increased by $9.4 million or 17.0%
predominantly due to an increase in software maintenance.
Other administrative expenses decreased by $3.3 million or 5.8%
due to a reduction in legal costs, subscriptions and non-lending
write off’s.
Specific items decreased by $89.9 million predominantly due to the
goodwill write off for the wealth segment in 2012. Refer to 2.4.2 for
further detail.

Bendigo and Adelaide Bank Ltd Appendix 4E: Preliminary Final Report
Year ended 30 June 2013
18
Operating expenses – six months $m
Cost to income ratio – six months
%
Jun-12 Jun-13
Staff and related costs Other
Salaries and staff related
December 2011 June 2012 December 2012 June 2013
Occupancy Fees and commissions
Property, plant and equipment
Intangibles amortisation
Other operatingInformation technology
387.8
367.5 384.2 390.3 388.7
65.6
55.2
30.4
11.4
44.0
157.3
10.6
43.8
153.8
64.6
28.6
407.0
70.6
Operating expenses – full year $m
178.9
188.6
185.0
199.2
186.7
203.6
185.3
203.4
June 2012 December 2012 June 2013
59.8
57.8 56.2
Expenses used in the above ratios exclude specific expense
items and acquired intangibles amortisation. Income used in the
above ratios is income less specific income items.

Bendigo and Adelaide Bank Ltd Appendix 4E: Preliminary Final Report
Year ended 30 June 2013
19
2.4.6 Segment results
Segment information
The Group has identified its operating segments based on the
internal reports that are reviewed and used by the executive
management team in assessing performance and determining the
allocation of resources.
The operating segments are identified according to the nature of
products and services provided and the key delivery channels, with
each segment representing a strategic business unit that offers a
different delivery method and/or different products and services.
Discrete financial information about each of these operating
businesses is reported to the executive management team on a
monthly basis.
Segment assets and liabilities reflect the value of loans and
deposits directly managed by the operating segment. All other
assets of the group are managed centrally.
Types of products and services
Retail bankingNet interest income predominantly derived from the provision of
first mortgage finance and deposit facilities; and fee income from
the provision of banking services delivered through the company-
owned branch network and the Group’s share of net interest and
fee income from the Community Bank branch network. Delphi Bank
(formally Bank of Cyprus Australia) and Community Telco Australia
are included within the retail banking operating segment.
Third party bankingNet interest income and fees derived from the manufacture and
processing of residential home loans, distributed through mortgage
brokers, mortgage managers, mortgage originators and Alliance
partners.
WealthFees, commissions and interest from the provision of financial
planning services, wealth management and margin lending activities.
Commission received as Responsible Entity for managed investment
schemes and for corporate trusteeships and other trustee and
custodial services.
Rural BankThe principal activities of Rural Bank are the provision of banking
services to agribusiness, rural and regional Australian communities.
Central functionsFunctions not relating directly to a reportable operating segment.
Major customers
Revenues from no one single customer amount to greater than 10%
of the Group’s revenues.

Bendigo and Adelaide Bank Ltd Appendix 4E: Preliminary Final Report
Year ended 30 June 2013
20
For the year ended 30 June 2013 Operating segments
Retail
bankingThird party
banking Wealth Rural Bank
Total operating segments
Central functions Total
$m $m $m $m $m $m $m
Net interest income 613.0 227.0 74.8 112.7 1,027.5 - 1,027.5
Other income 188.8 48.0 39.5 5.9 282.2 13.4 295.6
Share of net profit of equity accounted investments - - - - - 1.6 1.6
Total segment income 801.8 275.0 114.3 118.6 1,309.7 15.0 1,324.7
Operating expenses 545.6 81.1 86.5 51.0 764.2 14.8 779.0
Credit expenses 25.2 27.0 1.9 15.8 69.9 - 69.9
Segment result 231.0 166.9 25.9 51.8 475.6 0.2 475.8
For the year ended 30 June 2012 Operating segments
Retail
bankingThird party
banking Wealth Rural Bank
Total operating segments
Central functions Total
$m $m $m $m $m $m $m
Net interest income 538.6 215.7 80.4 115.4 950.1 - 950.1
Other income 178.8 26.8 47.8 5.7 259.1 16.0 275.1
Share of net profit of equity accounted investments - - - - - 0.7 0.7
Total segment income 717.4 242.5 128.2 121.1 1,209.2 16.7 1,225.9
Operating expenses 533.8 67.2 81.9 56.2 739.1 12.6 751.7
Credit expenses 13.8 6.2 0.4 12.0 32.4 - 32.4
Segment result 169.8 169.1 45.9 52.9 437.7 4.1 441.8
Operating segments
Retail
bankingThird party
banking Wealth Rural Bank
Total operating segments
Central functions Total
$m $m $m $m $m $m $m
Reportable segment assets
As at 30 June 2013 28,107.4 16,296.9 1,970.7 4,341.4 50,716.4 9,565.8 60,282.2
As at 30 June 2012 26,238.4 16,112.3 2,408.0 3,983.9 48,742.6 8,495.2 57,237.8
Reportable segment liabilities
As at 30 June 2013 33,687.4 475.0 4,725.4 3,645.7 42,533.5 6,914.1 49,447.6
As at 30 June 2012 31,840.8 517.9 5,102.3 3,472.2 40,933.2 5,675.9 46,609.1

Bendigo and Adelaide Bank Ltd Appendix 4E: Preliminary Final Report
Year ended 30 June 2013
21
Reconciliation between segment and statutory results
Consolidated
Full year Full year
June 2013 June 2012
$m $m
Reconciliation of total segment income to group income
Total segment income 1,324.7 1,225.9
Ineffectiveness in cash flow hedges (1.8) (13.0)
Specific income items 1 26.4 -
Total group income 1,349.3 1,212.9
Reconciliation of segment expenses to group total expenses
Segment operating expenses 779.0 751.7
Specific expense items1 12.8 102.7
Total group expenses 791.8 854.4
Reconciliation of segment credit expenses to bad and doubtful debts on loans and receivables
Segment credit expenses 69.9 32.4
Bad and doubtful debts on loans and receivables 69.9 32.4
Reconciliation of segment result to group profit before tax
Total segment result 475.8 441.8
Ineffectiveness in cash flow hedges (1.8) (13.0)
Specific income items 1 26.4 -
Specific expense items 1 (12.8) (102.7)
Group profit before tax 487.6 326.1
1 refer note 2.4.2 for details of specific items
Consolidated
As at As at
June 2013 June 2012
$m $m
Reportable segment assets
Total assets for operating segments 60,282.2 57,237.8
Total assets 60,282.2 57,237.8
Reportable segment liabilities
Total liabilities for operating segments 49,447.6 46,609.1
Securitisation funding 6,400.6 6,411.0
Total liabilities 55,848.2 53,020.1
Geographic Information
The allocation of revenue and assets is based on the geographic location of the customer. The group operates in all Australian states and territories, providing banking and other financial services.

Bendigo and Adelaide Bank Ltd Appendix 4E: Preliminary Final Report
Year ended 30 June 2013
22
2.4.7 Lending
Full year ending Six months ending
Jun-13 Jun-12 Change Jun-13 Dec-12 Change
$m $m $m % $m $m $m %
Approvals - by security
Residential 9,023.1 8,860.7 162.4 1.8 4,530.2 4,492.9 37.3 0.8
Non-residential 5,078.3 3,804.9 1,273.4 33.5 2,736.3 2,342.0 394.3 16.8
Total Approvals 14,101.4 12,665.6 1,435.8 11.3 7,266.5 6,834.9 431.6 6.3
As at Jun-13
As at Jun-12 Change
As at Jun-13
As at Dec-12 Change
$m $m $m % $m $m $m %
Gross loan balance - by security
Residential Business
35,009.5 33,768.8 1,240.7 3.7 35,009.5 34,274.5 735.0 2.1
Accommodation and food services 342.6 272.3 70.3 25.8 342.6 321.6 21.0 6.5
Administrative and support services 56.4 43.8 12.6 28.8 56.4 52.1 4.3 8.3
Agriculture, forestry and fishing 4,544.4 4,279.5 264.9 6.2 4,544.4 4,335.0 209.4 4.8
Arts and recreation services 76.5 69.8 6.7 9.6 76.5 69.5 7.0 10.1
Construction 933.9 890.9 43.0 4.8 933.9 961.0 (27.1) (2.8)
Education and training 60.8 45.5 15.3 33.6 60.8 55.6 5.2 9.4
Electricity, gas, water and waste services 29.6 26.3 3.3 12.5 29.6 28.9 0.7 2.4
Financial and insurance services 717.3 627.5 89.8 14.3 717.3 603.3 114.0 18.9
Health care and social assistance 505.1 390.2 114.9 29.4 505.1 469.3 35.8 7.6
Information media and telecommunications 26.2 9.3 16.9 181.7 26.2 17.3 8.9 51.4
Manufacturing 246.2 218.7 27.5 12.6 246.2 231.8 14.4 6.2
Mining 24.6 16.9 7.7 45.6 24.6 24.0 0.6 2.5
Other Services 185.6 109.1 76.5 70.1 185.6 149.0 36.6 24.6
Professional, scientific and technical services 235.7 177.5 58.2 32.8 235.7 225.7 10.0 4.4
Public administration and safety 184.9 96.3 88.6 92.0 184.9 126.1 58.8 46.6
Rental, hiring and real estate services 3,215.2 2,944.8 270.4 9.2 3,215.2 3,090.4 124.8 4.0
Retail trade 553.2 556.6 (3.4) (0.6) 553.2 541.0 12.2 2.3
Transport, postal and warehousing 174.1 116.2 57.9 49.8 174.1 153.2 20.9 13.6
Wholesale trade 162.3 169.3 (7.0) (4.1) 162.3 158.1 4.2 2.7
Other 387.4 561.6 (174.2) (31.0) 387.4 409.9 (22.5) (5.5)
Total business 12,662.0 11,622.1 1,039.9 8.9 12,662.0 12,022.8 639.2 5.3
Margin lending 1,915.6 2,333.2 (417.6) (17.9) 1,915.6 2,018.8 (103.2) (5.1)
Unsecured 824.2 869.2 (45.0) (5.2) 824.2 867.1 (42.9) (4.9)
Other 267.8 238.7 29.1 12.2 267.8 242.7 25.1 10.3
Total gross loan balance 50,679.1 48,832.0 1,847.1 3.8 50,679.1 49,425.9 1,253.2 2.5
Gross Loan balance - by purpose
Residential 32,790.4 31,555.0 1,235.4 3.9 32,790.4 32,162.1 628.3 2.0
Consumer 4,375.1 4,436.5 (61.4) (1.4) 4,375.1 4,190.2 184.9 4.4
Margin lending 1,915.6 2,333.2 (417.6) (17.9) 1,915.6 2,018.8 (103.2) (5.1)
Commercial 11,598.0 10,507.3 1,090.7 10.4 11,598.0 11,054.8 543.2 4.9
Total gross loan balance 50,679.1 48,832.0 1,847.1 3.8 50,679.1 49,425.9 1,253.2 2.5
Loans under management (gross balance)
On-balance sheet 50,679.1 48,832.0 1,847.1 3.8 50,679.1 49,425.9 1,253.2 2.5
Off-balance sheet loans under management 1,010.1 1,157.0 (146.9) (12.7) 1,010.1 1,079.6 (69.5) (6.4)
Total Group loans under management 51,689.2 49,989.0 1,700.2 3.4 51,689.2 50,505.5 1,183.7 2.3
Loans under management represent the gross balance of loans held
and managed by the Group:
On-balance sheet loans are the gross balance of loans and factoring
receivables held by the consolidated group.
Off-balance sheet loans under management represent the gross
balance of off-balance sheet loans managed by wholly-owned
subsidiaries of Bendigo and Adelaide Bank Limited.

Bendigo and Adelaide Bank Ltd Appendix 4E: Preliminary Final Report
Year ended 30 June 2013
23
2.4.8 Asset quality
As at Jun-13
As at Jun-12 Change
As at Jun-13
As at Dec-12 Change
$m $m $m % $m $m $m %
Impaired loans 1
Full-performing 2 3.6 1.8 1.8 100.0 3.6 0.9 2.7 300.0
Part-performing 3 119.0 116.4 2.6 2.2 119.0 106.0 13.0 12.3
Non-performing - property development 25.9 54.2 (28.3) (52.2) 25.9 29.1 (3.2) (11.0)
- other 179.1 150.4 28.7 19.1 179.1 136.2 42.9 31.5
Restructured loans 62.6 35.7 26.9 75.4 62.6 17.8 44.8 251.7
Total impaired assets 390.2 358.5 31.7 8.8 390.2 290.0 100.2 34.6
Less: Specific provisions (104.1) (102.9) (1.2) (1.2) (104.1) (96.2) (7.9) (8.2)
Net impaired assets 286.1 255.6 30.5 11.9 286.1 193.8 92.3 47.6
Past due 90 days
Well Secured (excluding commercial arrangement loans) 454.7 539.1 (84.4) (15.7) 454.7 441.2 13.5 3.1
Great Southern portfolio 283.4 264.7 18.7 7.1 283.4 278.1 5.3 1.9
Portfolio facilities (not well secured) 4.2 3.7 0.5 13.5 4.2 2.2 2.0 90.9
Ratios
Gross impaired to gross loans 0.77% 0.73% 0.04% 5.5 0.77% 0.59% 0.18% 30.5
Gross impaired (excl prop develop) to gross loans 0.72% 0.62% 0.10% 16.1 0.72% 0.53% 0.19% 35.8
Gross impaired to total assets 0.65% 0.63% 0.02% 3.2 0.65% 0.50% 0.15% 30.0
Gross impaired assets (excl prop develop) to total assets 0.60% 0.53% 0.07% 13.2 0.60% 0.45% 0.15% 33.3
Net impaired to gross loans 0.56% 0.52% 0.04% 7.7 0.56% 0.39% 0.17% 43.6
Net impaired (excl prop develop) to gross loans 0.51% 0.41% 0.10% 24.4 0.51% 0.33% 0.18% 54.5
Provision coverage 4 71.0% 73.4% (2.4%) (3.3) 71.0% 90.4% (19.4%) (21.5)
1 A facility is classified as impaired regardless of whether it is 90 days or more past due (arrears) when there is doubt as to whether the full amounts due (interest and principal) will be achieved in a timely manner. This is the case even if the full extent of the loss cannot be clearly determined.
2 Includes loans where the value of the security has reduced below the value of the outstanding loans but repayments are being made in accordance with the loan contract.
3 Includes loans where the value of the security has reduced below the value of the outstanding loans but partial repayments are being made in accordance with the loan contract.
4 Provision coverage is Provisions for doubtful debts - total divided by Total impaired assets.

Bendigo and Adelaide Bank Ltd Appendix 4E: Preliminary Final Report
Year ended 30 June 2013
24
2.4.9 Bad and doubtful debtsFull year ending Six months ending
Jun-13 Jun-12 Change Jun-13 Dec-12 Change
$m $m $m % $m $m $m %
Expense:
Bad debts written off 5.2 2.1 3.1 147.6 2.2 3.0 (0.8) (26.7)
Provision doubtful debts - expense 67.5 34.7 32.8 94.5 37.2 30.3 6.9 22.8
Total bad and doubtful debts expense 72.7 36.8 35.9 97.6 39.4 33.3 6.1 18.3
Less : Bad debts recovered 2.8 4.4 (1.6) (36.4) 1.6 1.2 0.4 33.3
Bad and doubtful debts net of recoveries 69.9 32.4 37.5 115.7 37.8 32.1 5.7 17.8
As at Jun-13
As at Jun-12 Change
As at Jun-13
As at Dec-12 Change
$m $m $m % $m $m $m %
Balances:
Provision for doubtful debts - specific 104.1 102.9 1.2 1.2 104.1 96.2 7.9 8.2
Provision for doubtful debts - collective 34.5 31.8 2.7 8.5 34.5 31.9 2.6 8.2
General reserve for credit losses (GRCL) 138.3 128.5 9.8 7.6 138.3 134.2 4.1 3.1
Total provision/reserve doubtful debts 276.9 263.2 13.7 5.2 276.9 262.3 14.6 5.6
Ratios:
Loan write-offs (annualised) to average assets 0.12% 0.06% 0.06% 100.0 0.11% 0.14% (0.03%) (21.4)
Loan write-offs (annualised) to gross loans 0.14% 0.07% 0.07% 100.0 0.13% 0.16% (0.03%) (18.8)
Total provision/reserve for doubtful debts to gross loans 0.55% 0.54% 0.01% 1.9 0.55% 0.53% 0.02% 3.8
Collective provision (adjusted for tax) & GRCL to risk-weighted assets 0.53% 0.53% 0.00% - 0.53% 0.53% 0.00% -
Specific Collective GRCL Total
The movement in provisions comprise:
Balance at June 2012 102.9 31.8 128.5 263.2
Provision doubtful debts expense to profit and loss 64.8 2.7 - 67.5
Bad debts written off - previously provided for (67.0) - - (67.0)
Appropriation of movement in general reserve for credit losses - - 9.8 9.8
Balance acquired in business combination 3.4 - - 3.4
Balance at June 2013 104.1 34.5 138.3 276.9
Total bad debts written off for the period, as shown above comprises:
Bad debts previously provided for 67.0
Other bad debts not previously provided for 5.2
Total bad debts written off for the period 72.2
Movements in specific and collective provisions are reflected as an
expense in the income statement.
Movements in the general reserve for credit losses are reflected as
an appropriation in retained earnings.
Total provisions and reserves for doubtful debts $m
General provisions Collective provisions Specific provisions
June 2011 June 2012 June 2013
276.9263.2244.2
138.3128.5110.9
34.531.841.9
104.1102.991.4

Bendigo and Adelaide Bank Ltd Appendix 4E: Preliminary Final Report
Year ended 30 June 2013
25
2.4.10 Deposits and funds under management
As at Jun-13
As at Jun-12 Change
As at Jun-13
As at Dec-12 Change
$m $m $m % $m $m $m %
Deposits and funds under management
Deposits 47,439.0 44,572.7 2,866.3 6.4 47,439.0 46,635.4 803.6 1.7
Securitisation 6,400.6 6,411.0 (10.4) (0.2) 6,400.6 5,678.3 722.3 12.7
Managed funds 3,275.2 3,089.9 185.3 6.0 3,275.2 3,334.5 (59.3) (1.8)
Total deposits and funds under management 57,114.8 54,073.6 3,041.2 5.6 57,114.8 55,648.2 1,466.6 2.6
Retail deposits and funds under management
Retail deposits 42,245.8 40,663.0 1,582.8 3.9 42,245.8 41,867.0 378.8 0.9
Managed funds 3,275.2 3,089.9 185.3 6.0 3,275.2 3,334.5 (59.3) (1.8)
Total retail deposits and funds under management 45,521.0 43,752.9 1,768.1 4.0 45,521.0 45,201.5 319.5 0.7
Deposits dissection - $m
Retail 42,245.8 40,663.0 1,582.8 3.9 42,245.8 41,867.0 378.8 0.9
Securitisation 6,400.6 6,411.0 (10.4) (0.2) 6,400.6 5,678.3 722.3 12.7
Wholesale - domestic 4,929.6 3,832.5 1,097.1 28.6 4,929.6 4,433.7 495.9 11.2
Wholesale - offshore 263.6 77.2 186.4 241.5 263.6 334.7 (71.1) (21.2)
Total deposits 53,839.6 50,983.7 2,855.9 5.6 53,839.6 52,313.7 1,525.9 2.9
Deposits dissection (excluding securitisation) - %
Retail 89.1% 91.2% (2.1%) (2.3) 89.1% 89.8% (0.7%) (0.8)
Wholesale - domestic 10.4% 8.6% 1.8% 20.9 10.4% 9.5% 0.9% 9.5
Wholesale - offshore 0.5% 0.2% 0.3% 150.0 0.5% 0.7% (0.2%) (28.6)
Total deposits excluding securitisation 100.0% 100.0% - - 100.0% 100.0% - -
Managed funds dissection
Assets under management 1,665.3 1,789.2 (123.9) (6.9) 1,665.3 1,730.6 (65.3) (3.8)
Other managed funds 1,609.9 1,300.7 309.2 23.8 1,609.9 1,603.9 6.0 0.4
Total managed funds 3,275.2 3,089.9 185.3 6.0 3,275.2 3,334.5 (59.3) (1.8)
Assets under management includes those funds deposited into the
Sandhurst Trustees Limited Common Funds, which are invested in
cash, cash enhanced and mortgage investments on behalf of the
investors. These funds are off-balance sheet.
Other managed funds include funds deposited for investment in
managed investment products and superannuation funds managed
off-balance sheet by Sandhurst Trustees Limited and Adelaide
Managed Funds Limited. Also included are portfolios of loans
managed by the Bank and third parties who contribute to first
loss coverage.

Bendigo and Adelaide Bank Ltd Appendix 4E: Preliminary Final Report
Year ended 30 June 2013
26
Funding mix $m
Retail deposits and funds under management $m
Retail
Wholesale
Securitisation
Retail deposits
Funds under management
June 2012 June 2012December 2012 December 2012June 2013 June 2013
78.5%
9.6%
11.9%
79.7%
7.7%
12.6%
80.0%
9.1%
10.9%
42,24641,86740,663
3,910
6,411
40,663
6,411
4,768
5,678
41,867
5,193
6,401
42,246
3,2753,335
3,090
Retail deposits increased by $1.6 billion or 3.9% to $42.2 billion
over the 12 months.
Wholesale deposits increased by $1.3 billion or 32.8% to $5.2
billion over the 12 months.
The Group’s retail deposit base remains strong at 89.1% of deposits
(excluding securitisation).

Bendigo and Adelaide Bank Ltd Appendix 4E: Preliminary Final Report
Year ended 30 June 2013
27
2.4.11 Capital and shareholder returns2.4.11.1 Capital adequacy
Consolidated
As at Jun-13* As at Jun-12
$m $m
Risk weighted capital ratios
Tier 1 9.25% 8.39%
Tier 2 1.46% 2.02%
Total capital ratio 10.71% 10.41%
Regulatory capital
Common equity Tier 1
Contributed capital 3,758.0 3,681.8
Retained profits & reserves 320.7 101.3
Accumulated other comprehensive income (and other reserves) (17.7) -
Innovative Tier 1 capital - 277.9
Less,
Intangible assets, cash flow hedges and capitalised expenses 1,637.3 1,583.9
Net deferred tax assets 6.6 -
Equity Exposures 27.8 -
50/50 deductions - 8.5
Other adjustments as per APRA advice 2.4 92.4
Total common equity tier 1 capital 2,386.9
Additional Tier 1 capital instruments 438.5
Total Additional Tier 1 Capital 438.5
Total Tier 1 Capital 2,825.4 2,376.2
Tier 2
Tier 2 capital instruments 290.8 434.6
General reserve for credit losses/collective provision (net of tax effect) 154.1 144.4
Asset revaluation reserves - 1.9
Less,
50/50 deductions - 8.5
Total tier 2 capital 444.9 572.4
Total regulatory capital 3,270.3 2,948.6
Total risk weighted assets 30,530.2 28,310.1
Common Tier 1 Equity 1 7.82% 7.73%
1 June 2012 comparative purposes only
* Current year disclosures have been presented to reflect the requirements of Basel III effective from 1 January 2013. Prior year comparatives have not been restated.
7.85% 8.39% 9.25%
2.74% 2.02% 1.46%
Tier 1 Tier 2
June 2011 June 2012 June 2013
Capital adequacy %
Capital adequacy is calculated in accordance with regulations set
down by APRA.

Bendigo and Adelaide Bank Ltd Appendix 4E: Preliminary Final Report
Year ended 30 June 2013
28
2.4.11.2 Shareholder returns
Full year ending Six months ending
Jun-13 Jun-12 Change % Jun-13 Dec-12 Change %
Cash basis earnings per ordinary share (weighted average)-cents 85.4 84.2 1.2 1.4 43.5 41.9 1.6 3.8
Earnings per ordinary share (weighted average)-cents 84.9 48.6 36.3 74.7 39.0 45.9 (6.9) (15.0)
Diluted earnings per ordinary share (weighted average)-cents 77.9 47.7 30.2 63.3 36.2 42.2 (6.0) (14.2)
Weighted number of ordinary shares used in basic and cash basis EPS calculations - 000's 407,409 383,464 23,945 6.2 409,886 404,972 4,914 1.2
Weighted number of ordinary shares used in diluted EPS calculations - 000's 461,305 416,966 44,339 10.6 465,873 451,704 14,169 3.1
Cash basis return on average tangible equity 13.48% 14.05% (0.57%) (4.1) 13.59% 13.37% 0.22% 1.6
Cash basis return on average ordinary equity 8.58% 8.36% 0.22% 2.6 8.77% 8.39% 0.38% 4.5
After tax return on average ordinary equity 8.52% 4.84% 3.68% 76.0 7.86% 9.19% (1.33%) (14.5)
After tax before specific items return on average ordinary equity 8.16% 7.88% 0.28% 3.6 8.45% 7.88% 0.57% 7.2
Cash basis return on average assets 0.59% 0.58% 0.01% 1.7 0.60% 0.59% 0.01% 1.7
After tax return on average assets 0.60% 0.35% 0.25% 71.4 0.55% 0.65% (0.10%) (15.4)
After tax before specific items return on average assets 0.57% 0.56% 0.01% 1.8 0.59% 0.56% 0.03% 5.4
Profitability ratios for half year results have been annualised by
multiplying the numerator by two.
Cash earnings used in cash basis earnings per ordinary share is
profit after tax adjusted for specific items after tax, intangibles
amortisation (except intangible software amortisation) and dividends
on preference shares.
Earnings used in the earnings per ordinary share is, profit after tax
including specific items, less dividends on preference shares.
After tax return on average assets uses profit after tax.
Dilutive preference shares include preference shares, convertible
preference shares and step up preference shares.
Ordinary equity for use in these ratios is net assets less preference
shares, asset revaluation reserve – shares and unrealised gains/
losses on cash flow hedges reserve.
As at Jun-13 As at Jun-12
$m $m
Net Assets 4,434.0 4,217.7
Preference share capital (188.5) (188.5)
Asset Revaluation Reserve (2.8) (26.9)
Unrealised gains/losses on cash flow hedge reserve 34.6 86.4
Acquisition reserve 20.4 20.4
Total ordinary equity 4,297.7 4,109.1
Bendigo and Adelaide Bank Ltd Appendix 4E: Preliminary Final Report
Year ended 30 June 2013
29
2.4.11.3 Return on Equity (RoE) & Return on Tangible Equity (RoTE) – six months
2.4.11.4 Dividends
Full year ending Six months ending
Jun-13 Jun-12 Change % Jun-13 Dec-12 Change %
Dividend per share - cents 61.0 60.0 1.0 1.7 31.0 30.0 1.0 3.3
Dividend amount payable - $m 245.0 232.9 12.1 5.2 125.1 119.9 5.2 4.3
Payout ratio - earnings per ordinary share* 71.8% 123.5% (51.7%) (41.9) 79.5% 65.4% 14.1% 21.6
Payout ratio - cash basis per ordinary share* 71.4% 71.3% 0.1% 0.1 71.3% 71.6% (0.3%) (0.4)
* Payout ratio is calculated as dividend per share divided by the applicable earnings per ordinary share.
2.4.11.5 Earnings in cents per ordinary share
Cash basis RoE Cash basis RoTE
December 2011 December 2011
8.52% 14.81%
June 2012 June 2012
8.21%
13.36%
December 2012 December 2012June 2013 June 2013
8.77%
8.39%
13.59%13.37%
Earnings per share
December 2011
14.5
June 2012
33.5
December 2012 June 2013
39.045.9
Cash earnings per share
December 2011
43.9
June 2012
40.5
December 2012 June 2013
43.541.9

Bendigo and Adelaide Bank Ltd Appendix 4E: Preliminary Final Report
Year ended 30 June 2013
30
2.4.11.5 Earnings in cents per ordinary share (cont.) Dividend Reinvestment Plan
The Dividend Reinvestment Plan provides shareholders with the
opportunity of converting their entitlement to a dividend into new
shares. The issue price of the shares is equal to the volume weighted
average share price of Bendigo and Adelaide Bank shares traded
on the Australian Stock Exchange over the 15 trading days following
the Record Date. Shares issued under this Plan rank equally with all
other ordinary shares.
Bonus Share Scheme
The Bonus Share Scheme provides shareholders with the opportunity
to elect to receive a number of bonus shares issued for no
consideration instead of receiving a dividend. The issue price of
the shares is equal to the volume weighted average share price of
Bendigo and Adelaide Bank shares traded on the Australian Stock
Exchange over the 15 trading days following the Record Date. Shares
issued under this scheme rank equally with all other ordinary shares.
The last date for the receipt of an election notice for participation in
either the Dividend Reinvestment Plan or Bonus Share Scheme for
the 2013 final dividend is 29 August 2013.
Dividends
December 2011
30.0
June 2012
30.0
December 2012 June 2013
31.0
30.0
Bendigo and Adelaide Bank Ltd Appendix 4E: Preliminary Final Report
Year ended 30 June 2013
31
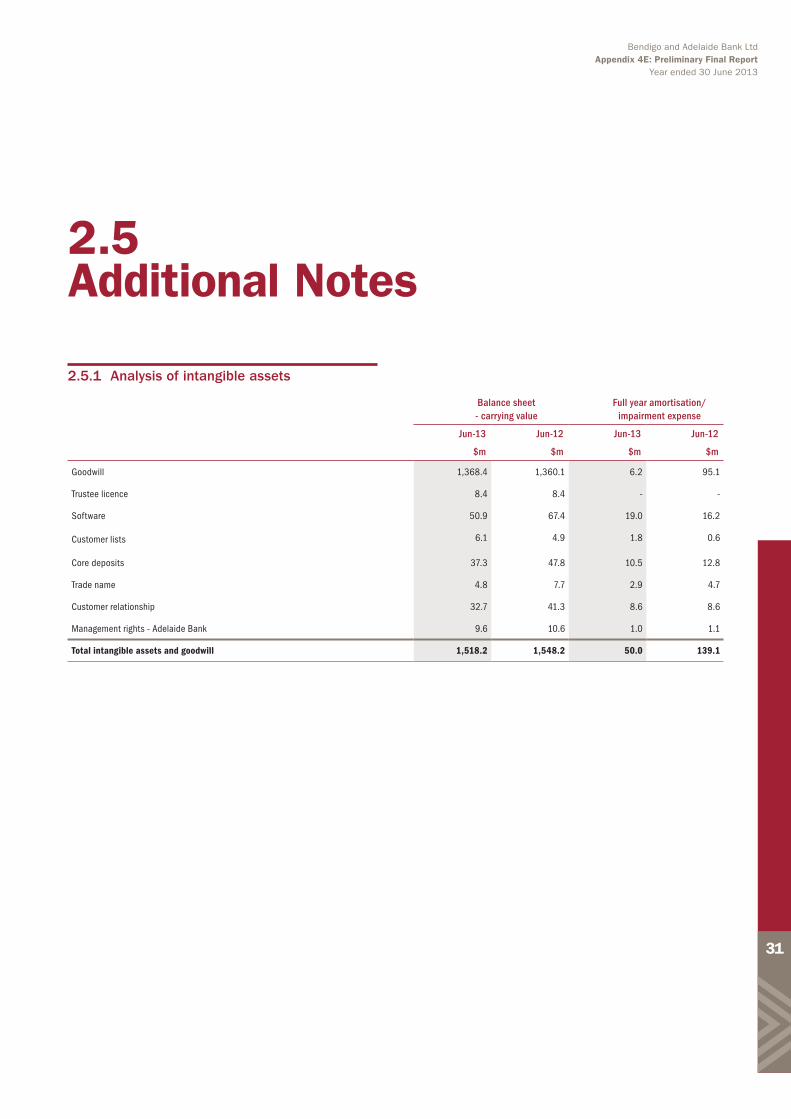
2.5.1 Analysis of intangible assets
Balance sheet - carrying value
Full year amortisation/ impairment expense
Jun-13 Jun-12 Jun-13 Jun-12
$m $m $m $m
Goodwill 1,368.4 1,360.1 6.2 95.1
Trustee licence 8.4 8.4 - -
Software 50.9 67.4 19.0 16.2
Customer lists 6.1 4.9 1.8 0.6
Core deposits 37.3 47.8 10.5 12.8
Trade name 4.8 7.7 2.9 4.7
Customer relationship 32.7 41.3 8.6 8.6
Management rights - Adelaide Bank 9.6 10.6 1.0 1.1
Total intangible assets and goodwill 1,518.2 1,548.2 50.0 139.1
2.5 Additional Notes

Bendigo and Adelaide Bank Ltd Appendix 4E: Preliminary Final Report
Year ended 30 June 2013
32
Ownership interest held by consolidated entity Balance date
2013 2012
% %
Name
Community Telco Australia Pty Ltd 1 100.0 50.0 30 June
Community Sector Enterprises Pty Ltd 50.0 50.0 30 June
Homesafe Solutions Pty Ltd 50.0 50.0 30 June
Silver Body Corporate Financial Services Pty Ltd 50.0 50.0 30 June
Strategic Payments Services Pty Ltd 47.5 47.5 31 December
Linear Financial Holdings Pty Ltd 40.0 40.0 30 June
Homebush Financial Services Ltd 49.0 49.0 30 June
Vicwest Community Enterprise Ltd 50.0 0.0 30 June
Aegis Correctional Partnership Pty Ltd 49.5 0.0 30 June
Aegis Securitisation Nominees Pty Ltd 49.5 0.0 30 June
Aegis Correctional Partnership Trust 49.5 0.0 30 June
Aegis Securitisation Trust 49.5 0.0 30 June
1 Community Telco Australia Pty Ltd - telecommunication services (wholly-owned subsidiary, effective December 2012)
(i) Principal activities of associated companies
Community Sector Enterprises Pty Ltd - financial services
Homesafe Solutions Pty Ltd - trust manager
Silver Body Corporate Financial Services Pty Ltd - financial services
Strategic Payments Services Pty Ltd - payment processing services
Linear Financial Holdings Pty Ltd - asset management services
Homebush Financial Services Ltd - financial services
Vicwest Community Enterprise Ltd - telecommunication services
(acquired December 2012)
Aegis Correctional Partnership Pty Ltd - trustee services
(acquired November 2012)
Aegis Securitisation Nominees Pty Ltd - trustee services
(acquired November 2012)
Aegis Correctional Partnership Trust - project management and
financial services (acquired November 2012)
Aegis Securitisation Trust - financial services
(acquired November 2012)
All joint venture companies are incorporated in Australia, and have a
balance date of 30 June except Strategic Payments Services Pty Ltd
which has a balance date of 31 December.
2013 2012
$m $m
(ii) Share of associates’ operating profits before income tax:
- Community Sector Enterprises Pty Ltd 0.3 0.4
- Homesafe Solutions Pty Ltd 0.2 0.4
- Silver Body Corporate Financial Services Pty Ltd 0.1 0.3
- Strategic Payments Services Pty Ltd 1.5 0.3
- Linear Financial Holdings Pty Ltd (0.4) (0.7)
- Homebush Financial Services Ltd - -
- Vicwest Community Enterprise Ltd (0.1) -
- Aegis Correctional Partnership Pty Ltd - -
- Aegis Securitisation Nominees Pty Ltd - -
- Aegis Correctional Partnership Trust - -
- Aegis Securitisation Trust - -
1.6 0.7
2.5.2 Investments accounted for using the equity method
Bendigo and Adelaide Bank Ltd Appendix 4E: Preliminary Final Report
Year ended 30 June 2013
33
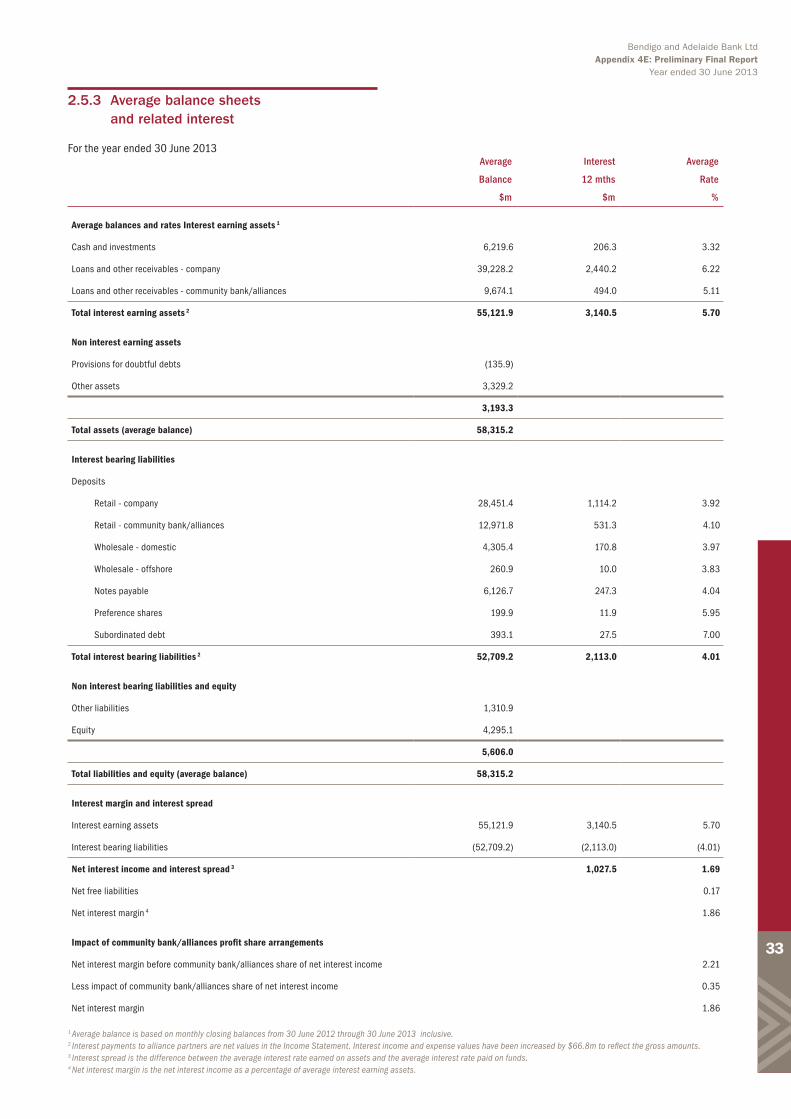
Average Interest Average
Balance 12 mths Rate
$m $m %
Average balances and rates Interest earning assets 1
Cash and investments 6,219.6 206.3 3.32
Loans and other receivables - company 39,228.2 2,440.2 6.22
Loans and other receivables - community bank/alliances 9,674.1 494.0 5.11
Total interest earning assets 2 55,121.9 3,140.5 5.70
Non interest earning assets
Provisions for doubtful debts (135.9)
Other assets 3,329.2
3,193.3
Total assets (average balance) 58,315.2
Interest bearing liabilities
Deposits
Retail - company 28,451.4 1,114.2 3.92
Retail - community bank/alliances 12,971.8 531.3 4.10
Wholesale - domestic 4,305.4 170.8 3.97
Wholesale - offshore 260.9 10.0 3.83
Notes payable 6,126.7 247.3 4.04
Preference shares 199.9 11.9 5.95
Subordinated debt 393.1 27.5 7.00
Total interest bearing liabilities 2 52,709.2 2,113.0 4.01
Non interest bearing liabilities and equity
Other liabilities 1,310.9
Equity 4,295.1
5,606.0
Total liabilities and equity (average balance) 58,315.2
Interest margin and interest spread
Interest earning assets 55,121.9 3,140.5 5.70
Interest bearing liabilities (52,709.2) (2,113.0) (4.01)
Net interest income and interest spread 3 1,027.5 1.69
Net free liabilities 0.17
Net interest margin 4 1.86
Impact of community bank/alliances profit share arrangements
Net interest margin before community bank/alliances share of net interest income 2.21
Less impact of community bank/alliances share of net interest income 0.35
Net interest margin 1.86
1 Average balance is based on monthly closing balances from 30 June 2012 through 30 June 2013 inclusive. 2 Interest payments to alliance partners are net values in the Income Statement. Interest income and expense values have been increased by $66.8m to reflect the gross amounts. 3 Interest spread is the difference between the average interest rate earned on assets and the average interest rate paid on funds. 4 Net interest margin is the net interest income as a percentage of average interest earning assets.
2.5.3 Average balance sheets and related interest
For the year ended 30 June 2013

Bendigo and Adelaide Bank Ltd Appendix 4E: Preliminary Final Report
Year ended 30 June 2013
34
For the year ended 30 June 2012
Average Interest Average
Balance 12 mths Rate
$m $m %
Average balances and rates Interest earning assets 1
Cash and investments 6,116.2 271.1 4.43
Loans and other receivables - company 38,900.0 2,740.3 7.04
Loans and other receivables - community bank/alliances 8,427.7 510.1 6.05
Total interest earning assets 2 53,443.9 3,521.5 6.59
Non interest earning assets
Provisions for doubtful debts (134.7)
Other assets 2,890.4
2,755.7
Total assets (average balance) 56,199.6
Interest bearing liabilities
Deposits
Retail - company 27,104.1 1,312.1 4.84
Retail - community bank/alliances 11,613.8 597.1 5.14
Wholesale - domestic 3,707.2 190.3 5.13
Wholesale - offshore 85.9 4.4 5.12
Notes payable 7,691.4 421.5 5.48
Preference shares 89.5 5.5 6.15
Subordinated debt 531.1 40.5 7.63
Total interest bearing liabilities 2 50,823.0 2,571.4 5.06
Non interest bearing liabilities and equity
Other liabilities 1,318.0
Equity 4,058.6
5,376.6
Total liabilities and equity (average balance) 56,199.6
Interest margin and interest spread
Interest earning assets 53,443.9 3,521.5 6.59
Interest bearing liabilities (50,823.0) (2,571.4) (5.06)
Net interest income and interest spread 3 950.1 1.53
Net free liabilities 0.25
Net interest margin 4 1.78
Impact of community bank/alliances profit share arrangements
Net interest margin before community bank/alliances share of net interest income 2.11
Less impact of community bank/alliances share of net interest income 0.33
Net interest margin 1.78
1 Average balance is based on monthly closing balances from 30 June 2011 through 30 June 2012 inclusive. 2 Interest payments to alliance partners are net values in the Income Statement. Interest income and expense values have been increased by $80.7m to reflect the gross amounts. 3 Interest spread is the difference between the average interest rate earned on assets and the average interest rate paid on funds. 4 Net interest margin is the net interest income as a percentage of average interest earning assets.

Bendigo and Adelaide Bank Ltd Appendix 4E: Preliminary Final Report
Year ended 30 June 2013
35
2.5.4 Net tangible assets per ordinary share
Jun-13 Jun-12
Net tangible assets per ordinary share $6.62 $6.16
Net tangible assets $m $m
Net assets 4,434.0 4,217.7
Intangibles (1,518.2) (1,548.2)
Preference shares - face value (90.0) (90.0)
Step-up preference shares - face value (100.0) (100.0)
Net tangible assets attributable to ordinary shareholders 2,725.8 2,479.5
Number of fully paid ordinary shares on issue - 000's 412,008 402,233
2.5.5 Credit ratings
Short Term Long Term Outlook
Standard & Poor’s A-2 A- Stable
Fitch Ratings F2 A- Stable
Moody’s P-1 A2 Stable
On 8 July 2013, Standard & Poor’s Ratings Services affirmed its
long-term counterparty credit rating on Bendigo and Adelaide Bank
Ltd at ‘A-‘, and affirmed the short-term rating at ‘A-2’. The outlook
remains stable. Standard and Poor’s commented that the issuer
credit ratings on Bendigo and Adelaide Bank Ltd reflect the Bank’s
adequate business position, its strong capital and earnings, and
adequate risk position.
On 14 December 2012, Fitch Ratings, the international ratings
agency affirmed Bendigo and Adelaide Bank Ltd’s long term rating at
A- and affirmed the short term rating of F2 and its support rating of
‘3’, and the Bank’s viability rating of ‘A-’. The outlook remains stable.
Fitch commented the ratings reflect Bendigo and Adelaide Bank’s
stable domestic retail banking franchise, sound funding and liquidity
position, conservative risk management framework and adequate
capitalisation. The ratings also recognise the Bank’s strong asset
quality which has benefited from conservative risk controls and a
well collateralised loan book.
On 20 December 2011, Moody’s Investors Service assigned a bank
financial strength rating of C to Bendigo and Adelaide Bank Ltd.
Moody’s affirmed a long term rating at A2, short term rating at P-1,
with a stable outlook. Moody’s commented that the rating reflects
the Bank’s diversified business profile and stable retail franchise,
which includes a significant customer deposit base supported by a
large national branch network.

Bendigo and Adelaide Bank Ltd Appendix 4E: Preliminary Final Report
Year ended 30 June 2013
36
2.5.6 Issued capital
Changes to issued and quoted securities during the period
Ordinary Shares Number of Shares $m
Fully paid ordinary shares at 30 June 2012 402,233,266 3,681.8
Shares issued:
September 2012 - Dividend Reinvestment Plan at $7.39 4,957,637 36.6
September 2012 - Bonus Share Scheme (in lieu of dividend payment) at $7.39 402,549 -
March 2013 - Dividend Reinvestment Plan at $9.92 4,010,851 39.8
March 2013 - Bonus Share Scheme (in lieu of dividend payment) at $9.92 403,561 -
Share issue costs - (0.2)
Fully paid ordinary shares at 30 June 2013 412,007,864 3,758.0
Preference Shares
Preference shares of $100 face value (fully paid) at 30 June 2012 900,000 88.5
Preference shares of $100 face value (fully paid) at 30 June 2013 900,000 88.5
Step Up Preference Shares
Preference shares of $100 face value (fully paid) at 30 June 2012 1,000,000 100.0
Preference shares of $100 face value (fully paid) at 30 June 2013 1,000,000 100.0

Bendigo and Adelaide Bank Ltd ABN 11 068 049 178


