Download - PRECIPITATING FACTORS OF OBESITY_MonEdits
PRECIPITATING FACTORS OF OBESITY AND
Limitations of Available Healthcare Data
Jeffrey AllenSchool of Public and Environmental Affairs
Indiana University Northwest
Background of the problem
• Obesity Rates increased from 13% (60’s) to 30% (present) of US population (City of New York, 2012)
• Currently 2/3 of US overweight (roughly 200 million)
• Direct & indirect obesity-related healthcare expenditures topped $147 Billion in US by 2008
(Hammond & Levine 2010)
City of New York. 2012. “Reversing the Epidemic: The New York City Obesity Task Force Plan To Prevent and Control Obesity.” Retrieved from: nyc.gov (data file).
Hammond, Ross A. and Ruth Levine. 2010. “The Economic Impact of Obesity in the United States.” Diabetes, metabolic syndrome and obesity: targets and therapy, 3: 285.
Trends in Literature
• Shifts in employment & access• Outsourcing
• Technology dependence (shift from physical labor)
• Increased availability of processed meals
• Fluctuating cycles of employment
(Barnes 2010)
Barnes, Melody. 2010. “Solving the Problem of Childhood Obesity within a Generation.” Washington, DC: US executive Office of the President.

Methodology
Research Question: Do social, economic, and environmental factors help explain obesity rates and which factor(s) best explain(s) and predict(s) community’s obesity level?
Hypothesis #1: Higher levels of physical inactivity significantly increase obesity levels.
Hypothesis #2- Higher levels of food insecurity significantly in-crease county obesity rates
Data source Robert Wood Johnson Foundation. (2014). County Health Rankings & Roadmaps, Indiana.
Retrieved from: http://www.countyhealthrankings.org/app/indiana/2014/overview
Types of analyses• Descriptives• OLS regression
Variables
• Obesity • Smoking• Physical Inactivity• Drinking• Unemployment• Uninsured• Access to healthy food• Food insecurity
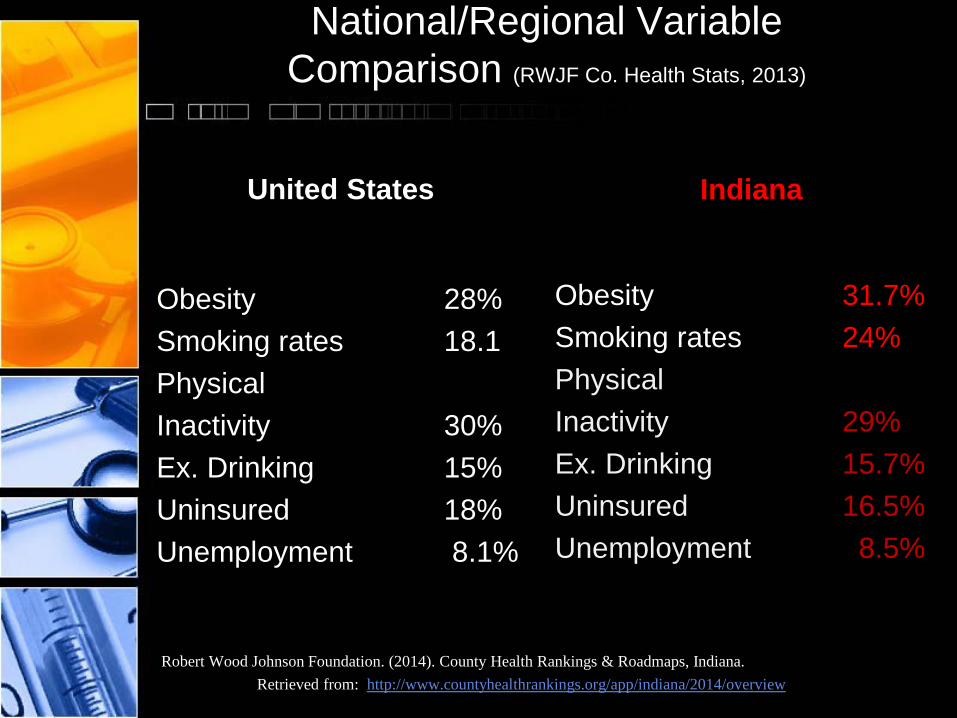
United States
Obesity 28%Smoking rates 18.1PhysicalInactivity 30%Ex. Drinking 15%Uninsured 18%Unemployment 8.1%
Indiana
Obesity 31.7%Smoking rates 24%PhysicalInactivity 29% Ex. Drinking 15.7%Uninsured 16.5%Unemployment 8.5%
National/Regional Variable Comparison (RWJF Co. Health Stats, 2013)
Robert Wood Johnson Foundation. (2014). County Health Rankings & Roadmaps, Indiana.Retrieved from: http://www.countyhealthrankings.org/app/indiana/2014/overview
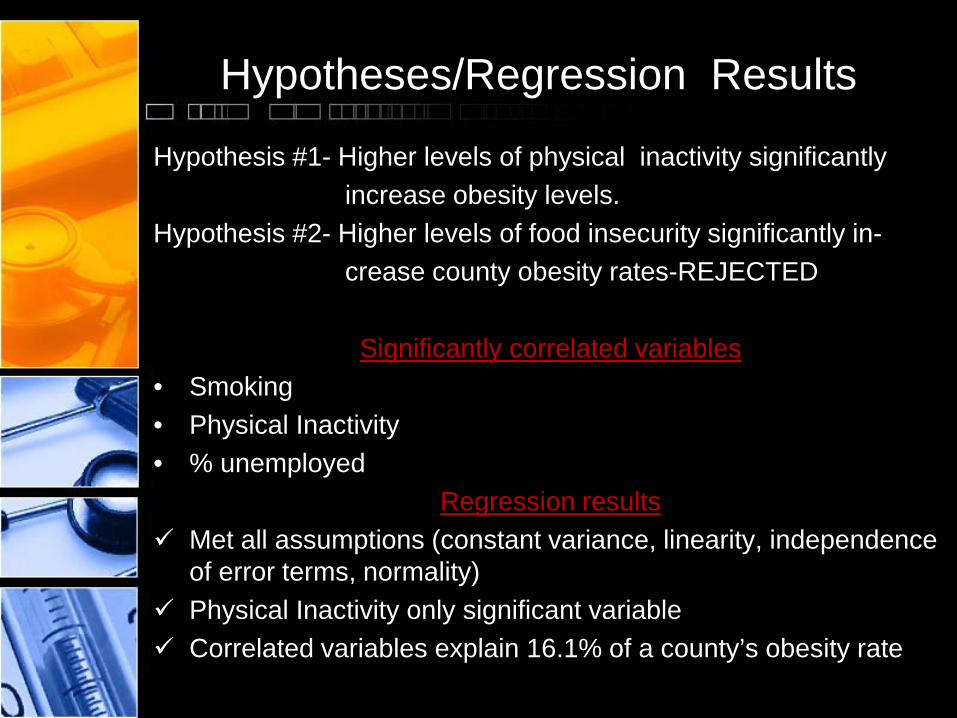
Hypotheses/Regression Results
Hypothesis #1- Higher levels of physical inactivity significantly increase obesity levels.
Hypothesis #2- Higher levels of food insecurity significantly in-crease county obesity rates-REJECTED
Significantly correlated variables• Smoking• Physical Inactivity• % unemployed
Regression results Met all assumptions (constant variance, linearity, independence
of error terms, normality) Physical Inactivity only significant variable Correlated variables explain 16.1% of a county’s obesity rate
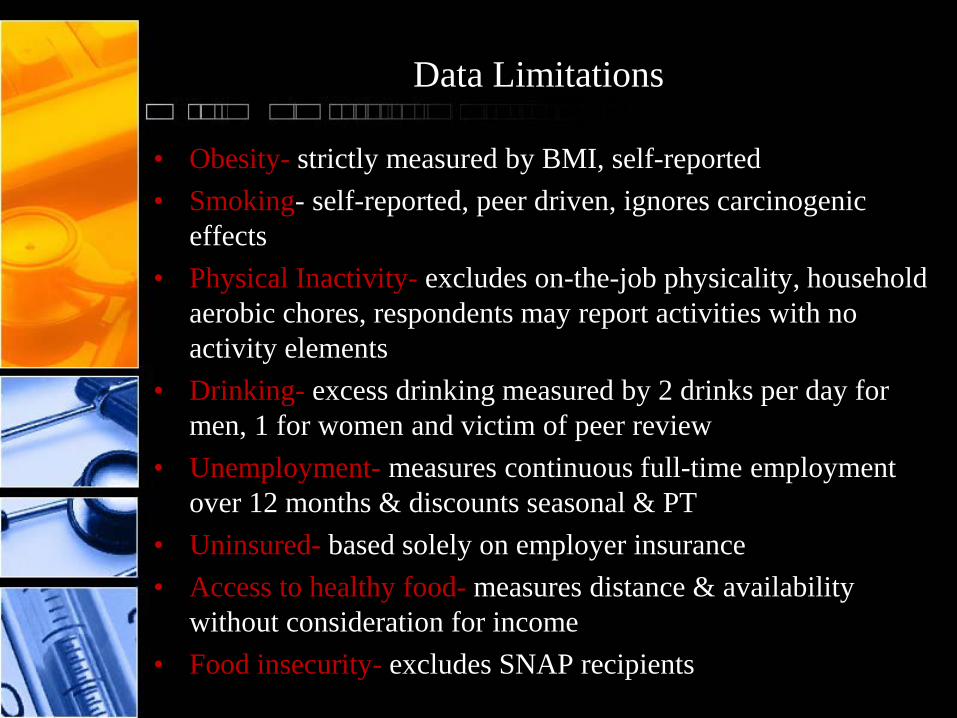
Data Limitations
• Obesity- strictly measured by BMI, self-reported• Smoking- self-reported, peer driven, ignores carcinogenic
effects• Physical Inactivity- excludes on-the-job physicality, household
aerobic chores, respondents may report activities with no activity elements
• Drinking- excess drinking measured by 2 drinks per day for men, 1 for women and victim of peer review
• Unemployment- measures continuous full-time employment over 12 months & discounts seasonal & PT
• Uninsured- based solely on employer insurance• Access to healthy food- measures distance & availability
without consideration for income• Food insecurity- excludes SNAP recipients
Recommendations: Public Administration Focus
• Affordable Care Act Inclusions (CDC.gov 2013):– All insurance must cover obesity/diabetes screens & smoking cessation– Removal of preventative care cost-sharing– Medicaid expansion availability (IN-HIP 2.0 waiver)– Community Transformation Grants
• Must target physical activity, obesity, healthy living environments & smoking cessation
• Two-tiered grants-Large communities (states) & small (hospitals, schools, counties, metros)
– Workplace Wellness Grants– Health needs assessments
• Must be performed every 3 yrs. by non-profit hospitals to maintain tax states
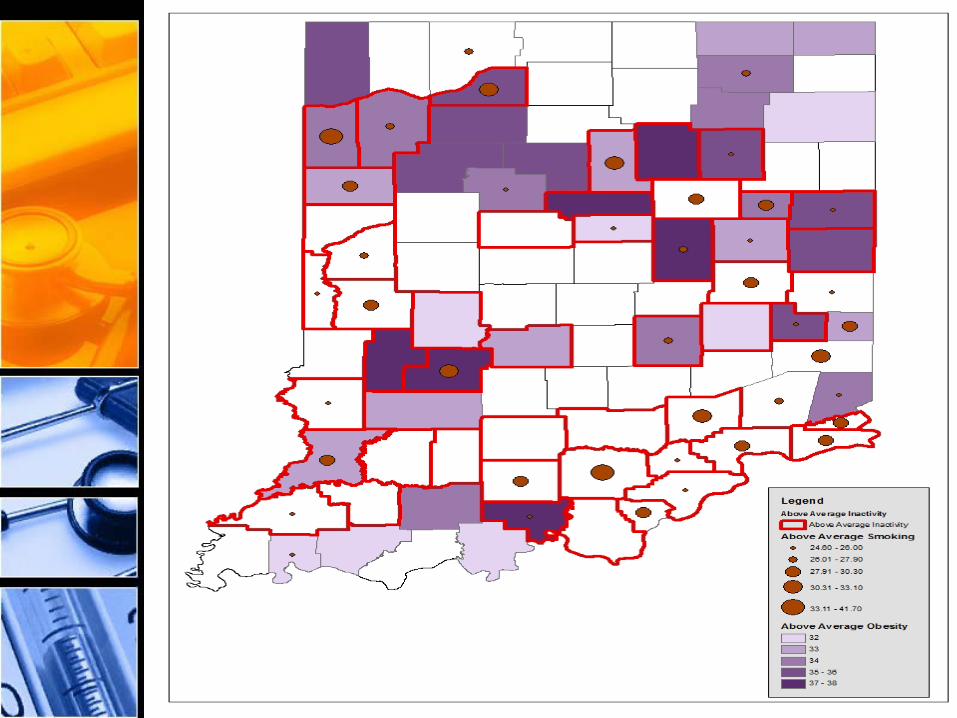
• Determine distribution targets (GIS map)
Baicker, Katherine, Sarah L. Taubman, Heidi L. Allen, Mira Bernstein, Jonathon H. Gruber, Joseph P. Newhouse, and Amy Finkelstein. 2013. “The Oregon Experiment—effects of Medicaid on clinical outcomes.” New England Journal of Medicine, 368(18): 1713-1722.
Centers for Disease Control. 2013. “Community Transformation Grants Program Fact Sheet.”(Data File). Retrieved from: cdc.gov/nccdhp/dch/programs/communitytransformation.

Future Research
• Investigate real and perceived barriers to physical activity
• Research more accurate gauges of food insecurity and the duality of malnutrition and obesity coupled with the nutritive barriers that exists in a variety of communities and land-mix usage areas.

Contact information
• Jeffrey S. Allen
Indiana University Northwest34000 Broadway Ave.Gary, IN [email protected]


