
8/8/2019 Pre Market Report 20th Oct 2010_yourstocksolutions
http://slidepdf.com/reader/full/pre-market-report-20th-oct-2010yourstocksolutions 1/5
DAILY NEWS LETTER DATE: Wednesday, October 20, 2010
Market Outlook Morning News Review Global Indices
Index LTP Change % Change
DJIA 10979 -165 -1.48
Nasdaq 2437 -44 -1.76
S&P 500 1166 -19 -1.59
Bovespa 69864 -1872 -2.61
FTSE 100 5704 -39 -0.67
CAC 40 3807 -27 -0.71
DAX 6491 -26 -0.4
Madrid
General 1123 1 0.08
Nikkei 225 9332 -208 -2.18
Hang Seng 23326 -437 -1.84
All Ordinaries 4672 -56 -1.17
Straits Times 3159 -33 -1.03
Key Index Indicators
NIFTY
8-Day EMA 6093
21-Day EMA6042
50-Day EMA5847
200-Day EMA5362
13-Week EMA5779
.
Iron ore exporter Sesa Goa, part of Vedanta
Resources, is talking to the Orissa-based Ahluwalia
family to renew a mining agreement that will
enable Sesa to expand its capacity to five million
tonne (mt). The expansion is part of Sesa Goa’s Rs
2,500-crore plan to raise its total mining capacity
to 50 mt from all its operations in Goa, Karnataka
and Orissa, managing director PK Mukherjee told
ET on Tuesday. “The mines at Orissa are not
owned by us...we are only operators. So we want
to renew the agreement that expired last year to
expand capacity,” Mr Mukherjee said over the
phone from Goa.
Even as a government panel on environment
remains divided on Posco’s steel project in Orissa,
the state government has thrown its weight
behind the South Korean steelmaker to complete
the over five-year project.
Foreign oil majors, such as Shell, will not put off
bidding for oil and gas exploration blocks
auctioned by India despite concerns over the
government’s handling of the Cairn-Vedanta deal,
the head of the company’s Indian arm said.
Fidelity Growth Partners , the private equity arm
of financial services major Fidelity, has invested
about $20 million (about Rs 90 crore) in ShreemCapacitors
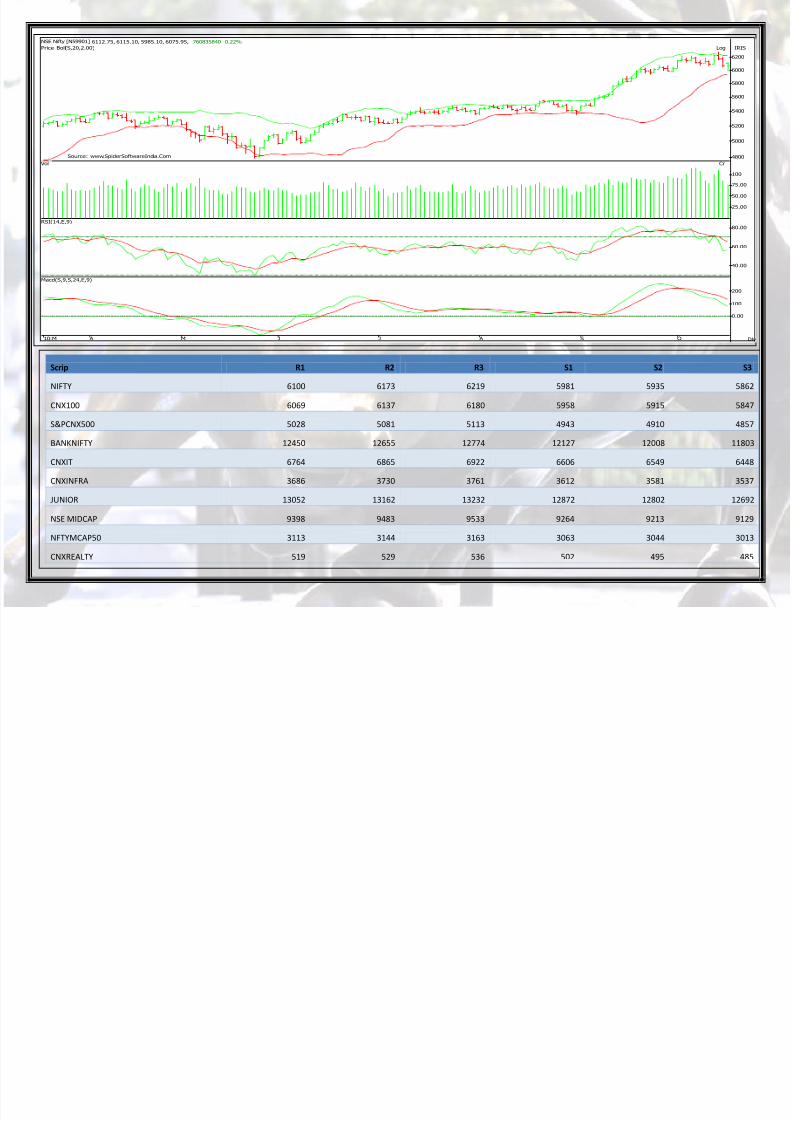
Market is expected to open on negative note. today’s
trading session, if nifty trades below then it 5984 then
it may test 5960-5955 levels.6060 is the resistance
area.
www.yourstocksolutions.com
Wednesday, October 20, 2010
8/8/2019 Pre Market Report 20th Oct 2010_yourstocksolutions
http://slidepdf.com/reader/full/pre-market-report-20th-oct-2010yourstocksolutions 2/5
Scrip R1 R2 R3 S1 S2 S3
NIFTY 6100 6173 6219 5981 5935 5862
CNX100 6069 6137 6180 5958 5915 5847
S&PCNX500 5028 5081 5113 4943 4910 4857
BANKNIFTY 12450 12655 12774 12127 12008 11803
CNXIT 6764 6865 6922 6606 6549 6448
CNXINFRA 3686 3730 3761 3612 3581 3537
JUNIOR 13052 13162 13232 12872 12802 12692
NSE MIDCAP 9398 9483 9533 9264 9213 9129
NFTYMCAP50 3113 3144 3163 3063 3044 3013
CNXREALTY 519 529 536 502 495 485
10:M A M J J A S O
Log IRIS
Source : www.SpiderSoftwareIndia.Com 4800
5000
5200
5400
5600
5800
6000
6200
Cr
25.00
50.00
75.00
100
40.00
60.00
80.00
0.00
100
200
Price Boll(S,20,2.00)
Vol
RSI(14,E,9)
Macd(S,9,S,24,E,9)
NSE Nifty [N59901] 6112.75, 6115.10, 5985.10, 6075.95, 760835840 0.22%
Dly

8/8/2019 Pre Market Report 20th Oct 2010_yourstocksolutions
http://slidepdf.com/reader/full/pre-market-report-20th-oct-2010yourstocksolutions 3/5
Scrip R1 R2 R3 S1 S2 S3
ACC 988 999 1007 968 959 948
AMBUJACEM 142 145 148 136 133 130
AXISBANK 1490 1511 1525 1455 1441 1419
BAJAJ-AUTO 1546 1578 1601 1491 1468 1436
BHARTIARTL 334 341 347 322 316 309
BHEL 2539 2575 2602 2477 2450 2414
BPCL 718 729 740 696 685 674
CAIRN 342 347 350 334 330 326
CIPLA 337 343 348 327 321 316
DLF 378 387 393 364 358 349
DRREDDY 1642 1656 1667 1617 1606 1592
GAIL 520 531 543 498 487 476
HCLTECH 447 454 461 433 427 419
HDFC 730 740 748 713 706 696
HDFCBANK 2408 2448 2473 2344 2319 2279
HEROHONDA 1861 1885 1916 1806 1776 1752
HINDALCO 211 216 219 204 201 196
HINDUNILVR 302 306 311 293 288 284
ICICIBANK 1145 1170 1186 1104 1088 1063
IDFC 207 212 215 199 196 191
INFOSYSTCH 3077 3143 3181 2972 2935 2868
ITC 173 175 177 169 167 165
JINDALSTEL 717 726 733 700 693 684
JPASSOCIAT 130 132 134 126 124 121
KOTAKBANK 514 523 529 499 493 484
NIFTY Fifty Technical Analysis

8/8/2019 Pre Market Report 20th Oct 2010_yourstocksolutions
http://slidepdf.com/reader/full/pre-market-report-20th-oct-2010yourstocksolutions 4/5
Scrip R1 R2 R3 S1 S2 S3
LT 2027 2058 2079 1975 1955 1924
M&M 710 719 726 694 687 679
MARUTI 1513 1531 1547 1479 1463 1445
NTPC 207 210 212 203 201 198
ONGC 1370 1390 1406 1335 1319 1300
PNB 1318 1336 1347 1289 1277 1259
POWERGRID 107 109 110 104 103 102
RANBAXY 587 596 603 570 563 553
RCOM 178 181 183 173 171 168
RELCAPITAL 843 858 868 818 807 792
RELIANCE 1062 1080 1092 1033 1021 1003
RELINFRA 1087 1109 1123 1051 1037 1015
RPOWER 162 164 166 157 155 152
SAIL 224 228 230 218 215 212
SBIN 3179 3240 3277 3080 3044 2982
SESAGOA 374 390 398 351 342 327
SIEMENS 816 829 839 793 783 770
STER 179 182 184 174 172 169
SUNPHARMA 2070 2091 2115 2024 1999 1978
SUZLON 60 62 63 58 57 55
TATAMOTORS 1185 1195 1203 1167 1159 1149
TATAPOWER 1396 1417 1429 1363 1351 1330
TATASTEEL 647 661 669 625 617 603
TCS 982 996 1005 959 950 935
WIPRO 474 483 490 458 452 442

8/8/2019 Pre Market Report 20th Oct 2010_yourstocksolutions
http://slidepdf.com/reader/full/pre-market-report-20th-oct-2010yourstocksolutions 5/5
Disclaimer
This report has been prepared and issued by www.yourstocksolutions.com, which is regulated by the SEBI. The report is intended to be circulated for
general information only and should not to be construed as an offer to buy or sell or a solicitation of an offer to buy or sell any financial instruments or
to participate in any particular trading strategy in any jurisdiction.
The information and statistical data herein have been obtained from sources we believe to be reliable but no representation or warranty, expressed or
implied, is made that such information and data is accurate or complete, and therefore should not be relied upon as such.
Opinions, estimates and projections in this report constitute the current judgment of the author as of the date of this report. They do not necessarily
reflect the opinion of www.yourstocksolutions.com and are subject to change without notice. This report does not have regard to the specific
investment objectives, financial situation and the particular needs of any specific person who may receive this report. Investors are urged to seek
financial advice regarding the appropriateness of investing in any securities or investment strategies discussed or recommended in this report and to
understand that statements regarding future prospects may not be realized. Investors should note that income from such securities, if any, may
fluctuate and that each security’s price or value may rise or fall. Investors should be able and willing to accept a total or partial loss of their investment.
Accordingly, investors may receive back less than originally invested. Past performance is historical and is not necessarily indicative of future
performance.
This report may provide the addresses of, or contain hyperlinks to, websites. Except to the extent to which the report refers to website material of
www.yourstocksolutions.com, www.yourstocksolutions.com has not reviewed the l inked site and takes no responsibi lity for the content contained
therein. Such address or hyperlink (including addresses or hyperlinks to our own website material) is provided solely for your convenience and
information and the content of the linked site does not in any way form part of this document. Accessing such website or following such link throughthis report shall be at your own risk


