
PERFORMANCE TUNING
WITH WAIT STATISTICSMicrosoft Corporation
Presented by Joe Sack, Dedicated Support Engineer
Quick bio and presentation logistics…
DSE in the Premier Field Engineer team, Microsoft
• DSE (Dedicated Support Engineer) – responsible for product support (in my case, SQL engine) for enterprise customers (who generally purchase support in 400 hour increments up to 1600 for a FTE)
• 3 years with Microsoft, and have had a 12 year LTR with SQL Server
Work locally in Minneapolis (although most of my team is in Texas)
• Majority DSEs work remotely and visit customers throughout year
• Some are local (like me) and get embedded with a customer
Q&A at end of presentation
• Didn‟t get to ask your question? Email: [email protected]
• I will post this deck to my blog @ http://blogs.msdn.com/joesack

Agenda
What are wait statistics? (2005/2008 perspective)
What to collect? How to collect?
Where to look for wait type info, what to ignore, and what to pay attention to…
Top 10 Patterns from the field (from my experience)
* And before we start a quick – why am I presenting this?

“Must have” references…
Tom Davidson (Microsoft) and the Microsoft SQL Customer Advisory Team wrote articles and white papers on this subject for
both SQL Server 2000 and 2005:
Microsoft White Paper “SQL Server 2005 Waits and Queues”
Microsoft White Paper “Troubleshooting Performance Problems in SQL Server 2005” (2008 version released this week)
Books Online
http://support.microsoft.com/

Usage Scenarios
Troubleshoot a vague
performance issue reported by an end-user
Urgent performance
issue!
Problem child application. So many problems,
but which to choose?
Where am I now
(benchmark)?
Where am I going?
(trending)
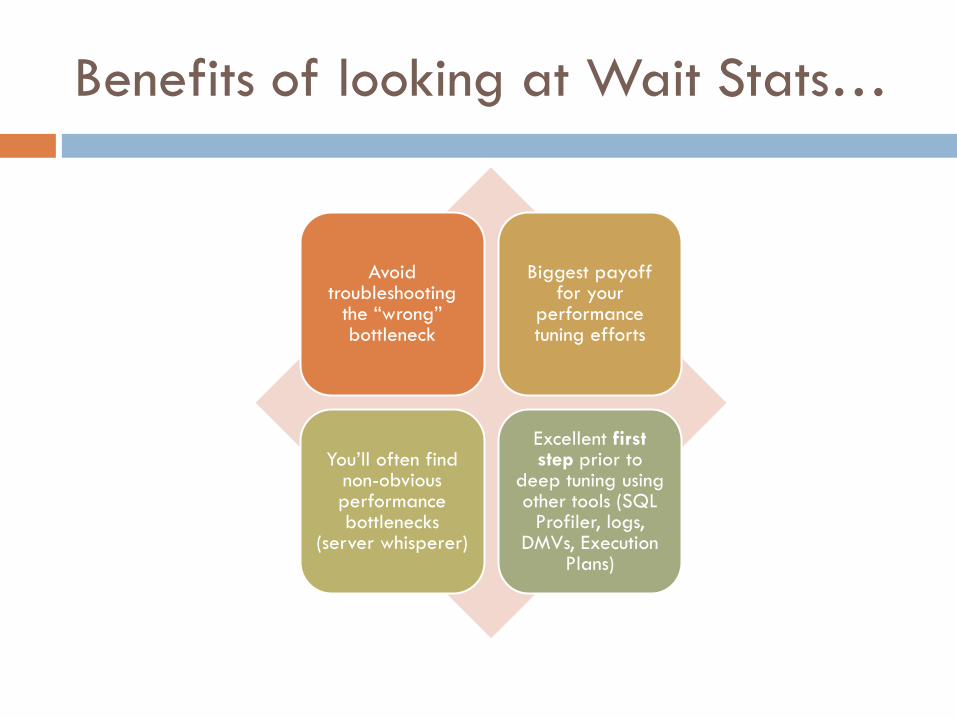
Benefits of looking at Wait Stats…
Avoid troubleshooting
the “wrong” bottleneck
Biggest payoff for your
performance tuning efforts
You‟ll often find non-obvious performance bottlenecks
(server whisperer)
Excellent first step prior to
deep tuning using other tools (SQL
Profiler, logs, DMVs, Execution
Plans)

What are SQL Server Waits?

Wait Statistics in a nutshell
SQL Server was designed to track wait information
whenever a query request waits on a resource.
When a query encounters “some thing” that is not
available, SQL Server sets the wait type for that
wait reason. This data is retained, and we can use it
to understand why things are slower than we expect.

Execution Model – One Scheduler
(logical CPU)
RUNNABLE Queue
(Customers waiting in checkout line)RUNNING
One Cashier
at a grocery
store = One
Scheduler

Execution Model – One Scheduler
RUNNABLE Queue
(Customers waiting in checkout line)RUNNING
I‟ll need to send
someone out for
a price check.
In the meantime,
step aside…
The price tag
fell off my
product.

“Waiting Queue” (SUSPENDED)
RUNNING
Execution Model – One Scheduler
RUNNABLE Queue
(Customers waiting in checkout line)
I wait here until
resource is
available

“Waiting Queue” (SUSPENDED)
“Running”
Execution Model – One Scheduler
“Runnable” Queue
(Customers waiting in checkout line)
When I‟m done
waiting, I go to the
end of the
runnable line
(signal wait time)

“Waiting Queue” (SUSPENDED)
“Running”
Execution Model – One Scheduler
“Runnable” Queue
(Customers waiting in checkout line)

Got sixteen CPUs? It gets a little more
active…

Simplified Query Lifecycle…
Circular –RUNNING,
RUNNABLE, and SUSPENDED
until the request is completed
RUNNING
SUSPENDEDRUNNABLE

Total Query Response Time – breaking
it down…
CPU Time (running)
Wait Time (SUSPENDED)
Signal Wait Time
(Runnable Queue time)
Total Query Response
Time

Why Waits and Queues?
Queues refers to PERFMON counters and other resource usage information
Provides a full picture for application performance
• This presentation focuses on Waits
• Why? Because most DBAs use Perfmon, but not everyone looks at wait stats (although the word seems to be getting out)…

How to collect? What to collect?
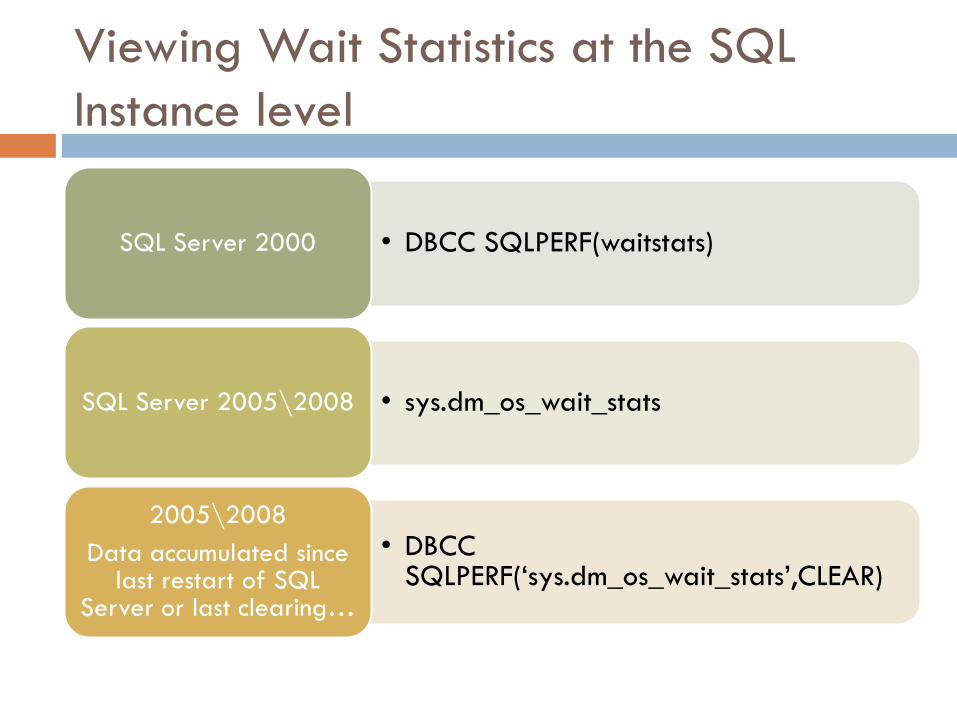
Viewing Wait Statistics at the SQL
Instance level
• DBCC SQLPERF(waitstats)SQL Server 2000
• sys.dm_os_wait_statsSQL Server 2005\2008
• DBCC SQLPERF(„sys.dm_os_wait_stats‟,CLEAR)
2005\2008
Data accumulated since last restart of SQL
Server or last clearing…

sys.dm_os_wait_stats exposed data
This is your
primary DMV
for collecting
wait stats
information.
There are
various
collection
procs you can
use from the
Microsoft
White paper
as well…
wait_type – the name of the wait type
waiting_tasks_count – number of waits on this wait type
wait_time_ms – total wait time for this wait type in milliseconds (includes signal_wait_time).
max_wait_time_ms – maximum wait time on this wait type for a worker
signal_wait_time – difference between time the waiting thread was signaled and when it started running (time in runnable queue!)
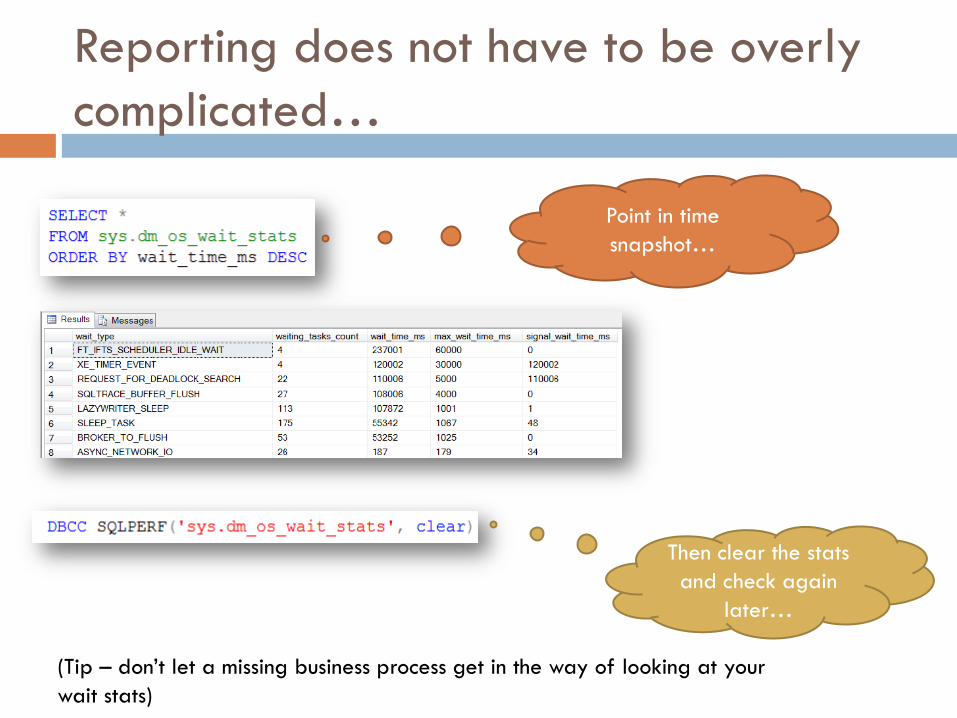
Reporting does not have to be overly
complicated…
(Tip – don‟t let a missing business process get in the way of looking at your
wait stats)
Point in time
snapshot…
Then clear the stats
and check again
later…

Keeping it simple - Get a delta

Other T-SQL based Methods
From W&Q White Paper
• Track_waitstats_2005
• stored procedure that captures wait statistics from sys.dm_os_wait_stats and provides ranking of descending order based on percentage.
• Allows number of samplings every X number of minutes
Home grown – you can filter out wait types that are ignorable – for example, filtering out background operations (more on this later)
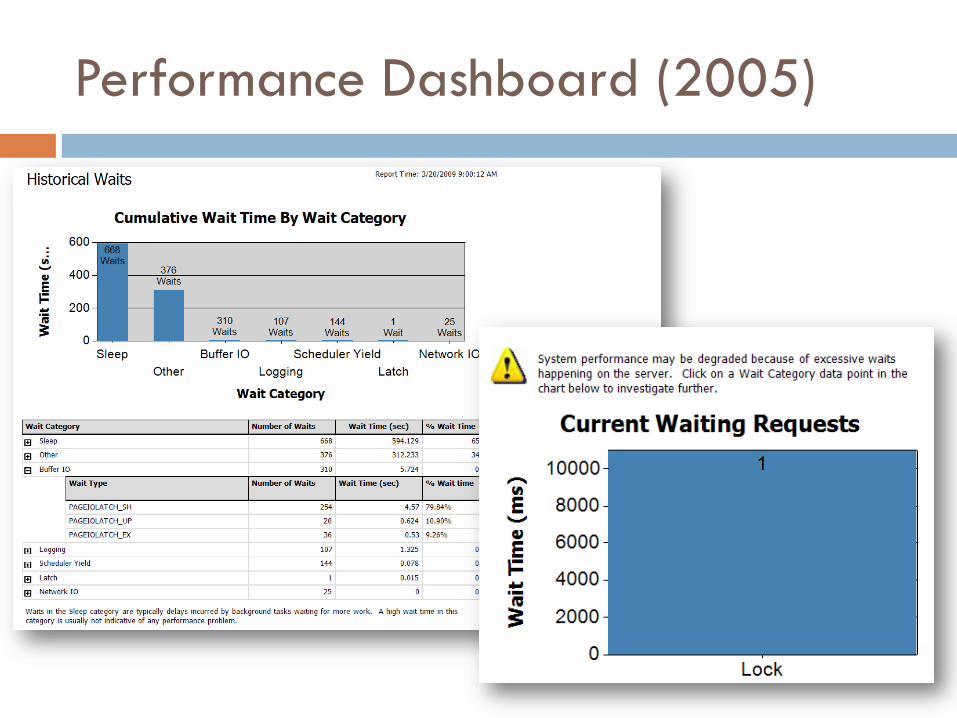
Performance Dashboard (2005)

Management Data Warehouse and
Data Collector (2008)
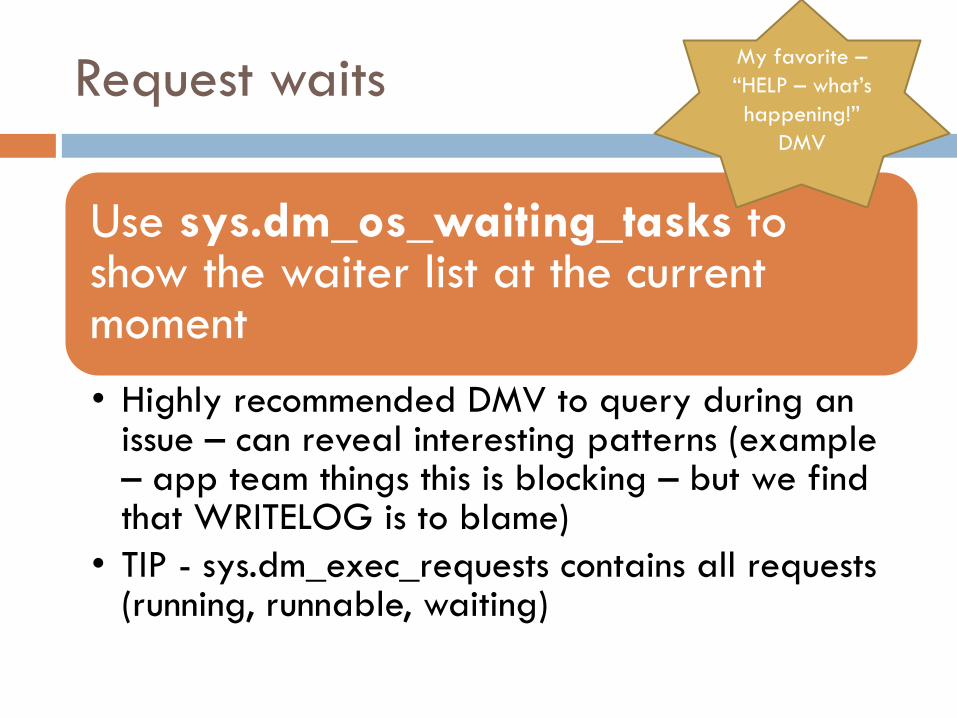
Request waits
Use sys.dm_os_waiting_tasks to show the waiter list at the current moment
• Highly recommended DMV to query during an issue – can reveal interesting patterns (example – app team things this is blocking – but we find that WRITELOG is to blame)
• TIP - sys.dm_exec_requests contains all requests (running, runnable, waiting)
My favorite –
“HELP – what‟s
happening!”
DMV
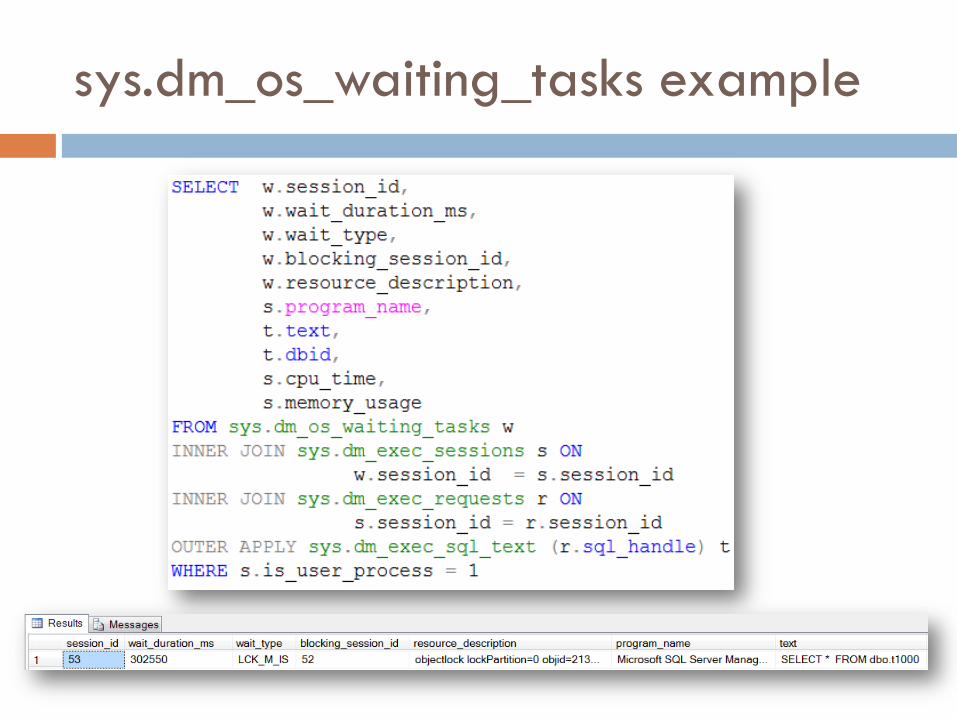
sys.dm_os_waiting_tasks example
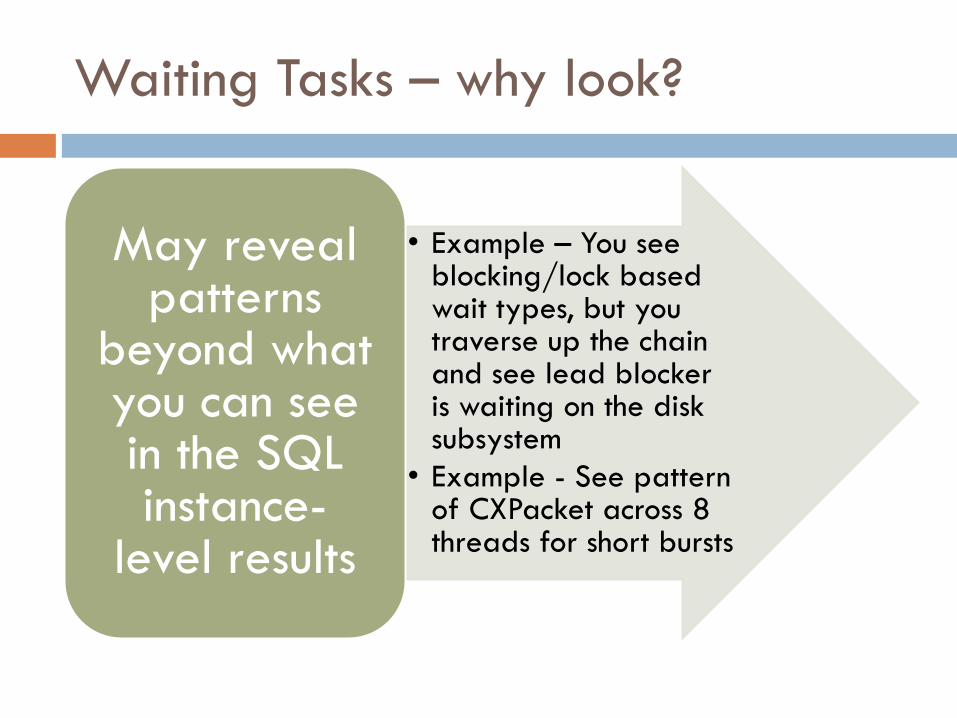
Waiting Tasks – why look?
• Example – You see blocking/lock based wait types, but you traverse up the chain and see lead blocker is waiting on the disk subsystem
• Example - See pattern of CXPacket across 8 threads for short bursts
May reveal patterns
beyond what you can see in the SQL instance-
level results

Extended Events – XEvent (2008)
Event-handling system added to SQL Server 2008 for light-weight, low overhead tracing
Help Customer Support by reducing tracing overhead, improving debugging capabilities – all without relying on stack dump or attached debugger
Many use cases – but I talk about it here because it enables the ability to track accumulated wait stats across the lifetime of a request..
* Demonstrated on page 71 of the new “Troubleshooting Performance Problems in SQL
Server 2008” White Paper

Flashback…
Circular –RUNNING,
RUNNABLE, and SUSPENDED
until the request is completed
RUNNING
SUSPENDEDRUNNABLE

* Excerpt from Troubleshooting Performance Problems in
SQL Server 2008
Setting up
Extended Event
session
* See Chapter 2 in Kalen Delaney‟s new book “Microsoft SQL Server 2008 Internals” for an
excellent walk-through of Extended Events.

* Excerpt from Troubleshooting Performance Problems in
SQL Server 2008
SPID 53
SPID 53 wait type
capture for query
Query captured
event data

“Never memorize what you can look up in books.”
Albert Einstein
How to interpret?

Interpret Wait Type Definitions
Tom Davidson White Papers
Check Books online topic sys.dm_os_wait_stats
Support.microsoft.com
Blogs (with caution)
Newsgroups (with even more caution)

Wait Types
Wait Types
Resource Waits
• Locks, latches, network, I/O
Queue Waits
• Idle worker, background tasks
External Waits
• Extended sproc, linked server query

Interpreting Wait Types
Not all wait types indicate issues or are actionable (queue waits – background tasks)
• I/O (slow response times)
• CPU
• Some trickiness here – so I‟ll discuss this more in a bit
• Memory
• Locking (contention by queries)
• Network
Concentrate on resource or external wait times or wait counts, which can point to bottlenecks or hot spots
In my line of
work – 99.999%
of my attention is
on resource
waits…

Nuances of CPU bottlenecks
• CXPACKET? Yes – could be a parallelism issue
• SOS_SCHEDULER_YIELD? Yes – workers having to frequently yield to other workers may suggest CPU pressure
Waits don‟t always reveal CPU bottlenecks directly
• High signal wait time? May need faster or more CPUs
When a wait type is not waiting or runnable, it is running (and that‟s good)

SQL Server 2008 Added Preemptive
Wait Types
Non-preemptive (cooperative) scheduling
• SQL Server manages CPU scheduling for most activity (instead of the OS)
• SQL decides when a thread should wait, or get switched out
• SQL developers also sprinkle code with voluntary yields – to avoid starvation of other threads
Preemptive scheduling
• Preemption is act of an OS temporarily interrupting an executing task, involuntarily
• Higher priority tasks can preempt lower priority tasks
• When this happens - can be expensive
• Preemptive mode used in SQL Server for external code calls, CLR with an UNSAFE assemblies, APIs that could block for extended periods (example – extended stored procedures)
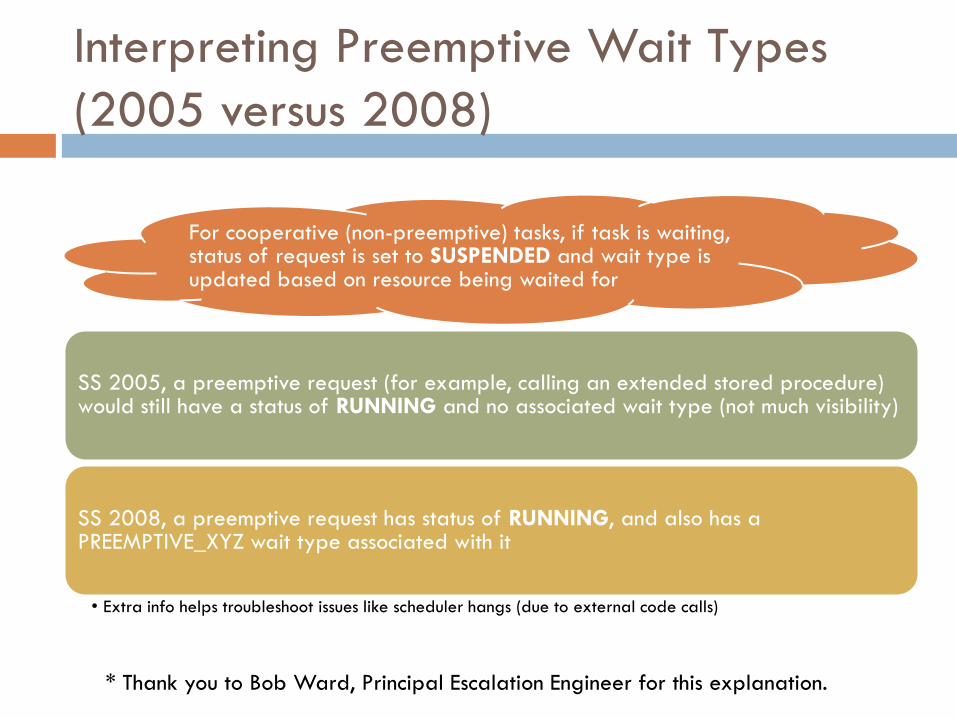
Interpreting Preemptive Wait Types
(2005 versus 2008)
For cooperative (non-preemptive) tasks, if task is waiting, status of request is set to SUSPENDED and wait type is updated based on resource being waited for
SS 2005, a preemptive request (for example, calling an extended stored procedure) would still have a status of RUNNING and no associated wait type (not much visibility)
SS 2008, a preemptive request has status of RUNNING, and also has a PREEMPTIVE_XYZ wait type associated with it
• Extra info helps troubleshoot issues like scheduler hangs (due to external code calls)
* Thank you to Bob Ward, Principal Escalation Engineer for this explanation.

Interpreting Preemptive Wait Types
BOL has some
interpretations
Some may be named
intuitively
Some are
undocumented…

Preemptive wait type example
Preemptive Wait Type Format:
• PREEMPTIVE_<category>_<function or class name>
API function or call can often be found on MSDN
Example:
• PREEMPTIVE_OS_LOOKUPACCOUNTSID
• MSDN explanation of this function “retrieves the name of the account for this SID and the name of the first domain on which this SID is found”
* Thank you to Keith Elmore, Principal Escalation Engineer for this tip!
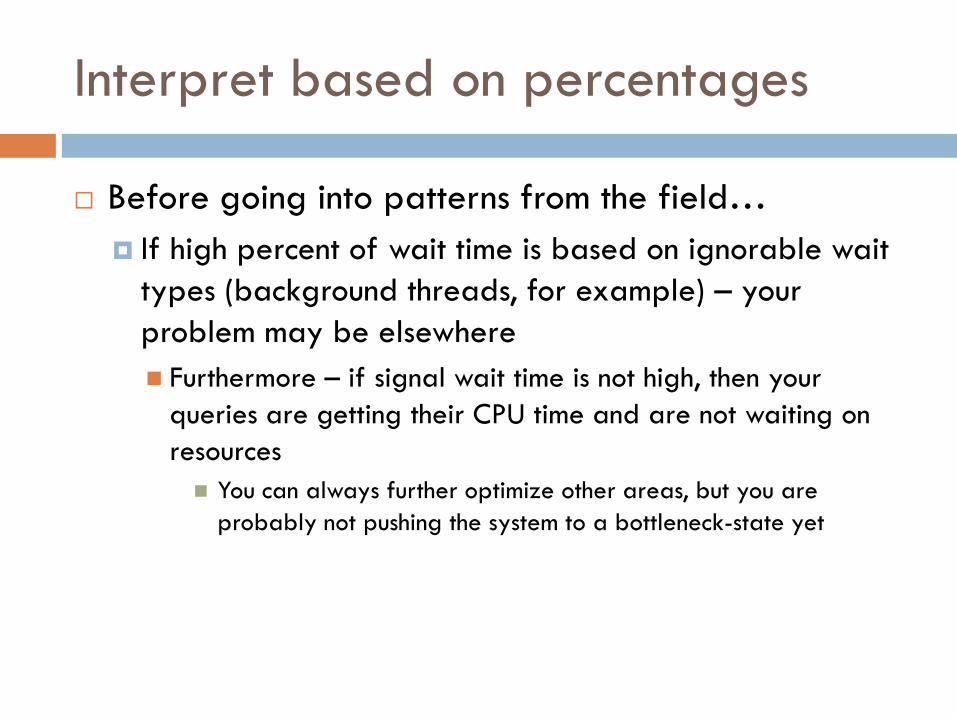
Interpret based on percentages
Before going into patterns from the field…
If high percent of wait time is based on ignorable wait
types (background threads, for example) – your
problem may be elsewhere
Furthermore – if signal wait time is not high, then your
queries are getting their CPU time and are not waiting on
resources
You can always further optimize other areas, but you are
probably not pushing the system to a bottleneck-state yet

Patterns from the field

Parallelism
• CXPACKETWait Type
• Parallel query thread may process a larger number of rows while another thread may process a smaller number of rowsInterpretation
• In OLTP (online transaction processing) system, excessive CXPACKET waits can affect the overall throughputWhy worry?
• For parallelism, TEST disabling „max degree of parallelism‟ or using MAXDOP hint. Caution about maintenance tasks that use parallelism! (DBCC CHECKDB, index rebuilds)
Next steps?

CPU Pressure
• SOS_SCHEDULER_YIELDWait Type
• Represents a SQLOS worker (thread) that has voluntarily yielded the CPU to another worker (SQL aims to prevent starvation)
Interpretation
• Is this one of the higher wait types? > 80% of total wait time? May indicate CPU pressure (competing concurrent requests)
Why worry?
• Cross validate perfmon counters. Check sys.dm_exec_query_stats by worker time; recompiles/compiles; scale-up or scale-out
Next steps?

Network I/O
• ASYNC_NETWORK_IO Wait Type
• SQL Server is waiting for the client to fetch the data before it can send any moreInterpretation
• Network issue between the client/application and the SQL Server instance OR your client may be pulling rows inefficiently
Why worry?
• Check network path and components. Network throughput. Client methods for processing all rows. Large result sets with small chunks?
Next steps?

Long term Blocking
• LCK_X (many examples – based on lock type –LCK_M_U (waiting to acquire an Update lock), LCK_M_X (waiting to acquire an Exclusive lock)
Wait Type
• Wait type when task is waiting on a locked resourceInterpretation
• Long term blocking may be unacceptable to your applicationWhy worry?
• Check transaction duration. Isolation levels (for example – COM using SERIALIZABLE as default). Check perfmon for I/O and memory issues too!
Next steps?

Quick aside - Latches
Latches are light weight synchronization objects
Latches protect the physical integrity of memory structures such as:
• Database pages (Buffer)
• Non-I/O related memory structures
Latches can‟t be explicitly controlled like locks, but excessive latch waits can cause performance issues are typically tied to contention or resource issues (think SMOKE not FIRE)
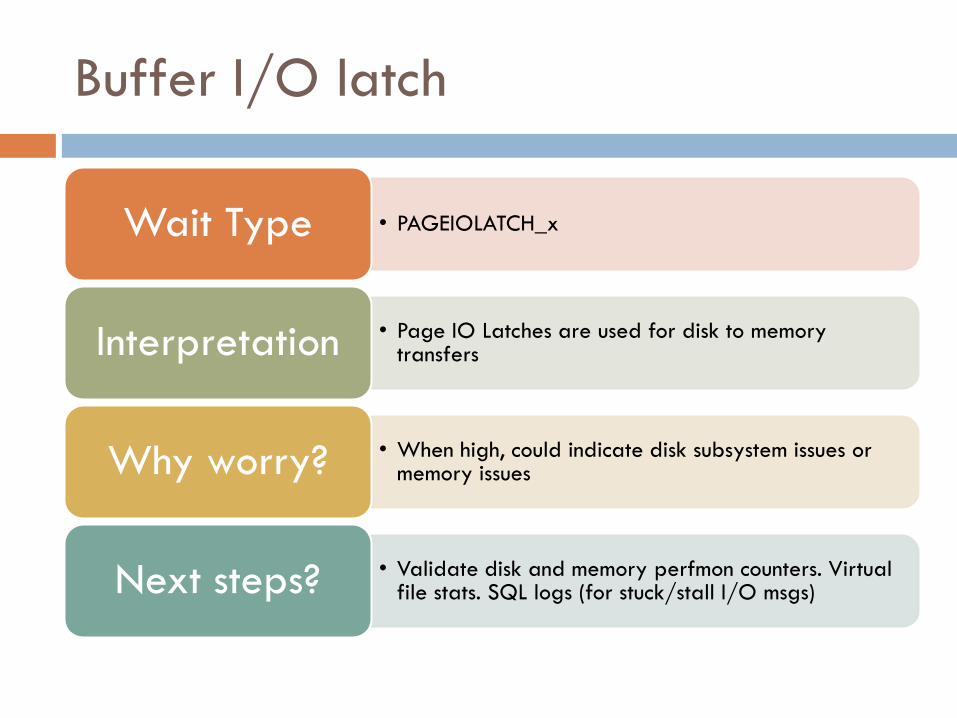
Buffer I/O latch
• PAGEIOLATCH_xWait Type
• Page IO Latches are used for disk to memory transfersInterpretation
• When high, could indicate disk subsystem issues or memory issuesWhy worry?
• Validate disk and memory perfmon counters. Virtual file stats. SQL logs (for stuck/stall I/O msgs)Next steps?

Buffer Latch
• PAGELATCH_xWait Type
• Latches waiting to access a “Hot” page in memory. Often associated with Tempdb page contention or Clustered Index on Ascending/Descending Key
Interpretation
• May impact performance and represents contention that could likely be resolved. Heavy concurrent inserts into same index range can cause this kind of contention.
Why worry?
• Check if Tempdb allocation page latch contention is the issue (occurs with workloads that create and destroy temp objects) – KB 328551 related to Trace Flag 1118.
Next steps?

Non-buffer Latch
• LATCH_XWait Type
• Not I/O buffer related - often seen for internal caches (not the buffer pool pages). Example – LATCH_EX appearing when people use SQL Profiler on remote computer for busy SQL instance.
Interpretation
• Could be an indication of memory pressureWhy worry?
• Validate perfmon memory counters. sys.dm_os_latch_stats DMV to examine details of non-buffer related latches. Likely a downstream side-effect of other performance issues (log related waits or PAGELATCH)
Next steps?

Memory Grants
• RESOURCE_SEMAPHOREWait Type
• Query memory request cannot be granted immediately because of other concurrent queries (query gateways). Seen with queries that contain a sort or hash operator.
Interpretation
• Indicates memory pressure. Excessive number of concurrent queries or excessive memory request amount. Why worry?
• Confirm with perfmon counter counters Memory Grants Pending and Memory Grants Outstanding. Tune queries or determine if memory scale-up needed.
Next steps?

Tran log disk subsystem
• WRITELOG
• LOGBUFFERWait Type(s)
• LOGBUFFER - task is waiting for space in the log buffer to store a log record. WRITELOG – task is waiting for a log flush to finish (log flush due to checkpoint or tran commit).
Interpretation
• I/O path or disk subsystem hosting transaction log(s) are encountering performance issues.Why worry?
• Collocation issues? Validate perfmon and start evaluating disk related counters. Check SQL log for I/O stalls. Check Windows event logs for disk subsystem errors. Check virtual file stats DMV for I/O stall information.
Next steps?

General I/O issues
• ASYNC_IO_COMPLETION and IO_COMPLETIONWait Type(s)
• Tasks are waiting for I/Os to finish. Interpretation
• Disk subsystem is likely a bottleneck (not performing to expectations or reaching capacity for given workload)Why worry?
• Collocation issues? Perfmon (Memory AND I/O). SQL Log for I/O stalls. Event logs. Virtual File stats. Query stats. Indexing. I/O path investigation, SAN, disk alignment, HBA queue depth
Next steps?

Final Takeaways…
When beginning a new performance tuning venture, use wait statistics in your first wave of tools (don‟t rely too heavily on gut instincts)
White papers give examples of data collection procedures and give good prescriptive guidance. Also consider using 2008‟s Data Collector functionality or for 2005 the performance dashboard reports
Once you have a direction - drill-down with dynamic management views, logs, SQL Profiler, execution plans, and other tools to troubleshoot

“Anyone who knows all the answers most likely
misunderstood the questions.”
Anonymous
Questions?


