
Investor Overview
April 2018
Information included in this presentation may contain statements, including earnings projections, that are
forward-looking in nature and, accordingly, are subject to risks and uncertainties regarding Snap-on’s
expected results. Statements made that (i) are in the future tense; (ii) include the words “expects,”
“anticipates,” “intends,” “approximates,” “plans,” “targets,” “estimates,” “believes,” or similar words that
reference Snap-on or its management; (iii) are specifically identified as forward-looking; or (iv) describe
Snap-on’s or management’s future outlook, plans, estimates, objectives or goals, are forward-looking
statements within the meaning of the Private Securities Litigation Reform Act of 1995. The company’s
actual results may differ materially from those described or contemplated in the forward-looking
statements. Factors that may cause the company’s actual results to differ materially from those
contained in the forward-looking statements include those found in the company’s reports filed with the
Securities and Exchange Commission, including the information under the “Safe Harbor” and “Risk
Factors” headings in its Annual Report on Form 10-K for the fiscal year ended December 30, 2017 and
under “Management’s Discussion and Analysis of Financial Condition and Results of Operations –
Caution Regarding Forward-Looking Statements” in its fiscal 2018 first quarter report on Form
10-Q, which are incorporated herein by reference. Snap-on disclaims any responsibility to update any
forward-looking statement provided during this presentation, except as required by law.
This presentation includes certain non-GAAP measures of financial performance, which are not meant to
be considered in isolation or as a substitute for their GAAP counterparts. Additional information
regarding these non-GAAP measures is included in Snap-on’s Form 10-K and earnings press releases
available at snapon.com. See appendix for reconciliation of non-GAAP measures to GAAP counterparts.2
CAUTIONARY STATEMENT

3
SNAP-ON OVERVIEW
• Founded on innovation in 1920
• Makes work easier for serious
professionals performing
critical tasks
• Unique brand strength
• 12,600 associates worldwide
• Serves professionals in over
130 countries
• 2017 net sales: $3.7 billion
• NYSE: SNA / S&P 500
• $8.3B Market Cap
• 2.2% Cash Dividend Yield
– Dividends paid without
interruption or reduction
since 1939
4
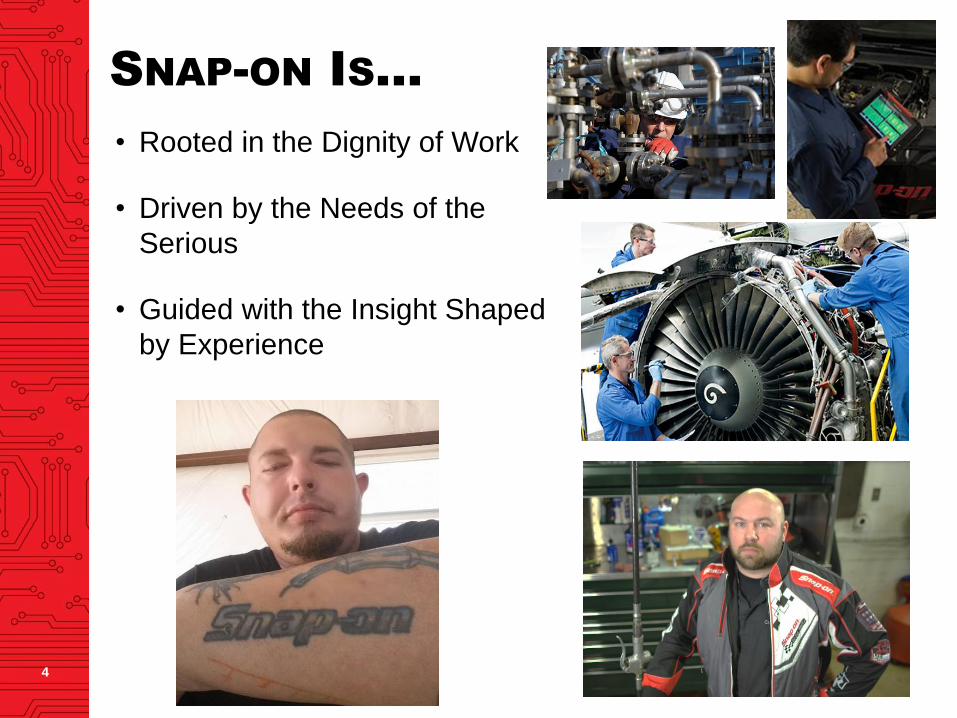
SNAP-ON IS...
• Rooted in the Dignity of Work
• Driven by the Needs of the
Serious
• Guided with the Insight Shaped
by Experience

UNIQUE PRODUCTIVITY SOLUTIONS
5

UNIQUE BRAND STRENGTH
6
7
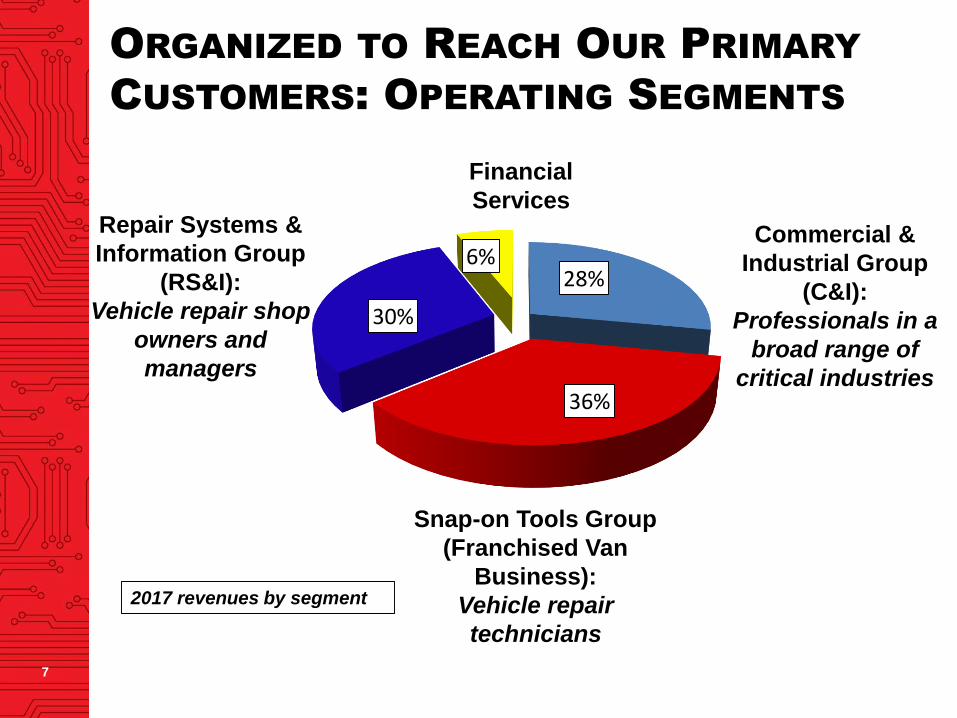
ORGANIZED TO REACH OUR PRIMARY
CUSTOMERS: OPERATING SEGMENTS
Snap-on Tools Group
(Franchised Van
Business):
Vehicle repair
technicians
Repair Systems &
Information Group
(RS&I):
Vehicle repair shop
owners and
managers
Commercial &
Industrial Group
(C&I):
Professionals in a
broad range of
critical industries
2017 revenues by segment
Financial
Services
28%
36%
30%
6%

4
5
6
7
8
9
10
11
12
13
14
19
80
19
81
19
82
19
83
19
84
19
85
19
86
19
87
19
88
19
89
19
90
19
91
19
92
19
93
19
94
19
95
19
96
19
97
19
98
19
99
20
00
20
01
20
02
20
03
20
04
20
05
20
06
200
7
200
8
200
9
20
10
20
11
20
12
20
13
20
14
20
15
20
16
20
17
Average Vehicle Age - 1980-2017
8
U.S. VEHICLE AGING
DRIVES SERVICE GROWTH
Age
in
Years
201711.7 years
Source: HIS Markit 2017
Age of U.S. Vehicles

9
VEHICLE TECHNOLOGY & COMPLEXITY
PROVIDES OPPORTUNITY
• Increasing vehicle complexity
• Testing and re-programming
requirements expanding
• Repair information growing
• Vehicle repairs increasingly
require use of diagnostics
• Productive shop management
rising in importance
• Emerging vehicle
technologies create new
solution needs

Runways for
Growth
The Way Forward:
Runways for
Improvement
10

Cell DesignSafety
Quality
Customer Connection
Innovation
Rapid Continuous Improvement
11
RUNWAYS FOR IMPROVEMENT:
SNAP-ON VALUE CREATION

2017
77 Locations
with
No Lost Time
Incidents
Safety Incident Rate
92% Reduction
Associates are 92% less likely to experience a
safety incident today than in 200412
SNAP-ON VALUE CREATION:
SAFETY
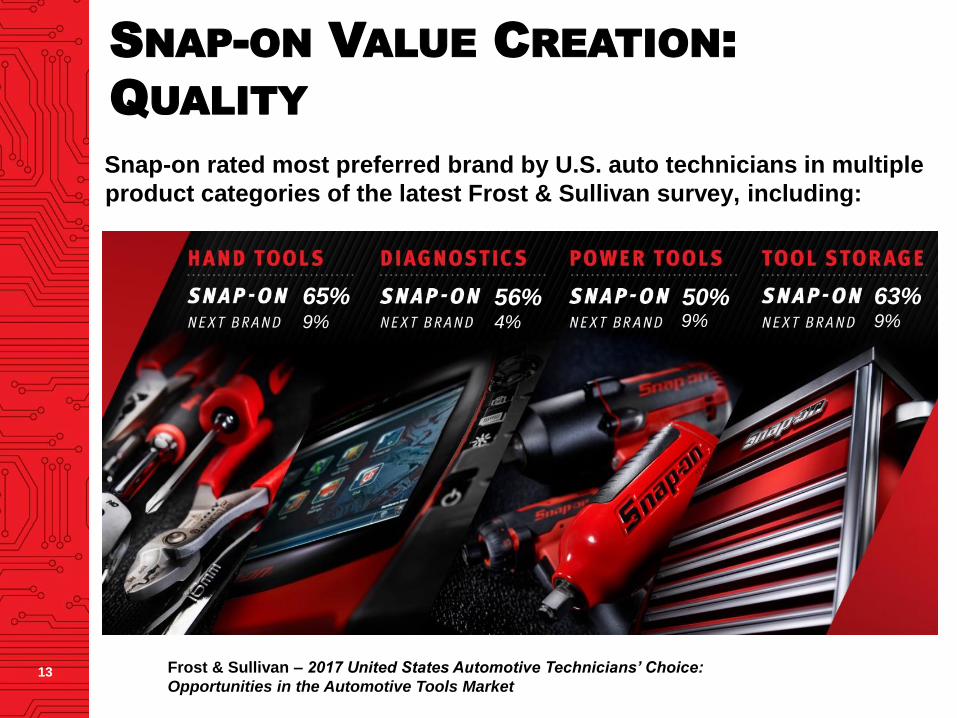
Frost & Sullivan – 2017 United States Automotive Technicians’ Choice:
Opportunities in the Automotive Tools Market
Snap-on rated most preferred brand by U.S. auto technicians in multiple
product categories of the latest Frost & Sullivan survey, including:
65% 63%50%56%9% 4% 9% 9%
13
SNAP-ON VALUE CREATION:
QUALITY
14
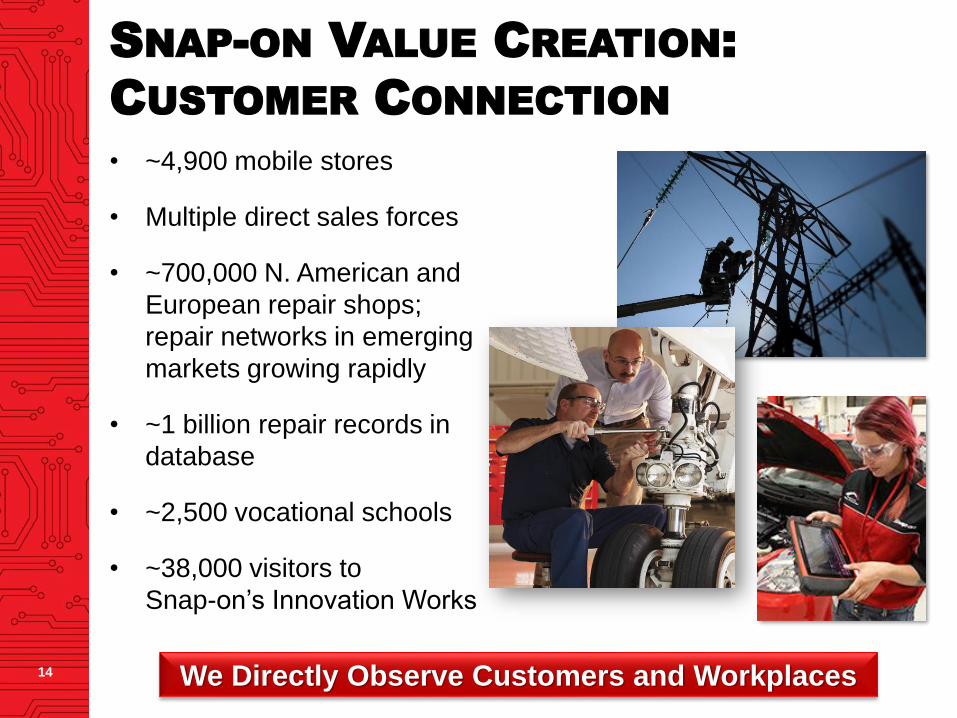
SNAP-ON VALUE CREATION:
CUSTOMER CONNECTION
• ~4,900 mobile stores
• Multiple direct sales forces
• ~700,000 N. American and
European repair shops;
repair networks in emerging
markets growing rapidly
• ~1 billion repair records in
database
• ~2,500 vocational schools
• ~38,000 visitors to
Snap-on’s Innovation Works
We Directly Observe Customers and Workplaces

We Translate Insights Into Innovation15
SNAP-ON VALUE CREATION: INNOVATION
NEW PRODUCT AWARDS AND SUCCESSES
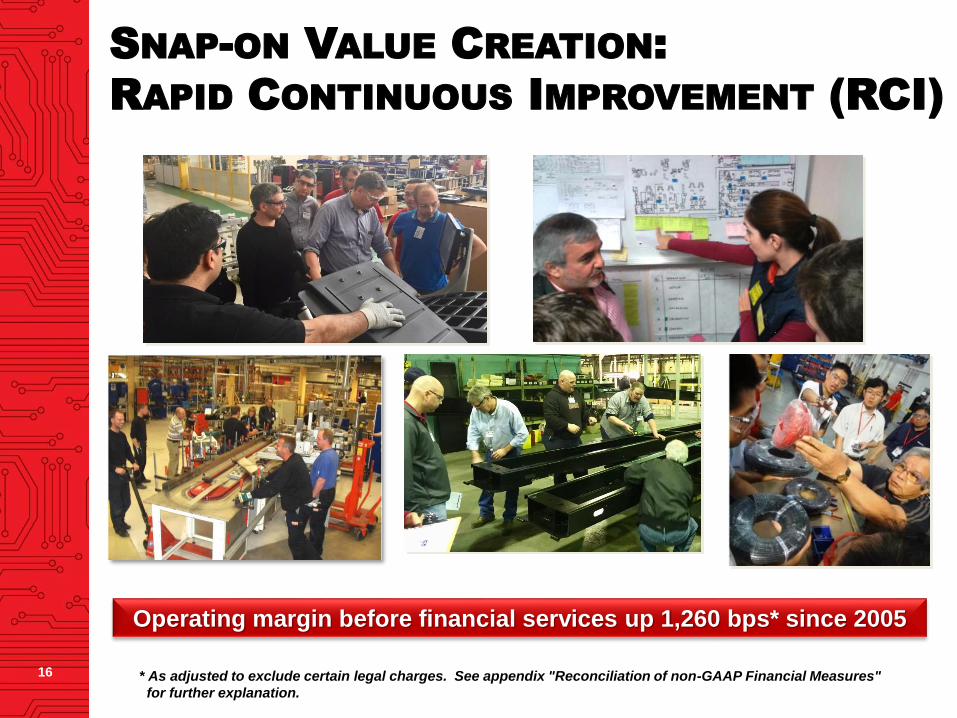
Operating margin before financial services up 1,260 bps* since 2005
16
SNAP-ON VALUE CREATION:
RAPID CONTINUOUS IMPROVEMENT (RCI)
* As adjusted to exclude certain legal charges. See appendix "Reconciliation of non-GAAP Financial Measures"
for further explanation.
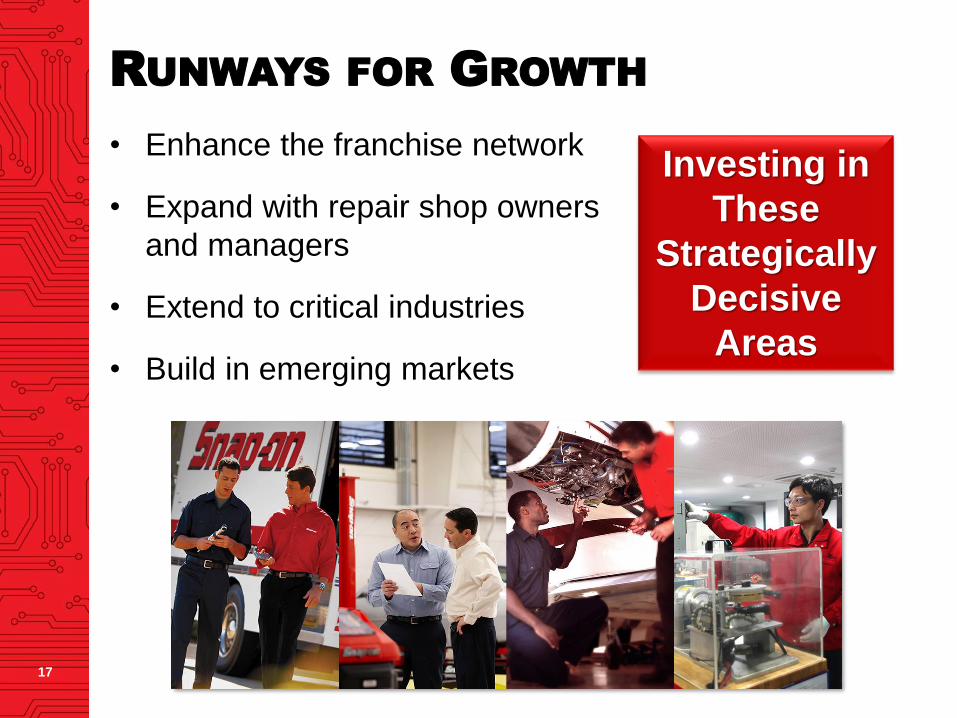
Investing in
These
Strategically
Decisive
Areas
17
RUNWAYS FOR GROWTH
• Enhance the franchise network
• Expand with repair shop owners
and managers
• Extend to critical industries
• Build in emerging markets

Selling Great Tools Through Vans
to Vehicle Technicians18
SNAP-ON HERITAGE

Makes work easier for serious professionals
performing critical tasks in workplaces of consequence
where the costs and penalties of failure are high
19
SNAP-ON MORE BROADLY DEFINED
20
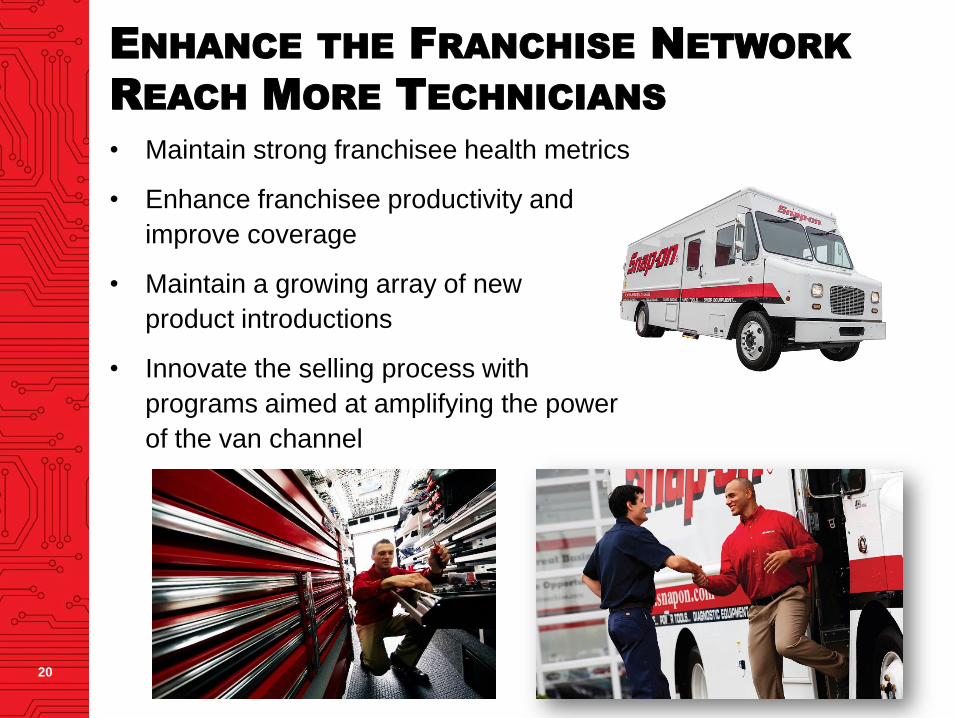
ENHANCE THE FRANCHISE NETWORK
REACH MORE TECHNICIANS
• Maintain strong franchisee health metrics
• Enhance franchisee productivity and
improve coverage
• Maintain a growing array of new
product introductions
• Innovate the selling process with
programs aimed at amplifying the power
of the van channel

21
EXPAND WITH REPAIR SHOP
OWNERS AND MANAGERS
• Leverage deep understanding of customers
in parts and service operations
• Help shop owners and managers improve
both technical competency and business
acumen
• Grow and integrate broad capabilities
• Innovate and add new products for this
important customer group

22
EXTEND TO CRITICAL INDUSTRIES
• Serve more
places where
tasks require
repeatability
and reliability
• Build a deep
understanding
of the work
performed
• Provide
specialized
productivity
solutions for
critical tasks
23
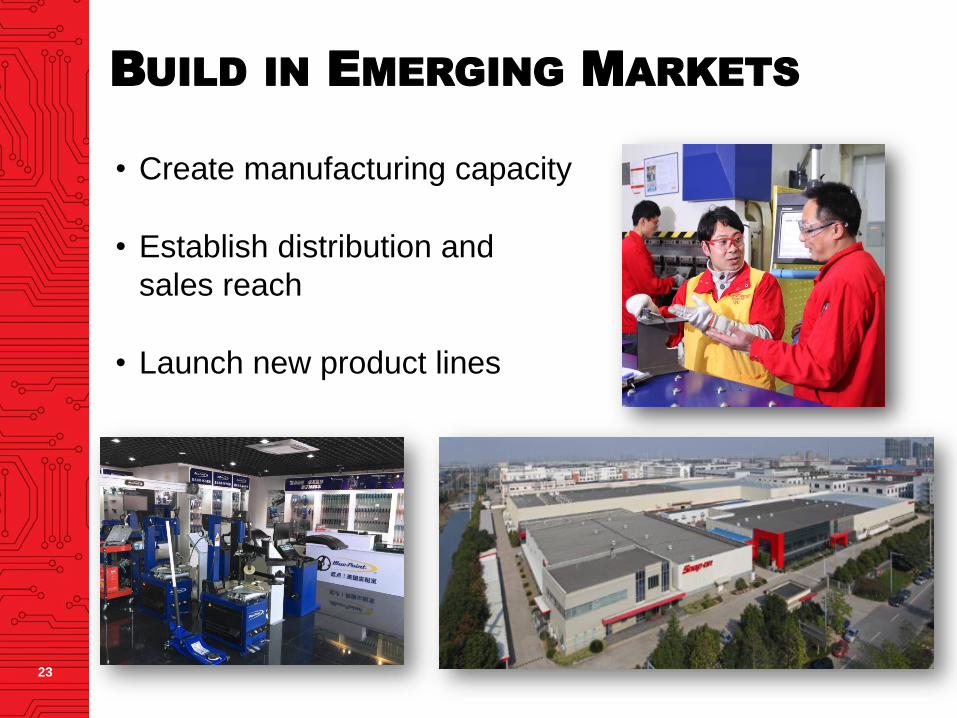
BUILD IN EMERGING MARKETS
• Create manufacturing capacity
• Establish distribution and
sales reach
• Launch new product lines

$2.85$2.94
$3.06$3.28 $3.35
$3.43$3.69
14.5%15.2%
15.8%16.6%
18.1%19.3% 18.0%
5%
10%
15%
20%
0.00
1.00
2.00
3.00
4.00
2011 2012 2013 2014 2015 2016 2017
$ Billions
Net Sales Operating Margin Before Financial Services (as % of net sales)
*As adjusted to exclude certain legal charges. See appendix "Reconciliation of non-GAAP Financial Measures" for
further explanation.
Historical data reflects the 2018 adoption of ASU No. 2017-07, Compensation - Retirement Benefits (Topic 715).
19.3%*
NET SALES AND OI MARGIN TREND
24

$4.71$5.20
$5.93
$7.14
$8.10
$9.20$9.52
0.00
3.00
6.00
9.00
12.00
2011 2012 2013 2014 2015 2016 2017
Diluted Earnings Per Share Adjusted Diluted Earnings Per Share
DILUTED EARNINGS PER SHARE
* As adjusted to exclude certain legal and tax charges. See appendix "Reconciliation of non-GAAP Financial Measures"
for further explanation.
$10.12*
25
26
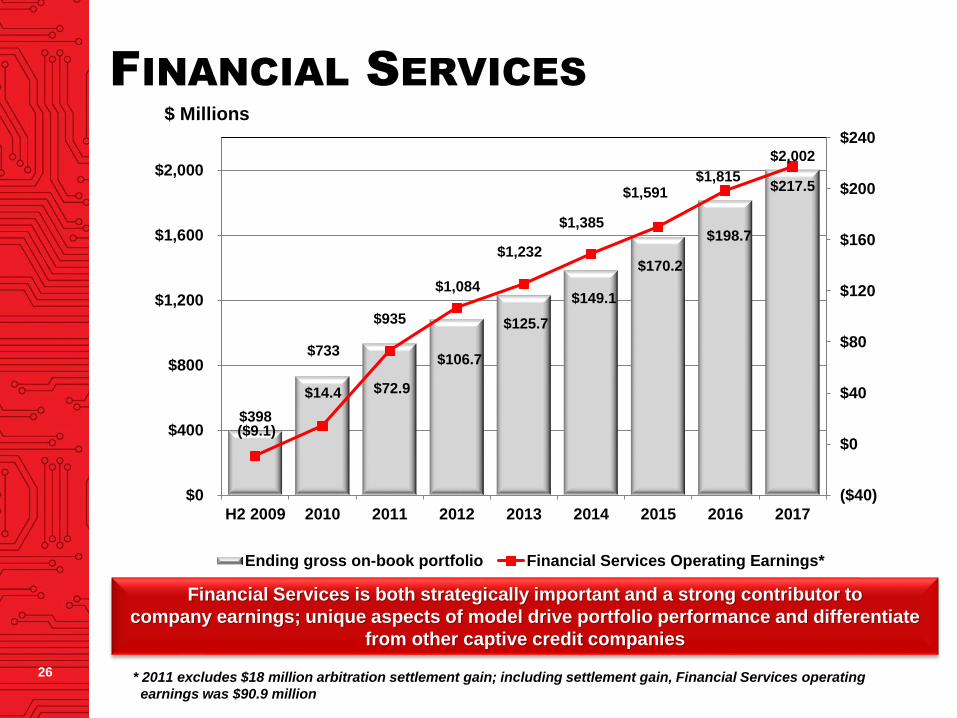
FINANCIAL SERVICES
$398
$733
$935
$1,084
$1,232
$1,385
$1,591 $1,815
$2,002
($9.1)
$14.4 $72.9
$106.7
$125.7
$149.1
$170.2
$198.7
$217.5
($40)
$0
$40
$80
$120
$160
$200
$240
$0
$400
$800
$1,200
$1,600
$2,000
H2 2009 2010 2011 2012 2013 2014 2015 2016 2017
$ Millions
Ending gross on-book portfolio Financial Services Operating Earnings*
* 2011 excludes $18 million arbitration settlement gain; including settlement gain, Financial Services operating
earnings was $90.9 million
Financial Services is both strategically important and a strong contributor to
company earnings; unique aspects of model drive portfolio performance and differentiate
from other captive credit companies

15.5% Quarterly dividend increase November 2017;
Dividends paid without interruption or reduction since 193927
INCREASED DIVIDENDS
$1.22 $1.30
$1.40 $1.58
$1.85
$2.20
$2.54
$2.95
$0.00
$0.50
$1.00
$1.50
$2.00
$2.50
$3.00
$3.50
2010 2011 2012 2013 2014 2015 2016 2017
Q1 2018 Q1 2017 Change
Net Sales 935.5$ 887.1$ 5.5%
OI before financial services 177.7$ 170.2$ 4.4%
OI margin before financial services 19.0% 19.2% -20 bps
OI from financial services 56.9$ 52.5$ 8.4%
OI margin consolidated 23.0% 23.1% -10 bps
Diluted EPS 2.82$ 2.39$ 18.0%
Adjusted diluted EPS* 2.79$ 2.39$ 16.7%
($ in millions)
Sales up 5.5%; Organic Sales up 0.8%;
EPS up 18.0%; Adjusted EPS up 16.7%*
Q1 2018 SUMMARY RESULTS
28
*As adjusted to exclude net debt items and tax charge

29
SNAP-ON INVESTMENT RATIONALE
• Executing on defined and coherent strategies
• Unique brand and value proposition - enabling progress in
workplaces of consequence…we make critical work easier
• Clear runways for improvement - Snap-on Value Creation
• Substantial runways for growth
– Enhance the franchise network
– Expand with repair shop owners and managers
– Extend in critical industries
– Build in emerging markets
• Priorities for capital allocation include investing in our business
(organically and through acquisition); capital returned to
shareholders through both dividend and share repurchase
• Targeting organic sales growth in the mid-single digits and
continuing operating margin improvement

Investor Overview
April 2018

AS REPORTED Fourth Quarter Full Year
($ in millions, except per share data - unaudited) 2017 2016 2017 2016
Charges related to judgments in
litigation matters that are being
appealed (“legal charges”)
Pre-tax legal charges
Income tax expense
Legal charges, net of tax
$ 30.9
(11.8)
$ 19.1
$ -
-
$ -
$ 45.9
(17.5)
$ 28.4
$ -
-
$ -
Weighted-average shares outstanding – diluted 57.9 59.3 58.6 59.4
Diluted EPS – legal charges $ 0.33 $ - $ 0.48 $ -
Charge related to implementation
of tax legislation (“tax charge”)
Tax charge $ 7.0 $ - $ 7.0 $ -
Weighted-average shares outstanding – diluted 57.9 59.3 58.6 59.4
Diluted EPS – tax charge $ 0.12 $ - $ 0.12 $ -
Q4-2017 Quarterly Review
© 2018 Snap-on Incorporated
APPENDIX: RECONCILIATION OF NON-GAAP
FINANCIAL MEASURES
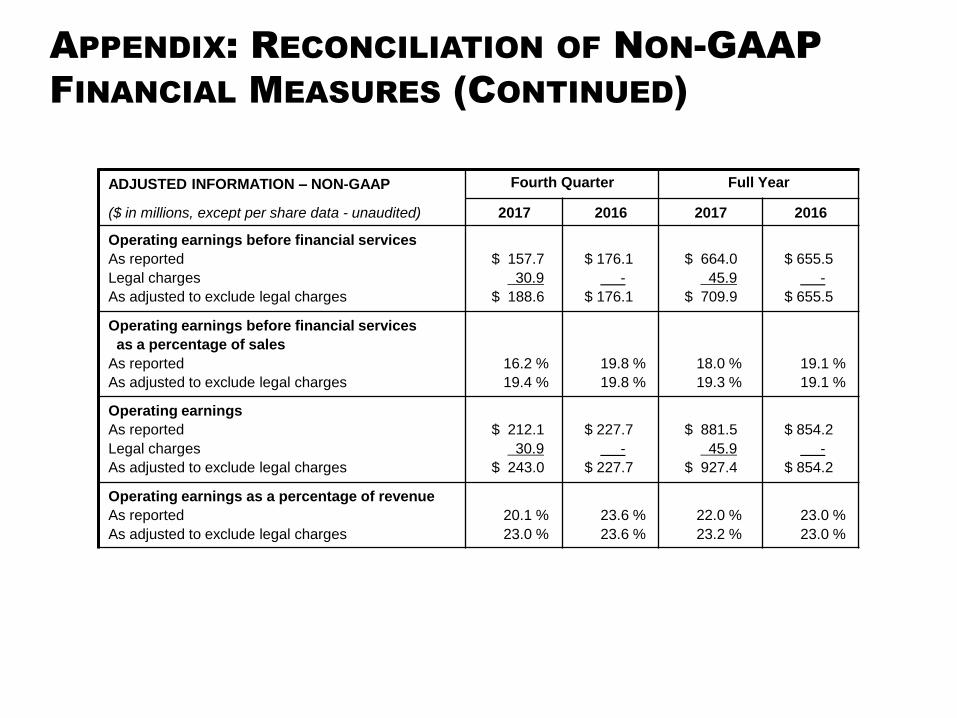
ADJUSTED INFORMATION – NON-GAAP Fourth Quarter Full Year
($ in millions, except per share data - unaudited) 2017 2016 2017 2016
Operating earnings before financial services
As reported
Legal charges
As adjusted to exclude legal charges
$ 157.7
30.9
$ 188.6
$ 176.1
-
$ 176.1
$ 664.0
45.9
$ 709.9
$ 655.5
-
$ 655.5
Operating earnings before financial services
as a percentage of sales
As reported
As adjusted to exclude legal charges
16.2 %
19.4 %
19.8 %
19.8 %
18.0 %
19.3 %
19.1 %
19.1 %
Operating earnings
As reported
Legal charges
As adjusted to exclude legal charges
$ 212.1
30.9
$ 243.0
$ 227.7
-
$ 227.7
$ 881.5
45.9
$ 927.4
$ 854.2
-
$ 854.2
Operating earnings as a percentage of revenue
As reported
As adjusted to exclude legal charges
20.1 %
23.0 %
23.6 %
23.6 %
22.0 %
23.2 %
23.0 %
23.0 %
Q4-2017 Quarterly Review
© 2018 Snap-on Incorporated
APPENDIX: RECONCILIATION OF NON-GAAP
FINANCIAL MEASURES (CONTINUED)

ADJUSTED INFORMATION – NON-GAAP Fourth Quarter Full Year
($ in millions - unaudited) 2017 2016 2017 2016
Net earnings attributable to Snap-on Incorporated
As reported
Legal charges, after tax
Tax charge
As adjusted to exclude legal charges and tax charge
$ 129.5
19.1
7.0
$ 155.6
$ 146.3
-
-
$ 146.3
$ 557.7
28.4
7.0
$ 593.1
$ 546.4
-
-
$ 546.4
Diluted EPS
As reported
Legal charges, after tax
Tax charge
As adjusted to exclude legal charges and tax charge
$ 2.24
0.33
0.12
$ 2.69
$ 2.47
-
-
$ 2.47
$ 9.52
0.48
0.12
$ 10.12
$ 9.20
-
-
$ 9.20
Effective tax rate
As reported
Legal charges
Tax charge
As adjusted to exclude legal charges and tax charge
33.0 %
1.2 %
-3.6 %
30.6 %
30.8 %
-
-
30.8 %
31.1 %
0.4 %
-0.9 %
30.6 %
31.0 %
-
-
31.0 %
Q4-2017 Quarterly Review
© 2018 Snap-on Incorporated
APPENDIX: RECONCILIATION OF NON-GAAP
FINANCIAL MEASURES (CONTINUED)
Q4-2017 Quarterly Review
© 2018 Snap-on Incorporated
APPENDIX: RECONCILIATION OF NON-GAAP
FINANCIAL MEASURES (CONTINUED)
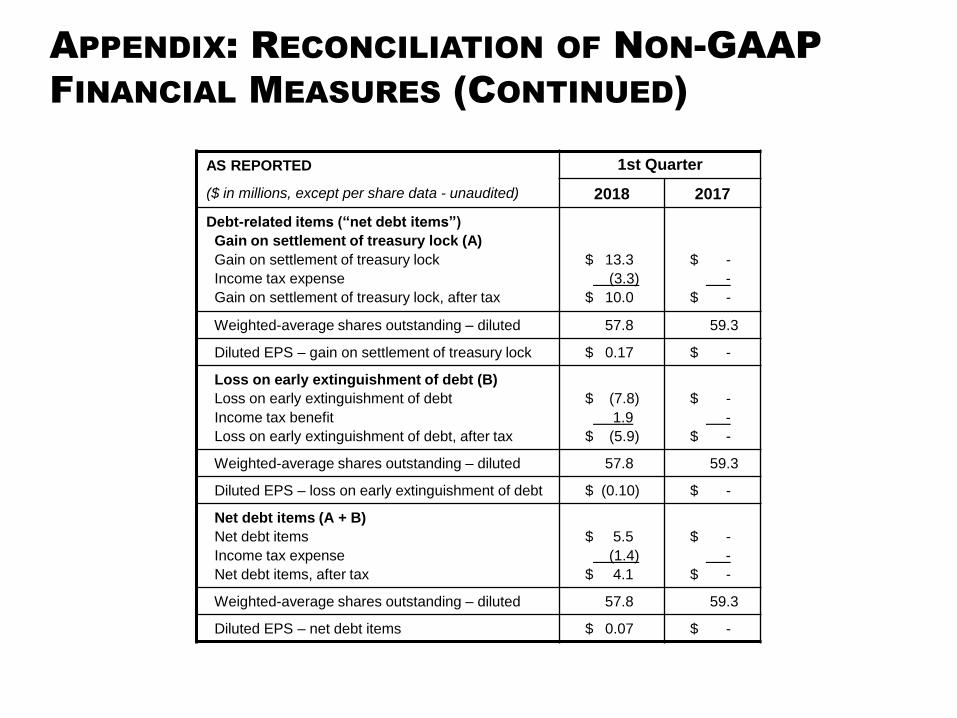
AS REPORTED 1st Quarter
($ in millions, except per share data - unaudited) 2018 2017
Debt-related items (“net debt items”)
Gain on settlement of treasury lock (A)
Gain on settlement of treasury lock
Income tax expense
Gain on settlement of treasury lock, after tax
$ 13.3
(3.3)
$ 10.0
$ -
-
$ -
Weighted-average shares outstanding – diluted 57.8 59.3
Diluted EPS – gain on settlement of treasury lock $ 0.17 $ -
Loss on early extinguishment of debt (B)
Loss on early extinguishment of debt
Income tax benefit
Loss on early extinguishment of debt, after tax
$ (7.8)
1.9
$ (5.9)
$ -
-
$ -
Weighted-average shares outstanding – diluted 57.8 59.3
Diluted EPS – loss on early extinguishment of debt $ (0.10) $ -
Net debt items (A + B)
Net debt items
Income tax expense
Net debt items, after tax
$ 5.5
(1.4)
$ 4.1
$ -
-
$ -
Weighted-average shares outstanding – diluted 57.8 59.3
Diluted EPS – net debt items $ 0.07 $ -
Q4-2017 Quarterly Review
© 2018 Snap-on Incorporated
APPENDIX: RECONCILIATION OF NON-GAAP
FINANCIAL MEASURES (CONTINUED)
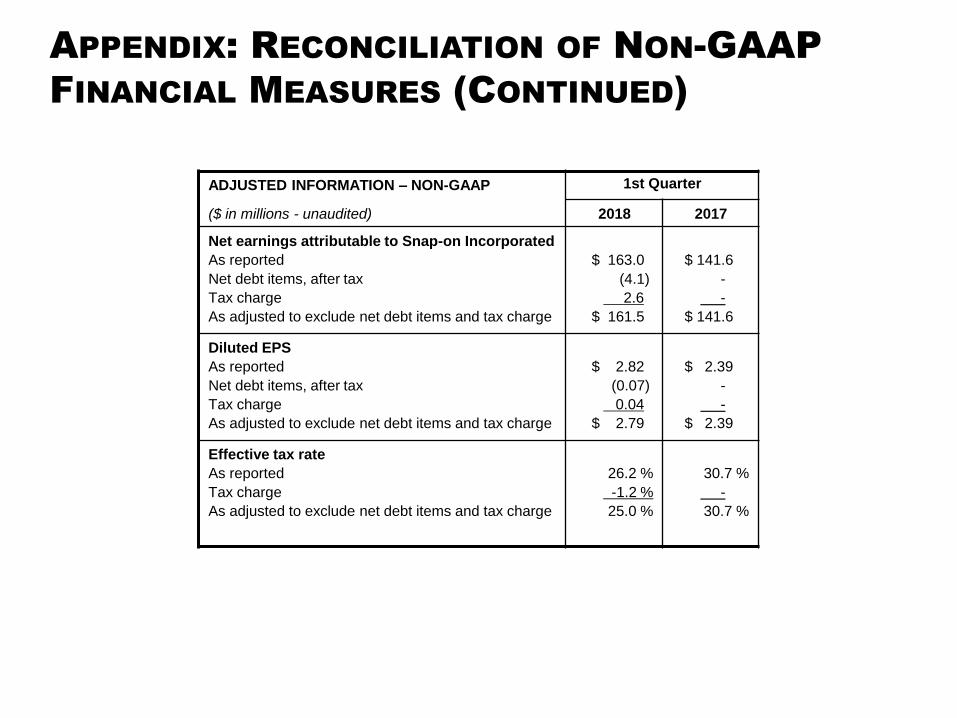
ADJUSTED INFORMATION – NON-GAAP 1st Quarter
($ in millions - unaudited) 2018 2017
Net earnings attributable to Snap-on Incorporated
As reported
Net debt items, after tax
Tax charge
As adjusted to exclude net debt items and tax charge
$ 163.0
(4.1)
2.6
$ 161.5
$ 141.6
-
-
$ 141.6
Diluted EPS
As reported
Net debt items, after tax
Tax charge
As adjusted to exclude net debt items and tax charge
$ 2.82
(0.07)
0.04
$ 2.79
$ 2.39
-
-
$ 2.39
Effective tax rate
As reported
Tax charge
As adjusted to exclude net debt items and tax charge
26.2 %
-1.2 %
25.0 %
30.7 %
-
30.7 %


