Download - POWERING THE ENERGY FRONTIER

W E S T E R N A R E A P O W E R A D M I N I S T R A T I O N
A N N U A L R E P O R T 2 0 1 4
S T A T I S T I C A L A P P E N D I XU N A U D I T E D
POWERING
THE ENERGY
FRONTIER


1
CONTENTS
System data
System data . . . . . . . . . . . . . . . . . . . . . . . . . . . . . . . . . . . . . . . . . . . . . . . . . . . . . . . . . . . . . . . . . . . . . . . . . . . . 2
Facilities . . . . . . . . . . . . . . . . . . . . . . . . . . . . . . . . . . . . . . . . . . . . . . . . . . . . . . . . . . . . . . . . . . . . . . . . . . . . . . . . 3
Transmission lines . . . . . . . . . . . . . . . . . . . . . . . . . . . . . . . . . . . . . . . . . . . . . . . . . . . . . . . . . . . . . . . . . . . . . . 4
Resources . . . . . . . . . . . . . . . . . . . . . . . . . . . . . . . . . . . . . . . . . . . . . . . . . . . . . . . . . . . . . . . . . . . . . . . . . . . . . . 5
Power marketing system . . . . . . . . . . . . . . . . . . . . . . . . . . . . . . . . . . . . . . . . . . . . . . . . . . . . . . . . . . . . . . . 6
Powerplants . . . . . . . . . . . . . . . . . . . . . . . . . . . . . . . . . . . . . . . . . . . . . . . . . . . . . . . . . . . . . . . . . . . . . . . . . . . . 8
Historical flows . . . . . . . . . . . . . . . . . . . . . . . . . . . . . . . . . . . . . . . . . . . . . . . . . . . . . . . . . . . . . . . . . . . . . . . .11
Peak firm loads . . . . . . . . . . . . . . . . . . . . . . . . . . . . . . . . . . . . . . . . . . . . . . . . . . . . . . . . . . . . . . . . . . . . . . . .12
Power sales . . . . . . . . . . . . . . . . . . . . . . . . . . . . . . . . . . . . . . . . . . . . . . . . . . . . . . . . . . . . . . . . . . . . . . . . . . . .13
Purchased power/transmission cost . . . . . . . . . . . . . . . . . . . . . . . . . . . . . . . . . . . . . . . . . . . . . . . . . . .19
Power customers . . . . . . . . . . . . . . . . . . . . . . . . . . . . . . . . . . . . . . . . . . . . . . . . . . . . . . . . . . . . . . . . . . . . . .21
Repayment . . . . . . . . . . . . . . . . . . . . . . . . . . . . . . . . . . . . . . . . . . . . . . . . . . . . . . . . . . . . . . . . . . . . . . . . . . . .26
Marketing plans and rates . . . . . . . . . . . . . . . . . . . . . . . . . . . . . . . . . . . . . . . . . . . . . . . . . . . . . . . . . . . . .28
Financial statements
Combining statements (by agency) . . . . . . . . . . . . . . . . . . . . . . . . . . . . . . . . . . . . . . . . . . . . . . . . . . . .32
Combining statements (by power system) . . . . . . . . . . . . . . . . . . . . . . . . . . . . . . . . . . . . . . . . . . . . .35
Operating expenses . . . . . . . . . . . . . . . . . . . . . . . . . . . . . . . . . . . . . . . . . . . . . . . . . . . . . . . . . . . . . . . . . . .39
Summary of completed plant . . . . . . . . . . . . . . . . . . . . . . . . . . . . . . . . . . . . . . . . . . . . . . . . . . . . . . . . . .40
Construction work-in-progress . . . . . . . . . . . . . . . . . . . . . . . . . . . . . . . . . . . . . . . . . . . . . . . . . . . . . . . .40
Project data
Boulder Canyon Project . . . . . . . . . . . . . . . . . . . . . . . . . . . . . . . . . . . . . . . . . . . . . . . . . . . . . . . . . . . . . . . .41
Central Valley Project . . . . . . . . . . . . . . . . . . . . . . . . . . . . . . . . . . . . . . . . . . . . . . . . . . . . . . . . . . . . . . . . . .48
Loveland Area Projects . . . . . . . . . . . . . . . . . . . . . . . . . . . . . . . . . . . . . . . . . . . . . . . . . . . . . . . . . . . . . . . .59
Parker-Davis Project . . . . . . . . . . . . . . . . . . . . . . . . . . . . . . . . . . . . . . . . . . . . . . . . . . . . . . . . . . . . . . . . . . .73
Pick-Sloan Missouri River Basin Program—Eastern Division . . . . . . . . . . . . . . . . . . . . . . . . . . . .82
Salt Lake City Area/Integrated Projects . . . . . . . . . . . . . . . . . . . . . . . . . . . . . . . . . . . . . . . . . . . . . . . 106
Other projects . . . . . . . . . . . . . . . . . . . . . . . . . . . . . . . . . . . . . . . . . . . . . . . . . . . . . . . . . . . . . . . . . . . . . . . 130
Central Arizona Project . . . . . . . . . . . . . . . . . . . . . . . . . . . . . . . . . . . . . . . . . . . . . . . . . . . . . . . . . . . 132
Falcon-Amistad Project . . . . . . . . . . . . . . . . . . . . . . . . . . . . . . . . . . . . . . . . . . . . . . . . . . . . . . . . . . . 135
Pacific NW-SW Intertie . . . . . . . . . . . . . . . . . . . . . . . . . . . . . . . . . . . . . . . . . . . . . . . . . . . . . . . . . . . . 138
Provo River Project . . . . . . . . . . . . . . . . . . . . . . . . . . . . . . . . . . . . . . . . . . . . . . . . . . . . . . . . . . . . . . . 141
Washoe Project . . . . . . . . . . . . . . . . . . . . . . . . . . . . . . . . . . . . . . . . . . . . . . . . . . . . . . . . . . . . . . . . . . 145
Term definitions . . . . . . . . . . . . . . . . . . . . . . . . . . . . . . . . . . . . . . . . . . . . . . . . . . . . . . . . . . . . . . . . . . . . . 147
October 2015

2
SYSTEM DATA
System Profile as of Sept. 30, 2014
Asset Boulder Canyon Central Arizona Central Valley Falcon-Amistad Loveland AreaProjects1
Pacific NW-SWIntertie Parker-Davis
Pick-SloanMissouri River
Basin Program—Eastern Division1
Provo RiverSalt Lake City
Area/IntegratedProjects
Washoe Elininations2 Western total
Powerplants 1 1 11 2 20 0 2 8 1 11 1 0 57
Transmission lines
Circuit miles 53 0 956 0 3385 974 1,535 7,875 0 2,323 0 0 17,102
Circuit kilometers 86 0 1,539 0 5,447 1,567 2,470 12,671 0 3,738 0 0 27,517
Land3
Acres 1,168 0 12,530 0 34,542 23,097 21,984 93,805 0 35,330 0 0 222,456
Hectares 473 0 5,073 0 13,985 9,351 8,900 37,978 0 14,304 0 0 90,063
Substations 4 9 22 0 79 9 53 123 0 36 0 (15) 3201 One powerplant divides its generation between two projects.2 In accordance with Maintenance Business Rule 3.18, substations can be shared by up to three power systems. The eliminations column removes the duplicate sites.3 These values include total transmission, building, communication and substation acreage for each power system.
Revenue Profile as of Sept. 30, 2014
Power revenues Boulder Canyon Central Arizona Central Valley Falcon-Amistad Loveland Area Projects
Pacific NW-SW Intertie Parker-Davis
Pick-Sloan Missouri River
Basin Program—Eastern Division
Provo RiverSalt Lake City
Area/Integrated Projects
Washoe Western total
Number of customers1 15 23 96 1 68 0 37 355 3 155 1 754
Long-term power revenues ($) 76,105,364 0 237,615,878 6,844,812 85,362,247 0 10,423,617 319,531,574 272,127 148,267,313 211,983 884,634,915
Pass-through power revenues ($) 0 0 0 0 0 0 0 0 0 32,792,255 0 32,792,255
Other power revenues ($) 0 77,503,353 10,191,022 0 5,520,834 0 0 87,071,424 0 25,283,889 0 205,570,522
Project-use power revenues ($) 0 0 21,818,815 0 24,486 0 1,660,541 161,466 0 478,632 0 24,143,940
Interproject power revenues ($) 0 6,186 0 0 8,551,463 0 0 0 0 232,703 0 8,790,352
Power revenues total ($) 76,105,364 77,509,539 269,625,716 6,844,812 99,459,030 0 12,084,158 406,764,464 272,127 207,054,792 211,983 1,155,931,984 ¹Double counting occurs when more than one project sells power to the same customer.

3
FACILITIES
Buildings, Communications SummaryProject Number of
buildingsNumber of
communications sitesFee area Easement area
Acres Hectares Acres Hectares
Boulder Canyon 0 3 0 0 0 0
Central Arizona1 2 11 0 0 0 0
Central Valley 39 18 0 0 0 0
Loveland Area Projects 191 112 57 23 46 19
Pacific NW-SW Intertie 14 10 0 0 0 0
Parker-Davis 58 63 0 0 7 3
Pick-Sloan Missouri River Basin Program—Eastern Division 185 207 183 74 176 71
Salt Lake City Area/Integrated Projects 72 68 46 18 1 0
Subtotal 561 492 286 116 230 93
Eliminations2 0 (17) 0 0 0 0
Western total 561 475 286 116 230 931 Western maintains an additional seven communication sites owned by the Bureau of Reclamation.2 In accordance with Maintenance Business Rule 3.18, communication sites can be shared by up to three power systems. The eliminations line removes the duplicate sites.
Substations SummaryProject Number of
substations1
Transformers Fee area Withdrawal area2 Easement area
Number Capacity (kVA) Acres Hectares Acres Hectares Acres Hectares
Boulder Canyon 4 0 0 0 0 0 0 0 0
Central Arizona1,3 9 2 60,000 0 0 0 0 0 0
Central Valley 22 22 1,379,920 374 151 0 0 0 0
Loveland Area Projects 79 73 3,440,710 520 211 0 0 163 66
Pacific NW-SW Intertie 9 11 8,368,320 316 128 4,403 1,782 86 35
Parker-Davis 53 30 2,593,000 363 147 115 47 87 35
Pick-Sloan Missouri River Basin Program—Eastern Division 123 126 10,166,450 1,932 782 23 9 9 4
Salt Lake City Area/Integrated Projects 36 32 6,224,250 748 303 128 52 50 20
Subtotal 335 296 32,232,650 4,253 1,721 4,669 1,889 396 160
Eliminations4 (15) 0 0 0 0 0 0 0 0
Western total 320 296 32,232,650 4,253 1,721 4,669 1,889 396 160 1 Areas that have been set aside by the Bureau of Land Management for Western transmission and substation use.2 Western maintains an additional seven communication sites owned by the Bureau of Reclamation.3 Western maintains an additional six substations owned by the Bureau of Reclamation.4 In accordance with Maintenance Business Rule 3.18, substations can be shared by up to three power systems. The eliminations line removes the duplicate substations.

4
TRANSMISSION LINES
0
1000
2000
3000
4000
5000
6000
7000
8000
20141978
500-kV345-kV230-kV161-kV115- & 138-kV69-kV & below
9901,147
6,4505,802
1,150853
6,190
7,255
1,1341,574
94628
Voltage
Mile
s
TOTAL MILES OF LINES1978 - 16,165 miles2014 - 17,102 miles
as of Oct. 1, 2014Transmission Lines in Service
0
1000
2000
3000
4000
5000
6000
Wood
Steel
50+41 - 5031 - 4021 - 3011 - 2010 or less
453246 470136
1,262
575 620 466
2,454
638
4,171
5,582
Age in years
Mile
s
as of Oct. 1, 2014Transmission Line Age
Transmission Line Summary (in circuit miles)State
500-kV 345-kV 230-kV 161-kV 138-kV 100-115-kV 69-kV and below Western totalMiles Kilometers Miles Kilometers Miles Kilometers Miles Kilometers Miles Kilometers Miles Kilometers Miles Kilometers Miles Kilometers
Arizona 231.90 373.13 703.49 1,131.92 926.12 1,490.13 154.90 249.23 0.00 0.00 306.92 493.83 116.59 187.59 2,439.92 3,925.83California 372.40 599.19 0.00 0.00 905.10 1,456.31 203.46 327.37 0.00 0.00 13.55 21.80 75.64 121.70 1,570.15 2,526.37Colorado 0.00 0.00 315.75 508.04 729.10 1,173.12 0.00 0.00 211.53 340.35 807.78 1,299.72 117.01 188.27 2,181.17 3,509.50Iowa 0.00 0.00 20.33 32.71 164.52 264.71 193.35 311.10 0.00 0.00 0.00 0.00 0.00 0.00 378.20 608.52Minnesota 0.00 0.00 0.00 0.00 247.31 397.92 0.00 0.00 0.00 0.00 14.99 24.12 0.00 0.00 262.30 422.04Missouri 0.00 0.00 0.00 0.00 0.00 0.00 17.95 28.88 0.00 0.00 0.00 0.00 0.00 0.00 17.95 28.88Montana 0.00 0.00 0.00 0.00 561.21 902.99 283.05 455.43 0.00 0.00 597.86 961.96 73.86 118.84 1,515.98 2,439.22Nebraska 0.00 0.00 136.99 220.42 125.79 202.40 0.00 0.00 0.00 0.00 417.22 671.31 69.44 111.73 749.44 1,205.85Nevada 24.00 38.62 10.50 16.89 151.39 243.59 0.00 0.00 0.00 0.00 0.00 0.00 3.40 5.47 189.29 304.57New Mexico 0.00 0.00 22.14 35.62 58.17 93.60 0.00 0.00 0.00 0.00 0.00 0.00 3.63 5.84 83.94 135.06North Dakota 0.00 0.00 40.74 65.55 1,103.10 1,774.89 0.00 0.00 0.00 0.00 829.22 1,334.21 130.43 209.86 2,103.49 3,384.51South Dakota 0.00 0.00 270.51 435.25 1,765.92 2,841.37 0.00 0.00 0.00 0.00 1,345.03 2,164.15 7.06 11.36 3,388.52 5,452.13Utah 0.00 0.00 16.98 27.32 0.00 0.00 0.00 0.00 118.66 190.92 0.00 0.00 0.32 0.51 135.96 218.75Wyoming 0.00 0.00 36.40 58.57 517.61 832.83 0.00 0.00 0.00 0.00 1,139.26 1,833.07 392.21 631.07 2,085.48 3,355.54Total 628.30 1,010.94 1,573.83 2,532.29 7,255.34 11,673.84 852.71 1,372.01 330.19 531.27 5,471.83 8,804.17 989.59 1,592.24 17,101.79 27,516.78

5
RESOURCES
Energy Resource and DispositionFY 2014 FY 2013
In gigawatthours In gigawatthours
ENERGY RESOURCE
Net generation 28,607 28,822
Interchange
Received1 126 183
Delivered 236 92
Net interchange (110) 91
Purchases
NonWestern 9,352 9,506
Western 7 90
Purchases total 9,359 9,596
Energy resources total 37,856 38,509
ENERGY DISPOSITION
Sales of electric energy
Western sales2 31,690 32,548
Project-use sales3 440 1,205
Energy sales total 32,130 33,753
Other
Interproject sales 349 284
Other deliveries/losses4 3,603 3,489
Other total 3,952 3,773
Energy delivered total 36,082 37,526
System and contractual losses5 1,774 983
Energy disposition total 37,856 38,509 1 Loveland Area Projects includes 126 GWh returned from customers for pump storage.2 Central Arizona includes 1,389 GWh of Navajo surplus energy in excess of Central Arizona load. Salt Lake City Area/Integrated Projects classifies Western
Replacement Power as pass-through cost sales in the sales and revenue table. However, pass-through cost/sales are not included in the table above.3 Central Arizona load resides in Western Area Lower Colorado Balancing Authority as of Oct. 1, 2011. Desert Southwest region does not bill or collect for Central
Arizona project-use sales.4 Includes 450 GWh used for pumping, pumping generation schedules (customers' use of pump storage) and Colorado-Big Thompson project pumping. Also
includes 3,034 GWh of project-use energy provided by the Central Arizona Water Conservation District per Western's agreement 11-DSR-12296 with the Bureau of Reclamation. The revenues are billed by Reclamation and are neither included in the sales and revenues tables in the Statistical Appendix nor the Annual Report. The energy is included in Western's net generation as it passes through Western's balancing authority, but the energy is not recorded as a sale of energy in the sales and revenues tables per the Statistical Appendix.
5 Loveland Area Projects include system and contractual losses of -442 GWh. These values are due to over/underdeliveries by others in the balancing authority area causing energy imbalance.
Capability and Net Generation by Project
Project Number of units
Installed capability1
FY 2014 (MW)
Actual operating capability (MW)2
Net generation (GWh)
July 1, 2014 July 1, 2013 FY 2014 FY 2013
Boulder Canyon 19 2,074 1,493 1,654 3,895 3,755
Central Arizona 3 574 547 547 4,423 4,349
Central Valley 38 2,113 1,229 1,410 2,867 4,481
Falcon-Amistad 5 98 58 8 117 122
Loveland Area Projects 39 830 747 716 2,160 1,792
Parker-Davis 9 315 316 315 1,399 1,309
Pick-Sloan Missouri River Basin Program— Eastern Division
41 2,675 2,630 2,473 9,520 8,669
Provo River 2 5 5 5 18 18
Salt Lake City Area/ Integrated Projects 24 1,816 1,047 976 4,198 4,312
Washoe 2 4 3 3 10 15
Total 182 10,504 8,075 8,107 28,607 28,822 1 Installed operating capability is the maximum generating capability of the units' at-unity power factor without exceeding the specified heat rise on each unit
and is independent of water constraints.2 Actual operating capability represents the operating capability on July 1, but may not represent the coincident or non-coincident peak operating capability
for the powerplant, project or Western as a whole.
Capability and Net Generation by State
Project Number of units
Installed capability1
FY 2014 (MW)
Actual operating capability (MW)2
Net generation (GWh)
July 1, 2014 July 1, 2013 FY 2014 FY 2013
Arizona 26 3,186 2,223 2,290 10,653 10,823
California 43 2,177 1,292 1,473 3,103 4,715
Colorado 22 723 645 579 1,537 1,390
Montana 12 485 511 546 2,112 1,720
Nevada 10 1,037 747 827 1,948 1,878
New Mexico 3 28 8 5 13 9
North Dakota 5 583 565 426 2,357 2,064
South Dakota 26 1,732 1,662 1,645 5,559 5,095
Texas 5 98 58 8 117 122
Utah 5 157 83 59 380 325
Wyoming 25 298 281 249 828 681
Total 182 10,504 8,075 8,107 28,607 28,822 1 Installed operating capability is the maximum generating capability of the units' at-unity power factor without exceeding the specified heat rise on each unit
and is independent of water constraints.2 Actual operating capability represents the operating capability on July 1, but may not represent the coincident or non-coincident peak operating capability
for the powerplant, project or Western as a whole.

6
POWER MARKETING SYSTEM
Power resources
Project or power system
Balancing authority (dispatch center)
Billing/marketing o�ce Rate-setting system
Colorado River Storage Project Energy Marketing and Management O�ce
Rate-settingsystem
Boul
der C
anyo
nPr
ojec
t
Cent
ral A
rizon
aPr
ojec
t
Park
er-D
avis
Proj
ect
Cent
ral V
alley
Proj
ect
Was
hoe
Proj
ect
Folsom
SierraNevada
Phoenix
DesertSouthwest
Paci�
c NW
-SW
Inte
rtie
(tran
smiss
ion p
roje
ct)
Paci�
c NW
-SW
Inte
rtie
(tran
smiss
ion p
roje
ct)
Falco
n-Am
istad
Proj
ect
Montrose5 Phoenix/Loveland
DesertSouthwest
RockyMountain
Collb
ran
Proj
ect
Colo
rado
Rive
rSt
orag
e Pro
ject
Rio G
rand
ePr
ojec
t
Prov
o Rive
rPr
ojec
t
Seed
skad
eePr
ojec
t
Dolo
res
Proj
ect
Salt Lake City Area/ Integrated Projects3
Rate-settingsystem
Hoov
er
Nava
jo1
Park
er
Davis
Judg
e F. C
arr
Folso
m
Kesw
ick
Nim
bus
O’Ne
ill
W.R
. Gia
nelli
Shas
ta
Sprin
g Cre
ek
Trin
ity
Lewi
ston
New
Mel
ones
Stam
pede
Towa
oc
McP
hee
Blue
Mes
a
Flam
ing G
orge
Glen
Cany
on
Mor
row
Poin
t
Crys
tal
Font
enel
le
Lowe
r Mol
ina
Uppe
r Mol
ina
Eleph
ant B
utte
Amist
ad
Falco
n
Deer
Cree
k
Colorado RiverStorage Project
Management Center

7
4Loveland Area Projects
RockyMountain
Watertown
UpperGreat Plains
Power marketed from Salt Lake City Area/Integrated Projects resources and Loveland Area Projects.
Generation from Units 1 and 2 is marketed by the Rocky Mountain region; generation from Units 3 and 4 is marketed by the Upper Great Plains region. Yellowtail is controlled by Rocky Mountain.
These resources are integrated for marketing and operation purposes. However, the Colorado-Big Thompson, Kendrick, North Platte and Shoshone projects, as well as the Pick-Sloan Missouri River Basin Program (Eastern and Western divisions), are integrated for repayment purposes.
These resources are integrated for marketing and operation purposes.
5
Billing for Salt Lake City Area/Integrated Projects carried out by DSW and RM.6
1
3
4
2
Fryin
gpan
-Ar
kans
as
Proj
ect
Colo
rado
-Bi
g Tho
mps
on
Proj
ect
Wes
tern
Divi
sion
Pick
-Slo
an M
issou
riRi
ver B
asin
Prog
ram
—
Easte
rn D
ivisio
n
Pick
-Slo
an M
issou
riRi
ver B
asin
Prog
ram
—
Loveland
Mou
nt El
bert
Alco
va
Sem
inoe
Spiri
t Mou
ntai
n
Bu�a
lo B
ill
Shos
hone
Hear
t Mou
ntai
n
Guer
nsey
Big T
hom
pson
Este
s
Flatir
on
Gree
n Mou
ntai
n
Mar
ys La
ke
Pole
Hill
Boys
en
Frem
ont C
anyo
n
Glen
do
Korte
s
Pilo
t But
te
Yello
wtai
l 2
Yello
wtai
l 2
Cany
on Fe
rry
Oahe
Gavin
s Poi
nt
Garri
son
Fort
Rand
all
Big B
end
Fort
Peck
Rate-settingsystem
Coal-�red generation
Kend
rick
Proj
ect
Shos
hone
Proj
ect
North
Plat
tePr
ojec
t
POWER MARKETING SYSTEM

8
POWERPLANTS as of Sept . 30, 2014
PowerplantsProject/state/plant name Operating agency River Initial in-service date Existing number of units Installed capability1
FY 2014 (MW)Actual operating capability (MW)2 Net generation (GWh)3
July 1, 2013 July 1, 2014 FY 2013 FY 2014
BOULDER CANYON
Arizona-Nevada
Hoover4 Reclamation Colorado Sep 1936 19 2,074 1,654 1,493 3,755 3,895
Boulder Canyon total 19 2,074 1,654 1,493 3,755 3,895
CENTRAL ARIZONA
Arizona
Navajo5,6 SRP N/A May 1974 3 574 547 547 4,349 4,423
Central Arizona total 3 574 547 547 4,349 4,423
CENTRAL VALLEY
California
J.F. Carr Reclamation Clear Creek Tunnel May 1963 2 150 140 141 438 346
Folsom Reclamation American May 1955 3 207 116 102 395 201
Keswick Reclamation Sacramento Oct 1949 3 105 84 55 391 291
New Melones Reclamation Stanislaus Jun 1979 2 380 247 221 414 285
Nimbus Reclamation American May 1955 2 14 8 6 51 28
O'Neill7 Reclamation San Luis Creek Dec 1967 6 25 0 1 8 3
Shasta8 Reclamation Sacramento Jun 1944 7 710 500 368 1,829 1,108
Spring Creek Reclamation Spring Creek Tunnel Feb 1964 2 180 175 180 394 245
Trinity Reclamation Trinity Feb 1964 2 140 116 95 456 306
Lewiston Reclamation Trinity Feb 1964 1 0.45 0 0 1 0
W.R. Gianelli7,9 CDWR San Luis Creek Mar 1968 8 202 24 60 104 54
Central Valley total 38 2,113 1,410 1,229 4,481 2,867
FALCON-AMISTAD
Texas
Amistad10,11 IBWC Rio Grande Jun 1983 2 66 0 50 66 76
Falcon10,11 IBWC Rio Grande Oct 1954 3 32 8 8 56 41
Falcon-Amistad total 5 98 8 58 122 117
LOVELAND AREA PROJECTS
Colorado
Big Thompson Reclamation Trans-Mtn. Div. Apr 1959 1 5 4 0 8 2
Estes Reclamation Trans-Mtn. Div. Sep 1950 3 45 30 45 104 92
Flatiron7,12 Reclamation Trans-Mtn. Div. Jan 1954 3 95 54 54 243 241
Green Mountain Reclamation Blue May 1943 2 26 26 26 25 94
Marys Lake Reclamation Trans-Mtn. Div. May 1951 1 8 8 8 40 35
Mount Elbert7 Reclamation Arkansas Oct 1981 2 200 206 206 339 230
Pole Hill Reclamation Trans-Mtn. Div. Jan 1954 1 38 0 32 177 189
Montana
Yellowtail13,14 Reclamation Big Horn Aug 1966 2 125 144 108 210 508

9
POWERPLANTS as of Sept . 30, 2014
Powerplants, continuedProject/state/plant name Operating agency River Initial in-service date Existing number of units Installed capability1
FY 2014 (MW)Actual operating capability (MW)2 Net generation (GWh)3
July 1, 2013 July 1, 2014 FY 2013 FY 2014
Wyoming
Alcova Reclamation North Platte Jul 1955 2 41 39 39 92 75
Boysen Reclamation Big Horn Aug 1952 2 15 15 15 37 58
Buffalo Bill Reclamation Shoshone May 1995 3 18 18 18 51 94
Fremont Canyon Reclamation North Platte Dec 1960 2 67 33 67 147 139
Glendo Reclamation North Platte Dec 1958 2 38 38 38 54 82
Guernsey Reclamation North Platte Jul 1999 2 6 6 3 9 16
Heart Mountain Reclamation Shoshone Dec 1948 1 5 5 5 18 17
Kortes Reclamation North Platte Jun 1950 3 36 36 24 112 131
Pilot Butte15 Reclamation Wind Jan 1999 2 2 0 0 0 0
Seminoe Reclamation North Platte Aug 1939 3 52 51 51 91 122
Shoshone Reclamation Shoshone May 1995 1 3 3 3 17 20
Spirit Mountain Reclamation Shoshone May 1995 1 5 0 5 18 15
Loveland Area Projects total 39 830 716 747 1,792 2,160
PARKER-DAVIS
Arizona
Davis Reclamation Colorado Jan 1951 5 255 255 256 1,090 1,173
California
Parker10 Reclamation Colorado Dec 1942 4 60 60 60 219 226
Parker-Davis total 9 315 315 316 1,309 1,399
PICK-SLOAN MISSOURI RIVER BASIN PROGRAM—EASTERN DIVISION
Montana
Canyon Ferry Reclamation Missouri Dec 1953 3 50 57 57 273 332
Fort Peck Corps Missouri Jul 1943 5 185 202 203 1,025 764
Yellowtail13,14 Reclamation Big Horn Aug 1966 2 125 143 143 212 508
North Dakota
Garrison Corps Missouri Jan 1956 5 583 426 565 2,064 2,357
South Dakota
Big Bend Corps Missouri Oct 1964 8 494 491 490 821 889
Fort Randall Corps Missouri Mar 1954 8 320 356 360 1,504 1,647
Gavins Point Corps Missouri Sep 1956 3 132 112 74 694 646
Oahe Corps Missouri Apr 1962 7 786 686 738 2,076 2,377
Pick-Sloan Missouri River Basin Program—Eastern Division total 41 2,675 2,473 2,630 8,669 9,520
PROVO RIVER
Utah
Deer Creek PRWUA Provo Feb 1958 2 5 5 5 18 18
Provo River total 2 5 5 5 18 18

10
POWERPLANTS as of Sept . 30, 2014
Powerplants, continuedProject/state/plant name Operating agency River Initial in-service date Existing number of units Installed capability1
FY 2014 (MW)Actual operating capability (MW)2 Net generation (GWh)3
July 1, 2013 July 1, 2014 FY 2013 FY 2014
SALT LAKE CITY AREA/INTEGRATED PROJECTS
Arizona
Glen Canyon Reclamation Colorado Sep 1964 8 1,320 661 674 3,507 3,110
Colorado
Blue Mesa Reclamation Gunnison Sep 1967 2 86 73 77 134 198
Crystal Reclamation Gunnison Sep 1978 1 32 27 31 102 123
Lower Molina Reclamation Pipeline Dec 1962 1 5 4 5 3 17
McPhee Reclamation Dolores Jun 1993 1 1 0 1 1 3
Morrow Point Reclamation Gunnison Dec 1970 2 162 136 143 194 268
Towaoc Reclamation Canal Jun 1993 1 11 4 9 9 18
Upper Molina Reclamation Pipeline Dec 1962 1 9 7 8 11 27
New Mexico
Elephant Butte Reclamation Rio Grande Nov 1940 3 28 5 8 9 13
Utah
Flaming Gorge Reclamation Green Nov 1963 3 152 54 78 307 362
Wyoming
Fontenelle Reclamation Green May 1968 1 10 5 13 35 59
Salt Lake City Area/ Integrated Projects total 24 1,816 976 1,047 4,312 4,198
WASHOE
California
Stampede Reclamation Little Truckee Dec 1986 2 4 3 3 15 10
Washoe total 2 4 3 3 15 10
Western total 182 10,504 8,107 8,075 28,822 28,607 1 Installed operating capability is the maximum generating capability of the units' at-unity power factor without exceeding the specified heat rise on each unit and is independent of water constraints. 2 Actual operating capability represents the operating capability on July 1, but may not represent the coincident or non-coincident peak operating capability for the powerplant, project or Western as a whole.3 Net generation is gross plant generation less plant use. These amounts have not been reduced by other priorities such as project pumping energy. 4 Excludes 4.8 MW reserved for plant use but included in number of units.5 Coal-fired powerplant6 United States' share (24.3 percent) of 2,250 MW plant capability.7 Pump/generating plant.8 Station service units' capacity is not included. 9 United States' share is (47.67 percent) of plant capability.10 United States' share (50 percent) of plant capability.11 Actual operating capability is based on average hourly generation for the month.12 Only Unit 3 has pump/generation capability.13 RM and UGP each market half of the plant capability and energy.14 Normal sustained maximum capacity of each unit is 62.5 MW, but units may be evaluated for higher output on a case-by-case basis.15 Plant mothballed due to repair cost but not decommissioned.Operating agencies:Reclamation - Bureau of Reclamation, Department of the InteriorCDWR - California Department of Water ResourcesIBWC - International Boundary and Water Commission, Department of StatePRWUA - Provo River Water Users AssociationSRP - Salt River Project

11
HISTORICAL FLOWS
0
5
10
15
20
25
20142004199819921986198019741968196219561950194419381932192619201914190819021896
Year
Minimum
Average
FY 2014
Maximum
Colorado River Flow at Lees Ferry, Arizona(in million acre-feet)
Flow
7.57
15.13
5.50
24.00
0
5
10
15
20
25
2014200620001994198819821976197019641958195219461940193419281922
Year
Sacramento and San Joaquin RiversAnnual Flow to Trinity, Shasta, Folsom and New Melones Reservoirs
(in million acre-feet)
Flow
Minimum
Average
Maximum
FY 20142.22
22.97
10.79
3.34
0
1
2
3
4
5
6
7
2014200720011995198919831977197119651959195319471941
Year
Big Thompson, North Platte and Bighorn Rivers(in million acre-feet)
Flow
Minimum
Average
FY 2014
Maximum
5.04
6.95
3.61
1.79
0
10
20
30
40
50
60
70
20142006200019941988198219761970196419581952194619401934192819221916191019041898
Year
Missouri River Flow at Sioux City, Iowa(in million acre-feet)
Flow
Minimum
Average
Maximum
FY 201435.3
61.2
25.3
11.0
12
PEAK FIRM LOADS
Colorado River Storage Project Management Center
400
800
1200
160020132014
SepAugJulJunMayAprMarFebJanDecNovOctMonth
MW
Desert Southwest
800
1100
1400
1700
200020132014
SepAugJulJunMayAprMarFebJanDecNovOctMonth
MW
300
400
500
600
700
80020132014
SepAugJulJunMayAprMarFebJanDecNovOct
Rocky Mountain
Month
MW
Sierra Nevada
200
600
1000
1400
180020132014
SepAugJulJunMayAprMarFebJanDecNovOctMonth
MW
Upper Great Plains
900
1300
1700
210020132014
SepAugJulJunMayAprMarFebJanDecNovOctMonth
MW
Annual Coincident Peak Firm Load
Year
0
1000
2000
3000
4000
5000
6000
7000
8000
2014201320122011201020092008200720062005200420032002M
W
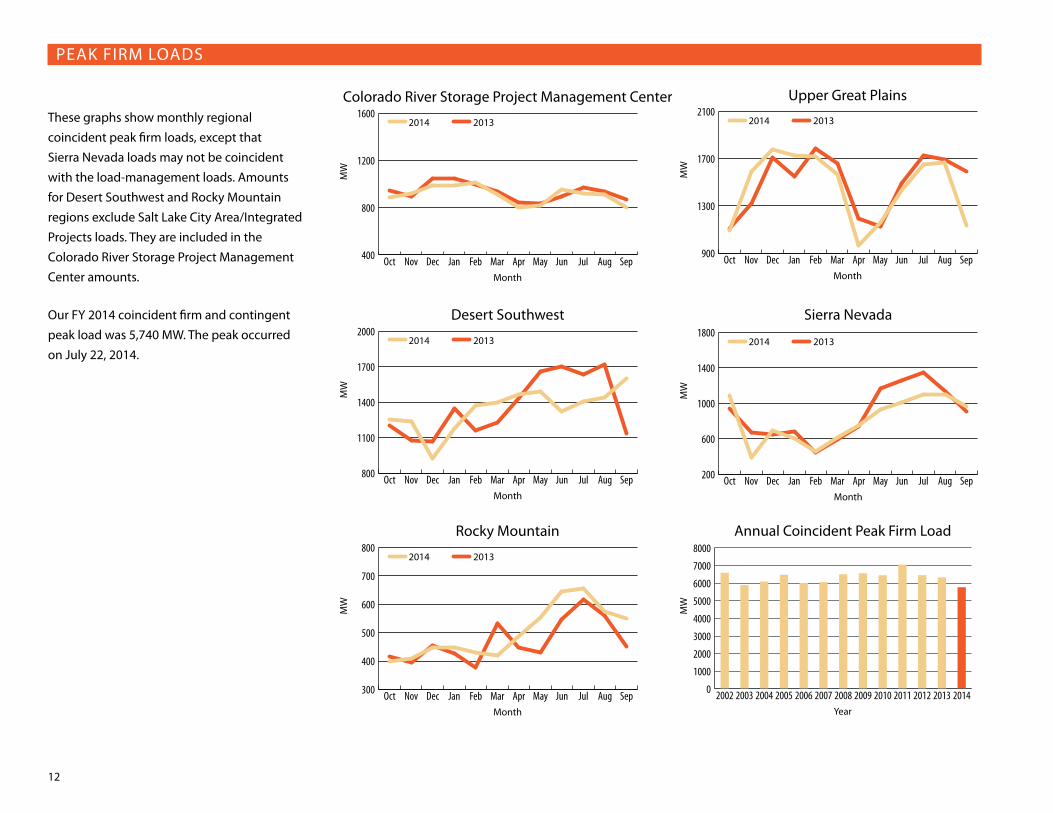
These graphs show monthly regional coincident peak firm loads, except that Sierra Nevada loads may not be coincident with the load-management loads . Amounts for Desert Southwest and Rocky Mountain regions exclude Salt Lake City Area/Integrated Projects loads . They are included in the Colorado River Storage Project Management Center amounts .
Our FY 2014 coincident firm and contingent peak load was 5,740 MW . The peak occurred on July 22, 2014 .

13
POWER SALES
Combined Power Sales and Revenues by ProjectProject
FY 2014 FY 2013
Energy (MWh) Revenues ($) Energy (MWh) Revenues ($)
Boulder Canyon 3,743,225 76,105,364 3,744,931 82,379,636
Central Arizona 1,389,279 77,509,539 1,597,201 72,383,167
Central Valley 5,966,826 269,625,715 7,750,259 272,121,638
Falcon-Amistad 115,713 6,844,812 159,142 8,084,124
Loveland Area Projects 2,676,378 99,459,030 2,537,272 94,423,412
Parker-Davis 1,422,172 12,084,158 1,422,408 12,082,924
Pick-Sloan Missouri River Basin Program—Eastern Division 11,896,163 406,764,464 11,108,815 371,542,678
Provo River 12,122 272,127 18,331 308,204
Salt Lake City Area/Integrated Projects 6,843,871 207,054,792 6,895,933 202,728,229
Washoe 9,887 211,983 14,512 241,270
Western total1 34,075,636 1,155,931,984 35,248,804 1,116,295,2821 Power revenues as presented in this table are $268.0 million greater than the FY 2014 sales of electric power presented in the statements of revenues and
expenses and accumulated net revenues due to the following: $129.3 million in netted transactions where Western simultaneously purchases and sells electric power to the same counterparty; $74.0 million and $32.4 million in Central Arizona and Western Replacement Power revenues, respectively, classified as 'other' in the combining power system statements of revenues and expenses and accumulated net revenues; $21.8 million in project-use revenues that were reversed due to Governmentwide Treasury Account Symbol Adjusted Trial Balance System recording issues and rebilled in FY 2015; $7.1 million in eliminations entries; and $3.4 million in variances between revenue accrual estimates and actual revenue along with other minor miscellaneous corrections and transactions.
Combined Power Sales and Revenues by Customer CategoryCustomer category
FY 2014 FY 2013
Energy (MWh) Revenues ($) Energy (MWh) Revenues ($)
Municipalities 8,411,883 277,883,574 9,246,217 292,961,231
Cooperatives 9,783,855 320,815,605 8,263,029 272,975,649
Public utility districts 4,464,790 204,053,576 4,901,030 206,411,229
Federal agencies 1,293,497 43,627,488 1,325,934 38,087,591
State agencies 4,903,586 135,660,704 4,805,404 134,525,712
Irrigation districts 1,019,550 30,929,994 883,262 23,405,296
Native American tribes 1,140,588 29,535,965 1,271,449 33,879,684
Investor-owned utilities 703,341 28,141,403 696,279 24,108,692
Power marketers 980,837 32,928,774 1,448,140 34,861,493
Joint power authorities 502,490 15,975,157 764,323 17,428,586
Independent system operator corporations 64,486 3,137,787 138,810 5,069,269
Transportation1 10,287 307,665 16,489 360,059
Subtotal 33,279,190 1,122,997,692 33,760,366 1,084,074,491
Interproject 355,354 8,790,352 283,517 6,189,082
Project use 441,092 24,143,940 1,204,921 26,031,709
Western total2 34,075,636 1,155,931,984 35,248,804 1,116,295,2821 The customer category "Railroads and railways" has been changed to "Transportation" in FY 2014.2 Power revenues as presented in this table are $268.0 million greater than the FY 2014 sales of electric power presented in the statements of revenues and
expenses and accumulated net revenues due to the following: $129.3 million in netted transactions where Western simultaneously purchases and sells electric power to the same counterparty; $74.0 million and $32.4 million in Central Arizona and Western Replacement Power revenues, respectively, classified as 'other' in the combining power system statements of revenues and expenses and accumulated net revenues; $21.8 million in project-use revenues that were reversed due to Governmentwide Treasury Account Symbol Adjusted Trial Balance System recording issues and rebilled in FY 2015; $7.1 million in eliminations entries; and $3.4 million in variances between revenue accrual estimates and actual revenue along with other minor miscellaneous corrections and transactions.
Power Sales and Revenues by State and Customer Category (FY 2014)
State Municipalities Cooperatives Public utility districts
Federal agencies
State agencies
Irrigation districts
Native American tribes
Investor-owned utilities
Power marketers
Joint power authorities
Independent system operator
corporationsTransportation1 Interproject Project use Total
Arizona
Energy sales (MWh) 350,522 183,757 0 120,247 1,786,016 835,140 643,934 122,792 0 0 0 0 7,039 195,267 4,244,714
Power revenues ($) 10,473,179 2,908,345 0 3,314,680 70,756,508 28,012,809 14,289,623 3,751,362 0 0 0 0 219,716 1,660,541 135,386,763
Arkansas
Energy sales (MWh) 0 0 0 0 0 0 0 0 0 0 0 0 0 0 0
Power revenues ($) 0 0 0 0 0 0 0 0 1,308,314 0 0 0 0 0 1,308,314
California
Energy sales (MWh) 1,591,080 0 3,299,140 901,871 1,403,428 180,432 44,616 135,031 1 502,490 64,486 10,287 0 186,171 8,319,033
Power revenues ($) 46,926,341 0 153,448,499 32,583,078 28,637,770 2,155,588 479,847 7,518,534 46 15,975,157 3,137,787 307,665 0 21,818,815 312,989,127
Colorado
Energy sales (MWh) 727,830 3,291,152 0 50,003 0 0 6,574 17,409 0 0 0 0 5,063 18,926 4,116,957
Power revenues ($) 25,751,051 106,397,831 0 1,651,229 0 0 175,999 396,733 0 0 0 0 215,555 479,979 135,068,377
Florida
Energy sales (MWh) 0 0 0 0 0 0 0 0 40,935 0 0 0 0 0 40,935
Power revenues ($) 0 0 0 0 0 0 0 0 908,041 0 0 0 0 0 908,041

14
POWER SALES
Power Sales and Revenues by State and Customer Category (FY 2014), continued
State Municipalities Cooperatives Public utility districts
Federal agencies
State agencies
Irrigation districts
Native American tribes
Investor-owned utilities
Power marketers
Joint power authorities
Independent system operator
corporationsTransportation1 Interproject Project use Total
IdahoEnergy sales (MWh) 0 0 0 0 0 0 0 0 0 0 0 0 0 0 0 Power revenues ($) 0 0 0 0 0 0 0 0 0 0 0 0 0 0 0 IndianaEnergy sales (MWh) 0 0 0 0 0 0 0 0 229,958 0 0 0 0 0 229,958 Power revenues ($) 0 0 0 0 0 0 0 0 5,930,773 0 0 0 0 0 5,930,773 IowaEnergy sales (MWh) 682,517 505,335 0 0 0 0 0 11,825 0 0 0 0 0 0 1,199,677 Power revenues ($) 22,716,998 15,929,279 0 0 0 0 0 338,487 0 0 0 0 0 0 38,984,764 KansasEnergy sales (MWh) 124,469 104,604 0 0 0 0 23,647 0 1,359 0 0 0 0 0 254,079 Power revenues ($) 5,036,108 3,392,572 0 0 0 0 990,360 0 33,717 0 0 0 0 0 9,452,757 LouisianaEnergy sales (MWh) 18 0 2 0 0 0 0 0 161 0 0 0 0 0 181 Power revenues ($) 849 0 93 0 0 0 0 0 6,824 0 0 0 0 0 7,766 MarylandEnergy sales (MWh) 0 0 0 0 0 0 0 0 656 0 0 0 0 0 656 Power revenues ($) 0 0 0 0 0 0 0 0 21,668 0 0 0 0 0 21,668 MinnesotaEnergy sales (MWh) 1,413,940 575,198 0 0 37,543 0 22,756 0 34,329 0 0 0 0 0 2,083,766 Power revenues ($) 44,807,873 19,010,592 0 0 1,138,985 0 756,646 0 877,395 0 0 0 0 0 66,591,491 MississippiEnergy sales (MWh) 0 0 16 0 0 0 0 0 0 0 0 0 0 0 16 Power revenues ($) 0 0 886 0 0 0 0 0 0 0 0 0 0 0 886 MissouriEnergy sales (MWh) 17 14,995 0 0 0 0 0 163 17 0 0 0 0 0 15,192 Power revenues ($) 1,759 368,803 0 0 0 0 0 8,810 1,188 0 0 0 0 0 380,560 MontanaEnergy sales (MWh) 0 421,358 0 0 15,183 2,720 50,171 38 67,883 0 0 0 0 21,851 579,204 Power revenues ($) 0 14,231,346 0 0 473,066 100,528 1,668,187 44,279 1,598,022 0 0 0 0 57,344 18,172,772 NebraskaEnergy sales (MWh) 753,211 0 1,108,744 0 134,474 464 24,615 0 8,410 0 0 0 0 2,954 2,032,872 Power revenues ($) 29,482,235 0 48,607,291 0 4,237,788 20,755 818,447 0 232,532 0 0 0 0 7,385 83,406,433 NevadaEnergy sales (MWh) 68,442 0 0 25,670 1,259,669 0 637 914 12,701 0 0 0 0 0 1,368,033 Power revenues ($) 1,062,582 0 0 219,619 21,599,242 0 18,424 19,497 368,747 0 0 0 0 0 23,288,111 New JerseyEnergy sales (MWh) 0 0 0 0 0 0 0 0 0 0 0 0 0 0 0 Power revenues ($) 0 0 0 0 0 0 0 0 0 0 0 0 0 0 0 New MexicoEnergy sales (MWh) 537,602 51,881 0 97,246 0 0 96,839 18,170 0 0 0 0 0 0 801,738 Power revenues ($) 21,570,448 1,236,934 0 2,708,546 0 0 2,606,906 497,517 0 0 0 0 0 0 28,620,351 New YorkEnergy sales (MWh) 0 0 0 0 0 0 0 0 94,384 0 0 0 0 0 94,384 Power revenues ($) 0 0 0 0 0 0 0 0 3,362,334 0 0 0 0 0 3,362,334

15
POWER SALES
Power Sales and Revenues by State and Customer Category (FY 2014), continued
State Municipalities Cooperatives Public utility districts
Federal agencies
State agencies
Irrigation districts
Native American tribes
Investor-owned utilities
Power marketers
Joint power authorities
Independent system operator
corporationsTransportation1 Interproject Project use Total
North Dakota
Energy sales (MWh) 190,523 3,098,997 0 0 106,794 636 83,795 0 173,571 0 0 0 0 3,405 3,657,721
Power revenues ($) 6,361,021 105,032,721 0 0 3,582,765 19,309 2,787,269 0 3,158,805 0 0 0 0 46,901 120,988,791
Ohio
Energy sales (MWh) 0 0 0 0 0 0 0 0 295 0 0 0 0 0 295
Power revenues ($) 0 0 0 0 0 0 0 0 29,239 0 0 0 0 0 29,239
Oklahoma
Energy sales (MWh) 0 13 0 27 0 0 0 196 106 0 0 0 0 0 342
Power revenues ($) 0 712 0 890 0 0 0 12,406 6,887 0 0 0 0 0 20,895
Oregon
Energy sales (MWh) 0 0 0 250 0 0 0 836 897 0 0 0 0 0 1,983
Power revenues ($) 0 0 0 17,500 0 0 0 23,957 27,748 0 0 0 0 0 69,205
Pennsylvania
Energy sales (MWh) 0 0 0 0 0 0 0 400 0 0 0 0 0 0 400
Power revenues ($) 0 0 0 0 0 0 0 11,808 0 0 0 0 0 0 11,808
South Dakota
Energy sales (MWh) 698,708 952,766 56,888 50,562 141,634 0 134,339 394,413 0 0 0 0 0 3,262 2,432,572
Power revenues ($) 23,461,943 31,026,613 1,996,807 1,659,640 4,727,904 0 4,649,307 15,488,997 0 0 0 0 0 49,836 83,061,047
Texas
Energy sales (MWh) 0 115,713 0 0 0 0 0 1,154 301,001 0 0 0 0 0 417,868
Power revenues ($) 0 6,844,812 0 0 0 0 0 29,016 14,355,606 0 0 0 0 0 21,229,434
Utah
Energy sales (MWh) 1,267,345 467,479 0 31,360 18,845 0 2,526 0 0 0 0 0 343,252 0 2,130,807
Power revenues ($) 40,068,604 14,414,787 0 929,012 506,676 614,500 67,018 0 0 0 0 0 8,355,081 0 64,955,678
Washington
Energy sales (MWh) 0 0 0 0 0 0 0 0 0 0 0 0 0 0 0
Power revenues ($) 0 0 0 0 0 0 0 0 0 0 0 0 0 0 0
Wyoming
Energy sales (MWh) 5,659 607 0 16,261 0 158 6,139 0 0 0 0 0 0 9,256 38,080
Power revenues ($) 162,583 20,258 0 543,294 0 6,505 227,932 0 0 0 0 0 0 23,139 983,711
INTERNATIONAL
Canada
Energy sales (MWh) 0 0 0 0 0 0 0 0 14,173 0 0 0 0 0 14,173
Power revenues ($) 0 0 0 0 0 0 0 0 700,888 0 0 0 0 0 700,888
Western total
Energy sales (MWh) 8,411,883 9,783,855 4,464,790 1,293,497 4,903,586 1,019,550 1,140,588 703,341 980,837 502,490 64,486 10,287 355,354 441,092 34,075,636
Power revenues ($)2 277,883,574 320,815,605 204,053,576 43,627,488 135,660,704 30,929,994 29,535,965 28,141,403 32,928,774 15,975,157 3,137,787 307,665 8,790,352 24,143,940 1,155,931,984 1 The customer category "Railroads and railways" has been changed to "Transportation" in FY 2014.2 Power revenues as presented in this table are $268.0 million greater than the FY 2014 sales of electric power presented in the statements of revenues and expenses and accumulated net revenues due to the following: $129.3 million in netted transactions where Western simultaneously purchases and sells electric power
to the same counterparty; $74.0 million and $32.4 million in Central Arizona and Western replacement power revenues, respectively, classified as 'other' in the combining power system statements of revenues and expenses and accumulated net revenues; $21.8 million in project-use revenues that were reversed due to Governmentwide Treasury Account Symbol Adjusted Trial Balance System recording issues and rebilled in FY 2015; $7.1 million in eliminations entries; and $3.2 million in variances between revenue accrual estimates and actual revenue along with other minor miscellaneous corrections and transactions.

16
POWER SALES
Power Sales and Revenues by ProjectProject
FY 2014 FY 2013
Long-term Pass-through Other Total Long-term Pass-through Other TotalBoulder CanyonEnergy sales (MWh) 3,743,225 0 0 3,743,225 3,744,931 0 0 3,744,931 Power revenues ($) 76,105,364 0 0 76,105,364 82,379,636 0 0 82,379,636 Central ArizonaEnergy sales (MWh) 0 0 1,389,006 1,389,006 0 0 1,597,173 1,597,173 Power revenues ($) 0 0 77,503,353 77,503,353 0 0 72,382,439 72,382,439 Central ValleyEnergy sales (MWh) 5,585,562 0 195,093 5,780,655 6,575,879 0 307,161 6,883,040 Power revenues ($) 237,615,878 0 10,191,022 247,806,900 237,771,509 0 12,679,061 250,450,570 Falcon-AmistadEnergy sales (MWh) 115,713 0 0 115,713 159,142 0 0 159,142 Power revenues ($) 6,844,812 0 0 6,844,812 8,084,124 0 0 8,084,124 Loveland Area ProjectsEnergy sales (MWh) 2,082,064 0 235,369 2,317,433 2,076,558 0 170,093 2,246,651 Power revenues ($) 85,362,247 0 5,520,834 90,883,081 85,250,551 0 3,130,321 88,380,872 Parker-DavisEnergy sales (MWh) 1,226,905 0 0 1,226,905 1,227,142 0 0 1,227,142 Power revenues ($) 10,423,617 0 0 10,423,617 10,422,383 0 0 10,422,383 Provo RiverEnergy sales (MWh) 12,122 0 0 12,122 18,331 0 0 18,331 Power revenues ($) 272,127 0 0 272,127 308,204 0 0 308,204 Pick-Sloan Missouri River Basin Program—Eastern DivisionEnergy sales (MWh) 8,979,245 0 2,885,446 11,864,691 9,018,893 0 2,054,002 11,072,895 Power revenues ($) 319,531,574 0 87,071,424 406,602,998 320,182,073 0 51,153,493 371,335,566 Salt Lake City Area/Integrated ProjectsEnergy sales (MWh) 5,207,456 973,792 638,305 6,819,553 5,575,744 1,094,635 126,170 6,796,549 Power revenues ($) 148,267,313 32,792,255 25,283,889 206,343,457 159,768,628 36,350,725 3,970,074 200,089,427 WashoeEnergy sales (MWh) 9,887 0 0 9,887 14,512 0 0 14,512 Power revenues ($) 211,983 0 0 211,983 241,270 0 0 241,270 Western subtotalEnergy sales (MWh) 26,962,179 973,792 5,343,219 33,279,190 28,411,132 1,094,635 4,254,599 33,760,366 Power revenues ($) 884,634,916 32,792,255 205,570,522 1,122,997,693 904,408,378 36,350,725 143,315,388 1,084,074,491 InterprojectEnergy sales (MWh) 0 0 355,354 355,354 1,497 0 282,020 283,517 Power revenues ($) 0 0 8,790,352 8,790,352 123,044 0 6,066,038 6,189,082 Project useEnergy sales (MWh) 441,059 0 33 441,092 1,204,921 0 0 1,204,921 Power revenues ($) 24,143,225 0 715 24,143,940 26,031,709 0 0 26,031,709 Western totalEnergy sales (MWh) 27,403,238 973,792 5,698,606 34,075,636 29,617,550 1,094,635 4,536,619 35,248,804 Power revenues ($)1 908,778,140 32,792,255 214,361,589 1,155,931,984 930,563,131 36,350,725 149,381,426 1,116,295,282 1 Power revenues as presented in this table are $268.0 million greater than the FY 2014 sales of electric power presented in the statements of revenues and expenses and accumulated net revenues due to the following: $129.3 million in netted transactions where Western simultaneously purchases and sells electric power
to the same counterparty; $74.0 million and $32.4 million in Central Arizona and Western Replacement Power revenues, respectively, classified as 'other' in the combining power system statements of revenues and expenses and accumulated net revenues; $21.8 million in project-use revenues that were reversed due to Governmentwide Treasury Account Symbol Adjusted Trial Balance System recording issues and rebilled in FY 2015; $7.1 million in eliminations entries; and $3.2 million in variances between revenue accrual estimates and actual revenue along with other minor miscellaneous corrections and transactions.

17
POWER SALES
Power Sales and Revenues by Customer Category
Customer categoryFY 2014 FY 2013
Long-term Pass-through Other Total Long-term Pass-through Other TotalMunicipalitiesEnergy sales (MWh) 7,452,253 477,120 482,510 8,411,883 8,465,866 675,488 104,863 9,246,217 Power revenues ($) 240,152,659 17,179,442 20,551,473 277,883,574 267,290,587 22,011,254 3,659,390 292,961,231 CooperativesEnergy sales (MWh) 7,579,200 158,076 2,046,579 9,783,855 7,210,731 72,065 980,233 8,263,029 Power revenues ($) 257,505,837 3,423,664 59,886,104 320,815,605 247,267,429 2,476,524 23,231,696 272,975,649 Public utility districtsEnergy sales (MWh) 4,351,953 0 112,837 4,464,790 4,733,086 0 167,944 4,901,030 Power revenues ($) 199,077,497 0 4,976,079 204,053,576 199,693,516 0 6,717,713 206,411,229 Federal agenciesEnergy sales (MWh) 1,236,680 55,181 1,636 1,293,497 1,308,709 16,831 394 1,325,934 Power revenues ($) 41,549,368 2,042,793 35,327 43,627,488 37,450,255 620,940 16,396 38,087,591 State agenciesEnergy sales (MWh) 4,292,570 14,849 596,167 4,903,586 4,225,636 12,267 567,501 4,805,404 Power revenues ($) 89,749,578 542,504 45,368,622 135,660,704 92,341,919 423,472 41,760,321 134,525,712 Irrigation districtsEnergy sales (MWh) 358,024 167,182 494,344 1,019,550 359,144 104,985 419,133 883,262 Power revenues ($) 6,759,843 6,016,318 18,153,833 30,929,994 6,079,531 3,466,683 13,859,082 23,405,296 Native American tribesEnergy sales (MWh) 1,034,350 101,384 4,854 1,140,588 1,055,387 212,999 3,063 1,271,449 Power revenues ($) 25,770,800 3,587,534 177,631 29,535,965 26,434,316 7,351,852 93,516 33,879,684 Investor-owned utilitiesEnergy sales (MWh) 144,372 0 558,969 703,341 253,777 0 442,502 696,279 Power revenues ($) 7,786,511 0 20,354,892 28,141,403 9,301,212 0 14,807,480 24,108,692 Power marketersEnergy sales (MWh) 0 0 980,837 980,837 17,984 0 1,430,156 1,448,140 Power revenues ($) 0 0 32,928,774 32,928,774 760,968 0 34,100,525 34,861,493 Joint power authoritiesEnergy sales (MWh) 502,490 0 0 502,490 764,323 0 0 764,323 Power revenues ($) 15,975,157 0 0 15,975,157 17,428,586 0 0 17,428,586 Independent system operator corporationsEnergy sales (MWh) 0 0 64,486 64,486 0 0 138,810 138,810 Power revenues ($) 0 0 3,137,787 3,137,787 0 0 5,069,269 5,069,269 Transportation1
Energy sales (MWh) 10,287 0 0 10,287 16,489 0 0 16,489 Power revenues ($) 307,665 0 0 307,665 360,059 0 0 360,059 Western subtotalEnergy sales (MWh) 26,962,179 973,792 5,343,219 33,279,190 28,411,132 1,094,635 4,254,599 33,760,366 Power revenues ($) 884,634,915 32,792,255 205,570,522 1,122,997,692 904,408,378 36,350,725 143,315,388 1,084,074,491 InterprojectEnergy sales (MWh) 0 0 355,354 355,354 1,497 0 282,020 283,517 Power revenues ($) 0 0 8,790,352 8,790,352 123,044 0 6,066,038 6,189,082 Project useEnergy sales (MWh) 441,059 0 33 441,092 1,204,921 0 0 1,204,921 Power revenues ($) 24,143,225 0 715 24,143,940 26,031,709 0 0 26,031,709 Western totalEnergy sales (MWh) 27,403,238 973,792 5,698,606 34,075,636 29,617,550 1,094,635 4,536,619 35,248,804 Power revenues ($)2 908,778,140 32,792,255 214,361,589 1,155,931,984 930,563,131 36,350,725 149,381,426 1,116,295,282 1 The customer category "Railroads and railways" has been changed to "Transportation" in FY 2014.2 Power revenues as presented in this table are $268.0 million greater than the FY 2014 sales of electric power presented in the statements of revenues and expenses and accumulated net revenues due to the following: $129.3 million in netted transactions where Western simultaneously purchases and sells electric power
to the same counterparty; $74.0 million and $32.4 million in Central Arizona and Western Replacement Power revenues, respectively, classified as 'other' in the combining power system statements of revenues and expenses and accumulated net revenues; $21.8 million in project-use revenues that were reversed due to Governmentwide Treasury Account Symbol Adjusted Trial Balance System recording issues and rebilled in FY 2015; $7.1 million in eliminations entries; and $3.2 million in variances between revenue accrual estimates and actual revenue along with other minor miscellaneous corrections and transactions.
18
POWER SALES
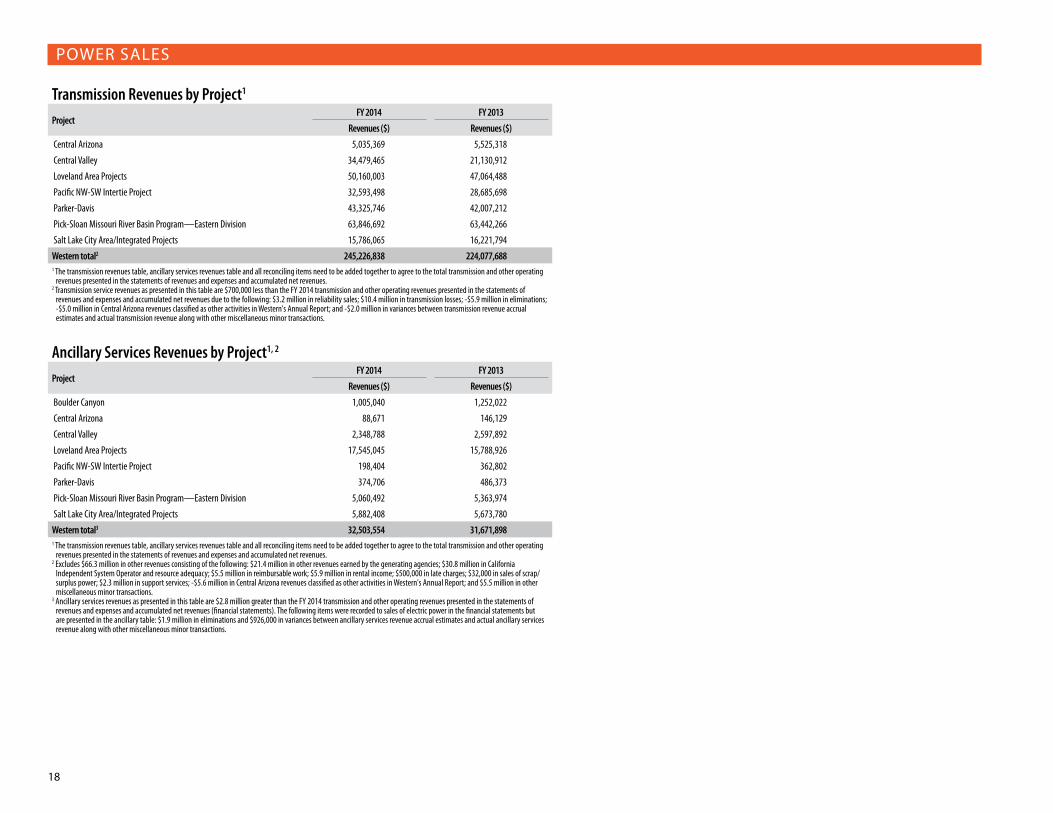
Transmission Revenues by Project1
ProjectFY 2014 FY 2013
Revenues ($) Revenues ($)
Central Arizona 5,035,369 5,525,318
Central Valley 34,479,465 21,130,912
Loveland Area Projects 50,160,003 47,064,488
Pacific NW-SW Intertie Project 32,593,498 28,685,698
Parker-Davis 43,325,746 42,007,212
Pick-Sloan Missouri River Basin Program—Eastern Division 63,846,692 63,442,266
Salt Lake City Area/Integrated Projects 15,786,065 16,221,794
Western total2 245,226,838 224,077,688 1 The transmission revenues table, ancillary services revenues table and all reconciling items need to be added together to agree to the total transmission and other operating
revenues presented in the statements of revenues and expenses and accumulated net revenues. 2 Transmission service revenues as presented in this table are $700,000 less than the FY 2014 transmission and other operating revenues presented in the statements of
revenues and expenses and accumulated net revenues due to the following: $3.2 million in reliability sales; $10.4 million in transmission losses; -$5.9 million in eliminations; -$5.0 million in Central Arizona revenues classified as other activities in Western's Annual Report; and -$2.0 million in variances between transmission revenue accrual estimates and actual transmission revenue along with other miscellaneous minor transactions.
Ancillary Services Revenues by Project1, 2
ProjectFY 2014 FY 2013
Revenues ($) Revenues ($)
Boulder Canyon 1,005,040 1,252,022
Central Arizona 88,671 146,129
Central Valley 2,348,788 2,597,892
Loveland Area Projects 17,545,045 15,788,926
Pacific NW-SW Intertie Project 198,404 362,802
Parker-Davis 374,706 486,373
Pick-Sloan Missouri River Basin Program—Eastern Division 5,060,492 5,363,974
Salt Lake City Area/Integrated Projects 5,882,408 5,673,780
Western total3 32,503,554 31,671,898 1 The transmission revenues table, ancillary services revenues table and all reconciling items need to be added together to agree to the total transmission and other operating
revenues presented in the statements of revenues and expenses and accumulated net revenues. 2 Excludes $66.3 million in other revenues consisting of the following: $21.4 million in other revenues earned by the generating agencies; $30.8 million in California
Independent System Operator and resource adequacy; $5.5 million in reimbursable work; $5.9 million in rental income; $500,000 in late charges; $32,000 in sales of scrap/surplus power; $2.3 million in support services; -$5.6 million in Central Arizona revenues classified as other activities in Western's Annual Report; and $5.5 million in other miscellaneous minor transactions.
3 Ancillary services revenues as presented in this table are $2.8 million greater than the FY 2014 transmission and other operating revenues presented in the statements of revenues and expenses and accumulated net revenues (financial statements). The following items were recorded to sales of electric power in the financial statements but are presented in the ancillary table: $1.9 million in eliminations and $926,000 in variances between ancillary services revenue accrual estimates and actual ancillary services revenue along with other miscellaneous minor transactions.

19
PURCHASED POWER/PURCHASED TRANSMISSION
Purchased Power Cost by ProjectProject and source
FY 2014 FY 2013
Energy (MWh) Cost ($ in thousands) Energy (MWh) Cost ($ in thousands)
Central Valley
NonWestern 3,608,036 171,101 3,630,976 166,647
Western 0 0 5,863 32
Central Valley purchases total 3,608,036 171,101 3,636,839 166,679
Loveland Area Projects
NonWestern 540,067 20,902 874,719 26,615
Western 4,790 209 3,731 101
Loveland Area Projects purchases total 544,857 21,111 878,450 26,716
Parker-Davis
NonWestern 35,866 1,676 57,410 2,892
Western 2,471 74 1,880 71
Parker-Davis purchases total 38,337 1,750 59,290 2,963
Pick-Sloan Missouri River Basin Program—Eastern Division
NonWestern 3,305,169 142,528 3,061,361 96,375
Western 0 0 10 0
Pick-Sloan Missouri River Basin Program—Eastern Division purchases total 3,305,169 142,528 3,061,371 96,375
Salt Lake City Area/Integrated Projects
NonWestern 1,862,621 75,209 1,881,206 61,165
Western 159,479 4,275 78,845 2,268
Salt Lake City Area/Integrated Projects purchases total 2,022,100 79,484 1,960,051 63,433
Westernwide totals
NonWestern 9,351,759 411,416 9,505,672 353,694
Western 166,740 4,558 90,329 2,472
Purchased power total1 9,518,499 415,974 9,596,001 356,166 1 Purchased power as presented in this table is greater than the FY 2014 combining power system statements of revenues and expenses and accumulated net
revenues by $130 million due to the following: $129.3 million in netted transactions where Western simultaneously purchases and sells electric power to the same counterparty; $10.2 million in elimination entries; -$1.5 million for spinning reserves; -$1.9 million for interchange energy; -$2.0 million for merchant services; -$.2 million in purchases to meet regulatory requirements; and -$4.0 million in variances between purchased power accrual estimates and actual purchased power along with other miscellaneous minor transactions.
Purchased Transmission Expenses by ProjectProject and source
FY 2014 FY 2013
Cost ($ in thousands) Cost ($ in thousands)
Central Valley
NonWestern 50,467 47,829
Western 0 0
Central Valley purchases total 50,467 47,829
Loveland Area Projects
NonWestern 7,975 7,069
Western 3 55
Loveland Area Projects purchases total 7,978 7,124
Pick-Sloan Missouri River Basin Program—Eastern Division
NonWestern 5,319 3,323
Western 0 0
Pick-Sloan Missouri River Basin Program—Eastern Division purchases total 5,319 3,323
Salt Lake City Area/Integrated Projects
NonWestern 9,111 8,133
Western 3,067 2,270
Salt Lake City Area/Integrated Projects purchases total 12,178 10,403
Westernwide totals
NonWestern 72,872 66,354
Western 3,070 2,325
Purchased transmission total1 75,942 68,679 1 Purchased transmission in this table is less than the FY 2014 combining power system statements of revenues and expenses and accumulated net revenues
by $4.6 million due to the following: $6.0 million of purchased ancillary services reported in the purchased ancillary services table; exclusion of -$4.7 million in elimination entries; and -$5.9 million in variances between purchased transmission accrual estimates and actual purchased transmission along with other miscellaneous minor transactions.

20
PURCHASED POWER/PURCHASED TRANSMISSION
Purchased Ancillary Services Cost by ProjectProject and source
FY 2014 FY 2013
Cost ($ in thousands) Cost ($ in thousands)
Loveland Area Projects
NonWestern 4,514 7,079
Western 1,479 335
Loveland Area Projects total1 5,993 7,414
Westernwide totals
NonWestern 4,514 7,079
Western 1,479 335
Purchased ancillary services total 5,993 7,414 1 Purchased ancillary services are included in the purchased transmission services line per the FY 2014 statements of revenues and expenses and accumulated
net revenues.
Pass-through Purchased Power
Project and sourceFY 2014 FY 2013
Energy (MWh) Cost ($ in thousands) Energy (MWh) Cost ($ in
thousands)
Salt Lake City Area/Integrated Projects
NonWestern 696,284 26,994 667,951 25,341
Western 183,773 5,141 199,023 4,589
Salt Lake City Area/Integrated Projects total1 880,057 32,135 866,974 29,930
Westernwide totals
NonWestern 696,284 26,994 667,951 25,341
Western 183,773 5,141 199,023 4,589
Pass-through purchased power total 880,057 32,135 866,974 29,930 1 Western Replacement Power purchases are classified as other activities in Western's Annual Report.

21
POWER CUSTOMERS
Power Customers by Customer Category (FY 2014)Customer category Long-term Other Total
Municipalities 268 3 271
Cooperatives 54 4 58
Public utility districts 12 4 16
Federal agencies 34 2 36
State agencies 49 0 49
Irrigation districts 30 8 38
Native American tribes 92 0 92
Investor owned utilities 2 16 18
Power marketers 0 33 33
Joint power authorities 3 0 3
Independent system operator corporations 0 1 1
Transportation 1 0 1
Western subtotal 545 71 616
Interproject 0 5 5
Project use 77 0 77
Eliminations1 (13) (1) (14)
Western total 609 75 6841 Double counting occurs when more than one project sells power to the same customer.
Power Customer Count by Project (FY 2014)Project Long-term Other Total
Boulder Canyon 15 0 15
Central Arizona 0 22 22
Interproject 0 1 1
Central Valley 47 9 56
Project use 40 0 40
Falcon-Amistad 1 0 1
Loveland Area Projects 40 17 57
Interproject 0 2 2
Project use 9 0 9
Parker-Davis 35 0 35
Project use 2 0 2
Pick-Sloan Missouri River Basin Program—Eastern Division 294 37 331
Project use 24 0 24
Provo River 3 0 3
Salt Lake City Area/Integrated Projects 135 15 150
Interproject 0 3 3
Project use 2 0 2
Washoe 1 0 1
Eliminations1 (39) (31) (70)
Western total 609 75 6841 Double counting occurs when more than one project sells power to the same customer.
22
POWER CUSTOMERS
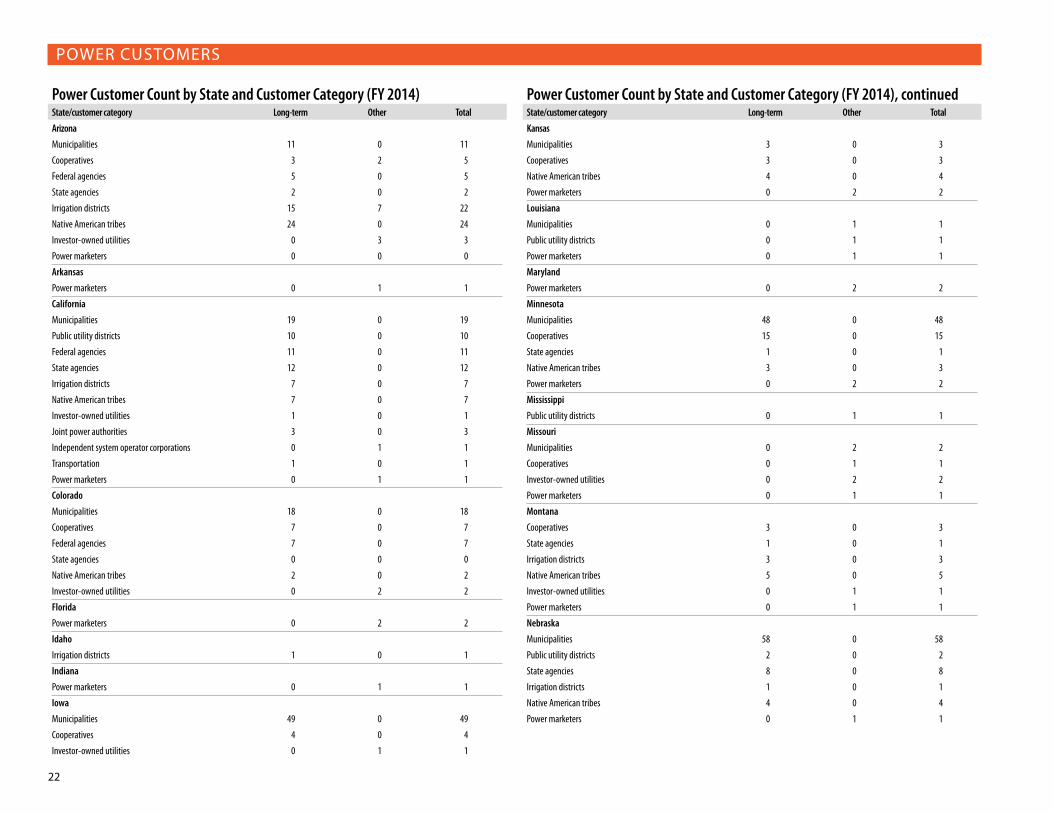
Power Customer Count by State and Customer Category (FY 2014)State/customer category Long-term Other Total
Arizona
Municipalities 11 0 11
Cooperatives 3 2 5
Federal agencies 5 0 5
State agencies 2 0 2
Irrigation districts 15 7 22
Native American tribes 24 0 24
Investor-owned utilities 0 3 3
Power marketers 0 0 0
Arkansas
Power marketers 0 1 1
California
Municipalities 19 0 19
Public utility districts 10 0 10
Federal agencies 11 0 11
State agencies 12 0 12
Irrigation districts 7 0 7
Native American tribes 7 0 7
Investor-owned utilities 1 0 1
Joint power authorities 3 0 3
Independent system operator corporations 0 1 1
Transportation 1 0 1
Power marketers 0 1 1
Colorado
Municipalities 18 0 18
Cooperatives 7 0 7
Federal agencies 7 0 7
State agencies 0 0 0
Native American tribes 2 0 2
Investor-owned utilities 0 2 2
Florida
Power marketers 0 2 2
Idaho
Irrigation districts 1 0 1
Indiana
Power marketers 0 1 1
Iowa
Municipalities 49 0 49
Cooperatives 4 0 4
Investor-owned utilities 0 1 1
Power Customer Count by State and Customer Category (FY 2014), continuedState/customer category Long-term Other Total
Kansas
Municipalities 3 0 3
Cooperatives 3 0 3
Native American tribes 4 0 4
Power marketers 0 2 2
Louisiana
Municipalities 0 1 1
Public utility districts 0 1 1
Power marketers 0 1 1
Maryland
Power marketers 0 2 2
Minnesota
Municipalities 48 0 48
Cooperatives 15 0 15
State agencies 1 0 1
Native American tribes 3 0 3
Power marketers 0 2 2
Mississippi
Public utility districts 0 1 1
Missouri
Municipalities 0 2 2
Cooperatives 0 1 1
Investor-owned utilities 0 2 2
Power marketers 0 1 1
Montana
Cooperatives 3 0 3
State agencies 1 0 1
Irrigation districts 3 0 3
Native American tribes 5 0 5
Investor-owned utilities 0 1 1
Power marketers 0 1 1
Nebraska
Municipalities 58 0 58
Public utility districts 2 0 2
State agencies 8 0 8
Irrigation districts 1 0 1
Native American tribes 4 0 4
Power marketers 0 1 1

23
POWER CUSTOMERS
Power Customer Count by State and Customer Category (FY 2014), continuedState/customer category Long-term Other Total
Nevada
Municipalities 1 0 1
Federal agencies 2 0 2
State agencies 2 0 2
Native American tribes 2 0 2
Investor-owned utilities 0 1 1
Power marketers 0 4 4
New Jersey
Power marketers 0 0 0
New Mexico
Municipalities 5 0 5
Cooperatives 4 0 4
Federal agencies 4 0 4
Native American tribes 24 0 24
Investor-owned utilities 0 1 1
Power marketers 0 0 0
New York
Power marketers 0 2 2
North Dakota
Municipalities 12 0 12
Cooperatives 7 0 7
State agencies 10 0 10
Irrigation districts 1 0 1
Native American tribes 5 0 5
Power marketers 0 1 1
Ohio
Power marketers 0 1 1
Oklahoma
Cooperatives 0 1 1
Federal agencies 0 1 1
Investor-owned utilities 0 1 1
Power marketers 0 1 1
Oregon
Federal agencies 0 1 1
Investor-owned utilities 0 1 1
Power marketers 0 2 2
Pennsylvania
Investor-owned utilities 0 1 1
Power Customer Count by State and Customer Category (FY 2014), continuedState/customer category Long-term Other Total
South Dakota
Municipalities 33 0 33
Cooperatives 5 0 5
Public utility districts 0 2 2
Federal agencies 1 0 1
State agencies 10 0 10
Native American tribes 8 0 8
Investor-owned utilities 1 1 2
Texas
Cooperatives 1 0 1
Investor-owned utilities 0 1 1
Power marketers 0 4 4
Utah
Municipalities 9 0 9
Cooperatives 1 0 1
Federal agencies 3 0 3
State agencies 3 0 3
Irrigation districts 0 1 1
Native American tribes 3 0 3
Washington
Federal agencies 0 0 0
Wyoming
Municipalities 2 0 2
Cooperatives 1 0 1
Federal agencies 1 0 1
Irrigation districts 2 0 2
Native American tribes 1 0 1
INTERNATIONAL
Canada
Power marketers 0 3 3
Subtotal 545 71 616
Interproject 0 5 5
Project use 77 0 77
Eliminations1 (13) (1) (14)
Total 609 75 6841 Double counting occurs when more than one project sells power to the same customer.

24
TOP 25 CUSTOMERS IN POWER SALES – FY 2014
Top 25 Long-term Power Sales Customers1
Rank Customer Energy (MWh) Percent of total sales
1 Sacramento Municipal Utility District 2,858,149 10.6
2 Tri-State Generation and Transmission Association 2,465,884 9.1
3 Colorado River Commission of Nevada 1,156,608 4.3
4 Metropolitan Water District of Southern California 1,105,975 4.1
5 Nebraska Public Power District 729,476 2.7
6 Arizona Power Authority 714,788 2.7
7 East River Electric Power Cooperative 700,634 2.6
8 Los Angeles 577,739 2.1
9 Platte River Power Authority 565,692 2.1
10 Salt River Project 475,551 1.8
11 Deseret Generation and Transmission 417,384 1.5
12 City of Redding 401,661 1.5
13 Utah Associated Municipal Power 390,181 1.4
14 Omaha Public Power District 379,194 1.4
15 Colorado Springs Utilities 368,663 1.4
16 Minnkota Power Cooperative 358,303 1.3
17 Northern California Power Agency 353,370 1.3
18 Central Montana Electric Cooperative 339,689 1.3
19 Department of Energy - Berkeley Site Office 338,676 1.3
20 Central Power Electric Cooperative 317,869 1.2
21 Upper Missouri Generation and Transmission Electric Cooperative 312,591 1.2
22 Navajo Tribal Utility Authority 307,707 1.1
23 Utah Municipal Power Agency 299,126 1.1
24 University of California, Davis 229,325 0.9
25 Moorhead 227,199 0.8
Top 25 long-term energy total 16,391,434 60.81 Excludes energy sales and power revenues from interdepartmental, interproject and project-use customers.
Top 25 Other Power Sales Customers1
Rank Customer Energy (MWh) Percent of total sales
1 Basin Electric Power Cooperative 1,947,425 36.4
2 Salt River Project 595,677 11.1
3 Northwestern Public Service 294,790 5.5
4 Macquarie Energy 278,010 5.2
5 Farmington 243,325 4.6
6 Electrical District No. 8 237,159 4.4
7 Miso Energy Market 229,958 4.3
8 Rainbow Energy Marketing Corporation 173,571 3.2
9 Los Alamos County 106,876 2.0
10 Black Hills Power and Light 90,282 1.7
11 Arizona Public Service Company 73,776 1.4
12 Harquahala Valley Power District 72,216 1.4
13 Page 70,585 1.3
14 PPL Energy Plus 67,883 1.3
15 California Independent System Operator Corporation 64,486 1.2
16 Heartland Consumers Power District 55,883 1.0
17 Morgan Stanley 55,652 1.0
18 McMullen Valley Water Conservation District 55,336 1.0
19 Sacramento Municipal Utility District 54,220 1.0
20 Central Arizona Water Conservation 43,412 0.8
21 Tri-State Generation and Transmission Association 41,261 0.8
22 The Energy Authority 40,894 0.8
23 Morgan Stanley Capital Group 38,732 0.7
24 Roosevelt Irrigation District 36,100 0.7
25 Cargill Power Marketers 33,433 0.6
Top 25 other energy total 5,000,942 93.41 Excludes energy sales and power revenues from interdepartmental, interproject and project-use customers.

25
TOP 25 CUSTOMERS IN POWER REVENUES – FY 2014
Top 25 Long-term Power Revenues Customers1
Rank Customer Revenue ($) Percent of total sales
1 Sacramento Municipal Utility District 137,056,659 15.5
2 Tri-State Generation and Transmission Association 84,282,495 9.5
3 Nebraska Public Power District 37,112,074 4.2
4 East River Electric Power Cooperative 22,081,276 2.5
5 Colorado River Commission of Nevada 18,481,370 2.1
6 Platte River Power Authority 16,668,899 1.9
7 Metropolitan Water District of Southern California 15,687,803 1.8
8 Los Angeles 15,443,213 1.7
9 City of Redding 14,810,231 1.7
10 Basin Electric Power Cooperative 14,648,678 1.7
11 Arizona Power Authority 14,564,889 1.6
12 Department of Energy - Berkeley Site Office 13,191,578 1.5
13 Deseret Generation and Transmission 12,505,462 1.4
14 Colorado Springs Utilities 12,318,702 1.4
15 Utah Associated Municipal Power 11,800,166 1.3
16 Omaha Public Power District 11,491,369 1.3
17 Central Montana Electric Cooperative 11,436,164 1.3
18 Northern California Power Agency 11,245,009 1.3
19 Minnkota Power Cooperative 11,215,044 1.3
20 Salt River Project 10,843,423 1.2
21 University of California, Davis 10,455,795 1.2
22 Upper Missouri Generation and Transmission Electric Cooperative 10,058,903 1.1
23 Central Power Electric Cooperative 9,980,081 1.1
24 Utah Municipal Power Agency 8,724,487 1.0
25 Lincoln 8,567,617 1.0
Top 25 long-term revenues total 544,671,387 61.61 Excludes energy sales and power revenues from interdepartmental, interproject and project-use customers.
Top 25 Other Power Revenues Customers1
Rank Customer Revenue ($) Percent of total sales
1 Basin Electric Power Cooperative 56,667,124 27.6
2 Salt River Project 45,348,196 22.1
3 Northwestern Public Service 13,288,335 6.5
4 Macquarie Energy 13,121,148 6.4
5 Farmington 10,965,642 5.3
6 Electrical District No. 8 8,629,158 4.2
7 Miso Energy Market 5,930,773 2.9
8 Los Alamos County 4,855,126 2.4
9 Rainbow Energy Marketing Corporation 3,158,805 1.5
10 California Independent System Operator Corporation 3,137,787 1.5
11 Sacramento Municipal Utility District 2,890,532 1.4
12 Page 2,628,169 1.3
13 Harquahala Valley Power District 2,617,821 1.3
14 Arizona Public Service Company 2,365,121 1.2
15 Morgan Stanley Capital Group 2,151,901 1.0
16 McMullen Valley Water Conservation District 1,989,559 1.0
17 Heartland Consumers Power District 1,961,190 1.0
18 Black Hills Power and Light 1,932,685 0.9
19 PPL Energy Plus 1,598,022 0.8
20 Tri-State Generation and Transmission Association 1,356,193 0.7
21 Southwest Power Pool 1,308,314 0.6
22 Roosevelt Irrigation District 1,254,227 0.6
23 Central Arizona Water Conservation 1,249,801 0.6
24 Morgan Stanley 1,210,433 0.6
25 Shell Energy North America 1,125,785 0.5
Top 25 other revenues total 192,741,847 93.91 Excludes energy sales and power revenues from interdepartmental, interproject and project-use customers.
26
REPAYMENT
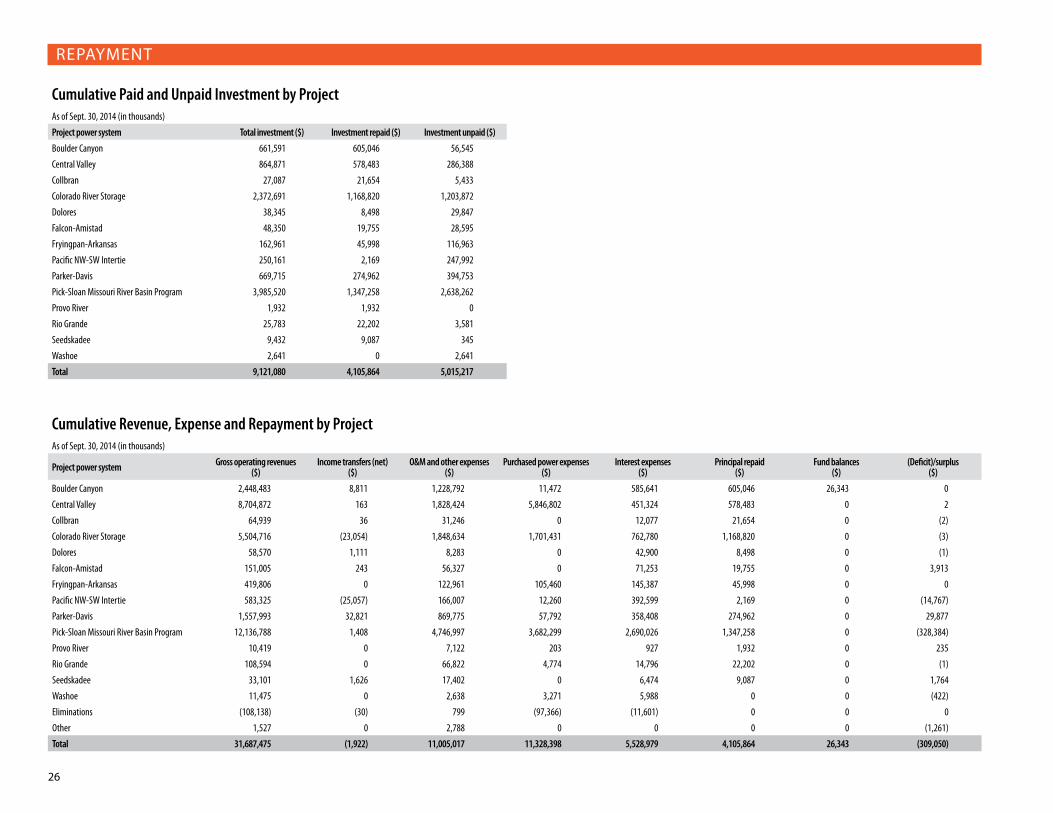
Cumulative Paid and Unpaid Investment by ProjectAs of Sept. 30, 2014 (in thousands)
Project power system Total investment ($) Investment repaid ($) Investment unpaid ($)
Boulder Canyon 661,591 605,046 56,545
Central Valley 864,871 578,483 286,388
Collbran 27,087 21,654 5,433
Colorado River Storage 2,372,691 1,168,820 1,203,872
Dolores 38,345 8,498 29,847
Falcon-Amistad 48,350 19,755 28,595
Fryingpan-Arkansas 162,961 45,998 116,963
Pacific NW-SW Intertie 250,161 2,169 247,992
Parker-Davis 669,715 274,962 394,753
Pick-Sloan Missouri River Basin Program 3,985,520 1,347,258 2,638,262
Provo River 1,932 1,932 0
Rio Grande 25,783 22,202 3,581
Seedskadee 9,432 9,087 345
Washoe 2,641 0 2,641
Total 9,121,080 4,105,864 5,015,217
Cumulative Revenue, Expense and Repayment by ProjectAs of Sept. 30, 2014 (in thousands)
Project power system Gross operating revenues ($)
Income transfers (net)($)
O&M and other expenses($)
Purchased power expenses($)
Interest expenses($)
Principal repaid($)
Fund balances($)
(Deficit)/surplus($)
Boulder Canyon 2,448,483 8,811 1,228,792 11,472 585,641 605,046 26,343 0
Central Valley 8,704,872 163 1,828,424 5,846,802 451,324 578,483 0 2
Collbran 64,939 36 31,246 0 12,077 21,654 0 (2)
Colorado River Storage 5,504,716 (23,054) 1,848,634 1,701,431 762,780 1,168,820 0 (3)
Dolores 58,570 1,111 8,283 0 42,900 8,498 0 (1)
Falcon-Amistad 151,005 243 56,327 0 71,253 19,755 0 3,913
Fryingpan-Arkansas 419,806 0 122,961 105,460 145,387 45,998 0 0
Pacific NW-SW Intertie 583,325 (25,057) 166,007 12,260 392,599 2,169 0 (14,767)
Parker-Davis 1,557,993 32,821 869,775 57,792 358,408 274,962 0 29,877
Pick-Sloan Missouri River Basin Program 12,136,788 1,408 4,746,997 3,682,299 2,690,026 1,347,258 0 (328,384)
Provo River 10,419 0 7,122 203 927 1,932 0 235
Rio Grande 108,594 0 66,822 4,774 14,796 22,202 0 (1)
Seedskadee 33,101 1,626 17,402 0 6,474 9,087 0 1,764
Washoe 11,475 0 2,638 3,271 5,988 0 0 (422)
Eliminations (108,138) (30) 799 (97,366) (11,601) 0 0 0
Other 1,527 0 2,788 0 0 0 0 (1,261)
Total 31,687,475 (1,922) 11,005,017 11,328,398 5,528,979 4,105,864 26,343 (309,050)

27
REPAYMENT
Western Hydroelectric Consolidated Status of Repayment (dollars in thousands)Cumulative 20131 ($) Adjustment ($) Annual 20142 ($) Cumulative 2014 ($)
REVENUE:
Gross operating revenue 30,185,346 272,108 1,230,022 31,687,476
Income transfers (net)3 954 0 (2,875) (1,921)
Total operating revenue 30,186,300 272,108 1,227,147 31,685,554
ExPENSES:
O&M and other 10,479,972 22,088 502,960 11,005,020
Purchase power and other 10,842,834 128,526 357,038 11,328,398
Interest
Federally financed 5,072,197 (5,269) 174,674 5,241,602
Non-federally financed 275,656 4,639 7,082 287,378
Total interest 5,347,853 (630) 181,756 5,528,979
Total expense 26,670,659 149,984 1,041,754 27,862,397
(Deficit)/surplus revenue (417,747) (3,207) 111,905 (309,049)
INVESTMENT:
Federally financed power 6,645,145 27,403 153,872 6,826,420
Non-federally financed power 243,173 0 2,669 245,842
Nonpower 2,041,648 6,396 775 2,048,819
Total investment 8,929,966 33,799 157,315 9,121,080
INVESTMENT REPAID:
Federally financed power 3,580,315 16,395 167,242 3,763,952
Non-federally financed power 150,588 20 14,417 165,025
Nonpower 168,311 3,493 5,083 176,887
Total investment repaid 3,899,214 19,908 186,742 4,105,864
INVESTMENT UNPAID:
Federally financed power 3,064,830 11,008 (13,370) 3,062,468
Non-federally financed power 92,585 (20) (11,748) 80,817
Nonpower 1,873,337 2,903 (4,308) 1,871,932
Total investment unpaid 5,030,752 13,891 (29,426) 5,015,217
FUND BALANCES:
Colorado River Dam Fund 31,174 105,423 (113,254) 23,343
Working capital 3,000 0 0 3,000
PERCENT OF INVESTMENT REPAID TO DATE:
Federal 53.88% 55.14%
Non-federal 61.93% 67.13%
Nonpower 8.24% 8.63%1 This column ties to the cumulative numbers on Page 27 of the FY 2013 Statistical Appendix.2 Based on FY 2014 Western combined financial statements of all hydroelectric power projects including Eliminations and Other totals. The status of repayment does not include gains and losses.3 Excludes 'Income transfer, net' for O&M.

28
MARKETING PLANS AND RATES
Active Rate Actions
Rate order number Project Type of rate action Date of notice of public participation Rate schedule designation
Effective date of rate (first day of first full
billing period)
Annual incremental ($ in thousands) Notes Date submitted to FERC Date of FERC confirmation
WAPA-143 Falcon-Amistad Renewal N/A N/A 6/8/2009 N/A Expires 6/7/2014 6/17/2009 12/17/2009
WAPA-149 Provo Renewal N/A N/A 4/01/2010 N/A Expires 3/31/2015 02/02/2010 11/2/2010
WAPA-150 Boulder Canyon Increase 2/2/2010 BCP-F8 10/1/2010 4,501 Power 9/16/2010 12/9/2010
WAPA-158 Central Arizona Extension 3/26/2013 CAP-FT2, CAP-NFT2, CAP-NITS2 1/1/2013 N/A None 3/25/2013 N/A
WAPA-160 Washoe Extension 2/22/2013 SNF-7 8/1/2008 N/A
FERC confirmed Washoe's formula rate extension on Sept. 5, 2013. Therefore, the formula rate is extended until Sept. 30, 2017.
4/24/2013 9/5/2013
WAPA-161Salt Lake City Area/Integrated Projects Firm power
Extension 9/8/2008 SLIP-F9 10/1/2008 21,283 N/A 9/4/2008 8/4/2009
WAPA-161 Colorado River Storage Transmission Extension 9/8/2008 SP-PTP7, SP-NW3,
SP-NFT6 10/1/2008 N/A N/A 9/4/2008 8/4/2009
WAPA-161 Colorado River Storage Ancillary services Extension 9/8/2008 SP-SD3, SP-RS3, SP-EI3,
SP-FR3, SP-SSR3 10/1/2008 N/A N/A 9/4/2008 8/4/2009
WAPA-163
Loveland Area Projects, Colorado River Storage, Pacific Northwest-Pacific Southwest Intertie, Central Arizona and Parker-Davis
New formula rates for use under WestConnect's Point-to-Point Regional Transmission Service Participation Agreement
11/6/2013 WC-8 6/1/2014 N/A N/A 12/4/2014 Pending
WAPA-164 Falcon-Amistad Extension N/A N/A 6/8/2014 N/A 5-year extension 5/2/2014 Pending

29
MARKETING PLANS AND RATES
Active Firm Power Rate Provisions (2014)Project Rate schedule designation Capacity charge
($/kW of billing demand)Energy charge not in excess ofdelivery
obligations Effective date Annual composite rate
Boulder Canyon BCP-F8 $1.87 10.09 mills/kWh 10/1/2013 20.18 mills/kWh
Central Valley1 CV-F13 NA NA 10/1/2013 68,217,809
Loveland Area Projects LF-9 5.43 20.71 mills/kWh 1/1/2010 41.42 mills/kWh
Parker Davis PD-F7 1.86-generation1.28-transmission 4.24 mills/kWh 10/1/2013 11.40 mills/kWh
Pick-Sloan Missouri River Basin Program—Eastern Division P-SED-F11 7.65 19.05 mills/kWhfor all energy 1/1/2010 33.25 mills/kWh
Salt Lake City Area/Integrated Projects SLIP-F9 5.18 12.19 10/1/2009 29.62 mills/kWh1 There are no provisions for energy and capacity rates under CV-F13, which provides for a Power Revenue Requirement allocation to all preference customers. Annual per-unit rates are not applicable under the formula rates above.
Custom Product PowerProject Fiscal year Rate schedule designation Capacity charge
($/kW of billing demand)Energy charge not in excess of delivery
obligations Effective date Annual composite rate
Central Valley 2014 CPP-2 N/A N/A 10/1/2013 Pass-through
Active Marketing PlansProject Expiration date
Boulder Canyon 9/30/2017
Central Valley 12/31/2024
Falcon-Amistad 6/8/2033
Loveland Area Projects 9/30/2024
Parker-Davis 9/30/2028
Provo River 9/30/2024
Pick-Sloan Missouri Basin Program—Eastern Division 12/31/2020
Salt Lake City Area/Integrated Projects 9/30/2024
Washoe 12/31/2024
Active Nonfirm Power Rate ProvisionsProject Fiscal year Rate schedule designation Capacity charge
($/kW of billing demand)Energy charge not in excess of delivery
obligations Effective date Annual composite rate
Washoe 2014 SNF-7 None Formula rate: Pursuant to contract, change monthly based on market 10/1/2013 N/A
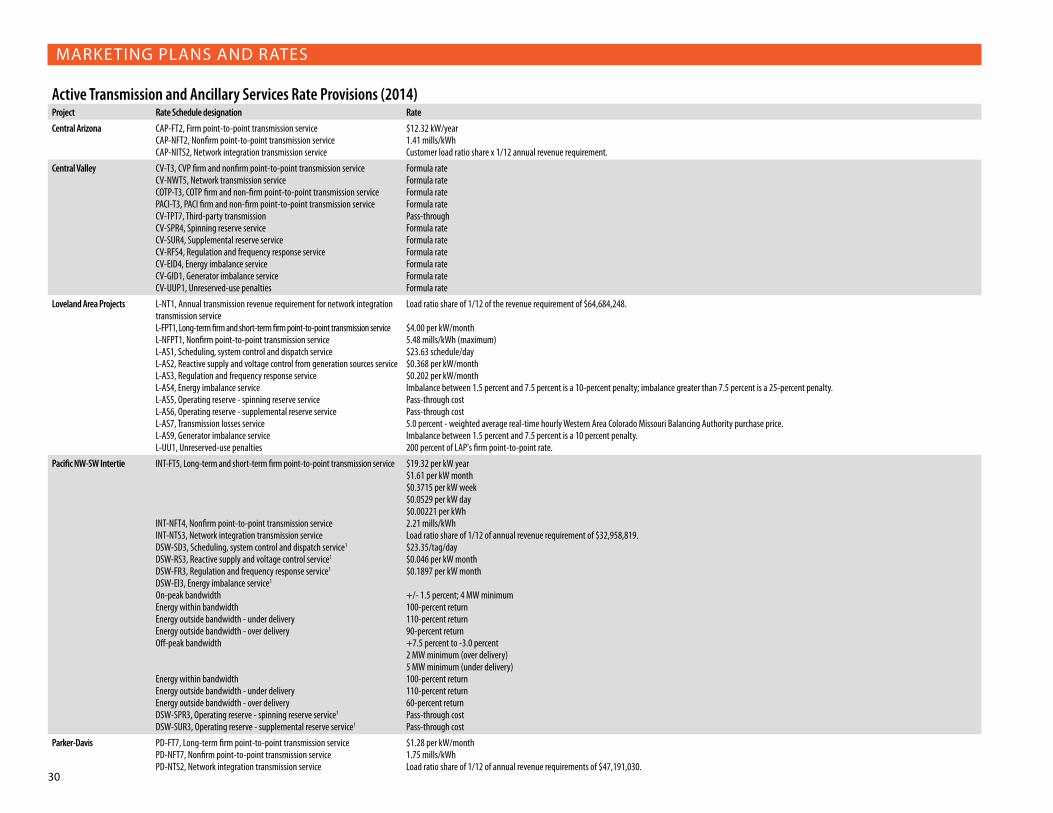
30
MARKETING PLANS AND RATES
Active Transmission and Ancillary Services Rate Provisions (2014)Project Rate Schedule designation Rate
Central Arizona CAP-FT2, Firm point-to-point transmission serviceCAP-NFT2, Nonfirm point-to-point transmission serviceCAP-NITS2, Network integration transmission service
$12.32 kW/year1.41 mills/kWhCustomer load ratio share x 1/12 annual revenue requirement.
Central Valley CV-T3, CVP firm and nonfirm point-to-point transmission serviceCV-NWT5, Network transmission serviceCOTP-T3, COTP firm and non-firm point-to-point transmission servicePACI-T3, PACI firm and non-firm point-to-point transmission serviceCV-TPT7, Third-party transmission CV-SPR4, Spinning reserve serviceCV-SUR4, Supplemental reserve serviceCV-RFS4, Regulation and frequency response serviceCV-EID4, Energy imbalance serviceCV-GID1, Generator imbalance serviceCV-UUP1, Unreserved-use penalties
Formula rateFormula rateFormula rateFormula ratePass-through Formula rateFormula rateFormula rateFormula rateFormula rateFormula rate
Loveland Area Projects L-NT1, Annual transmission revenue requirement for network integration transmission serviceL-FPT1, Long-term firm and short-term firm point-to-point transmission serviceL-NFPT1, Nonfirm point-to-point transmission serviceL-AS1, Scheduling, system control and dispatch serviceL-AS2, Reactive supply and voltage control from generation sources serviceL-AS3, Regulation and frequency response serviceL-AS4, Energy imbalance serviceL-AS5, Operating reserve - spinning reserve serviceL-AS6, Operating reserve - supplemental reserve serviceL-AS7, Transmission losses serviceL-AS9, Generator imbalance serviceL-UU1, Unreserved-use penalties
Load ratio share of 1/12 of the revenue requirement of $64,684,248.
$4.00 per kW/month5.48 mills/kWh (maximum)$23.63 schedule/day$0.368 per kW/month$0.202 per kW/monthImbalance between 1.5 percent and 7.5 percent is a 10-percent penalty; imbalance greater than 7.5 percent is a 25-percent penalty. Pass-through costPass-through cost5.0 percent - weighted average real-time hourly Western Area Colorado Missouri Balancing Authority purchase price.Imbalance between 1.5 percent and 7.5 percent is a 10 percent penalty.200 percent of LAP's firm point-to-point rate.
Pacific NW-SW Intertie INT-FT5, Long-term and short-term firm point-to-point transmission service
INT-NFT4, Nonfirm point-to-point transmission serviceINT-NTS3, Network integration transmission serviceDSW-SD3, Scheduling, system control and dispatch service1
DSW-RS3, Reactive supply and voltage control service1
DSW-FR3, Regulation and frequency response service1
DSW-El3, Energy imbalance service1
On-peak bandwidthEnergy within bandwidthEnergy outside bandwidth - under deliveryEnergy outside bandwidth - over deliveryOff-peak bandwidth
Energy within bandwidthEnergy outside bandwidth - under deliveryEnergy outside bandwidth - over deliveryDSW-SPR3, Operating reserve - spinning reserve service1
DSW-SUR3, Operating reserve - supplemental reserve service1
$19.32 per kW year$1.61 per kW month$0.3715 per kW week$0.0529 per kW day$0.00221 per kWh2.21 mills/kWhLoad ratio share of 1/12 of annual revenue requirement of $32,958,819.$23.35/tag/day$0.046 per kW month$0.1897 per kW month
+/- 1.5 percent; 4 MW minimum100-percent return110-percent return90-percent return+7.5 percent to -3.0 percent2 MW minimum (over delivery)5 MW minimum (under delivery)100-percent return110-percent return60-percent returnPass-through costPass-through cost
Parker-Davis PD-FT7, Long-term firm point-to-point transmission servicePD-NFT7, Nonfirm point-to-point transmission servicePD-NTS2, Network integration transmission service
$1.28 per kW/month1.75 mills/kWhLoad ratio share of 1/12 of annual revenue requirements of $47,191,030.
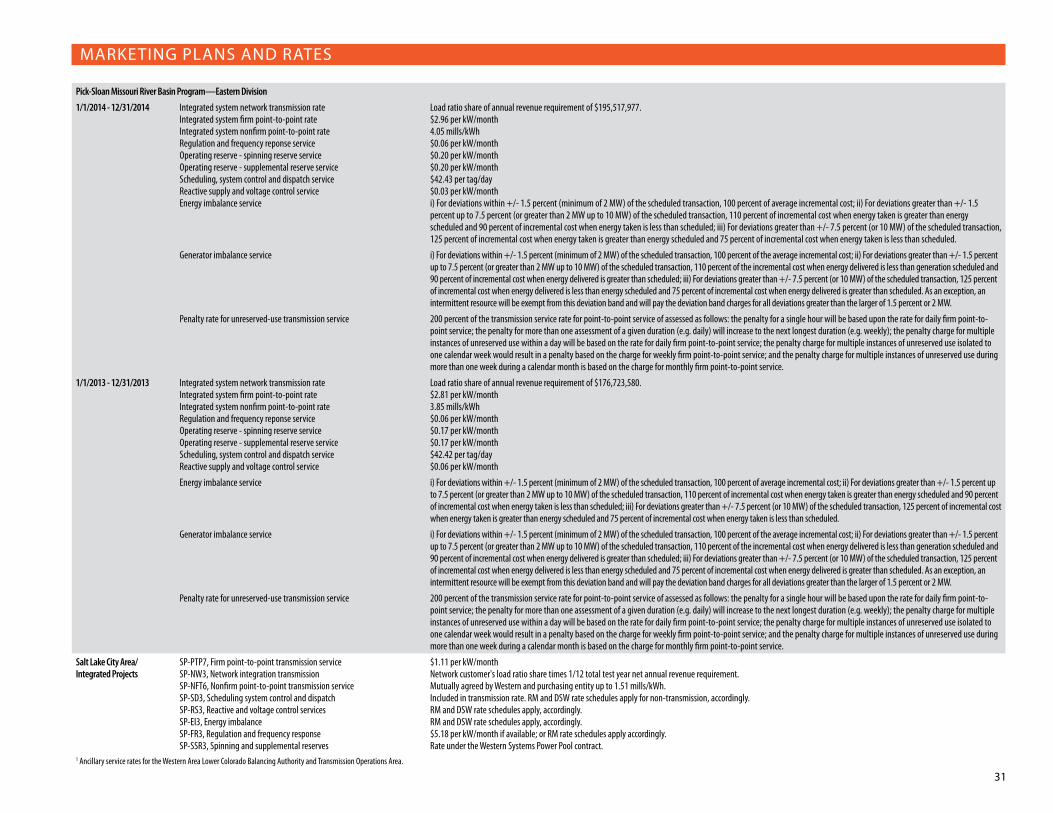
31
MARKETING PLANS AND RATES
Pick-Sloan Missouri River Basin Program—Eastern Division
1/1/2014 - 12/31/2014 Integrated system network transmission rateIntegrated system firm point-to-point rateIntegrated system nonfirm point-to-point rateRegulation and frequency reponse serviceOperating reserve - spinning reserve serviceOperating reserve - supplemental reserve serviceScheduling, system control and dispatch serviceReactive supply and voltage control serviceEnergy imbalance service
Load ratio share of annual revenue requirement of $195,517,977.$2.96 per kW/month4.05 mills/kWh$0.06 per kW/month$0.20 per kW/month$0.20 per kW/month$42.43 per tag/day$0.03 per kW/monthi) For deviations within +/- 1.5 percent (minimum of 2 MW) of the scheduled transaction, 100 percent of average incremental cost; ii) For deviations greater than +/- 1.5 percent up to 7.5 percent (or greater than 2 MW up to 10 MW) of the scheduled transaction, 110 percent of incremental cost when energy taken is greater than energy scheduled and 90 percent of incremental cost when energy taken is less than scheduled; iii) For deviations greater than +/- 7.5 percent (or 10 MW) of the scheduled transaction, 125 percent of incremental cost when energy taken is greater than energy scheduled and 75 percent of incremental cost when energy taken is less than scheduled.
Generator imbalance service i) For deviations within +/- 1.5 percent (minimum of 2 MW) of the scheduled transaction, 100 percent of the average incremental cost; ii) For deviations greater than +/- 1.5 percent up to 7.5 percent (or greater than 2 MW up to 10 MW) of the scheduled transaction, 110 percent of the incremental cost when energy delivered is less than generation scheduled and 90 percent of incremental cost when energy delivered is greater than scheduled; iii) For deviations greater than +/- 7.5 percent (or 10 MW) of the scheduled transaction, 125 percent of incremental cost when energy delivered is less than energy scheduled and 75 percent of incremental cost when energy delivered is greater than scheduled. As an exception, an intermittent resource will be exempt from this deviation band and will pay the deviation band charges for all deviations greater than the larger of 1.5 percent or 2 MW.
Penalty rate for unreserved-use transmission service 200 percent of the transmission service rate for point-to-point service of assessed as follows: the penalty for a single hour will be based upon the rate for daily firm point-to-point service; the penalty for more than one assessment of a given duration (e.g. daily) will increase to the next longest duration (e.g. weekly); the penalty charge for multiple instances of unreserved use within a day will be based on the rate for daily firm point-to-point service; the penalty charge for multiple instances of unreserved use isolated to one calendar week would result in a penalty based on the charge for weekly firm point-to-point service; and the penalty charge for multiple instances of unreserved use during more than one week during a calendar month is based on the charge for monthly firm point-to-point service.
1/1/2013 - 12/31/2013 Integrated system network transmission rateIntegrated system firm point-to-point rateIntegrated system nonfirm point-to-point rateRegulation and frequency reponse serviceOperating reserve - spinning reserve serviceOperating reserve - supplemental reserve serviceScheduling, system control and dispatch serviceReactive supply and voltage control service
Load ratio share of annual revenue requirement of $176,723,580.$2.81 per kW/month3.85 mills/kWh$0.06 per kW/month$0.17 per kW/month$0.17 per kW/month$42.42 per tag/day$0.06 per kW/month
Energy imbalance service i) For deviations within +/- 1.5 percent (minimum of 2 MW) of the scheduled transaction, 100 percent of average incremental cost; ii) For deviations greater than +/- 1.5 percent up to 7.5 percent (or greater than 2 MW up to 10 MW) of the scheduled transaction, 110 percent of incremental cost when energy taken is greater than energy scheduled and 90 percent of incremental cost when energy taken is less than scheduled; iii) For deviations greater than +/- 7.5 percent (or 10 MW) of the scheduled transaction, 125 percent of incremental cost when energy taken is greater than energy scheduled and 75 percent of incremental cost when energy taken is less than scheduled.
Generator imbalance service i) For deviations within +/- 1.5 percent (minimum of 2 MW) of the scheduled transaction, 100 percent of the average incremental cost; ii) For deviations greater than +/- 1.5 percent up to 7.5 percent (or greater than 2 MW up to 10 MW) of the scheduled transaction, 110 percent of the incremental cost when energy delivered is less than generation scheduled and 90 percent of incremental cost when energy delivered is greater than scheduled; iii) For deviations greater than +/- 7.5 percent (or 10 MW) of the scheduled transaction, 125 percent of incremental cost when energy delivered is less than energy scheduled and 75 percent of incremental cost when energy delivered is greater than scheduled. As an exception, an intermittent resource will be exempt from this deviation band and will pay the deviation band charges for all deviations greater than the larger of 1.5 percent or 2 MW.
Penalty rate for unreserved-use transmission service 200 percent of the transmission service rate for point-to-point service of assessed as follows: the penalty for a single hour will be based upon the rate for daily firm point-to-point service; the penalty for more than one assessment of a given duration (e.g. daily) will increase to the next longest duration (e.g. weekly); the penalty charge for multiple instances of unreserved use within a day will be based on the rate for daily firm point-to-point service; the penalty charge for multiple instances of unreserved use isolated to one calendar week would result in a penalty based on the charge for weekly firm point-to-point service; and the penalty charge for multiple instances of unreserved use during more than one week during a calendar month is based on the charge for monthly firm point-to-point service.
Salt Lake City Area/ Integrated Projects
SP-PTP7, Firm point-to-point transmission serviceSP-NW3, Network integration transmissionSP-NFT6, Nonfirm point-to-point transmission serviceSP-SD3, Scheduling system control and dispatchSP-RS3, Reactive and voltage control servicesSP-EI3, Energy imbalanceSP-FR3, Regulation and frequency responseSP-SSR3, Spinning and supplemental reserves
$1.11 per kW/monthNetwork customer's load ratio share times 1/12 total test year net annual revenue requirement.Mutually agreed by Western and purchasing entity up to 1.51 mills/kWh.Included in transmission rate. RM and DSW rate schedules apply for non-transmission, accordingly.RM and DSW rate schedules apply, accordingly.RM and DSW rate schedules apply, accordingly.$5.18 per kW/month if available; or RM rate schedules apply accordingly.Rate under the Western Systems Power Pool contract.
1 Ancillary service rates for the Western Area Lower Colorado Balancing Authority and Transmission Operations Area.

32
COMBINING STATEMENTS (by agency)
Combined Power System Balance SheetsAs of Sept. 30, 2014 and 2013 (in thousands)
FY 2014 FY 2013
Western Generating agencies Elimination Hydroelectric total Western Generating agencies Elimination Hydroelectric total
Assets
Completed utility plant $3,863,398 $3,373,569 $0 $7,236,967 $3,731,286 $3,327,361 $0 $7,058,647
Accumulated depreciation (1,889,283) (2,036,565) 0 (3,925,848) (1,808,226) (1,994,309) 0 (3,802,535)
Net completed plant 1,974,115 1,337,004 0 3,311,119 1,923,060 1,333,052 0 3,256,112
Construction work-in-progress 131,591 224,042 0 355,633 172,044 170,452 0 342,496
Net utility plant 2,105,706 1,561,046 0 3,666,752 2,095,104 1,503,504 0 3,598,608
Cash 933,539 344,509 0 1,278,048 860,126 338,351 0 1,198,477
Accounts receivable, net 145,108 2,899 0 148,007 151,380 5,301 (1,395) 155,286
Regulatory assets 62,555 81,479 0 144,034 64,847 69,447 0 134,294
Other assets 100,606 6,870 (227) 107,249 93,742 5,875 (1,369) 98,248
Total assets 3,347,514 1,996,803 (227) 5,344,090 3,265,199 1,922,478 (2,764) 5,184,913
Liabilities:
Long-term liabilities 41,197 53,047 0 94,244 45,534 64,795 0 110,329
Customer advances and other liabilities 103,693 49,053 (227) 152,519 95,079 46,177 (1,369) 139,887
Deferred revenue 0 119,904 0 119,904 0 0 0 0
Accounts payable 63,302 14,849 0 78,151 56,816 18,970 (1,395) 74,391
Environmental cleanup liabilities 10,760 1,306 0 12,066 10,679 2,291 0 12,970
Total liabilities 218,952 238,159 (227) 456,884 208,108 132,233 (2,764) 337,577
Capitalization:
Payable to U.S. Treasury 3,584,943 1,458,478 0 5,043,421 3,438,547 1,653,050 0 5,091,597
Accumulated net revenues (deficit) (456,381) 300,166 0 (156,215) (381,456) 137,195 0 (244,261)
Total capitalization 3,128,562 1,758,644 0 4,887,206 3,057,091 1,790,245 0 4,847,336
Total liabilities and capitalization $3,347,514 $1,996,803 ($227) $5,344,090 $3,265,199 $1,922,478 ($2,764) $5,184,913

33
COMBINING STATEMENTS (by agency)
Combined Power System Statement of Revenues and Expenses and Accumulated Net RevenuesFor the years ended Sept. 30, 2014 and 2013 (in thousands)
FY 2014 FY 2013
Western Generating agencies Elimination Hydroelectric total Western Generating agencies Elimination Hydroelectric total
Operating revenues:
Sales of electric power $895,062 $0 ($7,099) $887,963 $886,250 $0 ($6,913) $879,337
Transmission and other operating revenues 328,458 21,383 (7,783) 342,058 308,770 21,565 (5,796) 324,539
Gross operating revenues 1,223,520 21,383 (14,882) 1,230,021 1,195,020 21,565 (12,709) 1,203,876
Income transfers, net (446,248) 443,314 0 (2,934) (445,988) 445,421 (288) (855)
Total operating revenues 777,272 464,697 (14,882) 1,227,087 749,032 466,986 (12,997) 1,203,021
Operating expenses:
Operation and maintenance 216,337 231,897 0 448,234 210,594 230,506 0 441,100
Purchased power 295,831 0 (10,163) 285,668 239,023 0 (9,661) 229,362
Purchased transmission services 76,088 0 (4,719) 71,369 74,863 0 (3,336) 71,527
Depreciation 88,493 43,225 0 131,718 97,285 39,044 0 136,329
Administration and general 55,217 60 0 55,277 52,118 63 0 52,181
Total operating expenses 731,966 275,182 (14,882) 992,266 673,883 269,613 (12,997) 930,499
Net operating revenues 45,306 189,515 0 234,821 75,149 197,373 0 272,522
Interest expenses:
Interest on payable to U.S. Treasury 132,525 55,479 0 188,004 12,916 32,975 0 45,891
Allowance for funds used during construction (6,017) (7,313) 0 (13,330) (13,762) (6,948) 0 (20,710)
Net interest on payable to U.S. Treasury 126,508 48,166 0 174,674 (846) 26,027 0 25,181
Interest on long-term liabilities 1,621 5,461 0 7,082 1,936 6,060 0 7,996
Net interest expenses 128,129 53,627 0 181,756 1,090 32,087 0 33,177
Net revenues (deficit) (82,823) 135,888 0 53,065 74,059 165,286 0 239,345
Accumulated net revenues (deficit), beginning of year (381,456) 137,195 0 (244,261) (467,230) 41,248 0 (425,982)
Irrigation assistance 0 0 0 0 0 (69,911) 0 (69,911)
Change in capitalization 7,898 27,083 0 34,981 11,715 572 0 12,287
Accumulated net revenues (deficit), end of year ($456,381) $300,166 $0 ($156,215) ($381,456) $137,195 $0 ($244,261)
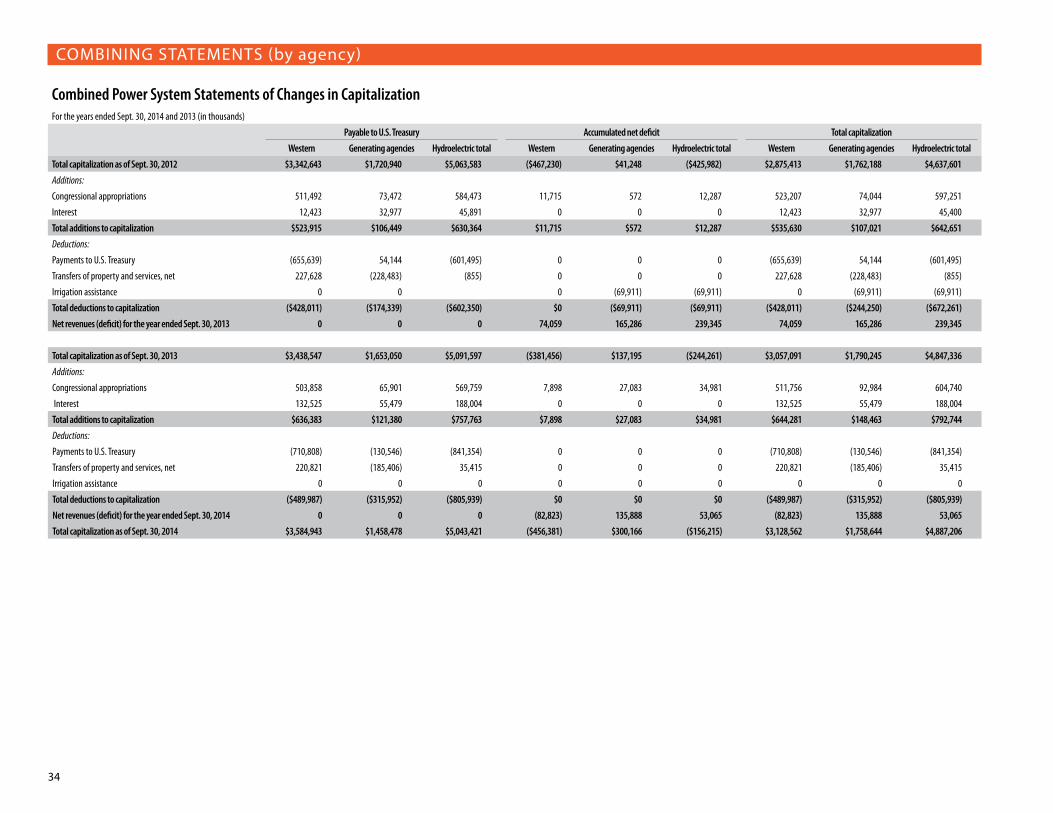
34
COMBINING STATEMENTS (by agency)
Combined Power System Statements of Changes in CapitalizationFor the years ended Sept. 30, 2014 and 2013 (in thousands)
Payable to U.S. Treasury Accumulated net deficit Total capitalization
Western Generating agencies Hydroelectric total Western Generating agencies Hydroelectric total Western Generating agencies Hydroelectric total
Total capitalization as of Sept. 30, 2012 $3,342,643 $1,720,940 $5,063,583 ($467,230) $41,248 ($425,982) $2,875,413 $1,762,188 $4,637,601
Additions:
Congressional appropriations 511,492 73,472 584,473 11,715 572 12,287 523,207 74,044 597,251
Interest 12,423 32,977 45,891 0 0 0 12,423 32,977 45,400
Total additions to capitalization $523,915 $106,449 $630,364 $11,715 $572 $12,287 $535,630 $107,021 $642,651
Deductions:
Payments to U.S. Treasury (655,639) 54,144 (601,495) 0 0 0 (655,639) 54,144 (601,495)
Transfers of property and services, net 227,628 (228,483) (855) 0 0 0 227,628 (228,483) (855)
Irrigation assistance 0 0 0 (69,911) (69,911) 0 (69,911) (69,911)
Total deductions to capitalization ($428,011) ($174,339) ($602,350) $0 ($69,911) ($69,911) ($428,011) ($244,250) ($672,261)
Net revenues (deficit) for the year ended Sept. 30, 2013 0 0 0 74,059 165,286 239,345 74,059 165,286 239,345
Total capitalization as of Sept. 30, 2013 $3,438,547 $1,653,050 $5,091,597 ($381,456) $137,195 ($244,261) $3,057,091 $1,790,245 $4,847,336
Additions:
Congressional appropriations 503,858 65,901 569,759 7,898 27,083 34,981 511,756 92,984 604,740
Interest 132,525 55,479 188,004 0 0 0 132,525 55,479 188,004
Total additions to capitalization $636,383 $121,380 $757,763 $7,898 $27,083 $34,981 $644,281 $148,463 $792,744
Deductions:
Payments to U.S. Treasury (710,808) (130,546) (841,354) 0 0 0 (710,808) (130,546) (841,354)
Transfers of property and services, net 220,821 (185,406) 35,415 0 0 0 220,821 (185,406) 35,415
Irrigation assistance 0 0 0 0 0 0 0 0 0
Total deductions to capitalization ($489,987) ($315,952) ($805,939) $0 $0 $0 ($489,987) ($315,952) ($805,939)
Net revenues (deficit) for the year ended Sept. 30, 2014 0 0 0 (82,823) 135,888 53,065 (82,823) 135,888 53,065
Total capitalization as of Sept. 30, 2014 $3,584,943 $1,458,478 $5,043,421 ($456,381) $300,166 ($156,215) $3,128,562 $1,758,644 $4,887,206
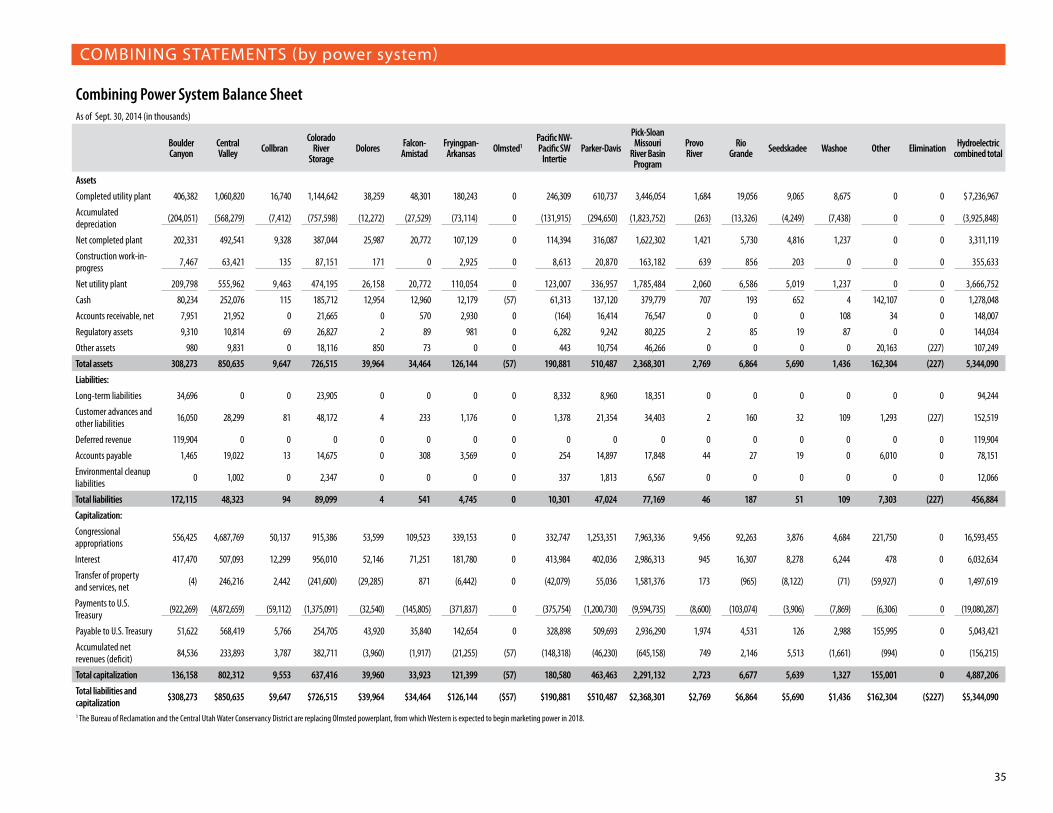
35
COMBINING STATEMENTS (by power system)
Combining Power System Balance SheetAs of Sept. 30, 2014 (in thousands)
Boulder Canyon
Central Valley Collbran
Colorado River
StorageDolores Falcon-
AmistadFryingpan-Arkansas Olmsted1
Pacific NW-Pacific SW
IntertieParker-Davis
Pick-Sloan Missouri
River Basin Program
Provo River
Rio Grande Seedskadee Washoe Other Elimination Hydroelectric
combined total
Assets
Completed utility plant 406,382 1,060,820 16,740 1,144,642 38,259 48,301 180,243 0 246,309 610,737 3,446,054 1,684 19,056 9,065 8,675 0 0 $ 7,236,967
Accumulated depreciation (204,051) (568,279) (7,412) (757,598) (12,272) (27,529) (73,114) 0 (131,915) (294,650) (1,823,752) (263) (13,326) (4,249) (7,438) 0 0 (3,925,848)
Net completed plant 202,331 492,541 9,328 387,044 25,987 20,772 107,129 0 114,394 316,087 1,622,302 1,421 5,730 4,816 1,237 0 0 3,311,119
Construction work-in-progress 7,467 63,421 135 87,151 171 0 2,925 0 8,613 20,870 163,182 639 856 203 0 0 0 355,633
Net utility plant 209,798 555,962 9,463 474,195 26,158 20,772 110,054 0 123,007 336,957 1,785,484 2,060 6,586 5,019 1,237 0 0 3,666,752
Cash 80,234 252,076 115 185,712 12,954 12,960 12,179 (57) 61,313 137,120 379,779 707 193 652 4 142,107 0 1,278,048
Accounts receivable, net 7,951 21,952 0 21,665 0 570 2,930 0 (164) 16,414 76,547 0 0 0 108 34 0 148,007
Regulatory assets 9,310 10,814 69 26,827 2 89 981 0 6,282 9,242 80,225 2 85 19 87 0 0 144,034
Other assets 980 9,831 0 18,116 850 73 0 0 443 10,754 46,266 0 0 0 0 20,163 (227) 107,249
Total assets 308,273 850,635 9,647 726,515 39,964 34,464 126,144 (57) 190,881 510,487 2,368,301 2,769 6,864 5,690 1,436 162,304 (227) 5,344,090
Liabilities:
Long-term liabilities 34,696 0 0 23,905 0 0 0 0 8,332 8,960 18,351 0 0 0 0 0 0 94,244
Customer advances and other liabilities 16,050 28,299 81 48,172 4 233 1,176 0 1,378 21,354 34,403 2 160 32 109 1,293 (227) 152,519
Deferred revenue 119,904 0 0 0 0 0 0 0 0 0 0 0 0 0 0 0 0 119,904
Accounts payable 1,465 19,022 13 14,675 0 308 3,569 0 254 14,897 17,848 44 27 19 0 6,010 0 78,151
Environmental cleanup liabilities 0 1,002 0 2,347 0 0 0 0 337 1,813 6,567 0 0 0 0 0 0 12,066
Total liabilities 172,115 48,323 94 89,099 4 541 4,745 0 10,301 47,024 77,169 46 187 51 109 7,303 (227) 456,884
Capitalization:
Congressional appropriations 556,425 4,687,769 50,137 915,386 53,599 109,523 339,153 0 332,747 1,253,351 7,963,336 9,456 92,263 3,876 4,684 221,750 0 16,593,455
Interest 417,470 507,093 12,299 956,010 52,146 71,251 181,780 0 413,984 402,036 2,986,313 945 16,307 8,278 6,244 478 0 6,032,634
Transfer of property and services, net (4) 246,216 2,442 (241,600) (29,285) 871 (6,442) 0 (42,079) 55,036 1,581,376 173 (965) (8,122) (71) (59,927) 0 1,497,619
Payments to U.S. Treasury (922,269) (4,872,659) (59,112) (1,375,091) (32,540) (145,805) (371,837) 0 (375,754) (1,200,730) (9,594,735) (8,600) (103,074) (3,906) (7,869) (6,306) 0 (19,080,287)
Payable to U.S. Treasury 51,622 568,419 5,766 254,705 43,920 35,840 142,654 0 328,898 509,693 2,936,290 1,974 4,531 126 2,988 155,995 0 5,043,421
Accumulated net revenues (deficit) 84,536 233,893 3,787 382,711 (3,960) (1,917) (21,255) (57) (148,318) (46,230) (645,158) 749 2,146 5,513 (1,661) (994) 0 (156,215)
Total capitalization 136,158 802,312 9,553 637,416 39,960 33,923 121,399 (57) 180,580 463,463 2,291,132 2,723 6,677 5,639 1,327 155,001 0 4,887,206
Total liabilities and capitalization $308,273 $850,635 $9,647 $726,515 $39,964 $34,464 $126,144 ($57) $190,881 $510,487 $2,368,301 $2,769 $6,864 $5,690 $1,436 $162,304 ($227) $5,344,090
1 The Bureau of Reclamation and the Central Utah Water Conservancy District are replacing Olmsted powerplant, from which Western is expected to begin marketing power in 2018.

36
COMBINING STATEMENTS (by power system)
Combining Power System Balance SheetAs of Sept. 30, 2013 (in thousands)
Boulder Canyon
Central Valley Collbran Colorado
River Storage Dolores Falcon-Amistad
Fryingpan-Arkansas
Pacific NW-SW Intertie Parker-Davis
Pick-Sloan Missouri
River Basin Program
Provo River
Rio Grande Seedskadee Washoe Other Elimination
Hydroelectric combined
total
Assets:
Completed utility plant $406,382 $1,013,651 $10,993 $1,161,093 $38,188 $48,143 $158,907 $240,330 $569,142 $3,373,736 $1,684 $18,977 $8,746 $8,675 $0 $0 $7,058,647
Accumulated depreciation (199,213) (543,498) (7,347) (738,654) (11,683) (26,651) (70,872) (126,249) (282,136) (1,771,548) (248) (13,043) (4,082) (7,311) 0 0 (3,802,535)
Net completed plant 207,169 470,153 3,646 422,439 26,505 21,492 88,035 114,081 287,006 1,602,188 1,436 5,934 4,664 1,364 0 0 3,256,112
Construction work-in-progress 5,970 79,376 5,809 58,155 409 68 828 7,133 52,926 130,732 220 376 494 0 0 0 342,496
Net utility plant 213,139 549,529 9,455 480,594 26,914 21,560 88,863 121,214 339,932 1,732,920 1,656 6,310 5,158 1,364 0 0 3,598,608
Cash 65,542 232,402 310 226,026 10,229 10,369 4,887 60,210 111,868 380,143 1,057 125 1,470 40 93,799 0 1,198,477
Accounts receivable, net 10,524 21,165 0 32,622 0 674 3,016 384 16,444 71,639 26 0 0 141 46 (1,395) 155,286
Regulatory assets 8,952 10,171 88 29,512 10 102 920 7,268 8,880 68,218 2 84 41 46 0 0 134,294
Other assets 856 10,217 0 16,616 342 124 0 701 10,574 45,864 0 0 0 0 14,323 (1,369) 98,248
Total assets $299,013 $823,484 $9,853 $785,370 $37,495 $32,829 $97,686 $189,777 $487,698 $2,298,784 $2,741 $6,519 $6,669 $1,591 $108,168 ($2,764) $5,184,913
Liabilities:
Long-term liabilities 46,025 0 0 24,049 0 0 0 10,138 9,657 20,460 0 0 0 0 0 0 110,329
Customer advances and other liabilities 17,526 20,052 119 47,103 107 350 1,283 1,549 13,855 37,978 1265 215 46 72 876 (1,369) 139,887
Accounts payable 2,468 23,257 163 12,258 12 319 567 219 12,985 18,013 23 0 0 1 5,501 (1,395) 74,391
Environmental cleanup liabilities 0 907 17 2,863 4 0 19 331 2,012 6,799 0 0 18 0 0 0 12,970
Total liabilities 66,019 44,216 299 86,273 123 669 1,869 12,237 38,509 83,250 148 215 64 73 6,377 (2,764) 337,577
Capitalization:
Congressional appropriations 553,931 4,522,473 48,560 1,000,599 52,863 104,156 301,781 321,956 1,224,123 7,619,417 9,061 89,505 4,443 4,817 165,487 0 16,023,172
Interest 412,307 495,776 12,243 951,345 50,295 69,423 177,983 396,639 380,906 2,866,174 936 16,213 8,292 6,144 478 0 5,845,154
Transfer of property and services, net (4) 248,301 2,442 (267,633) (29,244) 582 (6,450) (42,627) 43,122 1,580,098 173 (965) (7,930) (71) (57,590) 0 1,462,204
Payments to U.S. Treasury (791,122) (4,744,557) (58,194) (1,359,676) (32,540) (138,685) (352,956) (347,498) (1,176,895) (9,110,734) (8,325) (100,548) (3,906) (7,362) (5,935) 0 (18,238,933)
Payable to U.S. Treasury 175,112 521,993 5,051 324,635 41,374 35,476 120,358 328,470 471,256 2,954,955 1,845 4,205 899 3,528 102,440 0 5,091,597
Accumulated net revenues (deficit) 57,882 257,275 4,503 374,462 (4,002) (3,316) (24,541) (150,930) (22,067) (739,421) 748 2,099 5,706 (2,010) (649) 0 (244,261)
Total capitalization 232,994 779,268 9,554 699,097 37,372 32,160 95,817 177,540 449,189 2,215,534 2,593 6,304 6,605 1,518 101,791 0 4,847,336
Total liabilities and capitalization $299,013 $823,484 $9,853 $785,370 $37,495 $32,829 $97,686 $189,777 $487,698 $2,298,784 $2,741 $6,519 $6,669 $1,591 $108,168 ($2,764) $5,184,913

37
COMBINING STATEMENTS (by power system)
Combining Power System Statement of Revenues and Expenses and Accumulated Net RevenuesFor the year ended Sept. 30, 2014 (in thousands)
Boulder Canyon
Central Valley Collbran Colorado
River Storage Dolores Falcon-Amistad
Fryingpan-Arkansas Olmsted1
Pacific NW-Pacific SW
IntertieParker-Davis
Pick-Sloan Missouri
River Basin Program
Provo River
Rio Grande Seedskadee Washoe Other Elimination
Hydroelectric combined
total
Operating revenues:Sales of electric power 76,105 119,305 918 163,625 3,182 6,845 15,728 0 0 12,147 494,371 249 2,527 62 215 (217) (7,099) $ 887,963 Transmission and other operating revenues 20,625 69,940 43 26,957 0 0 4,245 0 42,321 52,134 132,595 0 0 48 472 461 (7,783) 342,058
Gross operating revenues 96,730 189,245 961 190,582 3,182 6,845 19,973 0 42,321 64,281 626,966 249 2,527 110 687 244 (14,882) 1,230,021 Income transfers, net (106) 0 0 (2,363) (114) 0 0 (57) (3,936) 2,617 (1) 0 0 1,026 0 0 0 (2,934)Total operating revenues 96,624 189,245 961 188,219 3,068 6,845 19,973 (57) 38,385 66,898 626,965 249 2,527 1,136 687 244 (14,882) 1,227,087 Operating expenses:Operation and maintenance 56,812 86,173 1,594 65,927 444 2,478 5,532 0 6,769 40,168 178,286 231 2,078 943 12 787 0 448,234
Purchased power 0 41,780 0 78,834 0 0 631 0 3,425 4,699 166,255 0 0 0 207 0 (10,163) 285,668 Purchased transmission services 0 50,468 0 6,333 0 0 4,476 0 0 0 14,811 0 0 0 0 0 (4,719) 71,369
Depreciation 4,838 25,049 64 19,410 631 878 2,245 0 5,742 12,655 59,589 14 283 194 126 0 0 131,718 Administration and general 0 13,549 13 9,231 1 65 166 0 1,590 7,547 23,100 2 3 7 3 0 0 55,277
Total operating expenses 61,650 217,019 1,671 179,735 1,076 3,421 13,050 0 17,526 65,069 442,041 247 2,364 1,144 348 787 (14,882) 992,266 Net operating revenues (deficit) 34,974 (27,774) (710) 8,484 1,992 3,424 6,923 (57) 20,859 1,829 184,924 2 163 (8) 339 (543) 0 234,821
Interest expenses:Interest on payable to U.S. Treasury 5,163 11,384 56 4,666 1,851 1,828 3,796 0 17,801 21,131 120,139 9 94 (14) 100 0 0 188,004
Allowance for funds used during construction 0 (1,854) (50) (5,024) 99 0 (159) 0 (348) (549) (5,658) (8) 22 199 0 0 0 (13,330)
Net interest on payable to U.S. Treasury 5,163 9,530 6 (358) 1,950 1,828 3,637 0 17,453 20,582 114,481 1 116 185 100 0 0 174,674
Interest on long-term liabilities 3,383 0 0 593 0 0 0 0 794 130 2,182 0 0 0 0 0 0 7,082
Net interest expense 8,546 9,530 6 235 1,950 1,828 3,637 0 18,247 20,712 116,663 1 116 185 100 0 0 181,756 Net revenues (deficit) 26,428 (37,304) (716) 8,249 42 1,596 3,286 (57) 2,612 (18,883) 68,261 1 47 (193) 239 (543) 0 53,065 Accumulated net revenues (deficit), beginning of year
57,882 257,275 4,503 374,462 (4,002) (3,316) (24,541) 0 (150,930) (22,067) (739,421) 748 2,099 5,706 (2,010) (649) 0 (244,261)
Irrigation assistance 0 0 0 0 0 0 0 0 0 0 0 0 0 0 0 0 0 0 Change in capitalization 226 13,922 0 0 0 (197) 0 0 0 (5,280) 26,002 0 0 0 110 198 0 34,981 Accumulated net revenues (deficit), end of year
$84,536 $233,893 $3,787 $382,711 ($3,960) ($1,917) ($21,255) ($57) ($148,318) ($46,230) ($645,158) $749 $2,146 $5,513 ($1,661) ($994) $0 ($156,215)
1 The Bureau of Reclamation and the Central Utah Water Conservancy District are replacing Olmsted powerplant, from which Western is expected to begin marketing power in 2018.

38
COMBINING STATEMENTS (by power system)
Combining Power System Statement of Revenues and Expenses and Accumulated Net RevenuesFor the year ended Sept. 30, 2013 (in thousands)
Boulder Canyon
Central Valley Collbran Colorado
River Storage Dolores Falcon-Amistad
Fryingpan-Arkansas
Pacific NW-SW Intertie Parker-Davis
Pick-Sloan Missouri
River Basin Program
Provo River
Rio Grande Seedskadee Washoe Other Elimination
Hydroelectric combined
total
Operating revenues:
Sales of electric power $82,379 $142,981 $1,072 $161,855 $3,112 $8,084 $16,003 $0 $12,020 $455,127 $308 $1,446 $1,603 $208 $52 ($6,913) $879,337
Transmission and other operating revenues 15,362 71,053 42 29,353 23 0 4,581 37,340 48,624 122,849 0 189 20 472 427 (5,796) 324,539
Gross operating revenues 97,741 214,034 1,114 191,208 3,135 8,084 20,584 37,340 60,644 577,976 308 1,635 1,623 680 479 (12,709) 1,203,876
Income transfers, net 289 0 0 747 (87) (14) 0 (2,174) 1,332 0 0 0 (660) 0 0 (288) (855)
Total operating revenues 98,030 214,034 1,114 191,955 3,048 8,070 20,584 35,166 61,976 577,976 308 1,635 963 680 479 (12,997) 1,203,021
Operating expenses:
Operation and maintenance 63,299 84,894 999 64,285 838 3,047 5,332 6,880 31,866 174,866 109 2,575 924 69 1,117 0 441,100
Purchased power 0 38,552 0 66,289 0 0 707 3,166 5,809 124,303 0 0 0 197 0 (9,661) 229,362
Purchased transmission services 0 47,640 0 9,115 0 0 4,371 0 0 13,737 0 0 0 0 0 (3,336) 71,527
Depreciation 5,021 13,027 174 18,685 602 873 1,602 5,746 11,492 79,287 (402) 33 391 (202) 0 0 136,329
Administration and general 0 13,151 5 8,492 35 66 133 1,448 6,863 21,967 3 4 11 3 0 0 52,181
Total operating expenses 68,320 197,264 1,178 166,866 1,475 3,986 12,145 17,240 56,030 414,160 (290) 2,612 1,326 67 1,117 (12,997) 930,499
Net operating revenues (deficit) 29,710 16,770 (64) 25,089 1,573 4,084 8,439 17,926 5,946 163,816 598 (977) (363) 613 (638) 0 272,522
Interest expenses:
Interest on payable to U.S. Treasury 11,189 15,700 116 (127,801) 1,850 1,868 3,844 18,017 2,400 118,436 2 107 36 127 0 0 45,891
Allowance for funds used during construction 0 (6,936) (123) (4,408) (19) 0 (13) (338) (2,204) (6,543) (2) (91) (33) 0 0 0 (20,710)
Net interest on payable to U.S. Treasury 11,189 8,764 (7) (132,209) 1,831 1,868 3,831 17,679 196 111,893 0 16 3 127 0 0 25,181
Interest on long-term liabilities 3,940 0 0 604 0 0 0 941 154 2,357 0 0 0 0 0 0 7,996
Net interest expenses 15,129 8,764 (7) ($131,605) $1,831 $1,868 $3,831 $18,620 $350 $114,250 $0 $16 $3 $127 $0 $0 $33,177
Net revenues (deficit) 14,581 8,006 (57) $156,694 ($258) $2,216 $4,608 ($694) $5,596 $49,566 $598 ($993) ($366) $486 ($638) $0 $239,345
Accumulated net revenues (deficit), beginning of year 40,592 253,771 4,560 $217,768 ($3,744) ($5,516) ($29,149) ($150,236) ($32,943) ($727,793) 150 $3,092 $6,072 ($2,579) ($27) $0 ($425,982)
Irrigation assistance 0 0 0 0 0 0 0 0 0 (69,911) 0 0 0 0 0 0 (69,911)
Change in capitalization 2,709 (4,502) 0 0 0 (16) 0 0 5,280 8,717 0 0 0 83 16 0 12,287
Accumulated net revenues (deficit), end of year $57,882 $257,275 $4,503 $374,462 ($4,002) ($3,316) ($24,541) ($150,930) ($22,067) ($739,421) $748 $2,099 $5,706 ($2,010) ($649) $0 ($244,261)

39
OPERATING EXPENSES (dollars in millions)
Operation and Maintenance, Administrative and GeneralPower system FY 2010 FY 2011 FY 2012 FY 2013 FY 2014 Average
Boulder Canyon $56 $56 $60 $63 $57 $58
Central Valley 86 89 94 98 100 93
Collbran 1 1 6 1 2 2
Colorado River Storage 74 76 79 73 75 75
Dolores 1 1 0 1 0 1
Falcon-Amistad 3 3 4 3 3 3
Fryingpan-Arkansas 9 6 6 5 6 6
Pacific NW-SW Intertie 7 6 8 8 8 7
Parker-Davis 33 30 41 39 48 38
Pick-Sloan Missouri River Basin Program 191 198 219 197 201 201
Provo River 0 0 0 0 0 0
Rio Grande 2 3 3 3 2 3
Seedskadee 1 1 1 1 1 1
Washoe 0 0 0 0 0 0
Other hydro projects (1) 0 0 1 1 0
Total $463 $470 $521 $493 $504 $488
Purchased PowerPower system FY 2010 FY 2011 FY 2012 FY 2013 FY 2014 Average
Central Valley $49 $41 $33 $39 $42 $41
Colorado River Storage 26 37 33 66 79 48
Fryingpan-Arkansas 1 1 0 1 1 1
Pacific NW-SW Intertie 3 4 3 3 3 3
Parker-Davis 4 3 4 6 5 4
Pick-Sloan Missouri River Basin Program 180 116 89 124 166 135
Washoe 0 0 0 0 0 0
Total $263 $202 $162 $239 $296 $232
Purchased Transmission ServicesPower system FY 2010 FY 2011 FY 2012 FY 2013 FY 2014 Average
Central Valley $29 $41 $42 $48 $51 $42
Colorado River Storage 10 10 10 9 6 9
Fryingpan-Arkansas 4 4 4 4 4 4
Parker-Davis 1 0 0 0 0 0
Pick-Sloan Missouri River Basin Program 10 12 12 14 15 13
Total $54 $67 $68 $75 $76 $68
InterestPower system FY 2010 FY 2011 FY 2012 FY 2013 FY 2014 Average
Boulder Canyon $17 $16 $16 $15 $9 $15
Central Valley 6 5 7 9 9 7
Collbran 0 0 0 0 0 0
Colorado River Storage 19 14 6 (132) 0 (19)
Dolores 2 2 2 2 2 2
Falcon-Amistad 2 2 2 2 2 2
Fryingpan-Arkansas 4 4 4 4 4 4
Pacific NW-SW Intertie 19 19 19 19 18 19
Parker-Davis 16 16 19 0 21 14
Pick-Sloan Missouri River Basin Program 127 125 125 114 117 122
Provo River 0 0 0 0 0 0
Rio Grande 0 0 0 0 0 0
Seedskadee 0 0 0 0 0 0
Washoe 0 0 0 0 0 0
Total $212 $203 $200 $33 $182 $166

40
SUMMARY OF POWER SYSTEM COMPLETED PLANT
CONSTRUCTION WORK-IN-PROGRESS
Summary of Power System Completed Utility PlantAs of Sept. 30, 2014 (in thousands)
Power systemGenerating facilities Western transmission facilities
Reclamation Corps IBWC Transmission Substation Other Converter station Total completed plant
Boulder Canyon $373,643 $0 $0 $11,488 $21,251 $0 $0 $406,382
Central Valley 593,861 0 0 215,445 195,952 55,562 0 1,060,820
Collbran 16,183 0 0 135 349 73 0 16,740
Colorado River Storage 490,512 0 0 211,661 309,426 133,043 0 1,144,642
Dolores 28,944 0 0 0 8,490 825 0 38,259
Falcon-Amistad 0 0 48,301 0 0 0 0 48,301
Fryingpan-Arkansas 172,887 0 0 2,042 0 5,314 0 180,243
Pacific NW-SW Intertie 0 0 0 165,933 77,038 3,338 0 246,309
Parker-Davis 106,382 0 0 184,422 229,129 90,804 0 610,737
Pick-Sloan Missouri River Basin Program 480,564 1,025,600 0 815,830 844,491 218,826 60,743 3,446,054
Provo River 1,505 0 0 179 0 0 0 1,684
Rio Grande 19,043 0 0 0 13 0 0 19,056
Seedskadee 7,685 0 0 1,366 0 14 0 9,065
Washoe 8,459 0 0 0 216 0 0 8,675
Total $2,299,668 $1,025,600 $48,301 $1,608,501 $1,686,355 $507,799 $60,743 $7,236,967
Construction Work-In-ProgressAs of Sept. 30, 2014 (in thousands)
Power systemGenerating facilities Western transmission facilities
Reclamation Corps IBWC Transmission Substation Other Converter station Total CWIP
Boulder Canyon $7,467 $0 $0 $0 $0 $0 $0 $7,467
Central Valley 56,584 0 0 2,252 3,632 953 0 63,421
Collbran 17 0 0 0 118 0 0 135
Colorado River Storage 67,105 0 0 309 17,221 2,516 0 87,151
Dolores 0 0 0 0 163 8 0 171
Falcon-Amistad 0 0 0 0 0 0 0 0
Fryingpan-Arkansas 2,925 0 0 0 0 0 0 2,925
Pacific NW-SW Intertie 0 0 0 8,044 569 0 0 8,613
Parker-Davis 5,077 0 0 9,392 6,389 12 0 20,870
Pick-Sloan Missouri River Basin Program 15,494 67,675 0 17,855 48,846 13,304 8 163,182
Provo River 639 0 0 0 0 0 0 639
Rio Grande 856 0 0 0 0 0 0 856
Seedskadee 203 0 0 0 0 0 0 203
Total $156,367 $67,675 $0 $37,852 $76,938 $16,793 $8 $355,633

41
PROJECT DATA
BOULDER CANYON PROJECT
Hoover Dam, the highest and third-largest concrete dam in the United States, sits on the Colorado River along the Arizona-Nevada border . Lake Mead, the reservoir behind Hoover Dam, is still the nation’s largest man-made reservoir . It can hold a two-year supply of the average flow of the Colorado River with its live storage capacity of 27 .62 million acre-feet .
This enormous project began with 1928 legislation approving construction of the Boulder Canyon Project . Hoover Powerplant has 19 generating units (two for plant use) and an installed capacity of 2,078,800 kilowatts (4,800 kW for plant use) . High-voltage transmis-sion lines and substations make it possible for people from southern Nevada, Arizona and southern California to receive power from the project .
Since the start of commercial power generation in 1936, Hoover, with yearly average generation of 4 .3 billion kilowatt-hours, has served the annual electrical needs of nearly 1 .3 million people . This power is marketed under the Hoover Power Plant Act of 1984 and the 1984 Conformed General Consolidated Power Marketing Criteria or Regulations for Boulder City Area Projects . Western’s Desert Southwest region markets and transmits BCP power .
The Hoover Power Plant Act of 1984 sets forth the amounts of Hoover power to be sold to customers from June 1, 1987, to Sept 30, 2017 . The marketing criteria have been amended to reflect the act’s provisions . On Dec . 20, 2011, the Hoover Power Allocation Act of 2011, or HPPA, was enacted by Congress, providing Western guidance in the allocation of BCP power for the next 50 years after the current contracts expire .
Power from the BCP is marketed as long-term contingent capacity with associated firm energy . This means that Western is obli-gated to deliver the energy that can be generated from the available capacity, which is highly dependent on the elevation of Lake Mead . If sufficient power to support the customer capacity entitlements is not available, each customer’s capacity entitlement is temporarily reduced on a pro-rata basis . Customers are entitled to receive 4 .527 billion kWh of firm energy (associated with contingent capacity) each year . If generation at Hoover Powerplant is insuf-ficient, Western can purchase energy to make up the shortfall at the request of individual customers on a pass-through cost basis .
In December 2014, DSW established the Boulder Canyon Project Post-2017 power al-locations that will take effect upon expiration of the current contracts, Sept . 30, 2017 . DSW’s remarketing efforts consisted of a series of public processes that remarketed the power consistent with governing law, regulations and the public’s best interest . Western will initiate contract discussions in spring 2015 and anticipates having finalized contracts in December 2015 . Electric service contracts will provide for the marketing of power from Oct . 1, 2017, to Sept . 30, 2067 .

42
BOULDER CANYON PROJECT
Facilities, SubstationsFacility FY 2014 FY 2013
Substations
Number of substations 4 4
Buildings and communications sites
Number of communication sites 3 3
PowerplantsState/plant name Operating agency River Initial in-service date Existing number of units Installed capability1,2
FY 2014 (MW)Actual operating capability (MW)3 Net generation (GWh)4
July 1, 2013 July 1, 2014 FY 2013 FY 2014
Arizona-Nevada
Hoover Reclamation Colorado Sep 1936 19 2,074 1,654 1,493 3,755 3,895
Boulder Canyon total 19 2,074 1,654 1,493 3,755 3,8951 Installed operating capability is the maximum generating capability of the units' at-unity power factor without exceeding the specified heat rise on each unit and is independent of water constraints.2 Excludes 4.8 MW reserved for plant use but included in number of units.3 Actual operating capability represents the operating capability on July 1, but may not represent the coincident or non-coincident peak operating capability for the powerplant, project or Western as a whole.4 Net generation is gross plant generation less plant use. These amounts have not been reduced by other priorities such as project pumping energy. Operating agencies: Reclamation - Bureau of Reclamation, Department of the Interior
Transmission LinesVoltage rating
Arizona Nevada Total
FY 2014 FY 2013 FY 2014 FY 2013 FY 2014 FY 2013
230-kV
Circuit miles 0.10 0.10 53.20 53.20 53.30 53.30
Circuit kilometers 0.16 0.16 85.60 85.60 85.76 85.76
Acres 0.00 0.00 1,135.88 1,135.88 1,135.88 1,135.88
Hectares 0.00 0.00 459.87 459.87 459.87 459.87
69-kV and below
Circuit miles 0.00 0.00 0.00 0.00 0.00 0.00
Circuit kilometers 0.00 0.00 0.00 0.00 0.00 0.00
Acres 0.00 0.00 32.17 32.17 32.17 32.17
Hectares 0.00 0.00 13.02 13.02 13.02 13.02
Total
Circuit miles 0.10 0.10 53.20 53.20 53.30 53.30
Circuit kilometers 0.16 0.16 85.60 85.60 85.76 85.76
Acres 0.00 0.00 1,168.05 1,168.05 1,168.05 1,168.05
Hectares 0.00 0.00 472.89 472.89 472.89 472.89
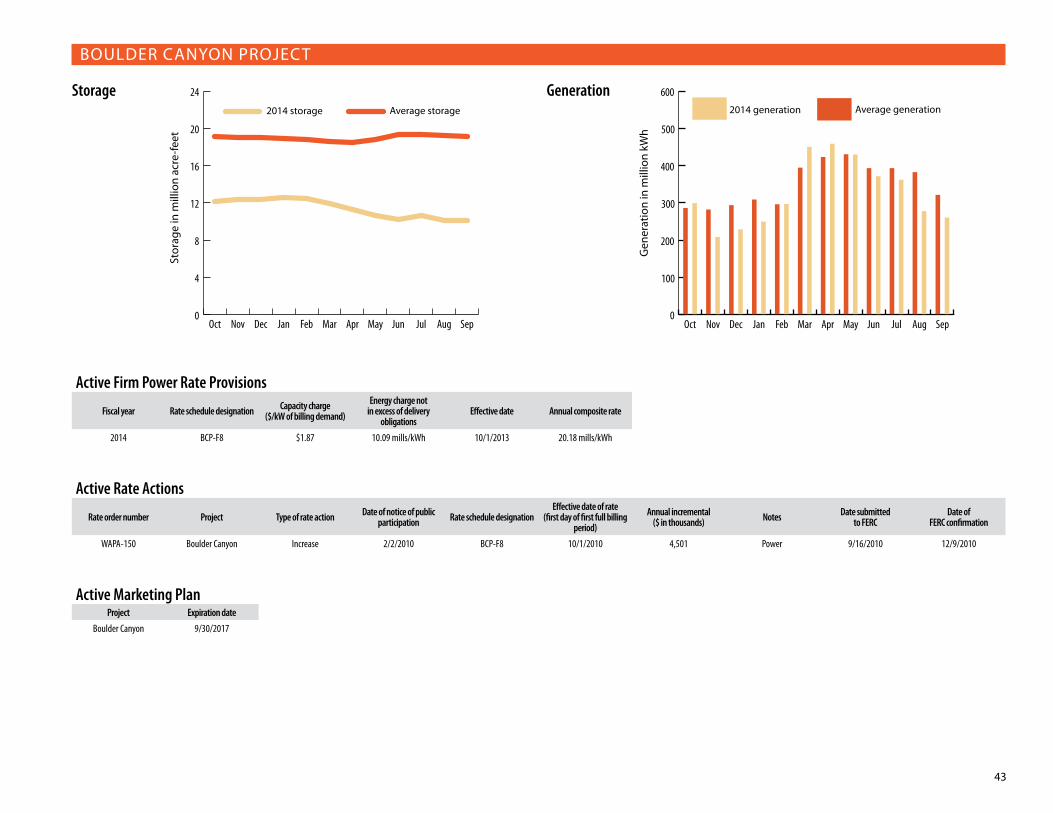
43
BOULDER CANYON PROJECT
Storage Generation
0
4
8
12
16
20
24
2014 storage Average storage
SepAugJulJunMayAprMarFebJanDecNovOct
Stor
age
in m
illio
n ac
re-fe
et
0
100
200
300
400
500
6002014 generation Average generation
SepAugJulJunMayAprMarFebJanDecNovOct
Gen
erat
ion
in m
illio
n kW
h
Active Firm Power Rate Provisions
Fiscal year Rate schedule designation Capacity charge ($/kW of billing demand)
Energy charge not in excess of delivery
obligationsEffective date Annual composite rate
2014 BCP-F8 $1.87 10.09 mills/kWh 10/1/2013 20.18 mills/kWh
Active Rate Actions
Rate order number Project Type of rate action Date of notice of public participation Rate schedule designation
Effective date of rate(first day of first full billing
period)
Annual incremental($ in thousands) Notes Date submitted
to FERCDate of
FERC confirmation
WAPA-150 Boulder Canyon Increase 2/2/2010 BCP-F8 10/1/2010 4,501 Power 9/16/2010 12/9/2010
Active Marketing Plan Project Expiration date
Boulder Canyon 9/30/2017
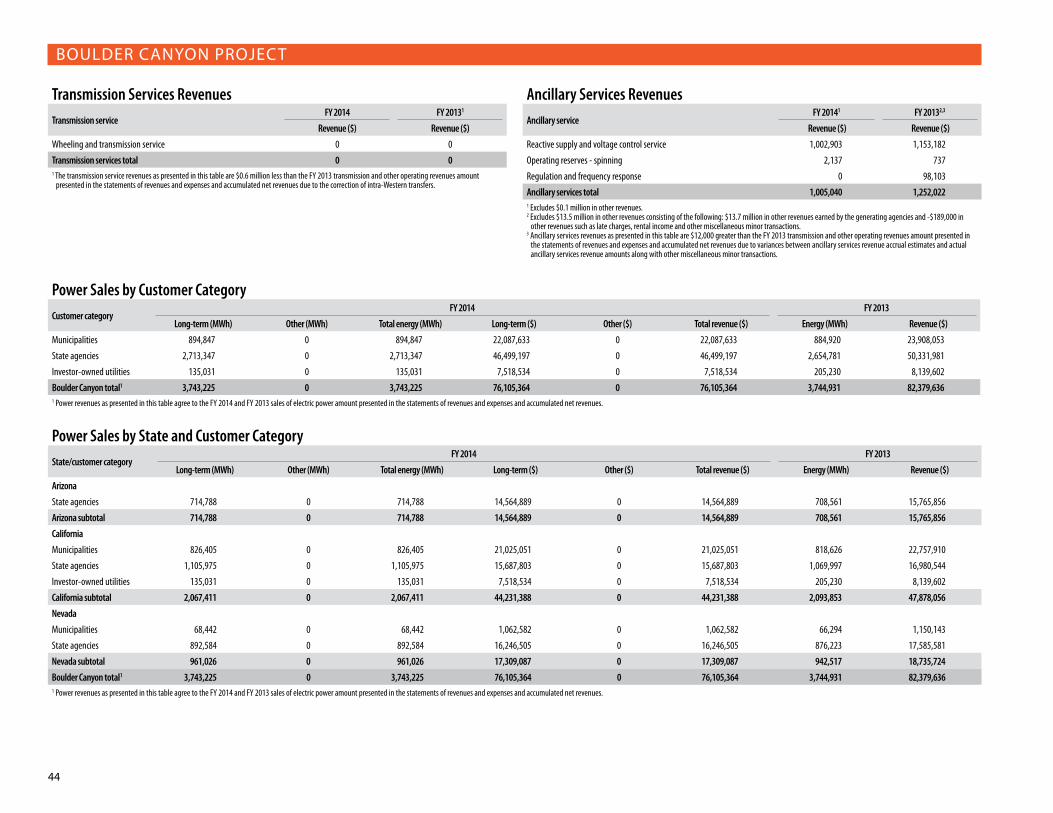
44
BOULDER CANYON PROJECT
Transmission Services RevenuesTransmission service
FY 2014 FY 20131
Revenue ($) Revenue ($)
Wheeling and transmission service 0 0
Transmission services total 0 0 1 The transmission service revenues as presented in this table are $0.6 million less than the FY 2013 transmission and other operating revenues amount
presented in the statements of revenues and expenses and accumulated net revenues due to the correction of intra-Western transfers.
Ancillary Services RevenuesAncillary service
FY 20141 FY 20132,3
Revenue ($) Revenue ($)
Reactive supply and voltage control service 1,002,903 1,153,182
Operating reserves - spinning 2,137 737
Regulation and frequency response 0 98,103
Ancillary services total 1,005,040 1,252,022 1 Excludes $0.1 million in other revenues.2 Excludes $13.5 million in other revenues consisting of the following: $13.7 million in other revenues earned by the generating agencies and -$189,000 in
other revenues such as late charges, rental income and other miscellaneous minor transactions.3 Ancillary services revenues as presented in this table are $12,000 greater than the FY 2013 transmission and other operating revenues amount presented in
the statements of revenues and expenses and accumulated net revenues due to variances between ancillary services revenue accrual estimates and actual ancillary services revenue amounts along with other miscellaneous minor transactions.
Power Sales by Customer CategoryCustomer category
FY 2014 FY 2013
Long-term (MWh) Other (MWh) Total energy (MWh) Long-term ($) Other ($) Total revenue ($) Energy (MWh) Revenue ($)
Municipalities 894,847 0 894,847 22,087,633 0 22,087,633 884,920 23,908,053
State agencies 2,713,347 0 2,713,347 46,499,197 0 46,499,197 2,654,781 50,331,981
Investor-owned utilities 135,031 0 135,031 7,518,534 0 7,518,534 205,230 8,139,602
Boulder Canyon total1 3,743,225 0 3,743,225 76,105,364 0 76,105,364 3,744,931 82,379,6361 Power revenues as presented in this table agree to the FY 2014 and FY 2013 sales of electric power amount presented in the statements of revenues and expenses and accumulated net revenues.
Power Sales by State and Customer CategoryState/customer category
FY 2014 FY 2013
Long-term (MWh) Other (MWh) Total energy (MWh) Long-term ($) Other ($) Total revenue ($) Energy (MWh) Revenue ($)
Arizona
State agencies 714,788 0 714,788 14,564,889 0 14,564,889 708,561 15,765,856
Arizona subtotal 714,788 0 714,788 14,564,889 0 14,564,889 708,561 15,765,856
California
Municipalities 826,405 0 826,405 21,025,051 0 21,025,051 818,626 22,757,910
State agencies 1,105,975 0 1,105,975 15,687,803 0 15,687,803 1,069,997 16,980,544
Investor-owned utilities 135,031 0 135,031 7,518,534 0 7,518,534 205,230 8,139,602
California subtotal 2,067,411 0 2,067,411 44,231,388 0 44,231,388 2,093,853 47,878,056
Nevada
Municipalities 68,442 0 68,442 1,062,582 0 1,062,582 66,294 1,150,143
State agencies 892,584 0 892,584 16,246,505 0 16,246,505 876,223 17,585,581
Nevada subtotal 961,026 0 961,026 17,309,087 0 17,309,087 942,517 18,735,724
Boulder Canyon total1 3,743,225 0 3,743,225 76,105,364 0 76,105,364 3,744,931 82,379,6361 Power revenues as presented in this table agree to the FY 2014 and FY 2013 sales of electric power amount presented in the statements of revenues and expenses and accumulated net revenues.

45
BOULDER CANYON PROJECT
Customers by State and Customer CategoryState/customer category
FY 2014 FY 2013
Long-term Other Total Long-term Other Total
Arizona
State agencies 1 0 1 1 0 1
Arizona subtotal 1 0 1 1 0 1
California
Municipalities 10 0 10 10 0 10
State agencies 1 0 1 1 0 1
Investor-owned utilities 1 0 1 1 0 1
California subtotal 12 0 12 12 0 12
Nevada
Municipalities 1 0 1 1 0 1
State agencies 1 0 1 1 0 1
Nevada subtotal 2 0 2 2 0 2
Boulder Canyon total 15 0 15 15 0 15
Summary by Customer CategoryCustomer category
FY 2014 FY 2013
Long-term Other Total Long-term Other Total
Municipalities 11 0 11 11 0 11
State agencies 3 0 3 3 0 3
Investor-owned utilities 1 0 1 1 0 1
Boulder Canyon total 15 0 15 15 0 15
Top 5 Customers in Long-term Revenue1
Rank Customer Revenue ($) Percent of total sales
1 Colorado River Commission of Nevada 16,246,505 21.3
2 Metropolitan Water District of Southern California 15,687,803 20.6
3 Los Angeles 15,443,213 20.3
4 Arizona Power Authority 14,564,889 19.1
5 Southern California Edison Company 7,518,534 9.9
Total 69,460,944 91.21 Excludes energy sales and power revenues from interdepartmental, interproject and project-use customers.
Top 5 Customers in Long-term Energy Sales1
Rank Customer Energy (MWh) Percent of total sales
1 Metropolitan Water District of Southern California 1,105,975 29.5
2 Colorado River Commission of Nevada 892,584 23.8
3 Arizona Power Authority 714,788 19.1
4 Los Angeles 577,739 15.4
5 Southern California Edison Company 135,031 3.6
Total 3,426,117 91.41 Excludes energy sales and power revenues from interdepartmental, interproject and project-use customers.
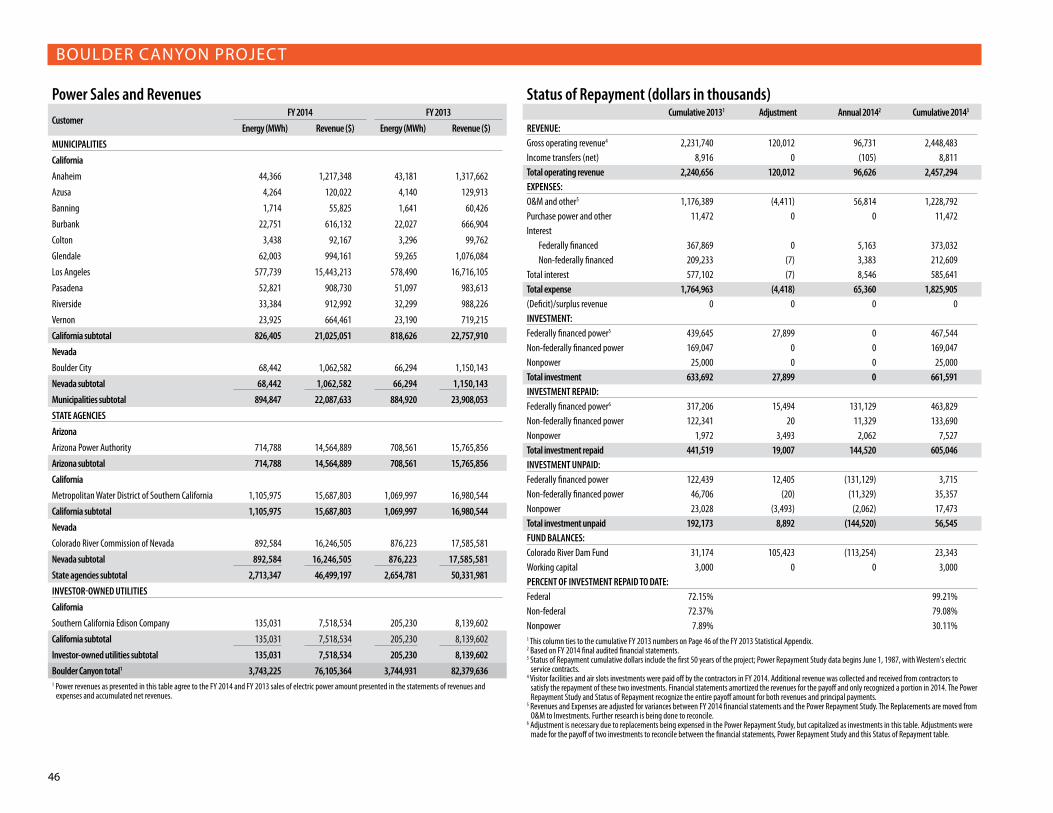
46
BOULDER CANYON PROJECT
Power Sales and RevenuesCustomer
FY 2014 FY 2013
Energy (MWh) Revenue ($) Energy (MWh) Revenue ($)
MUNICIPALITIES
California
Anaheim 44,366 1,217,348 43,181 1,317,662
Azusa 4,264 120,022 4,140 129,913
Banning 1,714 55,825 1,641 60,426
Burbank 22,751 616,132 22,027 666,904
Colton 3,438 92,167 3,296 99,762
Glendale 62,003 994,161 59,265 1,076,084
Los Angeles 577,739 15,443,213 578,490 16,716,105
Pasadena 52,821 908,730 51,097 983,613
Riverside 33,384 912,992 32,299 988,226
Vernon 23,925 664,461 23,190 719,215
California subtotal 826,405 21,025,051 818,626 22,757,910
Nevada
Boulder City 68,442 1,062,582 66,294 1,150,143
Nevada subtotal 68,442 1,062,582 66,294 1,150,143
Municipalities subtotal 894,847 22,087,633 884,920 23,908,053
STATE AGENCIES
Arizona
Arizona Power Authority 714,788 14,564,889 708,561 15,765,856
Arizona subtotal 714,788 14,564,889 708,561 15,765,856
California
Metropolitan Water District of Southern California 1,105,975 15,687,803 1,069,997 16,980,544
California subtotal 1,105,975 15,687,803 1,069,997 16,980,544
Nevada
Colorado River Commission of Nevada 892,584 16,246,505 876,223 17,585,581
Nevada subtotal 892,584 16,246,505 876,223 17,585,581
State agencies subtotal 2,713,347 46,499,197 2,654,781 50,331,981
INVESTOR-OWNED UTILITIES
California
Southern California Edison Company 135,031 7,518,534 205,230 8,139,602
California subtotal 135,031 7,518,534 205,230 8,139,602
Investor-owned utilities subtotal 135,031 7,518,534 205,230 8,139,602
Boulder Canyon total1 3,743,225 76,105,364 3,744,931 82,379,6361 Power revenues as presented in this table agree to the FY 2014 and FY 2013 sales of electric power amount presented in the statements of revenues and
expenses and accumulated net revenues.
Status of Repayment (dollars in thousands)Cumulative 20131 Adjustment Annual 20142 Cumulative 20143
REVENUE:Gross operating revenue4 2,231,740 120,012 96,731 2,448,483 Income transfers (net) 8,916 0 (105) 8,811 Total operating revenue 2,240,656 120,012 96,626 2,457,294 ExPENSES:O&M and other5 1,176,389 (4,411) 56,814 1,228,792 Purchase power and other 11,472 0 0 11,472 Interest
Federally financed 367,869 0 5,163 373,032 Non-federally financed 209,233 (7) 3,383 212,609
Total interest 577,102 (7) 8,546 585,641 Total expense 1,764,963 (4,418) 65,360 1,825,905 (Deficit)/surplus revenue 0 0 0 0 INVESTMENT:Federally financed power5 439,645 27,899 0 467,544 Non-federally financed power 169,047 0 0 169,047 Nonpower 25,000 0 0 25,000 Total investment 633,692 27,899 0 661,591 INVESTMENT REPAID:Federally financed power6 317,206 15,494 131,129 463,829 Non-federally financed power 122,341 20 11,329 133,690 Nonpower 1,972 3,493 2,062 7,527 Total investment repaid 441,519 19,007 144,520 605,046 INVESTMENT UNPAID:Federally financed power 122,439 12,405 (131,129) 3,715 Non-federally financed power 46,706 (20) (11,329) 35,357 Nonpower 23,028 (3,493) (2,062) 17,473 Total investment unpaid 192,173 8,892 (144,520) 56,545 FUND BALANCES:Colorado River Dam Fund 31,174 105,423 (113,254) 23,343 Working capital 3,000 0 0 3,000 PERCENT OF INVESTMENT REPAID TO DATE:Federal 72.15% 99.21%Non-federal 72.37% 79.08%Nonpower 7.89% 30.11%1 This column ties to the cumulative FY 2013 numbers on Page 46 of the FY 2013 Statistical Appendix.2 Based on FY 2014 final audited financial statements.3 Status of Repayment cumulative dollars include the first 50 years of the project; Power Repayment Study data begins June 1, 1987, with Western's electric
service contracts.4 Visitor facilities and air slots investments were paid off by the contractors in FY 2014. Additional revenue was collected and received from contractors to
satisfy the repayment of these two investments. Financial statements amortized the revenues for the payoff and only recognized a portion in 2014. The Power Repayment Study and Status of Repayment recognize the entire payoff amount for both revenues and principal payments.
5 Revenues and Expenses are adjusted for variances between FY 2014 financial statements and the Power Repayment Study. The Replacements are moved from O&M to Investments. Further research is being done to reconcile.
6 Adjustment is necessary due to replacements being expensed in the Power Repayment Study, but capitalized as investments in this table. Adjustments were made for the payoff of two investments to reconcile between the financial statements, Power Repayment Study and this Status of Repayment table.

47
BOULDER CANYON PROJECT
Statements of Revenues and Expenses and Accumulated Net RevenuesFor the years ended Sept. 30, 2014 and 2013 (in thousands)
FY 2014 FY 2013
Western Reclamation Total Western Reclamation Total
Operating revenues:
Sales of electric power $76,105 $0 $76,105 $82,379 $0 $82,379
Transmission and other operating revenues 1,109 19,516 20,625 1,663 13,699 15,362
Gross operating revenues 77,214 19,516 96,730 84,042 13,699 97,741
Income transfers, net (77,201) 77,095 (106) (84,024) 84,313 289
Total operating revenues 13 96,611 96,624 18 98,012 98,030
Operating expenses:
Operation and maintenance 225 56,587 56,812 163 63,136 63,299
Depreciation 1,141 3,697 4,838 1,141 3,880 5,021
Total operating expenses 1,366 60,284 61,650 1,304 67,016 68,320
Net operating revenues (deficit) (1,353) 36,327 34,974 (1,286) 30,996 29,710
Interest expenses:
Interest on payable to U.S. Treasury 14 5,149 5,163 10 11,179 11,189
Allowance for funds used during construction 0 0 0 0 0 0
Net interest on payable to U.S. Treasury 14 5,149 5,163 10 11,179 11,189
Interest on long-term liabilities 0 3,383 3,383 0 3,940 3,940
Net interest expenses 14 8,532 8,546 10 15,119 15,129
Net revenues (deficit) (1,367) 27,795 26,428 (1,296) 15,877 14,581
Accumulated net revenues (deficit):
Balance, beginning of year 8,771 49,111 57,882 7,358 33,234 40,592
Change in capitalization 226 0 226 2,709 0 2,709
Balance, end of year $7,630 $76,906 $84,536 $8,771 $49,111 $57,882
Balance SheetsAs of Sept. 30, 2014 and 2013 (in thousands)
FY 2014 FY 2013
Western Reclamation Total Western Reclamation Total
Assets:
Completed utility plant $32,739 $373,643 $406,382 $32,739 $373,643 $406,382
Accumulated depreciation (25,116) (178,935) (204,051) (23,975) (175,238) (199,213)
Net completed plant 7,623 194,708 202,331 8,764 198,405 207,169
Construction work-in-progress 0 7,467 7,467 0 5,970 5,970
Net utility plant 7,623 202,175 209,798 8,764 204,375 213,139
Cash 0 80,234 80,234 0 65,542 65,542
Accounts receivable, net 5,117 2,834 7,951 5,768 4,756 10,524
Regulatory assets 404 8,906 9,310 314 8,638 8,952
Other assets 7 973 980 0 856 856
Total assets 13,151 295,122 308,273 14,846 284,167 299,013
Liabilities:
Long-term liabilities 0 34,696 34,696 0 46,025 46,025
Customer advances and other liabilities 5,528 10,522 16,050 6,082 11,444 17,526
Deferred revenue 0 119,904 119,904 0 0 0
Accounts payable 0 1,465 1,465 0 2,468 2,468
Total liabilities 5,528 166,587 172,115 6,082 59,937 66,019
Capitalization:
Payable to U.S. Treasury (7) 51,629 51,622 (7) 175,119 175,112
Accumulated net revenues (deficit) 7,630 76,906 84,536 8,771 49,111 57,882
Total capitalization 7,623 128,535 136,158 8,764 224,230 232,994
Total liabilities and capitalization $13,151 $295,122 $308,273 $14,846 $284,167 $299,013

48
CENTRAL VALLEY PROJECT
The Central Valley Project in California’s Central Valley has 18 dams that create reservoirs with a total storage capacity of 13 million acre-feet . Two years after the project was authorized in 1937, construction began on 615 miles of canals, five pumping plants and 11 powerplants, consisting of 38 hydroelectric gener-ating units . Irrigation features of the CVP cover an area 400 miles long by
45 miles wide, making up almost one-third of California . The generating units have an installed capacity of 2,113 megawatts . The CVP includes 941 circuit-miles of high-voltage transmission lines .
In Fiscal Year 2014, the inflow to the four major CVP reservoirs (Trinity, Folsom, New Melones and Shasta) was 2 .2 million acre-feet, about 21 percent of the long-term average of 10 .8 million acre-feet . As of Sept . 30, 2014, the combined storage of these four facilities was 2 .6 million acre-feet or about 44 percent of average . Net generation totaled 2 .9 billion kilowatt-hours .
Allocations made through power marketing plans of the CVP govern power sales . All of the existing power sales contracts will expire Dec . 31, 2024 . Each customer receives a percentage of the output of the CVP generation, referred to as a base resource allocation . The CVP generation will vary hourly, daily, monthly and annually because it is subject to hydrological conditions and other constraints that may govern CVP operations . Also, certain customers receive additional power products to complement their base resource alloca-tions . These additional power products supplement the base resource allocation and are provided through custom power contracts .
Western’s require-ments to support generation through power purchases decreased from 3,636,839 megawatt-hours in FY 2013 to 3,608,036 MWh in FY 2014 . FY 2014 long-term power sales totaled 5 .6 billion kWh and $238 mil-lion, not including project use . These sales were made to municipalities (10 .7 percent), public utility districts (63 .3 per-cent), federal agencies (13 .3 percent) and others (12 .7 percent) . About 75 percent of the CVP’s firm power in FY 2014 was sold to five customers: Sacramento Municipal Utility District, City of Redding, Northern California Power Agency, Department of Energy–Berkeley Site Office and the University of California-Davis .
Formula-rate methodologies were approved by the Federal Energy Regulatory Com-mission in Rate Order No . WAPA 156, effective Oct . 1, 2011, through Sept . 30, 2016 . Under the Rate Order, Schedule CV-F13 contains a Power Revenue Requirement that is allocated to all preference customers . For the period Oct . 1, 2013, through Sept . 30, 2014, the Power Revenue Requirement was $68 .2 million, a reduction of $5 .2 million from the FY 2013 Power Revenue Requirement of $73 .4 million .

49
CENTRAL VALLEY PROJECT
Facilities, SubstationsFacility FY 2014 FY 2013
Substations
Number of substations 22 22
Number of transformers 22 21
Transformer capacity (kVA) 1,379,920 1,378,420
Land (fee)
Acres 374.17 374.17
Hectares 151.49 151.49
Land (permit)
Acres 0.47 0.47
Hectares 0.19 0.19
Buildings and communications sites
Number of buildings 39 39
Number of communication sites 18 18
Active Firm Power Rate ProvisionsFiscal year Rate schedule
designation1Capacity charge
($/kW of billing demand)Energy charge not in excess of
delivery obligationsEffective
dateAnnual
composite rate
2014 CV-F13 NA NA 10/1/2013 $68,217,8091 There are no provisions for energy and capacity rates under CV-F13, which provides for a Power Revenue Requirement allocation to all preference customers.
Annual per-unit rates are not applicable under the formula rates above.
Custom Product PowerFiscal year Rate schedule
designationCapacity charge
($/kW of billing demand)Energy charge not in excess of
delivery obligationsEffective
dateAnnual
composite rate
2014 CPP-2 N/A N/A 10/1/2013 Pass-through
Active Marketing PlanProject Expiration date
Central Valley 12/31/2024
PowerplantsState/plant name Operating agency River Initial in-service date Existing number of units Installed capability
FY 2014 (MW)1
Actual operating capability (MW)2 Net generation (GWh)3
July 1, 2013 July 1, 2014 FY 2013 FY 2014
California
J.F. Carr Reclamation Clear Creek Tunnel May 1963 2 150 140 141 438 346
Folsom Reclamation American May 1955 3 207 116 102 395 201
Keswick Reclamation Sacramento Oct 1949 3 105 84 55 391 291
New Melones Reclamation Stanislaus Jun 1979 2 380 247 221 414 285
Nimbus Reclamation American May 1955 2 14 8 6 51 28
O'Neill4 Reclamation San Luis Creek Dec 1967 6 25 0 1 8 3
Shasta5,6 Reclamation Sacramento Jun 1944 7 710 500 368 1,829 1,108
Spring Creek Reclamation Spring Creek Tunnel Feb 1964 2 180 175 180 394 245
Trinity3 Reclamation Trinity Feb 1964 2 140 116 95 456 306
Lewiston Reclamation Trinity Feb 1964 1 0.45 0 0 1 0
W.R. Gianelli4,7 CDWR San Luis Creek Mar 1968 8 202 24 60 104 54
Central Valley total 38 2,113 1,410 1,229 4,481 2,867 1 Installed operating capability is the maximum generating capability of the units' at-unity power factor without exceeding the specified heat rise on each unit and independent of water constraints.2 Actual operating capability represents the operating capability of July 1, but may not represent the coincident or non-coincident peak operating capabilty for the powerplant, project or Western as a whole.3 Net generation is gross plant generation less plant use. These amounts have not been reduced by other priorities such as project pumping energy. Trinity generation includes generation from Lewiston.4 Pump/generating plant.5 Total number of units includes two station service units.6 Station service units' capacity is not included. 7 United States' share (47.67 percent) of plant capability.Operating agencies:Reclamation - Bureau of Reclamation - Department of InteriorCDWR - California Department of Water Resources

50
CENTRAL VALLEY PROJECT
Storage
Generation
1
2
3
4
5
6
7
8
92014 storage Average storage
SepAugJulJunMayAprMarFebJanDecNovOct
Stor
age
in m
illio
n ac
re-fe
et
0
160
320
480
640
800
2014 generation Average generation
SepAugJulJunMayAprMarFebJanDecNovOct
Gen
erat
ion
in m
illio
n kW
h
Active Transmission and Ancillary Services Rate ProvisionsFiscal year Rate schedule designation Rate
2014 CV-T3, CVP firm and nonfirm point-to-point transmission service Formula rate
2014 CV-NWT5, Network transmission service Formula rate
2014 COTP-T3, COTP firm and non-firm point-to-point transmission service Formula rate
2014 PACI-T3, PACI firm and non-firm point-to-point transmission service Formula rate
2014 CV-TPT7, Third-party transmission Pass-through
2014 CV-SPR4, Spinning reserve service Formula rate
2014 CV-SUR4, Supplemental reserve service Formula rate
2014 CV-RFS4, Regulation and frequency response service Formula rate
2014 CV-EID4, Energy imbalance service Formula rate
2014 CV-GID1, Generator imbalance service Formula rate
2014 CV-UUP1, Unreserved-use penalties Formula rate
Transmission LinesVoltage rating
California Total
FY 2014 FY 2013 FY 2014 FY 2013500-kVCircuit miles 0.00 0.00 0.00 0.00Circuit kilometers 0.00 0.00 0.00 0.00Acres 1,906.63 1,906.63 1,906.63 1,906.63Hectares 771.92 771.92 771.92 771.92230-kVCircuit miles 868.44 868.56 868.44 868.56Circuit kilometers 1,397.32 1,397.51 1,397.32 1,397.51Acres 9,577.75 9,577.49 9,577.75 9,577.49Hectares 3,877.64 3,877.53 3,877.64 3,877.53115-kVCircuit miles 13.55 13.55 13.55 13.55Circuit kilometers 21.80 21.80 21.80 21.80Acres 125.55 125.55 125.55 125.55Hectares 50.83 50.83 50.83 50.8369-kV and belowCircuit miles 74.24 74.14 74.24 74.14Circuit kilometers 119.45 119.29 119.45 119.29Acres 546.01 546.01 546.01 546.01Hectares 221.06 221.06 221.06 221.06TotalCircuit miles 956.23 956.25 956.23 956.25Circuit kilometers 1,538.57 1,538.60 1,538.57 1,538.60Acres 12,155.94 12,155.68 12,155.94 12,155.68Hectares 4,921.45 4,921.34 4,921.45 4,921.34

51
CENTRAL VALLEY PROJECT
Power Sales by State and Customer CategoryState/customer category
FY 20141 FY 20132
Long-term (MWh) Other (MWh) Total energy (MWh) Long-term ($) Other ($) Total revenue ($) Energy (MWh) Revenue ($)
California
Municipalities 720,800 457 721,257 25,372,211 22,403 25,394,614 1,004,636 28,252,243
Public utility districts 3,243,283 55,857 3,299,140 150,474,054 2,974,445 153,448,499 3,658,321 154,202,914
Federal agencies 781,757 0 781,757 31,559,966 0 31,559,966 873,499 28,543,426
State agencies 297,453 0 297,453 12,949,967 0 12,949,967 306,664 12,201,665
Irrigation districts 24,687 0 24,687 831,276 0 831,276 31,383 759,713
Native American tribes 4,805 0 4,805 145,582 0 145,582 6,537 150,196
Joint power authorities 502,490 0 502,490 15,975,157 0 15,975,157 764,323 17,428,586
Independent system operator corporations 0 64,486 64,486 0 3,137,787 3,137,787 138,810 5,069,269
Transportation3 10,287 0 10,287 307,665 0 307,665 16,489 360,059
Project use 186,171 0 186,171 21,818,815 0 21,818,815 867,219 21,671,068
California subtotal 5,771,733 120,800 5,892,533 259,434,693 6,134,635 265,569,328 7,667,881 268,639,139
Maryland
Power marketers 0 648 648 0 21,220 21,220 35 1,284
Maryland subtotal 0 648 648 0 21,220 21,220 35 1,284
Minnesota
Power marketers 0 0 0 0 0 0 95 1,425
Minnesota subtotal 0 0 0 0 0 0 95 1,425
New York
Power marketers 0 38,732 38,732 0 2,151,901 2,151,901 37,751 1,652,230
New York subtotal 0 38,732 38,732 0 2,151,901 2,151,901 37,751 1,652,230
Oregon
Federal agencies 0 250 250 0 17,500 17,500 0 0
Power marketers 0 897 897 0 27,748 27,748 2,266 57,788
Oregon subtotal 0 1,147 1,147 0 45,248 45,248 2,266 57,788
Texas
Power marketers 0 22,920 22,920 0 1,230,365 1,230,365 36,503 1,526,315
Texas subtotal 0 22,920 22,920 0 1,230,365 1,230,365 36,503 1,526,315
INTERNATIONAL
Canada
Power marketers 0 10,846 10,846 0 607,653 607,653 5,728 243,457
Canada subtotal 0 10,846 10,846 0 607,653 607,653 5,728 243,457
Central Valley total 5,771,733 195,093 5,966,826 259,434,693 10,191,022 269,625,715 7,750,259 272,121,6381 Power revenues as presented in this table are $150.3 million greater than the FY 2014 sales of electric power presented in the statements of revenues and expenses and accumulated net revenues due to the following: $129.3 million in netted transactions where Western simultaneously purchases and sells electric power to
the same counterparty; $21.8 million in project-use revenues that were reversed due to Governmentwide Treasury Account Symbol Adjusted Trial Balance System recording issues and rebilled in FY 2015, -$0.8 million in variances between revenue accrual estimates and actual revenue along with other minor miscellaneous corrections and transactions.
2 Power revenues as presented in this table are $129.1 million greater than the FY 2013 sales of electric power presented in the statements of revenues and expenses and accumulated net revenues due to the following: $128.0 million in netted transactions where Western simultaneously purchases and sells electric power to the same counterparty; $1.1 million in variances between revenue accrual estimates and actual revenue along with other minor miscellaneous corrections and transactions.
3 The customer category "Railroads and railways" has been changed to "Transportation" in FY 2014.

52
CENTRAL VALLEY PROJECT
Power Sales by Customer CategoryCustomer category
FY 20141 FY 20132
Long-term (MWh) Other (MWh) Total energy (MWh) Long-term ($) Other ($) Total revenue ($) Energy (MWh) Revenue ($)
Municipalities 720,800 457 721,257 25,372,211 22,403 25,394,614 1,004,636 28,252,243
Public utility districts 3,243,283 55,857 3,299,140 150,474,054 2,974,445 153,448,499 3,658,321 154,202,914
Federal agencies 781,757 250 782,007 31,559,966 17,500 31,577,466 873,499 28,543,426
State agencies 297,453 0 297,453 12,949,967 0 12,949,967 306,664 12,201,665
Irrigation districts 24,687 0 24,687 831,276 0 831,276 31,383 759,713
Native American tribes 4,805 0 4,805 145,582 0 145,582 6,537 150,196
Power marketers 0 74,043 74,043 0 4,038,887 4,038,887 82,378 3,482,499
Joint power authorities 502,490 0 502,490 15,975,157 0 15,975,157 764,323 17,428,586
Independent system operator corporations 0 64,486 64,486 0 3,137,787 3,137,787 138,810 5,069,269
Transportation3 10,287 0 10,287 307,665 0 307,665 16,489 360,059
Project use 186,171 0 186,171 21,818,815 0 21,818,815 867,219 21,671,068
Central Valley total 5,771,733 195,093 5,966,826 259,434,693 10,191,022 269,625,715 7,750,259 272,121,638 1 Power revenues as presented in this table are $150.3 million greater than the FY 2014 sales of electric power presented in the statements of revenues and expenses and accumulated net revenues due to the following: $129.3 million in netted transactions where Western simultaneously purchases and sells electric power to
the same counterparty; $21.8 million in project-use revenues that were reversed due to Governmentwide Treasury Account Symbol Adjusted Trial Balance System recording issues and rebilled in FY 2015, ($0.8) million in variances between revenue accrual estimates and actual revenue along with other minor miscellaneous corrections and transactions.
2 Power revenues as presented in this table are $129.1 million greater than the FY 2013 sales of electric power presented in the statements of revenues and expenses and accumulated net revenues due to the following: $128.0 million in netted transactions where Western simultaneously purchases and sells electric power to the same counterparty; $1.1 million in variances between revenue accrual estimates and actual revenue along with other minor miscellaneous corrections and transactions.
3 The customer category "Railroads and railways" has been changed to "Transportation" in FY 2014.
Top 5 Customers in Other Revenue1
Rank Customer Revenue ($) Percent of total sales
1 California Independent System Operator Corporation 3,137,787 30.8
2 Sacramento Municipal Utility District 2,890,532 28.4
3 Morgan Stanley Capital Group 2,151,901 21.1
4 Shell Energy North America 1,125,785 11.0
5 TransAlta Energy Marketing 607,653 6.0
Total 9,913,658 97.31 Excludes energy sales and power revenues from interdepartmental, interproject and project-use customers.
Top 5 Customers in Other Energy Sales1
Rank Customer Energy (MWh) Percent of total sales
1 California Independent System Operator Corporation 64,486 33.0
2 Sacramento Municipal Utility District 54,220 27.8
3 Morgan Stanley Capital Group 38,732 19.9
4 Shell Energy North America 20,960 10.7
5 TransAlta Energy Marketing 10,846 5.6
Total 189,244 97.01 Excludes energy sales and power revenues from interdepartmental, interproject and project-use customers.
Top 5 Customers in Long-term Revenue1
Rank Customer Revenue ($) Percent of total sales
1 Sacramento Municipal Utility District 137,056,659 57.7
2 City of Redding 14,810,231 6.2
3 Department of Energy - Berkeley Site Office 13,191,578 5.6
4 Northern California Power Agency 11,245,009 4.7
5 University of California, Davis 10,455,795 4.4
Total 186,759,272 78.61 Excludes energy sales and power revenues from interdepartmental, interproject and project-use customers.
Top 5 Customers in Long-term Energy Sales1
Rank Customer Energy (MWh) Percent of total sales
1 Sacramento Municipal Utility District 2,858,149 51.2
2 City of Redding 401,661 7.2
3 Northern California Power Agency 353,370 6.3
4 Department of Energy - Berkeley Site Office 338,676 6.1
5 University of California, Davis 229,325 4.1
Total 4,181,181 74.91 Excludes energy sales and power revenues from interdepartmental, interproject and project-use customers.

53
CENTRAL VALLEY PROJECT
Purchased PowerSupplier
FY 2014 FY 2013
Energy (MWh) Cost ($ in thousands) Energy (MWh) Cost ($ in thousands)
NonWestern suppliers
Barclays Bank 92,000 6,040 18,297 1,020
Bonneville Power Administration 128,932 4,184 109,918 3,668
California Independent System Operator 153,776 7,001 178,357 6,640
Calpine Energy Services 31,600 3,477 38,717 2,886
Cargill 13,945 553 1,592 (3)
Citigroup Energy 91,749 4,013 26,164 924
Constellation Power Source 0 0 9,042 245
Coral Power/Shell Energy 88,064 3,820 51,641 2,172
CVP Corporation 0 0 8,689 24
EDF Trading 95,820 4,130 77,844 2,865
Exelon Generation Company 55,220 1,842 14,880 690
Iberdrola Renewables 68,479 2,351 37,263 1,255
JPMorgan 126,991 6,671 162,815 9,690
Macquarie Cook Power 10,815 424 74,965 4,107
Modesto Irrigation District 270 14 120 6
Morgan Stanley 48,640 1,149 33,894 1,382
Noble Americas Gas and Power 0 0 981 0
One Energy Renewables 0 28 0 0
PacifiCorp 2,430 75 0 30
Portland General Electric 0 0 1,520 15
Powerex 17,004 477 52,732 2,132
Redding 234,792 9,193 274,408 10,651
Roseville 0 0 150 6
Sacramento Municipal Utility District 2,312,500 114,091 2,374,428 113,216
San Diego Gas and Electric 0 0 1,200 0
Seattle 0 0 2,600 84
Tenaska Power Services Company 1,800 47 0 0
TransAlta Energy Marketing (US) 19,804 1,029 15,398 485
Turlock Irrigation District 13,405 492 63,361 2,457
NonWestern suppliers subtotal 3,608,036 171,101 3,630,976 166,647
Western suppliers
Sierra Nevada regional office 0 0 5,863 32
Western suppliers subtotal 0 0 5,863 32
Purchased power total1 3,608,036 171,101 3,636,839 166,679 1 Purchased power in this table is greater than the statement of revenues and expenses and accumulated net revenues by $129.3 million for FY 2014 and
$128.1 million for FY 2013 due to netted transactions where Western simultaneously purchases and sells electric power to the same counterparty. The remaining difference in FY 2013 of $0.1 million is due to miscellaneous minor transactions.
Purchased TransmissionSupplier
FY 2014 FY 2013
Cost ($ in thousands) Cost ($ in thousands)
NonWestern suppliers
California Department of Water Resources 180 490
California Independent System Operator 31,389 34,464
Pacific Gas and Electric Company 14,847 9,107
Sacramento Municipal Utility District 2,362 2,302
Transmission Agency of Northern California 1,689 1,466
NonWestern suppliers subtotal 50,467 47,829
Western suppliers 0 0
Purchased transmission total1 50,467 47,829 1 Purchased transmission as presented in this table is greater than the statements of revenues and expenses and accumulated net revenues by $0.2 million in
FY 2013 due to miscellaneous minor transactions.
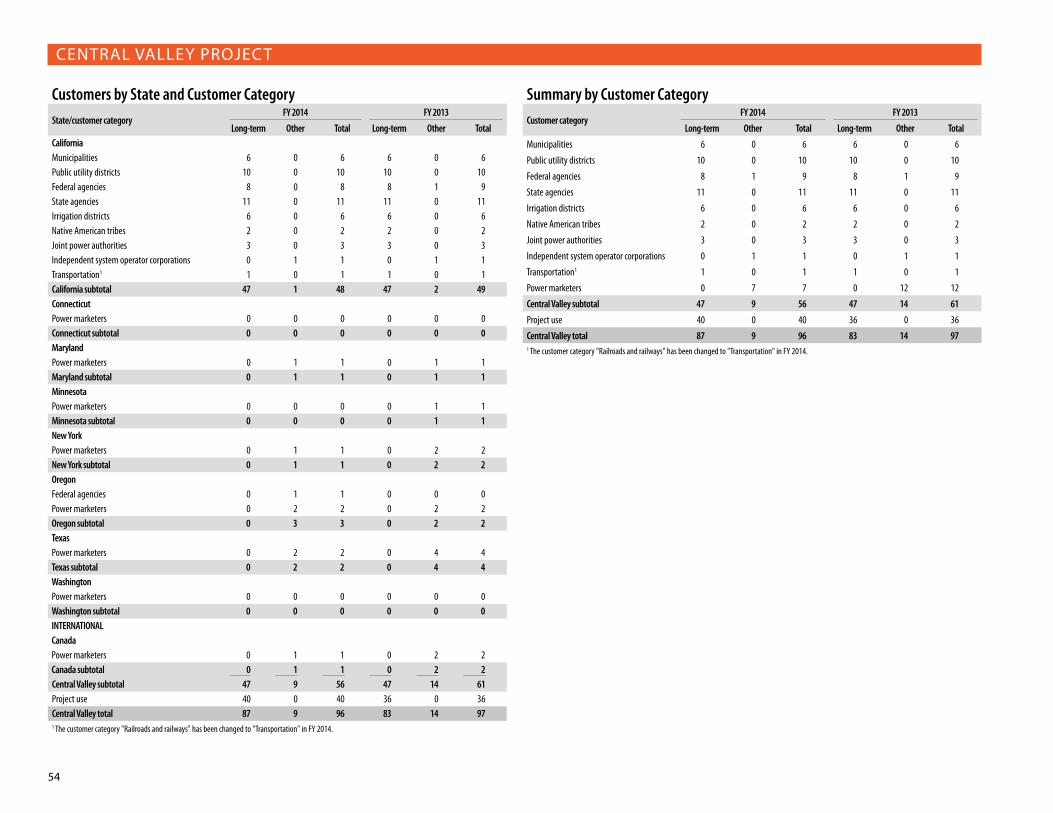
54
CENTRAL VALLEY PROJECT
Customers by State and Customer CategoryState/customer category
FY 2014 FY 2013
Long-term Other Total Long-term Other TotalCaliforniaMunicipalities 6 0 6 6 0 6Public utility districts 10 0 10 10 0 10Federal agencies 8 0 8 8 1 9State agencies 11 0 11 11 0 11Irrigation districts 6 0 6 6 0 6Native American tribes 2 0 2 2 0 2Joint power authorities 3 0 3 3 0 3Independent system operator corporations 0 1 1 0 1 1Transportation1 1 0 1 1 0 1California subtotal 47 1 48 47 2 49ConnecticutPower marketers 0 0 0 0 0 0Connecticut subtotal 0 0 0 0 0 0MarylandPower marketers 0 1 1 0 1 1Maryland subtotal 0 1 1 0 1 1MinnesotaPower marketers 0 0 0 0 1 1Minnesota subtotal 0 0 0 0 1 1New YorkPower marketers 0 1 1 0 2 2New York subtotal 0 1 1 0 2 2OregonFederal agencies 0 1 1 0 0 0Power marketers 0 2 2 0 2 2Oregon subtotal 0 3 3 0 2 2TexasPower marketers 0 2 2 0 4 4Texas subtotal 0 2 2 0 4 4WashingtonPower marketers 0 0 0 0 0 0Washington subtotal 0 0 0 0 0 0INTERNATIONALCanadaPower marketers 0 1 1 0 2 2Canada subtotal 0 1 1 0 2 2Central Valley subtotal 47 9 56 47 14 61Project use 40 0 40 36 0 36Central Valley total 87 9 96 83 14 971 The customer category "Railroads and railways" has been changed to "Transportation" in FY 2014.
Summary by Customer CategoryCustomer category
FY 2014 FY 2013
Long-term Other Total Long-term Other Total
Municipalities 6 0 6 6 0 6
Public utility districts 10 0 10 10 0 10
Federal agencies 8 1 9 8 1 9
State agencies 11 0 11 11 0 11
Irrigation districts 6 0 6 6 0 6
Native American tribes 2 0 2 2 0 2
Joint power authorities 3 0 3 3 0 3
Independent system operator corporations 0 1 1 0 1 1
Transportation1 1 0 1 1 0 1
Power marketers 0 7 7 0 12 12
Central Valley subtotal 47 9 56 47 14 61
Project use 40 0 40 36 0 36
Central Valley total 87 9 96 83 14 971 The customer category "Railroads and railways" has been changed to "Transportation" in FY 2014.

55
CENTRAL VALLEY PROJECT
Transmission Services RevenuesTransmission service
FY 20141 FY 20132
Revenue ($) Revenue ($)
Wheeling and transmission service 11,655,822 0
Firm network transmission service 8,201,329 6,766,360
Firm point-to-point transmission service 13,922,889 13,117,791
Transmission losses 359,351 9,655
Nonfirm point-to-point transmission service 228,665 497,783
Short term point-to-point transmission service 111,409 739,323
Transmission services total 34,479,465 21,130,912 1 Transmission service revenues as presented in this table are $0.4 million less than the FY 2014 transmission and other operating revenues presented in
the statements of revenues and expenses and accumulated net revenues due to variances between transmission revenue accrual estimates and actual transmission revenue along with other miscellaneous minor transactions.
2 Transmission service revenues as presented in this table are $7.7 million less than the FY 2013 transmission and other operating revenues presented in the statements of revenues and expenses and accumulated net revenues due to the following: $7.9 million in pass-through wheeling revenues from the transmission revenue table and -$207,000 in variances between transmission revenue accrual estimates and actual transmission revenue along with other miscellaneous minor transactions.
Ancillary Services RevenuesAncillary service
FY 20141,2 FY 20133, 4
Revenue ($) Revenue ($)
Operating reserves - supplemental 43,388 140,600
Operating reserves - spinning 878,499 1,115,289
Regulation and frequency response 1,414,260 1,320,300
Energy imbalance service 12,641 21,703
Ancillary services total 2,348,788 2,597,892 1 Excludes $33 million in other revenues consisting of the following: $30.8 million in California Independent System Operator and resource adequacy; $1.5
million in scheduling services; $0.7 million in portfolio management; along with other minor miscellaneous corrections and transactions.2 Ancillary services revenues as presented in this table are $0.4 million greater than the FY 2014 transmission and other operating revenues presented in
the statements of revenues and expenses and accumulated net revenues due to variances between ancillary services revenue accrual estimates and actual ancillary services revenue along with other miscellaneous minor transactions.
3 Excludes $40.1 million in other revenues consisting of the following: $2.8 million in other revenues earned by the generating agencies; $35.4 million in CAISO and resource adequacy; $1.5 million in scheduling services; $657,000 in portfolio management; and $305,000 in other minor miscellaneous corrections and transactions.
4 Ancillary services revenues as presented in this table are $469,000 greater than the FY 2013 transmission and other operating revenues presented in the statements of revenues and expenses and accumulated net revenues due to variances between ancillary services revenue accrual estimates and actual ancillary services revenue along with other miscellaneous minor transactions.
Power Sales and RevenuesCustomer
FY 2014 FY 2013
Energy (MWh) Revenue ($) Energy (MWh) Revenue ($)
MUNICIPALITIES
California
City and County of San Francisco 18,023 746,889 18,362 610,789
City of Avenal 2,042 84,081 2,109 70,176
City of Redding1,2 402,021 14,826,231 540,370 17,181,338
City of Roseville 93,934 2,977,726 143,316 3,264,444
City of Santa Clara, dba Silicon Valley Power 183,689 5,835,794 279,675 6,387,131
Pittsburg Power Company 21,548 923,893 20,804 738,365
California subtotal 721,257 25,394,614 1,004,636 28,252,243
Municipalities subtotal 721,257 25,394,614 1,004,636 28,252,243
PUBLIC UTILITY DISTRICTS
California
Calaveras Public Power Agency 36,107 783,321 34,034 667,772
County of Sacramento 21,238 676,826 32,252 738,347
East Bay Municipal Utility District 20,540 929,217 13,341 513,856
Lassen Municipal Utility District3 146,478 6,809,895 145,370 6,388,341
Modesto Irrigation District 12,276 392,565 18,341 403,596
Sacramento Municipal Utility District1 2,912,369 139,947,191 3,251,655 141,653,515
Shelter Cove Resort Improvement District No. 1 6,141 277,340 8,672 346,945
Trinity Public Utilities District 105,529 2,709,743 105,578 2,311,517
Tuolumne Public Power Agency 27,594 585,491 25,811 506,332
Turlock Irrigation District4 10,868 336,910 23,267 672,693
California subtotal 3,299,140 153,448,499 3,658,321 154,202,914
Public utility districts subtotal 3,299,140 153,448,499 3,658,321 154,202,914
FEDERAL AGENCIES
California
Department of the Air Force - Beale Air Force Base 85,411 3,618,772 86,604 3,019,511
Department of the Air Force - Travis Air Force Base 103,779 4,613,263 105,396 4,155,529
Department of Defense - Defense Logistics Agency 35,818 1,542,607 37,928 1,376,984
Department of Energy - Berkeley Site Office 338,676 13,191,578 396,619 12,606,887
Department of the Navy - Naval Air Station, Lemoore 82,800 3,458,454 84,467 2,876,764
Department of the Navy - Naval Radio Station, Dixon 1,625 66,934 1,684 54,076
National Aeronautics and Space Administration - Ames Research Center 115,310 4,295,829 142,525 3,816,270
National Aeronautics and Space Administration - Ames Research Center, Eastside Airfield 18,338 772,529 17,899 621,507
Western Area Power Administration (Customer) 0 0 377 15,898
California subtotal 781,757 31,559,966 873,499 28,543,426

56
CENTRAL VALLEY PROJECT
Power Sales and Revenues, continuedCustomer
FY 2014 FY 2013
Energy (MWh) Revenue ($) Energy (MWh) Revenue ($)
Oregon
Department of Energy - Bonneville Power Administration 250 17,500 0 0
Oregon subtotal 250 17,500 0 0
Federal agencies subtotal 782,007 31,577,466 873,499 28,543,426
STATE AGENCIES
California
California Department of Corrections and Rehabilitation - California Medical Facility, Vacaville 13,684 605,759 13,470 508,077
California Department of Corrections and Rehabilitation - California State Prison, Sacramento 3,010 95,575 4,584 104,756
California Department of Corrections and Rehabilitation - Deuel Vocational Institution 20,008 906,012 20,796 838,881
California Department of Corrections and Rehabilitation - Northern California Youth Correctional Center 5,208 215,409 4,969 166,430
California Department of Corrections and Rehabilitation - Sierra Conservation Center 12,179 261,279 10,745 249,497
California Department of Parks and Recreation 70 4,239 108 4,625
California State University, Sacramento - Aquatic and Boat Safety Center 216 8,482 358 9,249
California State University, Sacramento 1,795 56,804 2,740 62,608
California State University System 6,457 185,465 10,676 226,858
University of California, Davis5 229,325 10,455,795 228,953 9,835,968
University of California, San Francisco 5,501 155,148 9,265 194,716
California subtotal 297,453 12,949,967 306,664 12,201,665
State agencies subtotal 297,453 12,949,967 306,664 12,201,665
IRRIGATION DISTRICTS
California
Byron-Bethany Irrigation District 3,895 141,088 4,373 120,207
East Contra Costa Irrigation District 5,265 189,007 5,036 131,439
Merced Irrigation District 8,572 253,723 13,657 295,301
Placer County Water Agency 942 28,319 1,267 29,403
Reclamation District 2035 4,069 155,518 4,076 113,995
San Juan Water District 1,944 63,621 2,974 69,368
California subtotal 24,687 831,276 31,383 759,713
Irrigation districts subtotal 24,687 831,276 31,383 759,713
NATIVE AMERICAN TRIBES
California
Coyote Valley Band of Pomo Indians 1,320 39,968 1,791 41,425
Table Mountain Rancheria 3,485 105,614 4,746 108,771
California subtotal 4,805 145,582 6,537 150,196
Native American tribes subtotal 4,805 145,582 6,537 150,196
Power Sales and Revenues, continuedCustomer
FY 2014 FY 2013
Energy (MWh) Revenue ($) Energy (MWh) Revenue ($)
POWER MARKETERS
Maryland
Exelon Generation Company 648 21,220 35 1,284
Maryland subtotal 648 21,220 35 1,284
Minnesota
Cargill Power Markets 0 0 95 1,425
Minnesota subtotal 0 0 95 1,425
New York
Barclays Bank 0 0 61 3,401
Morgan Stanley Capital Group 38,732 2,151,901 37,690 1,648,829
New York subtotal 38,732 2,151,901 37,751 1,652,230
Oregon
Iberdrola Renewables 372 9,108 1,226 37,153
Portland General Electric 525 18,640 1,040 20,635
Oregon subtotal 897 27,748 2,266 57,788
Texas
Calpine Energy Service L.P. 0 0 1,800 67,800
EDF Trading North America 0 0 20,634 862,732
Macquarie Energy 0 0 420 13,310
Shell Energy North America 20,960 1,125,785 13,649 582,473
Tenaska Power Services Company 1,960 104,580 0 0
Texas subtotal 22,920 1,230,365 36,503 1,526,315
INTERNATIONAL
Canada
Powerex 0 0 360 6,840
TransAlta Energy Marketing (U.S.) 10,846 607,653 5,368 236,617
Canada subtotal 10,846 607,653 5,728 243,457
Power marketers subtotal 74,043 4,038,887 82,378 3,482,499
JOINT POWER AUTHORITIES
California
Eastside Power Authority6 13,118 414,642 21,587 470,193
Northern California Power Agency7 353,370 11,245,009 537,207 12,284,692
Power and Water Resources Pooling Authority8 136,002 4,315,506 205,529 4,673,701
California subtotal 502,490 15,975,157 764,323 17,428,586
Joint power authorities subtotal 502,490 15,975,157 764,323 17,428,586
INDEPENDENT SYSTEM OPERATOR CORPORATIONS
California
California Independent System Operator Corporation 64,486 3,137,787 138,810 5,069,269
California subtotal 64,486 3,137,787 138,810 5,069,269
Independent system operator corporations subtotal 64,486 3,137,787 138,810 5,069,269

57
CENTRAL VALLEY PROJECT
Status of Repayment (dollars in thousands)Cumulative 20131 ($) Adjustment2 ($) Annual 20143 ($) Cumulative 2014 ($)
REVENUE:
Gross operating revenue 8,364,485 151,142 189,245 8,704,872
Income transfers (net) 163 0 0 163
Total operating revenue 8,364,648 151,142 189,245 8,705,035
ExPENSES:
O&M and other 1,728,670 33 99,721 1,828,424
Purchase power and other 5,625,231 129,323 92,248 5,846,802
Interest
Federally financed 441,703 91 9,530 451,324
Non-federally financed 0 0 0 0
Total interest 441,703 91 9,530 451,324
Total expense 7,795,604 129,447 201,499 8,126,550
(Deficit)/surplus revenue 0 21,695 (21,693) 2
INVESTMENT:
Federally financed power 775,940 0 36,233 812,173
Non-federally financed power 0 0 0 0
Nonpower 49,998 2,700 0 52,698
Total investment 825,938 2,700 36,233 864,871
INVESTMENT REPAID:
Federally financed power 569,044 0 9,439 578,483
Non-federally financed power 0 0 0 0
Nonpower 0 0 0 0
Total investment repaid 569,044 0 9,439 578,483
INVESTMENT UNPAID:
Federally financed power 206,896 0 26,794 233,690
Non-federally financed power 0 0 0 0
Nonpower 49,998 2,700 0 52,698
Total investment unpaid 256,894 2,700 26,794 286,388
FUND BALANCES:
Colorado River Development 0 0 0 0
Working capital 0 0 0 0
PERCENT OF INVESTMENT REPAID TO DATE:
Federal 73.34% 71.23%
Non-federal N/A N/A
Nonpower 0.00% 0.00%1 This column ties to the cumulative FY 2013 numbers on Page 57 of the FY 2013 Statistical Appendix.2 Based on FY 2014 final audited financial statements.3 Revenue/expenses are adjusted for the difference between the FY 2014 financial statements and the FY 2014 Power Repayment Study.
Power Sales and Revenues, continuedCustomer
FY 2014 FY 2013
Energy (MWh) Revenue ($) Energy (MWh) Revenue ($)
TRANSPORTATION
California
Bay Area Rapid Transit District 10,287 307,665 16,489 360,059
California subtotal 10,287 307,665 16,489 360,059
Transportation subtotal 10,287 307,665 16,489 360,059
PROJECT USE
California
Project use 186,171 21,818,815 867,219 21,671,068
California subtotal 186,171 21,818,815 867,219 21,671,068
Project-use subtotal 186,171 21,818,815 867,219 21,671,068
Central Valley total9,10 5,966,826 269,625,715 7,750,259 272,121,638 1 The pass-through revenues and expenses for the supplemental power sales for the City of Redding and the Sacramento Municipal Utility District are included
in the statistical appendix, but they are netted in the combined financial statements.2 The City of Redding includes allocations to the City of Shasta Lake and the Redding Rancheria.3 The Lassen Municipal Utility District includes an allocation to the Susanville Indian Rancheria.4 The Turlock Irrigation District includes an allocation to the Patterson Water District.5 The University of California-Davis, includes an allocation to the University of California-Berkeley.6 The Eastside Power Authority includes an allocation to the San Luis Water District.7 The Northern California Power Agency includes allocations to the cities of Alameda, Biggs, Fallon, Gridley, Healdsburg, Lodi, Lompoc, Palo Alto and Ukiah, as
well as the Plumas-Sierra Rural Electric Cooperative, the Port of Oakland and the Truckee Donner Public Utility District.8 The Power and Water Resources Pooling Authority includes allocations to Arvin-Edison Water Storage District; Banta-Carbona, Byron-Bethany, Glenn-Colusa,
James, Lower Tule River, Provident and Princeton, West Side and West Stanislaus Irrigation Districts; Cawelo and Westlands Water Districts; and Reclamation District #108.
9 Power revenues as presented in this table are $150.3 million greater than the FY 2014 sales of electric power presented in the statements of revenues and expenses and accumulated net revenues due to the following: $129.3 million in netted transactions where Western simultaneously purchases and sells electric power to the same counterparty; $21.8 million in project-use revenues that were reversed due to Governmentwide Treasury Account Symbol Adjusted Trial Balance System recording issues and rebilled in FY 2015, -$0.8 million in variances between revenue accrual estimates and actual revenue along with other minor miscellaneous corrections and transactions.
10 Power revenues as presented in this table are $129.1 million greater than the FY 2013 sales of electric power presented in the statements of revenues and expenses and accumulated net revenues due to the following: $128.0 million in netted transactions where Western simultaneously purchases and sells electric power to the same counterparty; $1.1 million in variances between revenue accrual estimates and actual revenue along with other miscellaneous minor transactions.

58
CENTRAL VALLEY PROJECT
Statements of Revenues and Expenses and Accumulated Net RevenuesFor the years ended Sept. 30, 2014 and 2013 (in thousands)
FY 2014 FY 2013
Western Reclamation Total Western Reclamation Total
Operating revenues:
Sales of electric power $119,305 $0 $119,305 $142,981 $0 $142,981
Transmission and other operating revenues 69,852 88 69,940 68,254 2,799 71,053
Gross operating revenues 189,157 88 189,245 211,235 2,799 214,034
Income transfers, net (57,905) 57,905 0 (69,502) 69,502 0
Total operating revenues 131,252 57,993 189,245 141,733 72,301 214,034
Operating expenses:
Operation and maintenance 40,797 45,376 86,173 40,700 44,194 84,894
Purchased power 41,780 0 41,780 38,552 0 38,552
Purchased transmission services 50,468 0 50,468 47,640 0 47,640
Depreciation 10,702 14,347 25,049 14,669 (1,642) 13,027
Administration and general 13,549 0 13,549 13,151 0 13,151
Total operating expenses 157,296 59,723 217,019 154,712 42,552 197,264
Net operating revenues (deficit) (26,044) (1,730) (27,774) (12,979) 29,749 16,770
Interest expenses:
Interest on payable to U.S. Treasury 6,082 5,302 11,384 11,000 4,700 15,700
Allowance for funds used during construction (1,779) (75) (1,854) (6,906) (30) (6,936)
Net interest on payable to U.S. Treasury 4,303 5,227 9,530 4,094 4,670 8,764
Interest on long-term liabilities 0 0 0 0 0 0
Net interest expenses 4,303 5,227 9,530 4,094 4,670 8,764
Net revenues (deficit) (30,347) (6,957) (37,304) (17,073) 25,079 8,006
Accumulated net revenues:
Balance, beginning of year 70,521 186,754 257,275 94,089 159,682 253,771
Change in capitalization 4,188 9,734 13,922 (6,495) 1,993 (4,502)
Balance, end of year $44,362 $189,531 $233,893 $70,521 $186,754 $257,275
Balance SheetsAs of Sept. 30, 2014 and 2013 (in thousands)
FY 2014 FY 2013
Western Reclamation Total Western Reclamation Total
Assets
Completed utility plant $466,959 $593,861 $1,060,820 $431,128 $582,523 $1,013,651
Accumulated depreciation (190,161) (378,118) (568,279) (179,727) (363,771) (543,498)
Net completed plant 276,798 215,743 492,541 251,401 218,752 470,153
Construction work-in-progress 6,837 56,584 63,421 28,718 50,658 79,376
Net utility plant 283,635 272,327 555,962 280,119 269,410 549,529
Cash 182,207 69,869 252,076 164,343 68,059 232,402
Accounts receivable, net 21,839 113 21,952 21,091 74 21,165
Regulatory assets 6,332 4,482 10,814 6,354 3,817 10,171
Other assets 9,831 0 9,831 10,217 0 10,217
Total assets 503,844 346,791 850,635 482,124 341,360 823,484
Liabilities:
Customer advances and other liabilities 21,781 6,518 28,299 15,309 4,743 20,052
Accounts payable 17,421 1,601 19,022 18,484 4,773 23,257
Environmental cleanup liabilities 817 185 1,002 707 200 907
Total liabilities 40,019 8,304 48,323 34,500 9,716 44,216
Capitalization:
Payable to U.S. Treasury 419,463 148,956 568,419 377,103 144,890 521,993
Accumulated net revenues 44,362 189,531 233,893 70,521 186,754 257,275
Total capitalization 463,825 338,487 802,312 447,624 331,644 779,268
Total liabilities and capitalization $503,844 $346,791 $850,635 $482,124 $341,360 $823,484
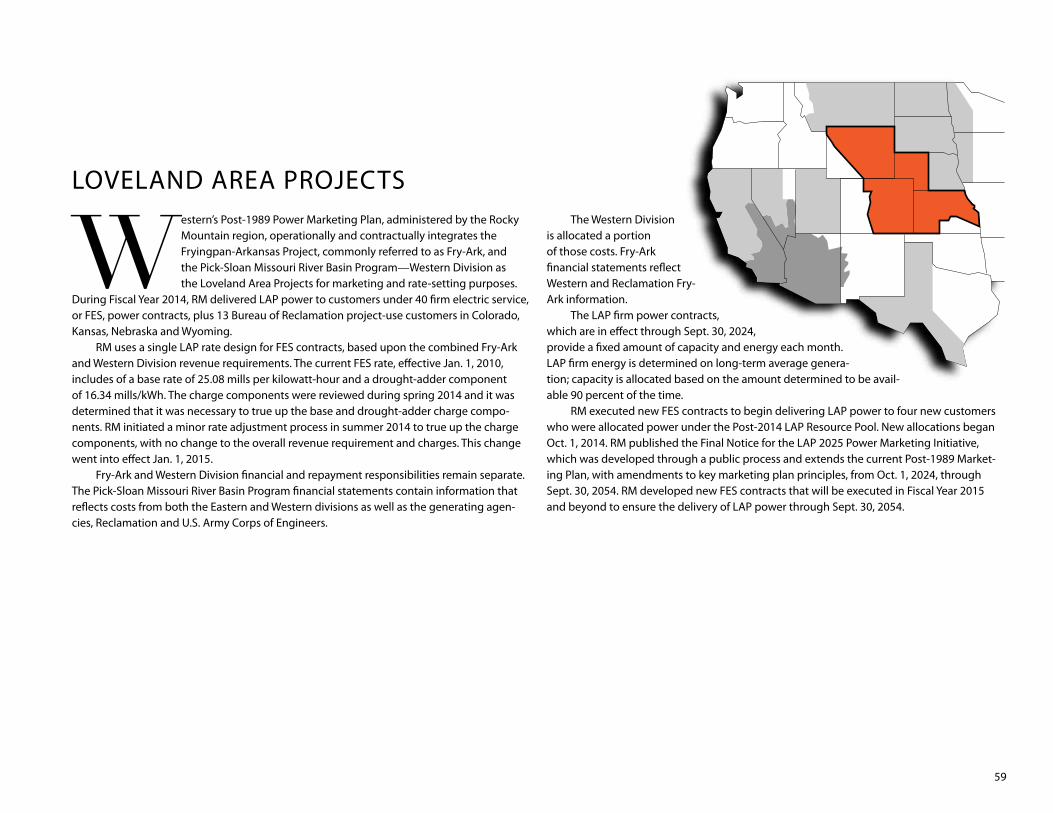
59
LOVELAND AREA PROJECTS
Western’s Post-1989 Power Marketing Plan, administered by the Rocky Mountain region, operationally and contractually integrates the Fryingpan-Arkansas Project, commonly referred to as Fry-Ark, and the Pick-Sloan Missouri River Basin Program—Western Division as the Loveland Area Projects for marketing and rate-setting purposes .
During Fiscal Year 2014, RM delivered LAP power to customers under 40 firm electric service, or FES, power contracts, plus 13 Bureau of Reclamation project-use customers in Colorado, Kansas, Nebraska and Wyoming .
RM uses a single LAP rate design for FES contracts, based upon the combined Fry-Ark and Western Division revenue requirements . The current FES rate, effective Jan . 1, 2010, includes of a base rate of 25 .08 mills per kilowatt-hour and a drought-adder component of 16 .34 mills/kWh . The charge components were reviewed during spring 2014 and it was determined that it was necessary to true up the base and drought-adder charge compo-nents . RM initiated a minor rate adjustment process in summer 2014 to true up the charge components, with no change to the overall revenue requirement and charges . This change went into effect Jan . 1, 2015 .
Fry-Ark and Western Division financial and repayment responsibilities remain separate . The Pick-Sloan Missouri River Basin Program financial statements contain information that reflects costs from both the Eastern and Western divisions as well as the generating agen-cies, Reclamation and U .S . Army Corps of Engineers .
The Western Division is allocated a portion of those costs . Fry-Ark financial statements reflect Western and Reclamation Fry-Ark information .
The LAP firm power contracts, which are in effect through Sept . 30, 2024, provide a fixed amount of capacity and energy each month . LAP firm energy is determined on long-term average genera-tion; capacity is allocated based on the amount determined to be avail-able 90 percent of the time .
RM executed new FES contracts to begin delivering LAP power to four new customers who were allocated power under the Post-2014 LAP Resource Pool . New allocations began Oct . 1, 2014 . RM published the Final Notice for the LAP 2025 Power Marketing Initiative, which was developed through a public process and extends the current Post-1989 Market-ing Plan, with amendments to key marketing plan principles, from Oct . 1, 2024, through Sept . 30, 2054 . RM developed new FES contracts that will be executed in Fiscal Year 2015 and beyond to ensure the delivery of LAP power through Sept . 30, 2054 .

60
Fryingpan-ArkansasThis multipurpose transmountain diversion project is located in south-central Colorado .
It diverts water from the Fryingpan River on the western slope of the Rocky Mountains to the Arkansas River on the eastern slope to support irrigation, municipal water supplies and electric power generation . Reclamation owns substantially all Fry-Ark facilities constructed to date .
The project has six dams and five reservoirs with a total storage capacity of 741,000 acre-feet of water, 70 miles of tunnels and canals and the Mount Elbert pumped-storage powerplant on the shore of Twin Lakes Reservoir . The two Mount Elbert pump generating units have a combined installed generating capacity of 200 megawatts . Although the majority of project capacity depends on water pumped during off-peak hours and water releases for power production when needed in on-peak hours, some generation is attributed to flow-through water .
The Mount Elbert pumped-storage plant has proven to be particularly valuable to West-ern and its customers . The plant provides Western with system regulation and reserves while firm power customers have maximized their use of the pumped-storage capability under their contracts by taking delivery during the day (on-peak) and returning energy at night (off-peak) to pump water back into the Mount Elbert forebay from Twin Lakes Reservoir .
Pick-Sloan Missouri Basin Program—Western DivisionBoth the Eastern and Western divisions have common electrical facilities at Yellowtail
Dam in Montana and at a point near Gering, Nebraska . The divisions, however, operate as separate and distinct systems . Both divisions contribute revenue to repay Pick-Sloan expenses and investments using different generating resources, firm power allocation meth-odologies and rate structures .
The installed capacity of the Western Division’s 19 powerplants is 630 megawatts . These generating resources include six powerplants built as part of five units of the Pick-Sloan: the Boysen, Glendo, Kortes, Riverton and Yellowtail units . The remaining 13 powerplants were constructed as part of four other Reclamation projects authorized prior to Pick-Sloan . These projects, which are now integrated with Pick-Sloan, are the Colorado-Big Thompson, Kendrick, North Platte and Shoshone projects and are referred to as the Integrated Projects . Reclamation owns, operates and maintains all Western Division powerplants .
The Western Division was drought free in Fiscal Year 2014 . Western Division reservoir storage was 86 percent of average at the beginning of FY 2014 . Reservoir inflows were well above average in all the river basins: 142 percent of average for the Colorado-Big Thompson Project, 136 percent in the North Platte Basin and 140 percent in the Bighorn Basin . The Ad-ams Tunnel export of water from the Colorado River Basin to the Big Thompson River Basin totaled 203,449 acre-feet in FY 2014 and was 88 percent of average . The resulting Western Division reservoir storage at the end of FY 2014 was 118 percent of average and a 36-per-cent increase over the previous year .

61
LOVELAND AREA PROJECTS
Facilities, SubstationsFacility FY 2014 FY 2013
Substations
Number of substations 79 77
Number of transformers 73 72
Transformer capacity (kVA) 3,440,710 3,227,370
Land (fee)
Acres 520.33 508.78
Hectares 210.66 205.98
Land (easement)
Acres 163.21 163.21
Hectares 66.08 66.08
Facilities, Substations, continuedFacility FY 2014 FY 2013
Buildings and communications sites
Number of buildings 191 191
Number of communications sites 112 110
Land (fee)
Acres 57.37 57.37
Hectares 23.23 23.23
Land (easement)
Acres 46.14 46.14
Hectares 18.68 18.68
Transmission LinesVoltage rating
Colorado Nebraska Wyoming Total
FY 2014 FY 2013 FY 2014 FY 2013 FY 2014 FY 2013 FY 2014 FY 2013
230-kV
Circuit miles 91.93 91.61 125.79 125.79 425.63 424.23 643.35 641.63
Circuit kilometers 147.92 147.40 202.40 202.40 684.84 682.59 1,035.15 1,032.39
Acres 1,196.78 1,196.78 1,949.64 1,949.64 6,310.80 6,310.80 9,457.22 9,457.22
Hectares 484.53 484.53 789.33 789.33 2,554.99 2,554.99 3,828.84 3,828.85
138-kV
Circuit miles 23.50 23.50 0.00 0.00 0.00 0.00 23.50 23.50
Circuit kilometers 37.81 37.81 0.00 0.00 0.00 0.00 37.81 37.81
Acres 285.99 285.99 0.00 0.00 0.00 0.00 285.99 285.99
Hectares 115.79 115.79 0.00 0.00 0.00 0.00 115.79 115.79
115-kV
Circuit miles 672.31 749.43 345.48 345.48 1,139.26 1,159.59 2,157.05 2,254.50
Circuit kilometers 1,081.75 1,205.83 555.88 555.88 1,833.07 1,865.78 3,470.69 3,627.49
Acres 5,503.50 5,554.44 3,494.06 3,494.06 10,424.69 10,424.69 19,422.25 19,473.19
Hectares 2,228.14 2,248.77 1,414.60 1,414.60 4,220.53 4,220.53 7,863.28 7,883.90
69-kV and below
Circuit miles 99.67 99.67 69.44 69.44 392.21 392.21 561.32 561.32
Circuit kilometers 160.37 160.37 111.73 111.73 631.07 631.07 903.16 903.17
Acres 763.27 763.27 331.16 331.16 3,494.84 3,495.01 4,589.27 4,589.44
Hectares 309.02 309.02 134.07 134.07 1,414.92 1,414.99 1,858.01 1,858.08
Total
Circuit miles 887.41 964.21 540.71 540.71 1,957.10 1,976.03 3,385.22 3,480.95
Circuit kilometers 1,427.84 1,551.41 870.00 870.01 3,148.97 3,179.44 5,446.82 5,600.86
Acres 7,749.54 7,800.48 5,774.86 5,774.86 20,230.33 20,230.50 33,754.73 33,805.84
Hectares 3,137.47 3,158.11 2,338.01 2,338.00 8,190.44 8,190.51 13,665.91 13,686.62

62
LOVELAND AREA PROJECTS
Storage Generation
0
1
2
3
4
5
6
72014 storage Average storage
SepAugJulJunMayAprMarFebJanDecNovOct
Stor
age
in m
illio
n ac
re-fe
et
0
60
120
180
240
300
360
2014 generation Average generation
SepAugJulJunMayAprMarFebJanDecNovOct
Gen
erat
ion
in m
illio
n kW
h
PowerplantsState/plant name Operating agency River Initial in-service date Existing number
of unitsInstalled capability1
FY 2014 (MW)Actual operating capability (MW)2 Net generation (GWh)3
July 1, 2013 July 1, 2014 FY 2013 FY 2014ColoradoBig Thompson Reclamation Trans-Mtn. Div. Apr 1959 1 5 4 0 8 2Estes Reclamation Trans-Mtn. Div. Sep 1950 3 45 30 45 104 92Flatiron4,5 Reclamation Trans-Mtn. Div. Jan 1954 3 95 54 54 243 241Green Mountain Reclamation Blue May 1943 2 26 26 26 25 94Marys Lake Reclamation Trans-Mtn. Div. May 1951 1 8 8 8 40 35Mount Elbert4 Reclamation Arkansas Oct 1981 2 200 206 206 339 230Pole Hill Reclamation Trans-Mtn. Div. Jan 1954 1 38 0 32 177 189MontanaYellowtail6,7 Reclamation Big Horn Aug 1966 2 125 144 108 210 508WyomingAlcova Reclamation North Platte Jul 1955 2 41 39 39 92 75Boysen Reclamation Big Horn Aug 1952 2 15 15 15 37 58Buffalo Bill Reclamation Shoshone May 1995 3 18 18 18 51 94Fremont Canyon Reclamation North Platte Dec 1960 2 67 33 67 147 139Glendo Reclamation North Platte Dec 1958 2 38 38 38 54 82Guernsey Reclamation North Platte Jul 1999 2 6 6 3 9 16Heart Mountain Reclamation Shoshone Dec 1948 1 5 5 5 18 17Kortes Reclamation North Platte Jun 1950 3 36 36 24 112 131Pilot Butte8 Reclamation Wind Jan 1999 2 2 0 0 0 0Seminoe Reclamation North Platte Aug 1939 3 52 51 51 91 122Shoshone Reclamation Shoshone May 1995 1 3 3 3 17 20Spirit Mountain Reclamation Shoshone May 1995 1 5 0 5 18 15Loveland Area Projects total 39 830 716 747 1,792 2,160 1 Installed operating capability is the maximum generating capability of the units' at-unity power factor without exceeding the specified heat rise on each unit and independent of water constraints.2 Actual operating capability represents the operating capability on July 1, but may not represent the coincident or non-coincident peak operating capability for the powerplant, project or Western as a whole.3 Net generation is gross plant generation less plant use. These amounts have not been reduced by other priorities such as project pumping energy.4 Total net generation of pump/generating plant without pumping energy subtracted. 5 Only Unit 3 has pump/generation capability.6 RM and UGP each market half of the plant capability and energy.7 Normal sustained maximum capacity of each unit is 62.5 MW but units may be evaluated for higher output on a case-by-case basis.8 Plant mothballed due to repair cost but not decommissioned.Operating Agencies:Reclamation - Bureau of Reclamation, Deptartment of the Interior

63
LOVELAND AREA PROJECTS
Active Transmission and Ancillary Services Rate ProvisionsFiscal year Rate schedule designation Rate
2014 L-NT1, Annual transmission revenue requirement for network integration transmission service Load ratio share of 1/12 of the revenue requirement of $64,684,248.
2014 L-FPT1, Long-term firm and short-term firm point-to-point transmission service $4.00 per kW/month
2014 L-NFPT1, Nonfirm point-to-point transmission service 5.48 mills/kWh (maximum)
2014 L-AS1, Scheduling, system control and dispatch service $23.63 schedule/day
2014 L-AS2, Reactive supply and voltage control from generation sources service $0.368 per kW/month
2014 L-AS3, Regulation and frequency response service $0.202 per kW/month
2014 L-AS4, Energy imbalance service Imbalance between 1.5 percent and 7.5 percent is a 10-percent penalty; imbalance greater than 7.5 percent is a 25-percent penalty.
2014 L-AS5, Operating reserve - spinning reserve service Pass-through cost
2014 L-AS6, Operating reserve - supplemental reserve service Pass-through cost
2014 L-AS7, Transmission losses service 5.0 percent - weighted average real-time hourly Western Area Colorado Missouri Balancing Authority purchase price.
2014 L-AS9, Generator imbalance service Imbalance between 1.5 percent and 7.5 percent is a 10-percent penalty.
2014 L-UU1, Unreserved-use penalties 200 percent of LAP's firm point-to-point rate
Active Firm Power Rate ProvisionsFiscal year Rate schedule designation Capacity charge
($/kW of billing demand)Energy charge not in excess of delivery
obligations Effective date Annual composite rate
2014 LF-9 5.43 20.71 mills/kWh 1/1/2010 41.42 mills/kWh
Active Rate ActionsRate order
number Project Type of rate action Date of notice of public participation
Rate schedule designation
Effective date of rate (first day of first full billing
period)
Annual incremental ($ in thousands) Notes Date submitted to FERC Date of FERC
confirmation
WAPA-163 Loveland Area Projects, Colorado River Storage Project, Pacific Northwest-Pacific Southwest Intertie, Central Arizona Project and Parker-Davis
New formula rates for use under WestConnect's Point-to-Point Regional Transmission Service Participation Agreement
11/6/2013 WC-8 6/01/2014 N/A Short-term rate established under Delegation Order No. 00-037.00A and recently confirmed as a permanent rate for non-firm point-to-point transmission service.
5/21/2014 12/15/2014
Active Marketing PlanProject Expiration date
Loveland Area Projects 09/30/2024

64
LOVELAND AREA PROJECTS
Power Sales by State and Customer CategoryState/customer category
FY 20141 FY 20132
Long-term (MWh) Other (MWh) Total energy (MWh) Long-term ($) Other ($) Total revenue ($) Energy (MWh) Revenue ($)ArizonaMunicipalities 0 0 0 0 0 0 28 990 Cooperatives 0 661 661 0 21,416 21,416 1,345 40,806 State agencies 0 88,287 88,287 0 2,374,643 2,374,643 43,773 1,012,981 Native American tribes 0 0 0 0 0 0 5 90 Investor-owned utilities 0 3,062 3,062 0 81,482 81,482 1,181 33,526 Interproject 0 6,245 6,245 0 196,382 196,382 1,880 71,265 Arizona subtotal 0 98,255 98,255 0 2,673,923 2,673,923 48,212 1,159,658 ColoradoMunicipalities 457,221 167 457,388 18,552,731 3,318 18,556,049 447,294 17,799,344 Cooperatives 1,035,276 0 1,035,276 44,371,783 0 44,371,783 1,019,662 44,008,372 Federal agencies 44,257 0 44,257 1,425,474 0 1,425,474 44,221 1,424,720 Investor-owned utilities 0 12,439 12,439 0 281,195 281,195 10,740 180,004 Project use 192 0 192 1,347 0 1,347 256 1,801 Colorado subtotal 1,536,946 12,606 1,549,552 64,351,335 284,513 64,635,848 1,522,173 63,414,241 KansasMunicipalities 124,437 0 124,437 5,034,461 0 5,034,461 117,108 4,729,177 Cooperatives 104,604 0 104,604 3,392,572 0 3,392,572 111,872 3,696,973 Native American tribes 23,647 0 23,647 990,360 0 990,360 23,647 990,360 Project use 0 0 0 0 0 0 91 226 Kansas subtotal 252,688 0 252,688 9,417,393 0 9,417,393 252,718 9,416,736 MinnesotaPower marketers 0 896 896 0 24,770 24,770 0 0 Minnesota subtotal 0 896 896 0 24,770 24,770 0 0 MontanaInterproject 0 0 0 0 0 0 10 198 Montana subtotal 0 0 0 0 0 0 10 198 NebraskaMunicipalities 167,732 0 167,732 6,868,666 0 6,868,666 173,951 7,509,020 Public utility districts 13,667 0 13,667 479,733 0 479,733 13,667 479,733 Nebraska subtotal 181,399 0 181,399 7,348,399 0 7,348,399 187,618 7,988,753 New MexicoInvestor-owned utilities 0 3,275 3,275 0 99,727 99,727 1,766 46,100 New Mexico subtotal 0 3,275 3,275 0 99,727 99,727 1,766 46,100 NevadaInvestor-owned utilities 0 459 459 0 10,557 10,557 358 7,024 Power marketers 0 2,272 2,272 0 69,507 69,507 2,382 63,761 Nevada subtotal 0 2,731 2,731 0 80,064 80,064 2,740 70,785 New YorkPower marketers 0 36,109 36,109 0 791,409 791,409 69,582 1,130,702 New York subtotal 0 36,109 36,109 0 791,409 791,409 69,582 1,130,702 North DakotaCooperatives 90,166 0 90,166 3,505,174 0 3,505,174 104,158 3,873,226 Power marketers 0 14,710 14,710 0 229,435 229,435 480 12,370 North Dakota subtotal 90,166 14,710 104,876 3,505,174 229,435 3,734,609 104,638 3,885,596

65
LOVELAND AREA PROJECTS
Power Sales by State and Customer Category, continuedState/customer category
FY 20141 FY 20132
Long-term (MWh) Other (MWh) Total energy (MWh) Long-term ($) Other ($) Total revenue ($) Energy (MWh) Revenue ($)OregonInvestor-owned utilities 0 563 563 0 16,250 16,250 2,305 41,943 Oregon subtotal 0 563 563 0 16,250 16,250 2,305 41,943 PennsylvaniaInvestor-owned utilities 0 400 400 0 11,808 11,808 608 15,060 Pennsylvania subtotal 0 400 400 0 11,808 11,808 608 15,060 South DakotaInvestor-owned utilities 0 69,982 69,982 0 1,452,853 1,452,853 32,517 520,329 South Dakota subtotal 0 69,982 69,982 0 1,452,853 1,452,853 32,517 520,329 TexasInvestor-owned utilities 0 1,154 1,154 0 29,016 29,016 0 0 Texas subtotal 0 1,154 1,154 0 29,016 29,016 0 0 UtahInterproject 0 343,252 343,252 0 8,355,081 8,355,081 277,868 5,942,761 Utah subtotal 0 343,252 343,252 0 8,355,081 8,355,081 277,868 5,942,761 WyomingCooperatives 449 0 449 15,855 0 15,855 449 15,855 Federal agencies 16,261 0 16,261 543,294 0 543,294 16,261 543,294 Irrigation districts 158 0 158 6,505 0 6,505 154 6,674 Native American tribes 4,189 0 4,189 175,639 0 175,639 4,189 175,639 Project use 9,256 0 9,256 23,139 0 23,139 10,516 26,289 Wyoming subtotal 30,313 0 30,313 764,432 0 764,432 31,569 767,751 INTERNATIONALCanadaPower marketers 0 933 933 0 23,448 23,448 2,948 22,799 Canada subtotal 0 933 933 0 23,448 23,448 2,948 22,799 Loveland Area Projects total 2,091,512 584,866 2,676,378 85,386,733 14,072,297 99,459,030 2,537,272 94,423,412 1 Power revenues as presented in this table are $0.7 million less than the FY 2014 sales of electric power presented in the statements of revenues and expenses and accumulated net revenues due to variances between revenue accrual estimates and actual revenue along with other minor miscellaneous corrections and
transactions.2 Power revenues as presented in this table are $10.6 million less than the FY 2013 sales of electric power presented in the statements of revenues and expenses and accumulated net revenues due to the following: $10.5 million in certain object classes excluded from the power billings sales reports but included in the sales of
electric power line; $0.1 million in variances between revenue accrual estimates and actual revenue along with other miscellaneous minor transactions.
Power Sales by Customer CategoryCustomer category
FY 20141 FY 20132
Long-term (MWh) Other (MWh) Total energy (MWh) Long-term ($) Other ($) Total revenue ($) Energy (MWh) Revenue ($)Municipalities 749,390 167 749,557 30,455,858 3,318 30,459,176 738,381 30,038,531 Cooperatives 1,230,495 661 1,231,156 51,285,384 21,416 51,306,800 1,237,486 51,635,232 Public utility districts 13,667 0 13,667 479,733 0 479,733 13,667 479,733 Federal agencies 60,518 0 60,518 1,968,768 0 1,968,768 60,482 1,968,014 State agencies 0 88,287 88,287 0 2,374,643 2,374,643 43,773 1,012,981 Irrigation districts 158 0 158 6,505 0 6,505 154 6,674 Native American tribes 27,836 0 27,836 1,165,999 0 1,165,999 27,841 1,166,089 Investor-owned utilities 0 91,334 91,334 0 1,982,888 1,982,888 49,475 843,986 Power marketers 0 54,920 54,920 0 1,138,569 1,138,569 75,392 1,229,632 Interproject 0 349,497 349,497 0 8,551,463 8,551,463 279,758 6,014,224 Project use 9,448 0 9,448 24,486 0 24,486 10,863 28,316 Loveland Area Projects total 2,091,512 584,866 2,676,378 85,386,733 14,072,297 99,459,030 2,537,272 94,423,412 1 Power revenues as presented in this table are $0.7 million less than the FY 2014 sales of electric power presented in the statements of revenues and expenses and accumulated net revenues due to variances between revenue accrual estimates and actual revenue along with other minor miscellaneous corrections and
transactions.2 Power revenues as presented in this table are $10.6 million less than the FY 2013 sales of electric power presented in the statements of revenues and expenses and accumulated net revenues due to the following: $10.5 million in certain object classes excluded from the power billings sales reports but included in the sales of
electric power line; $0.1 million in variances between revenue accrual estimates and actual revenue along with other miscellaneous minor transactions.

66
LOVELAND AREA PROJECTS
Customers by State and Customer CategoryState/customer category
FY 2014 FY 2013
Long-term Other Total Long-term Other TotalArizonaMunicipalities 0 0 0 0 1 1Cooperatives 0 2 2 0 2 2State agencies 0 1 1 0 1 1Investor-owned utilities 0 2 2 0 1 1Native American tribes 0 0 0 0 1 1Arizona subtotal 0 5 5 0 6 6ColoradoMunicipalities 10 0 10 10 0 10Cooperatives 2 0 2 2 1 3Federal agencies 6 0 6 6 0 6Investor-owned utilities 0 1 1 0 1 1Colorado subtotal 18 1 19 18 2 20KansasMunicipalities 3 0 3 3 0 3Cooperatives 3 0 3 3 0 3Native American tribes 4 0 4 4 0 4Kansas subtotal 10 0 10 10 0 10MinnesotaPower marketers 0 1 1 0 0 0Minnesota subtotal 0 1 1 0 0 0NebraskaMunicipalities 5 0 5 5 0 5Public utility districts 1 0 1 1 0 1Nebraska subtotal 6 0 6 6 0 6New MexicoInvestor-owned utilities 0 1 1 0 1 1New Mexico subtotal 0 1 1 0 1 1NevadaInvestor-owned utilities 0 1 1 0 1 1Power marketers 0 1 1 0 1 1Nevada subtotal 0 2 2 0 2 2New YorkPower marketers 0 1 1 0 1 1New York subtotal 0 1 1 0 1 1North DakotaCooperatives 1 0 1 1 0 1Power marketers 0 1 1 0 1 1North Dakota subtotal 1 1 2 1 1 2OregonInvestor-owned utilities 0 1 1 0 1 1Oregon subtotal 0 1 1 0 1 1
Customers by State and Customer Category, continuedState/customer category
FY 2014 FY 2013
Long-term Other Total Long-term Other TotalPennsylvaniaInvestor-owned utilities 0 1 1 0 1 1Pennsylvania subtotal 0 1 1 0 1 1South DakotaInvestor-owned utilities 0 1 1 0 1 1South Dakota subtotal 0 1 1 0 1 1TexasInvestor-owned utilities 0 1 1 0 0 0Texas subtotal 0 1 1 0 0 0WyomingCooperatives 1 0 1 1 0 1Federal agencies 1 0 1 1 0 1Irrigation districts 2 0 2 2 0 2Native American tribes 1 0 1 1 0 1Wyoming subtotal 5 0 5 5 0 5INTERNATIONALCanadaPower marketers 0 1 1 0 1 1Canada subtotal 0 1 1 0 1 1Loveland Area Projects subtotal 40 17 57 40 17 57Project use 9 0 9 11 0 11Interproject 0 2 2 0 3 3Loveland Area Projects total 49 19 68 51 20 71
Summary by Customer CategoryCustomer category
FY 2014 FY 2013
Long-term Other Total Long-term Other Total
Municipalities 18 0 18 18 1 19
Cooperatives 7 2 9 7 3 10
Public utility districts 1 0 1 1 0 1
Federal agencies 7 0 7 7 0 7
State agencies 0 1 1 0 1 1
Irrigation districts 2 0 2 2 0 2
Native American tribes 5 0 5 5 1 6
Investor-owned utilities 0 9 9 0 7 7
Power marketers 0 5 5 0 4 4
Loveland Area Projects subtotal 40 17 57 40 17 57
Project use 9 0 9 11 0 11
Interproject 0 2 2 0 3 3
Loveland Area Projects total 49 19 68 51 20 71
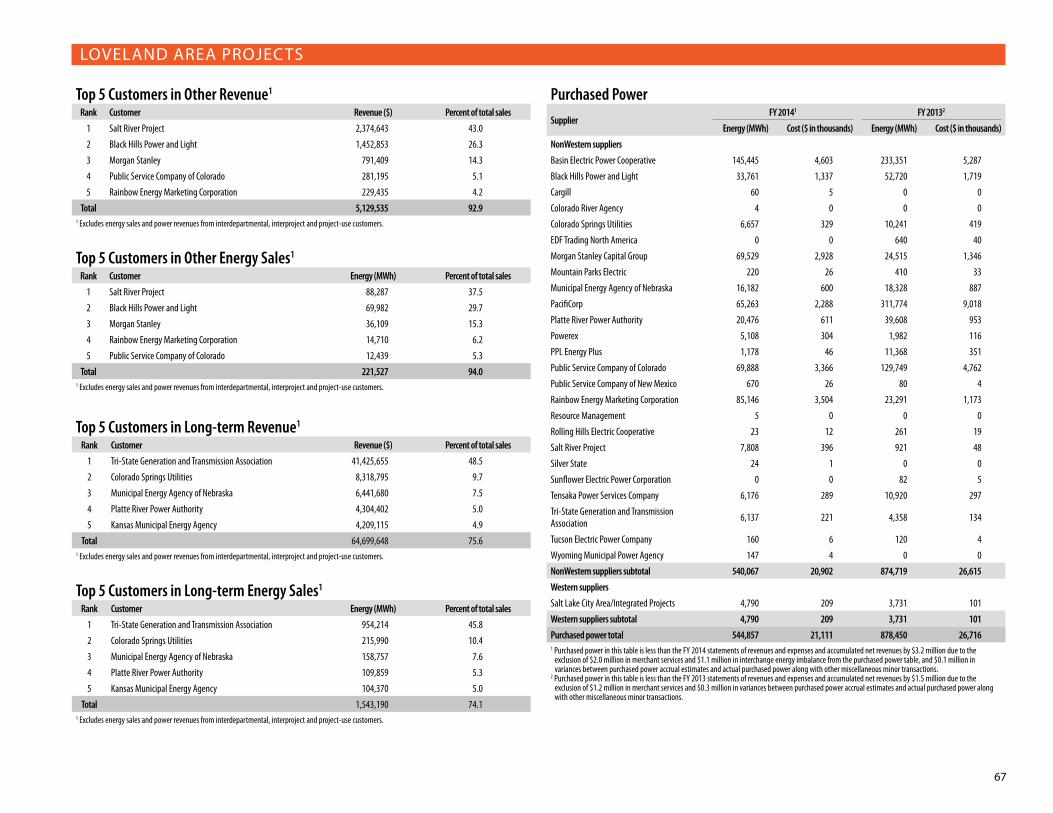
67
LOVELAND AREA PROJECTS
Top 5 Customers in Other Revenue1
Rank Customer Revenue ($) Percent of total sales
1 Salt River Project 2,374,643 43.0
2 Black Hills Power and Light 1,452,853 26.3
3 Morgan Stanley 791,409 14.3
4 Public Service Company of Colorado 281,195 5.1
5 Rainbow Energy Marketing Corporation 229,435 4.2
Total 5,129,535 92.91 Excludes energy sales and power revenues from interdepartmental, interproject and project-use customers.
Top 5 Customers in Other Energy Sales1
Rank Customer Energy (MWh) Percent of total sales
1 Salt River Project 88,287 37.5
2 Black Hills Power and Light 69,982 29.7
3 Morgan Stanley 36,109 15.3
4 Rainbow Energy Marketing Corporation 14,710 6.2
5 Public Service Company of Colorado 12,439 5.3
Total 221,527 94.01 Excludes energy sales and power revenues from interdepartmental, interproject and project-use customers.
Top 5 Customers in Long-term Revenue1
Rank Customer Revenue ($) Percent of total sales
1 Tri-State Generation and Transmission Association 41,425,655 48.5
2 Colorado Springs Utilities 8,318,795 9.7
3 Municipal Energy Agency of Nebraska 6,441,680 7.5
4 Platte River Power Authority 4,304,402 5.0
5 Kansas Municipal Energy Agency 4,209,115 4.9
Total 64,699,648 75.61 Excludes energy sales and power revenues from interdepartmental, interproject and project-use customers.
Top 5 Customers in Long-term Energy Sales1
Rank Customer Energy (MWh) Percent of total sales
1 Tri-State Generation and Transmission Association 954,214 45.8
2 Colorado Springs Utilities 215,990 10.4
3 Municipal Energy Agency of Nebraska 158,757 7.6
4 Platte River Power Authority 109,859 5.3
5 Kansas Municipal Energy Agency 104,370 5.0
Total 1,543,190 74.11 Excludes energy sales and power revenues from interdepartmental, interproject and project-use customers.
Purchased PowerSupplier
FY 20141 FY 20132
Energy (MWh) Cost ($ in thousands) Energy (MWh) Cost ($ in thousands)
NonWestern suppliers
Basin Electric Power Cooperative 145,445 4,603 233,351 5,287
Black Hills Power and Light 33,761 1,337 52,720 1,719
Cargill 60 5 0 0
Colorado River Agency 4 0 0 0
Colorado Springs Utilities 6,657 329 10,241 419
EDF Trading North America 0 0 640 40
Morgan Stanley Capital Group 69,529 2,928 24,515 1,346
Mountain Parks Electric 220 26 410 33
Municipal Energy Agency of Nebraska 16,182 600 18,328 887
PacifiCorp 65,263 2,288 311,774 9,018
Platte River Power Authority 20,476 611 39,608 953
Powerex 5,108 304 1,982 116
PPL Energy Plus 1,178 46 11,368 351
Public Service Company of Colorado 69,888 3,366 129,749 4,762
Public Service Company of New Mexico 670 26 80 4
Rainbow Energy Marketing Corporation 85,146 3,504 23,291 1,173
Resource Management 5 0 0 0
Rolling Hills Electric Cooperative 23 12 261 19
Salt River Project 7,808 396 921 48
Silver State 24 1 0 0
Sunflower Electric Power Corporation 0 0 82 5
Tensaka Power Services Company 6,176 289 10,920 297
Tri-State Generation and Transmission Association 6,137 221 4,358 134
Tucson Electric Power Company 160 6 120 4
Wyoming Municipal Power Agency 147 4 0 0
NonWestern suppliers subtotal 540,067 20,902 874,719 26,615
Western suppliers
Salt Lake City Area/Integrated Projects 4,790 209 3,731 101
Western suppliers subtotal 4,790 209 3,731 101
Purchased power total 544,857 21,111 878,450 26,716 1 Purchased power in this table is less than the FY 2014 statements of revenues and expenses and accumulated net revenues by $3.2 million due to the
exclusion of $2.0 million in merchant services and $1.1 million in interchange energy imbalance from the purchased power table, and $0.1 million in variances between purchased power accrual estimates and actual purchased power along with other miscellaneous minor transactions.
2 Purchased power in this table is less than the FY 2013 statements of revenues and expenses and accumulated net revenues by $1.5 million due to the exclusion of $1.2 million in merchant services and $0.3 million in variances between purchased power accrual estimates and actual purchased power along with other miscellaneous minor transactions.

68
LOVELAND AREA PROJECTS
Purchased TransmissionSupplier
FY 20141 FY 20132
Cost ($ in thousands) Cost ($ in thousands)
NonWestern suppliers
High Plains Power 16 18
Nebraska Public Power District 600 584
PacifiCorp 113 67
Public Service Company of Colorado 4,451 4,154
Sunflower Electric Power Corporation 2,439 2,000
Tri-State Generation and Transmission Association 356 246
NonWestern suppliers subtotal 7,975 7,069
Western Suppliers
Salt Lake City Area/Integrated Projects 3 55
Western suppliers subtotal 3 55
Purchased transmission total 7,978 7,124 1 Purchased transmission in this table is less than the FY 2014 statements of revenues and expenses and accumulated net revenues by $5.9 million due to
the exclusion of $6.0 million in purchased ancillary services reported in the purchased ancillary services table and -$0.1 million due to variances between purchased transmission accrual estimates and actual purchased transmission along with other miscellaneous minor transactions.
2 Purchased transmission in this table is less than the FY 2013 statements of revenues and expenses and accumulated net revenues by $7.9 million due to the exclusion of $7.4 million in purchased ancillary services reported in the purchased ancillary services table and $0.5 million due to variances between purchased transmission accrual estimates and actual purchased transmission along with other miscellaneous minor transactions.
Purchased Ancillary ServicesSupplier
FY 2014 FY 2013
Cost ($ in thousands) Cost ($ in thousands)NonWestern suppliersBasin Electric Power Cooperative 620 251 Black Hills Colorado Electric 0 1 Black Hills Power and Light 998 690 Black Hills State University 13 20 Cheyenne Light Fuel and Power 25 31 Colorado Springs Utilities 259 286 Deseret Generation and Transmission Cooperative 223 1 Farmington 243 161 Holy Cross Electric Association 57 3 Municipal Energy Agency of Nebraska 340 226 Nebraska Public Power District 57 63 Pacificorp 706 1,455 Page Electric Utility 224 16 Platte River Power Authority 0 5 Public Service Company of Colorado 367 31 Rocky Mountain Generation Cooperative 0 17 Salt River Project 10 2 Tri-State Generation and Transmission Association 254 3,597 Williams Energy Services Company 93 190 Wyoming Municipal Power Agency 25 33 NonWestern suppliers subtotal 4,514 7,079 Western suppliersSalt Lake City Area/Integrated Projects 1,479 330 Western Area Colorado Missouri Balancing Authority 0 5 Western suppliers subtotal 1,479 335 Purchased ancillary services total1 5,993 7,414 1 Purchased ancillary services are included in the purchased transmission services line per the FY 2014 and FY 2013 statements of revenues and expenses and
accumulated net revenues.
Ancillary Services Revenues1
Ancillary service FY 20142 FY 20133
Revenue ($) Revenue ($)
Interchange energy 3,910 28,312
Generator imbalance 1,960,248 909,755
Reactive supply and voltage control service 1,929,010 1,882,990
Scheduling and dispatch service4 940,356 682,962
Operating reserves - spinning5 845,563 856,352
Regulation and frequency response 5,179,935 6,949,015
Energy imbalance 6,686,023 4,479,540
Ancillary services total 17,545,045 15,788,926 1 Excludes other revenues of $0.7 million in FY 2014 and FY 2013.2 Ancillary services revenues as presented in this table are $0.6 million greater than the FY 2014 transmission and other operating revenue presented in the
statements of revenues and expenses and accumulated net revenues (financial statements) due to variances between ancillary service revenues accrual estimates and actual ancillary services revenue along with other miscellaneous minor corrections and transactions.
3 Ancillary services revenues as presented in this table are $6.6 million greater than the FY 2013 transmission and other operating revenue presented in the statements of revenues and expenses and accumulated net revenues (financial statements). The following items were recorded to sales of electric power in the financial statements but are presented in the ancillary table: $4.5 million in energy imbalance; $0.9 million in generator imbalance; $0.9 million in spinning reserves; $0.2 million in regulation and frequency response; and $0.1 million variance between ancillary services revenue accrual estimates and actual ancillary services revenue.
4 Represents balancing authority services charged to non-transmission customers. Charges to transmission customers are included in transmission revenues.5 Includes revenue from Rocky Mountain Reserve Group responses.
Transmission Services Revenues1
Transmission service FY 20142 FY 20133
Revenue ($) Revenue ($)Wheeling and transmission service 227,541 1,365,243 Firm network transmission service 36,121,099 33,051,868 Firm point-to-point transmission service 4,026,680 5,407,859 Transmission losses 6,197,684 4,067,093 Nonfirm point-to-point transmission service 3,138,519 3,152,405 Short term point-to-point transmission service 448,480 20,020 Transmission services total 50,160,003 47,064,488 1 Excludes miscellaneous charges.2 Transmission service revenues as presented in this table are $0.1 million greater than the FY 2014 transmission and other operating revenue presented in the
statements of revenues and expenses and accumulated net revenues (financial statements) due to variances between transmission revenue accrual estimates and actual transmission revenue along with other miscellaneous minor corrections and transactions.
3 Transmission service revenues as presented in this table are $4.1 million greater than the FY 2013 transmission and other operating revenue presented in the statements of revenues and expenses and accumulated net revenues (financial statements) due to the following: $4.1 million in transmission losses revenues which are classified as sales of electric power in the financial statements.
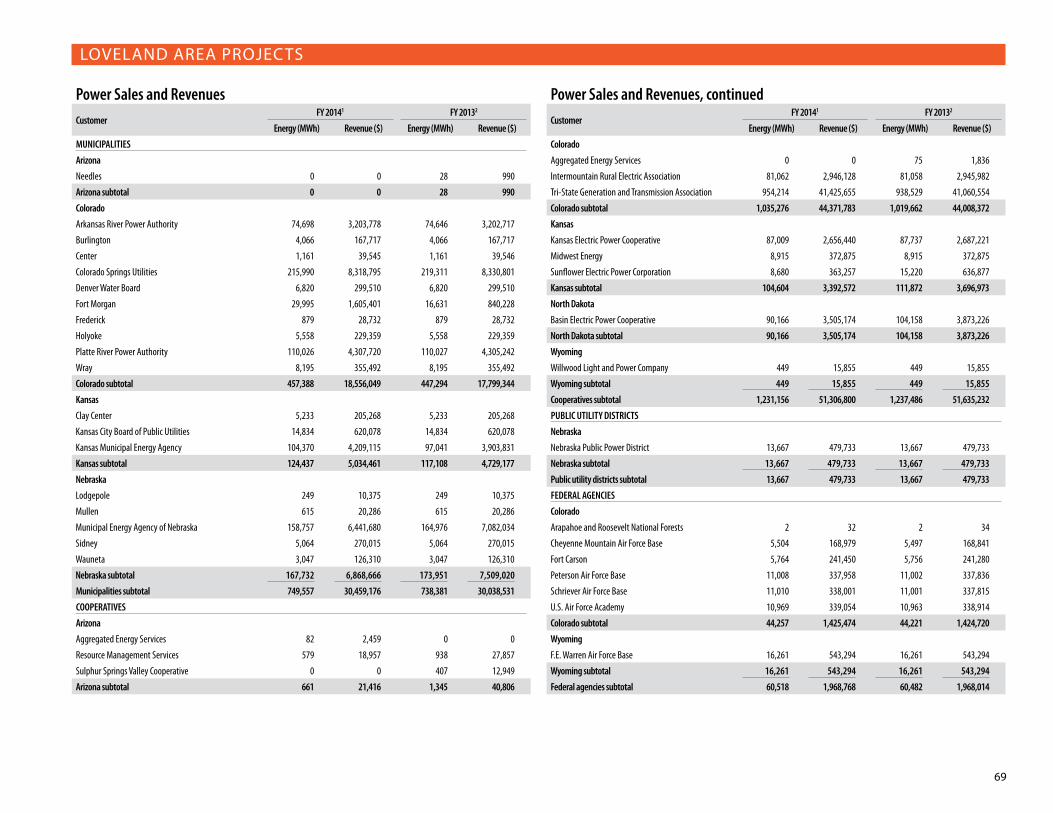
69
LOVELAND AREA PROJECTS
Power Sales and RevenuesCustomer
FY 20141 FY 20132
Energy (MWh) Revenue ($) Energy (MWh) Revenue ($)
MUNICIPALITIES
Arizona
Needles 0 0 28 990
Arizona subtotal 0 0 28 990
Colorado
Arkansas River Power Authority 74,698 3,203,778 74,646 3,202,717
Burlington 4,066 167,717 4,066 167,717
Center 1,161 39,545 1,161 39,546
Colorado Springs Utilities 215,990 8,318,795 219,311 8,330,801
Denver Water Board 6,820 299,510 6,820 299,510
Fort Morgan 29,995 1,605,401 16,631 840,228
Frederick 879 28,732 879 28,732
Holyoke 5,558 229,359 5,558 229,359
Platte River Power Authority 110,026 4,307,720 110,027 4,305,242
Wray 8,195 355,492 8,195 355,492
Colorado subtotal 457,388 18,556,049 447,294 17,799,344
Kansas
Clay Center 5,233 205,268 5,233 205,268
Kansas City Board of Public Utilities 14,834 620,078 14,834 620,078
Kansas Municipal Energy Agency 104,370 4,209,115 97,041 3,903,831
Kansas subtotal 124,437 5,034,461 117,108 4,729,177
Nebraska
Lodgepole 249 10,375 249 10,375
Mullen 615 20,286 615 20,286
Municipal Energy Agency of Nebraska 158,757 6,441,680 164,976 7,082,034
Sidney 5,064 270,015 5,064 270,015
Wauneta 3,047 126,310 3,047 126,310
Nebraska subtotal 167,732 6,868,666 173,951 7,509,020
Municipalities subtotal 749,557 30,459,176 738,381 30,038,531
COOPERATIVES
Arizona
Aggregated Energy Services 82 2,459 0 0
Resource Management Services 579 18,957 938 27,857
Sulphur Springs Valley Cooperative 0 0 407 12,949
Arizona subtotal 661 21,416 1,345 40,806
Power Sales and Revenues, continuedCustomer
FY 20141 FY 20132
Energy (MWh) Revenue ($) Energy (MWh) Revenue ($)
Colorado
Aggregated Energy Services 0 0 75 1,836
Intermountain Rural Electric Association 81,062 2,946,128 81,058 2,945,982
Tri-State Generation and Transmission Association 954,214 41,425,655 938,529 41,060,554
Colorado subtotal 1,035,276 44,371,783 1,019,662 44,008,372
Kansas
Kansas Electric Power Cooperative 87,009 2,656,440 87,737 2,687,221
Midwest Energy 8,915 372,875 8,915 372,875
Sunflower Electric Power Corporation 8,680 363,257 15,220 636,877
Kansas subtotal 104,604 3,392,572 111,872 3,696,973
North Dakota
Basin Electric Power Cooperative 90,166 3,505,174 104,158 3,873,226
North Dakota subtotal 90,166 3,505,174 104,158 3,873,226
Wyoming
Willwood Light and Power Company 449 15,855 449 15,855
Wyoming subtotal 449 15,855 449 15,855
Cooperatives subtotal 1,231,156 51,306,800 1,237,486 51,635,232
PUBLIC UTILITY DISTRICTS
Nebraska
Nebraska Public Power District 13,667 479,733 13,667 479,733
Nebraska subtotal 13,667 479,733 13,667 479,733
Public utility districts subtotal 13,667 479,733 13,667 479,733
FEDERAL AGENCIES
Colorado
Arapahoe and Roosevelt National Forests 2 32 2 34
Cheyenne Mountain Air Force Base 5,504 168,979 5,497 168,841
Fort Carson 5,764 241,450 5,756 241,280
Peterson Air Force Base 11,008 337,958 11,002 337,836
Schriever Air Force Base 11,010 338,001 11,001 337,815
U.S. Air Force Academy 10,969 339,054 10,963 338,914
Colorado subtotal 44,257 1,425,474 44,221 1,424,720
Wyoming
F.E. Warren Air Force Base 16,261 543,294 16,261 543,294
Wyoming subtotal 16,261 543,294 16,261 543,294
Federal agencies subtotal 60,518 1,968,768 60,482 1,968,014

70
LOVELAND AREA PROJECTS
Power Sales and Revenues, continuedCustomer
FY 20141 FY 20132
Energy (MWh) Revenue ($) Energy (MWh) Revenue ($)
STATE AGENCIES
Arizona
Salt River Project 88,287 2,374,643 43,773 1,012,981
Arizona subtotal 88,287 2,374,643 43,773 1,012,981
State agencies subtotal 88,287 2,374,643 43,773 1,012,981
IRRIGATION DISTRICTS
Wyoming
Goshen Irrigation District 1 63 1 44
Midvale Irrigation District 157 6,442 153 6,630
Wyoming subtotal 158 6,505 154 6,674
Irrigation districts subtotal 158 6,505 154 6,674
NATIVE AMERICAN TRIBES
Arizona
Colorado River Agency-BIA 0 0 5 90
Arizona subtotal 0 0 5 90
Kansas
Iowa Tribe of Kansas and Nebraska 3,690 154,569 3,690 154,569
Kickapoo Tribe in Kansas 5,058 211,870 5,058 211,870
Prairie Band Potawatomi Nation 9,944 416,332 9,944 416,332
Sac and Fox 4,955 207,589 4,955 207,589
Kansas subtotal 23,647 990,360 23,647 990,360
Wyoming
Wind River Reservation 4,189 175,639 4,189 175,639
Wyoming subtotal 4,189 175,639 4,189 175,639
Native American tribes subtotal 27,836 1,165,999 27,841 1,166,089
INVESTOR-OWNED UTILITIES
Arizona
Arizona Public Service Company 85 2,075 0 0
Tucson Electric Power Company 2,977 79,407 1,181 33,526
Arizona subtotal 3,062 81,482 1,181 33,526
Colorado
Public Service Company of Colorado 12,439 281,195 10,740 180,004
Colorado subtotal 12,439 281,195 10,740 180,004
Nevada
Nevada Power Company 459 10,557 358 7,024
Nevada subtotal 459 10,557 358 7,024
New Mexico
Public Service Company of New Mexico 3,275 99,727 1,766 46,100
New Mexico subtotal 3,275 99,727 1,766 46,100
Power Sales and Revenues, continuedCustomer
FY 20141 FY 20132
Energy (MWh) Revenue ($) Energy (MWh) Revenue ($)
Oregon
PacifiCorp 563 16,250 2,305 41,943
Oregon subtotal 563 16,250 2,305 41,943
Pennsylvania
PPL Energy Plus 400 11,808 608 15,060
Pennsylvania subtotal 400 11,808 608 15,060
South Dakota
Black Hills Power and Light 69,982 1,452,853 32,517 520,329
South Dakota subtotal 69,982 1,452,853 32,517 520,329
Texas
Tenaska Power Services Company 1,154 29,016 0 0
Texas subtotal 1,154 29,016 0 0
Investor-owned utilities subtotal 91,334 1,982,888 49,475 843,986
POWER MARKETERS
Minnesota
Cargill-Alliant 896 24,770 0 0
Minnesota subtotal 896 24,770 0 0
New York
Morgan Stanley 36,109 791,409 69,582 1,130,702
New York subtotal 36,109 791,409 69,582 1,130,702
Nevada
Silver State Energy Association 2,272 69,507 2,382 63,761
Nevada subtotal 2,272 69,507 2,382 63,761
North Dakota
Rainbow Energy Marketing Corporation 14,710 229,435 480 12,370
North Dakota subtotal 14,710 229,435 480 12,370
INTERNATIONAL
Canada
Powerex 933 23,448 2,948 22,799
Canada subtotal 933 23,448 2,948 22,799
Power marketers subtotal 54,920 1,138,569 75,392 1,229,632
INTERPROJECT
Arizona
Western (Desert Southwest region) 6,245 196,382 1,880 71,265
Arizona subtotal 6,245 196,382 1,880 71,265
Montana
Western (Upper Great Plains region) 0 0 10 198
Montana subtotal 0 0 10 198

71
LOVELAND AREA PROJECTS FRYINGPAN-ARKANSAS PROJECT
Status of Repayment (dollars in thousands)Cumulative 20131 ($) Adjustment ($) Annual 20142 ($) Cumulative 2014 ($)
REVENUE:
Gross operating revenue 399,833 0 19,973 419,806
Income transfers (net) 0 0 0 0
Total operating revenue 399,833 0 19,973 419,806
ExPENSES:
O&M and other 117,263 0 5,698 122,961
Purchase power and other 100,353 0 5,107 105,460
Interest
Federally financed 141,749 0 3,638 145,387
Non-federally financed 0 0 0 0
Total interest 141,749 0 3,638 145,387
Total expense 359,365 0 14,443 373,808
(Deficit)/surplus revenue 0 0 0 0
INVESTMENT:
Federally financed power 162,961 0 0 162,961
Non-federally financed power 0 0 0 0
Nonpower 0 0 0 0
Total investment 162,961 0 0 162,961
INVESTMENT REPAID:
Federally financed power 40,468 0 5,530 45,998
Non-federally financed power 0 0 0 0
Nonpower 0 0 0 0
Total investment repaid 40,468 0 5,530 45,998
INVESTMENT UNPAID:
Federally financed power 122,493 0 (5,530) 116,963
Non-federally financed power 0 0 0 0
Nonpower 0 0 0 0
Total investment unpaid 122,493 0 (5,530) 116,963
FUND BALANCES:
Colorado River Development 0 0 0 0
Working capital 0 0 0 0
PERCENT OF INVESTMENT REPAID TO DATE:
Federal 24.83% 28.23%
Non-federal N/A N/A
Nonpower N/A N/A1 This column ties to the cumulative FY 2013 numbers on Page 71 of the FY 2013 Statistical Appendix.2 Based on FY 2014 final audited financial statements.
Power Sales and Revenues, continuedCustomer
FY 20141 FY 20132
Energy (MWh) Revenue ($) Energy (MWh) Revenue ($)
Utah
Western (Salt Lake City area office) 343,252 8,355,081 277,868 5,942,761
Utah subtotal 343,252 8,355,081 277,868 5,942,761
Interproject subtotal 349,497 8,551,463 279,758 6,014,224
PROJECT USE
Colorado
Colorado (six customers) 192 1,347 256 1,801
Colorado subtotal 192 1,347 256 1,801
Kansas
Kansas (zero customers) 0 0 91 226
Kansas subtotal 0 0 91 226
Wyoming
Wyoming (three customers) 9,256 23,139 10,516 26,289
Wyoming subtotal 9,256 23,139 10,516 26,289
Project-use subtotal 9,448 24,486 10,863 28,316
Loveland Area Projects total 2,676,378 99,459,030 2,537,272 94,423,412 1 Power revenues as presented in this table are $0.7 million less than the FY 2014 sales of electric power presented in the statements of revenues and expenses
and accumulated net revenues due to variances between revenue accrual estimates and actual revenue along with other minor miscellaneous corrections and transactions.
2 Power revenues as presented in this table are $10.6 million less than the FY 2013 sales of electric power presented in the statements of revenues and expenses and accumulated net revenues due to the following: $10.5 million in certain object classes excluded from the power billings sales reports but included in the sales of electric power line; $0.1 million in variances between revenue accrual estimates and actual revenue along with other miscellaneous minor transactions.

72
LOVELAND AREA PROJECTS FRYINGPAN ARKANSAS PROJECT
Balance SheetsAs of Sept. 30, 2014 and 2013 (in thousands)
FY 2014 FY 2013
Western Reclamation Total Western Reclamation Total
Assets
Completed utility plant $7,356 $172,887 $180,243 $7,356 $151,551 $158,907
Accumulated depreciation (6,122) (66,992) (73,114) (6,013) (64,859) (70,872)
Net completed plant 1,234 105,895 107,129 1,343 86,692 88,035
Construction work-in-progress 0 2,925 2,925 0 828 828
Net utility plant 1,234 108,820 110,054 1,343 87,520 88,863
Cash 10,237 1,942 12,179 1,650 3,237 4,887
Accounts receivable, net 2,924 6 2,930 3,016 0 3,016
Regulatory assets 49 932 981 40 880 920
Other assets 0 0 0 0 0 0
Total assets 14,444 111,700 126,144 6,049 91,637 97,686
Liabilities:
Customer advances and other liabilities 93 1,083 1,176 67 1,216 1,283
Accounts payable 3,513 56 3,569 369 198 567
Environmental cleanup liabilities 0 0 0 0 19 19
Total liabilities 3,606 1,139 4,745 436 1,433 1,869
Capitalization:
Payable to U.S. Treasury (3,495) 146,149 142,654 (7,419) 127,777 120,358
Accumulated net revenues (deficit) 14,333 (35,588) (21,255) 13,032 (37,573) (24,541)
Total capitalization 10,838 110,561 121,399 5,613 90,204 95,817
Total liabilities and capitalization $14,444 $111,700 $126,144 $6,049 $91,637 $97,686
Statements of Revenues and Expenses and Accumulated Net Revenues1
For the years ended Sept. 30, 2014 and 2013 (in thousands)
FY 2014 FY 2013
Western Reclamation Total Western Reclamation Total
Operating revenues:
Sales of electric power $15,728 $0 $15,728 $16,003 $0 $16,003
Transmission and other operating revenues 4,245 0 4,245 4,581 0 4,581
Gross operating revenues 19,973 0 19,973 20,584 0 20,584
Income transfers, net (12,487) 12,487 0 (13,515) 13,515 0
Total operating revenues 7,486 12,487 19,973 7,069 13,515 20,584
Operating expenses:
Operation and maintenance 627 4,905 5,532 521 4,811 5,332
Purchased power 631 0 631 707 0 707
Purchased transmission services 4,476 0 4,476 4,371 0 4,371
Depreciation 109 2,136 2,245 109 1,493 1,602
Administration and general 166 0 166 133 0 133
Total operating expenses 6,009 7,041 13,050 5,841 6,304 12,145
Net operating revenues 1,477 5,446 6,923 1,228 7,211 8,439
Interest expenses:
Interest on payable to U.S. Treasury 176 3,620 3,796 185 3,659 3,844
Allowance for funds used during construction 0 (159) (159) 0 (13) (13)
Net interest on payable to U.S. Treasury 176 3,461 3,637 185 3,646 3,831
Net interest expenses 176 3,461 3,637 185 3,646 3,831
Net revenues (deficit) 1,301 1,985 3,286 1,043 3,565 4,608
Accumulated net revenues (deficit):
Balance, beginning of year 13,032 (37,573) (24,541) 11,989 (41,138) (29,149)
Balance, end of year $14,333 $(35,588) $(21,255) $13,032 $(37,573) $(24,541)1 Loveland Area Projects consist of the Fryingpan-Arkansas and the Pick-Sloan Missouri River Basin Program—Western Division projects. The statements of
revenues and expenses and accumulated net revenues (financial statements) for Loveland Area Projects only include the Fryingpan-Arkansas project, and the Western Division is combined with the Pick-Sloan Missouri River Basin Program–Eastern Division. To reconcile the sales and purchased power/transmission cost tables and financial statements for these projects, the Fryingpan-Arkansas project and the Eastern and Western divisions need to be added together.

73
PARKER-DAVIS PROJECT
The Parker-Davis Project was formed by consolidating two projects, Parker Dam and Davis Dam, under terms of the Act of May 28, 1954 .
Davis Dam, on the Colorado River 67 miles (107 .8 km) below Hoover Dam, created Lake Mohave . The project was authorized under the Reclama-tion Project Act of 1939 . Construction began in 1941, but due to delays
caused by World War II, it was not completed until 1953 . Davis Dam has a storage capacity of 1 .8 million acre-feet . The Bureau of Reclamation increased the five generation units’ operat-ing capacity from 232,000 kilowatts to 255,000 kW by rewinding Generator Unit No . 1 .
Parker Dam, which created Lake Havasu 155 miles (250 km) below Hoover Dam on the Colorado River, was authorized by the Rivers and Harbors Act of Aug . 30, 1935 . The Bureau of Reclamation constructed the project partly with funds advanced by the Metropolitan Water District of Southern California, which now diverts nearly 1 .2 million acre-feet each year by pumping it from Lake Havasu . The Cooperative Contract for Construction and Operation of Parker Dam was agreed to in 1933 . MWD receives half of the capacity and energy from four generating units . The 50-percent federal share of Parker Powerplant capacity, as determined by the Bureau of Reclamation, is 60,000 kW .
The Parker-Davis Project is currently marketed to 37 customers in southern Nevada, Arizona and southern California, and it supplies the electrical needs of more than 300,000 people . The project includes 1,541 circuit-miles of high-voltage transmission lines in Arizona, southern Nevada and along the Colorado River in southern California .
Parker-Davis Project’s power marketing criteria is part of the 1984 Conformed General Consolidated Power Marketing Criteria of the Boulder City Area Office (now Western’s Desert Southwest region) .
Existing Parker-Davis Project firm power contracts were due to expire on Sept . 30, 2008 . ln December 2006, Western announced the final Post-2008 Resource Pool Allocation Procedures for existing and new preference customers . As a result, all firm power contracts entered into under the Post-2008 Procedures (25 existing, 12 new) became effective Oct . 1, 2008, and expire Sept . 30, 2028 .
Currently, the mar-keted Parker-Davis Proj-ect resource, excluding project-use power, provides for 221,705 kW of capac-ity in the winter season and 283,676 kW capacity in the summer season . Customers receive 1,703 kWh (winter season) and 3,441 kWh (summer season) of energy with each kW of capacity . Excluding project use, total marketable energy is 393 million kWh (winter season) and 1032 million kWh (summer season) .
A portion of the resource marketed is reserved for U .S . priority use, but is not presently needed . This portion—9,460 kW of capacity and associ-ated energy in the winter season and 16,030 kW of capacity and associated energy in the summer season—is withdrawable from existing customers upon two years’ written notice .
Water demands in the Lower Colorado River Basin and releases from Hoover Dam determine the operation of the Parker-Davis Project . Parker Dam released 6 .5 million acre-feet and Davis Dam released 9 .4 million acre-feet during Fiscal Year 2014 . Storage in Lake Mohave was 1 .6 million acre-feet and storage in Lake Havasu was 0 .6 million acre-feet at the end of the fiscal year .
The net generation for the Parker-Davis Project increased from 1,309 gigawatt-hours in FY 2013 to 1,398 GWh in FY 2014 . During FY 2014, there were about 38 .3 GWh of power purchases required to meet statutory obligations .
FY 2014 energy sales were made according to the marketable energy outlined in Parker-Davis firm electric service contracts .

74
PARKER-DAVIS PROJECT
Facilities, SubstationsFacility FY 2014 FY 2013
Substations
Number of substations 53 53
Number of transformers 30 31
Transformer capacity (kVA) 2,593,000 2,278,000
Land (fee)
Acres 362.88 348.28
Hectares 146.92 141.00
Land (easement)
Acres 87.44 87.44
Hectares 35.40 35.40
Facilities, Substations, continuedFacility FY 2014 FY 2013
Land (withdrawal)
Acres 115.00 115.00
Hectares 46.56 46.56
Buildings and communications sites
Number of buildings 58 58
Number of communications sites 63 62
Land (easement)
Acres 6.89 6.89
Hectares 2.79 2.79
Transmission LinesVoltage rating
Arizona California Nevada Total
FY 2014 FY 2013 FY 2014 FY 2013 FY 2014 FY 2013 FY 2014 FY 2013
230-kV
Circuit miles 652.39 652.09 3.06 3.06 98.19 100.83 753.64 755.98
Circuit kilometers 1,049.70 1,049.21 4.92 4.92 157.99 162.24 1,212.61 1,216.37
Acres 7,449.45 7,444.74 31.92 31.92 2,051.54 2,049.89 9,532.91 9,526.55
Hectares 3,015.98 3,014.07 12.92 12.92 830.58 829.92 3,859.48 3,856.91
161-kV
Circuit miles 154.90 154.90 203.46 203.46 0.00 0.00 358.36 358.36
Circuit kilometers 249.23 249.23 327.37 327.37 0.00 0.00 576.60 576.60
Acres 4,225.30 4,225.30 2,754.24 2,751.07 0.00 0.00 6,979.54 6,976.37
Hectares 1,710.65 1,710.65 1,115.08 1,113.80 0.00 0.00 2,825.73 2,824.45
115-kV
Circuit miles 306.92 306.62 0.00 0.00 0.00 0.00 306.92 306.62
Circuit kilometers 493.83 493.35 0.00 0.00 0.00 0.00 493.83 493.35
Acres 3,827.45 3,827.45 0.00 0.00 0.00 0.00 3,827.45 3,827.45
Hectares 1,549.58 1,549.58 0.00 0.00 0.00 0.00 1,549.58 1,549.58
69-kV and below
Circuit miles 111.14 111.14 1.40 1.40 3.40 3.40 115.94 115.94
Circuit kilometers 178.82 178.82 2.25 2.25 5.47 5.47 186.54 186.54
Acres 991.21 991.21 54.17 54.17 26.64 26.64 1,072.02 1,072.02
Hectares 401.30 401.30 21.93 21.93 10.79 10.79 434.02 434.02
Total
Circuit miles 1,225.35 1,224.75 207.92 207.92 101.59 104.23 1,534.86 1,536.90
Circuit kilometers 1,971.58 1,970.61 334.54 334.54 163.46 167.71 2,469.58 2,472.86
Acres 16,493.41 16,488.70 2,840.33 2,837.16 2,078.18 2,076.53 21,411.92 21,402.39
Hectares 6,677.51 6,675.60 1,149.93 1,148.65 841.37 840.71 8,668.81 8,664.96
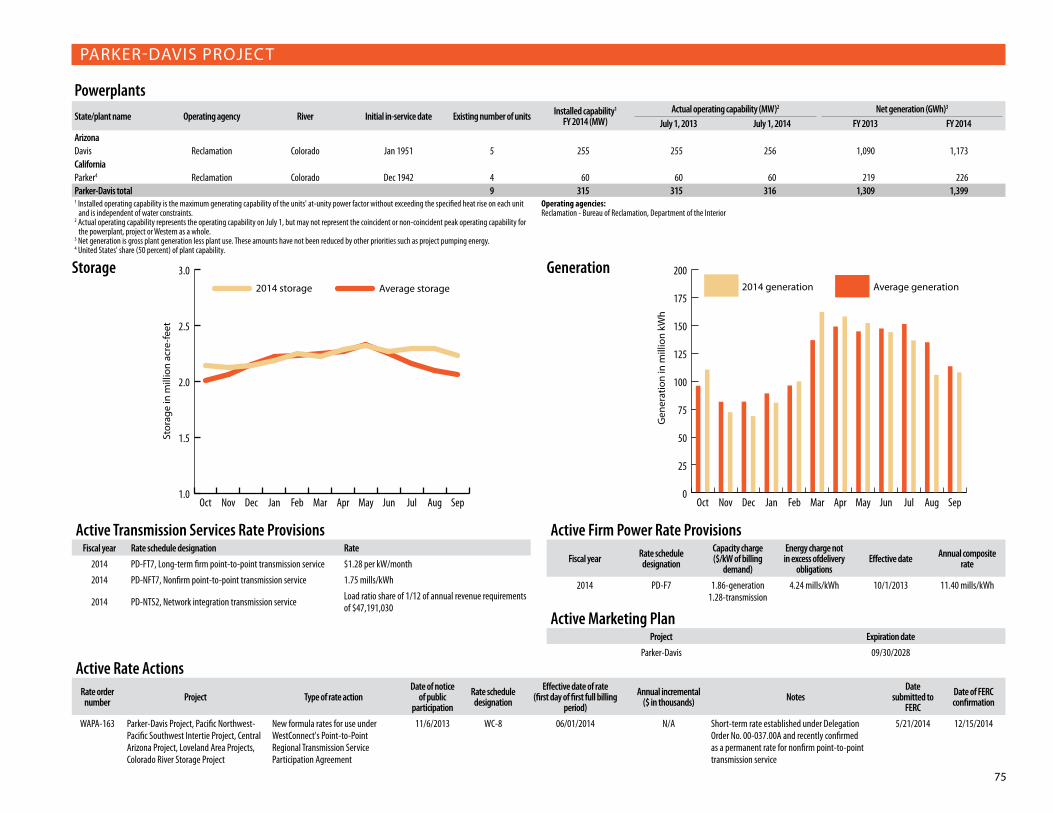
75
PARKER-DAVIS PROJECT
Storage Generation
1.0
1.5
2.0
2.5
3.02014 storage Average storage
SepAugJulJunMayAprMarFebJanDecNovOct
Stor
age
in m
illio
n ac
re-fe
et
0
25
50
75
100
125
150
175
2002014 generation Average generation
SepAugJulJunMayAprMarFebJanDecNovOct
Gen
erat
ion
in m
illio
n kW
h
PowerplantsState/plant name Operating agency River Initial in-service date Existing number of units Installed capability1
FY 2014 (MW)Actual operating capability (MW)2 Net generation (GWh)3
July 1, 2013 July 1, 2014 FY 2013 FY 2014ArizonaDavis Reclamation Colorado Jan 1951 5 255 255 256 1,090 1,173CaliforniaParker4 Reclamation Colorado Dec 1942 4 60 60 60 219 226Parker-Davis total 9 315 315 316 1,309 1,3991 Installed operating capability is the maximum generating capability of the units' at-unity power factor without exceeding the specified heat rise on each unit
and is independent of water constraints.2 Actual operating capability represents the operating capability on July 1, but may not represent the coincident or non-coincident peak operating capability for
the powerplant, project or Western as a whole.3 Net generation is gross plant generation less plant use. These amounts have not been reduced by other priorities such as project pumping energy.4 United States' share (50 percent) of plant capability.
Operating agencies:Reclamation - Bureau of Reclamation, Department of the Interior
Active Firm Power Rate Provisions
Fiscal year Rate schedule designation
Capacity charge($/kW of billing
demand)
Energy charge not in excess ofdelivery
obligationsEffective date Annual composite
rate
2014 PD-F7 1.86-generation1.28-transmission
4.24 mills/kWh 10/1/2013 11.40 mills/kWh
Active Transmission Services Rate ProvisionsFiscal year Rate schedule designation Rate
2014 PD-FT7, Long-term firm point-to-point transmission service $1.28 per kW/month
2014 PD-NFT7, Nonfirm point-to-point transmission service 1.75 mills/kWh
2014 PD-NTS2, Network integration transmission service Load ratio share of 1/12 of annual revenue requirements of $47,191,030
Active Rate ActionsRate order
number Project Type of rate actionDate of notice
of public participation
Rate schedule designation
Effective date of rate(first day of first full billing
period)
Annual incremental($ in thousands) Notes
Date submitted to
FERC
Date of FERC confirmation
WAPA-163 Parker-Davis Project, Pacific Northwest-Pacific Southwest Intertie Project, Central Arizona Project, Loveland Area Projects, Colorado River Storage Project
New formula rates for use under WestConnect's Point-to-Point Regional Transmission Service Participation Agreement
11/6/2013 WC-8 06/01/2014 N/A Short-term rate established under Delegation Order No. 00-037.00A and recently confirmed as a permanent rate for nonfirm point-to-point transmission service
5/21/2014 12/15/2014
Active Marketing PlanProject Expiration date
Parker-Davis 09/30/2028

76
PARKER-DAVIS PROJECT
Transmission RevenuesTransmission service
FY 20141 FY 20132
Revenue ($) Revenue ($)
Wheeling and transmission service 0 0
Firm network transmission service 6,249,742 6,597,874
Firm point-to-point transmission service 36,097,147 32,806,685
Nonfirm point-to-point transmission service 539,490 833,893
Short term point-to-point transmission service 439,367 1,768,760
Transmission services total 43,325,746 42,007,212 1 Transmission service revenues as presented in this table are $5.3 million less than the FY 2014 transmission and other operating revenues amount
presented in the statements of revenues and expenses and accumulated net revenues due to the following: $2.0 million in reliability sales excluded from the transmission revenue table; $3.5 million in transmission losses excluded from the transmission revenue table; and ($0.2) million in variances between transmission revenue accrual estimates and actual transmission revenue amounts along with other miscellaneous minor transactions.
2 Transmission service revenues as presented in this table are $3.3 million less than the FY 2013 transmission and other operating revenues amount presented in the statements of revenues and expenses and accumulated net revenues due to the following: $1.2 million in reliability sales excluded from the transmission revenue table; $1.8 million in transmission losses excluded from the transmission revenue table; and $0.3 million in variances between transmission revenue accrual estimates and actual transmission revenue amounts along with other miscellaneous minor transactions.
Ancillary Services RevenuesAncillary service
FY 20141 FY 20131
Revenue ($) Revenue ($)
Reactive supply and voltage control service 203,826 216,539
Ancillary spinning reserves 712 0
Regulation and frequency response 170,168 269,834
Ancillary services total3 374,706 486,373 1 Excludes $3.2 million and $2.8 million in other revenues for FY 2014 and FY 2013, respectively.
Top 5 Customers in Long-term Revenue1
Rank Customer Revenue ($) Percent of total sales1 Colorado River Commission of Nevada 2,234,865 21.42 Imperial Irrigation District 1,324,312 12.73 Salt River Project 1,238,611 11.94 Arizona Electric Power Cooperative 954,679 9.25 Edwards Air Force Base 742,010 7.1
Total 6,494,477 62.31 Excludes energy sales and power revenues from interdepartmental, interproject and project-use customers.
Top 5 Customers in Long-term Energy Sales1
Rank Customer Energy (MWh) Percent of total sales1 Colorado River Commission of Nevada 264,024 21.52 Imperial Irrigation District 155,745 12.73 Salt River Project 146,409 11.94 Arizona Electric Power Cooperative 112,473 9.25 Edwards Air Force Base 87,247 7.1
Total 765,898 62.41 Excludes energy sales and power revenues from interdepartmental, interproject and project-use customers.
Customers by State and Customer CategoryState/customer category
FY 2014 FY 2013
Long-term Total Long-term Total
Arizona
Municipalities 8 8 8 8
Cooperatives 2 2 2 2
Federal agencies 3 3 3 3
State agencies 1 1 1 1
Irrigation districts 4 4 4 4
Native American tribes 3 3 3 3
Arizona subtotal 21 21 21 21
California
Municipalities 2 2 2 2
Federal agencies 3 3 3 3
Irrigation districts 1 1 1 1
Native American tribes 5 5 5 5
California subtotal 11 11 11 11
Nevada
Federal agencies 2 2 2 2
State agencies 1 1 1 1
Nevada subtotal 3 3 3 3
Parker-Davis subtotal 35 35 35 35
Project use 2 2 2 2
Parker-Davis total 37 37 37 37
Summary by Customer CategoryCustomer category
FY 2014 FY 2013
Long-term Total Long-term Total
Municipalities 10 10 10 10
Cooperatives 2 2 2 2
Federal agencies 8 8 8 8
State agencies 2 2 2 2
Irrigation districts 5 5 5 5
Native American tribes 8 8 8 8
Parker-Davis subtotal 35 35 35 35
Project use 2 2 2 2
Parker-Davis total 37 37 37 37

77
PARKER-DAVIS PROJECT
Power Sales by State and Customer CategoryState/customer category
FY 2014 FY 2013
Long-term (MWh) Total energy (MWh) Long-term ($) Total revenue ($) Energy (MWh) Revenue ($)
Arizona
Municipalities 93,598 93,598 796,146 796,146 93,598 796,146
Cooperatives 117,617 117,617 998,809 998,809 117,617 998,810
Federal agencies 48,610 48,610 414,169 414,169 48,610 414,169
State agencies 146,409 146,409 1,238,611 1,238,611 146,409 1,238,611
Irrigation districts 47,072 47,072 414,955 414,955 47,309 414,594
Native American tribes 135,262 135,262 1,146,111 1,146,111 135,262 1,146,111
Project use 195,267 195,267 1,660,541 1,660,541 195,266 1,660,541
Arizona subtotal 783,835 783,835 6,669,342 6,669,342 784,071 6,668,982
California
Municipalities 32,973 32,973 278,643 278,643 32,973 278,643
Federal agencies 120,114 120,114 1,023,112 1,023,112 120,114 1,022,238
Irrigation districts 155,745 155,745 1,324,312 1,324,312 155,745 1,324,312
Native American tribes 39,811 39,811 334,265 334,265 39,811 334,265
California subtotal 348,643 348,643 2,960,332 2,960,332 348,643 2,959,458
Nevada
Federal agencies 25,670 25,670 219,619 219,619 25,670 219,619
State agencies 264,024 264,024 2,234,865 2,234,865 264,024 2,234,865
Nevada subtotal 289,694 289,694 2,454,484 2,454,484 289,694 2,454,484
Parker-Davis total1 1,422,172 1,422,172 12,084,158 12,084,158 1,422,408 12,082,924 1 Power revenues as presented in this table are $0.1 million greater than the FY 2014 and FY 2013 sales of electric power amount presented in the statements of revenues and expenses and accumulated net revenues
due to variances between revenue accrual estimates and actual revenue amounts.
Power Sales by Customer CategoryCustomer category
FY 2014 FY 2013
Long-term (MWh) Total energy (MWh) Long-term ($) Total revenue ($) Sales (MWh) Revenue ($)
Municipalities 126,571 126,571 1,074,789 1,074,789 126,571 1,074,789
Cooperatives 117,617 117,617 998,809 998,809 117,617 998,810
Federal agencies 194,394 194,394 1,656,900 1,656,900 194,394 1,656,026
State agencies 410,433 410,433 3,473,476 3,473,476 410,433 3,473,476
Irrigation districts 202,817 202,817 1,739,267 1,739,267 203,054 1,738,906
Native American tribes 175,073 175,073 1,480,376 1,480,376 175,073 1,480,376
Project use 195,267 195,267 1,660,541 1,660,541 195,266 1,660,541
Parker-Davis total1 1,422,172 1,422,172 12,084,158 12,084,158 1,422,408 12,082,924 1 Power revenues as presented in this table are $0.1 million greater than the FY 2014 and FY 2013 sales of electric power amount presented in the statements of revenues and expenses and accumulated net revenues
due to variances between revenue accrual estimates and actual revenue amounts.

78
PARKER-DAVIS PROJECT
Purchased Power
SupplierFY 20141 FY 20132
Energy (MWh) Cost ($ in thousands) Energy (MWh) Cost ($ in
thousands)NonWestern suppliersAggregated Energy Services 0 0 350 13 Arizona Electric Power Cooperative 3,263 141 2,106 99 Arizona Public Service-Merchant 466 22 85 5 California Independent System Operator 14 1 0 0 Calpine 0 0 1,500 74 Central Arizona Water Conservation District 3,708 176 0 0 Citi Group 0 0 2,221 160 City of Burbank California 1,121 50 6,041 279 City of Glendale California 205 8 15 1 Colorado River Agency 0 0 2,547 82 EDF Trading North America 2,218 115 2,900 154 Electrical District No. 2, Pinal County 1,136 42 0 0 El Paso Electric 5 0 50 6 J.P. Morgan Ventures Energy Corporation 51 1 16 1 Los Angeles Department of Water and Power 250 13 1,250 62 Macquarie Energy 9 0 0 0 Morgan Stanley Capital Group 4,234 200 200 11 NV Energy 9,288 464 13,770 756 PacifiCorp 28 1 1,340 42 Panda Gila River 1,149 59 1,225 71 Powerex 1,122 56 6,302 256 Public Service of New Mexico 391 15 1,792 73 Resource Management Services 0 0 823 29 Salt River Project - Merchant 4,536 218 8,970 549 Shell Energy 0 0 720 28 Sierra Pacific Power Company 9 0 0 0 Silver State Energy Association 1,430 50 1,602 64 Sulpher Springs Valley Electric Cooperative 0 0 53 2 Tucson Electric Power 161 7 1,532 75 US Dept of Interior, Bureau of Indian Affairs, Colorado River Agency 906 31 0 0 Wellton-Mohawk Irrigation and Drainage District 166 5 0 0 NonWestern suppliers subtotal 35,866 1,676 57,410 2,892 Western suppliers Western Area Colorado Missouri Balancing Authority 1,892 61 1,892 61Colorado River Storage Project 579 13 0 0Western suppliers subtotal 2,471 74 1,880 71 Purchased power total 38,337 1,750 59,290 2,963 1 Purchased power as presented in this table is less than the FY 2014 statements of revenues and expenses and accumulated net revenues by $2.9 million due to the
following exclusions from the purchased power table: $1.8 million in spinning reserves; $0.6 million in other regulatory related purchase expenses; and $0.5 million in variances between purchased power accrual estimates and actual purchased power amounts along with other miscellaneous minor transactions.
2 Purchased power as presented in this table is less than the FY 2013 statements of revenues and expenses and accumulated net revenues by $2.8 million due to the following exclusions from the purchased power table: $1.5 million in spinning reserves; $1.0 million in interchange energy; $0.3 million in other regulatory related purchase expenses; and variances between purchased power accrual estimates and actual purchased power amounts along with other miscellaneous minor transactions.
Power Sales and RevenuesCustomer
FY 2014 FY 2013
Energy (MWh) Revenue ($) Energy (MWh) Revenue ($)
MUNICIPALITIES
Arizona
Fredonia 9,154 77,258 9,154 77,258
Gilbert Utility District 5,144 44,131 5,144 44,131
Marana Water Department 5,144 44,131 5,144 44,131
Mesa 49,253 417,902 49,253 417,902
Thatcher 5,144 44,131 5,144 44,131
Wickenburg 9,471 80,331 9,471 80,331
Williams 5,144 44,131 5,144 44,131
Yuma Water Department 5,144 44,131 5,144 44,131
Arizona subtotal 93,598 796,146 93,598 796,146
California
Corona 8,585 71,740 8,585 71,740
Needles 24,388 206,903 24,388 206,903
California subtotal 32,973 278,643 32,973 278,643
Municipalities subtotal 126,571 1,074,789 126,571 1,074,789
COOPERATIVES
Arizona
Arizona Electric Power Cooperative 112,473 954,679 112,473 954,679
Eastern Arizona Power Pooling Association 5,144 44,130 5,144 44,131
Arizona subtotal 117,617 998,809 117,617 998,810
Cooperatives subtotal 117,617 998,809 117,617 998,810
FEDERAL AGENCIES
Arizona
Luke Air Force Base 13,407 115,037 13,407 115,037
Marine Corps Air Station-Yuma 10,409 88,613 10,409 88,613
Yuma Proving Grounds 24,794 210,519 24,794 210,519
Arizona subtotal 48,610 414,169 48,610 414,169
California
Department of the Navy Southwest Division 10,288 88,261 10,288 88,261
Edwards Air Force Base 87,247 742,010 87,247 741,136
March Air Force Base 22,579 192,841 22,579 192,841
California subtotal 120,114 1,023,112 120,114 1,022,238
Nevada
Nellis Air Force Base 14,315 122,326 14,315 122,326
Nevada Operations Office-DOE 11,355 97,293 11,355 97,293
Nevada subtotal 25,670 219,619 25,670 219,619
Federal agencies subtotal 194,394 1,656,900 194,394 1,656,026

79
PARKER-DAVIS PROJECT
Power Sales and Revenues, continuedCustomer
FY 2014 FY 2013
Energy (MWh) Revenue ($) Energy (MWh) Revenue ($)
STATE AGENCIES
Arizona
Salt River Project 146,409 1,238,611 146,409 1,238,611
Arizona subtotal 146,409 1,238,611 146,409 1,238,611
Nevada
Colorado River Commission of Nevada 264,024 2,234,865 264,024 2,234,865
Nevada subtotal 264,024 2,234,865 264,024 2,234,865
State agencies subtotal 410,433 3,473,476 410,433 3,473,476
IRRIGATION DISTRICTS
Arizona
Electrical District No. 3 24,927 212,014 24,927 212,014
Hohokam Irrigation District 5,144 44,131 5,144 44,131
Wellton-Mohawk Irrigation District 14,733 125,156 14,733 125,156
Yuma Irrigation District 2,268 33,654 2,505 33,293
Arizona subtotal 47,072 414,955 47,309 414,594
California
Imperial Irrigation District 155,745 1,324,312 155,745 1,324,312
California subtotal 155,745 1,324,312 155,745 1,324,312
Irrigation districts subtotal 202,817 1,739,267 203,054 1,738,906
NATIVE AMERICAN TRIBES
Arizona
Colorado River Agency-BIA 40,468 341,565 40,468 341,565
San Carlos Irrigation Project-BIA 80,947 686,763 80,947 686,763
Tohono O'Odham Utility Authority 13,847 117,783 13,847 117,783
Arizona subtotal 135,262 1,146,111 135,262 1,146,111
California
Agua Caliente Band of Cahuilla Indians 5,144 44,131 5,144 44,131
Fort Mojave Indian Tribe 15,794 130,132 15,794 130,132
Pechanga Band of Luiseno Indians 5,144 44,131 5,144 44,131
San Luis Rey River Indian Authority 8,585 71,740 8,585 71,740
Viejas Band of Kumeyaay Indians 5,144 44,131 5,144 44,131
California subtotal 39,811 334,265 39,811 334,265
Native American tribes subtotal 175,073 1,480,376 175,073 1,480,376
Power Sales and Revenues, continuedCustomer
FY 2014 FY 2013
Energy (MWh) Revenue ($) Energy (MWh) Revenue ($)
PROJECT USE
Arizona
Project use (two customers) 195,267 1,660,541 195,266 1,660,541
Arizona subtotal 195,267 1,660,541 195,266 1,660,541
Project-use subtotal 195,267 1,660,541 195,266 1,660,541
Parker-Davis total1 1,422,172 12,084,158 1,422,408 12,082,924 1 Power revenues as presented in this table are $0.1 million greater than the FY 2014 and FY 2013 sales of electric power amount presented in the statements
of revenues and expenses and accumulated net revenues due to variances between revenue accrual estimates and actual revenue amounts.

80
PARKER-DAVIS PROJECT
Status of Repayment (dollars in thousands)Cumulative 20131 ($) Adjustment ($) Annual 20142 ($) Cumulative 2014 ($)
REVENUE:
Gross operating revenue 1,493,712 0 64,281 1,557,993
Income transfers (net) 30,204 0 2,617 32,821
Total operating revenue 1,523,916 0 66,898 1,590,814
ExPENSES:
O&M and other 828,562 (6,504) 47,717 869,775
Purchase power and other 53,093 0 4,699 57,792
Interest
Federally financed 334,598 13 20,581 355,192
Non-federally financed 3,086 0 130 3,216
Total interest 337,684 13 20,711 358,408
Total expense 1,219,339 (6,491) 73,127 1,285,975
(Deficit)/surplus revenue 35,600 6,491 (12,215) 29,877
INVESTMENT:
Federally financed power 556,585 0 41,833 598,418
Non-federally financed power 27,579 0 2,669 30,248
Federally financed nonpower 35,750 2,344 38,094
Non-federally financed nonpower 2,711 0 244 2,955
Total investment 622,625 0 47,090 669,715
INVESTMENT REPAID:
Federally financed power 214,257 0 3,072 217,329
Non-federally financed power 23,762 0 2,669 26,431
Federally financed nonpower 28,247 0 0 28,247
Non-federally financed nonpower 2,711 0 244 2,955
Total investment repaid 268,977 0 5,985 274,962
INVESTMENT UNPAID:
Federally financed power 342,328 0 38,761 381,089
Non-federally financed power 3,817 0 0 3,817
Federally financed nonpower 7,503 0 2,344 9,847
Non-federally financed nonpower 0 0 0 0
Total investment unpaid 353,648 0 41,105 394,753
FUND BALANCES:
Colorado River Development 0 0 0 0
Working capital 0 0 0 0
PERCENT OF INVESTMENT REPAID TO DATE:
Federal 38.49% 36.32%
Non-federal 86.16% 87.38%
Federally financed nonpower 79.01% 74.15%
Non-federally financed nonpower 100.00% 100.00%1 This column ties to the cumulative FY 2013 numbers on Page 80 of the FY 2013 Statistical Appendix.2 Based on FY 2014 final audited financial statements.

81
PARKER-DAVIS PROJECT
Balance SheetsAs of Sept. 30, 2014 and 2013 (in thousands)
FY 2014 FY 2013
Western Reclamation Total Western Reclamation Total
Assets
Completed utility plant $504,355 $106,382 $610,737 $465,673 $103,469 $569,142
Accumulated depreciation (209,227) (85,423) (294,650) (197,728) (84,408) (282,136)
Net completed plant 295,128 20,959 316,087 267,945 19,061 287,006
Construction work-in-progress 15,793 5,077 20,870 47,832 5,094 52,926
Net utility plant 310,921 26,036 336,957 315,777 24,155 339,932
Cash 124,634 12,486 137,120 103,181 8,687 111,868
Accounts receivable, net 16,413 1 16,414 16,443 1 16,444
Regulatory assets 6,903 2,339 9,242 7,099 1,781 8,880
Other assets 10,612 142 10,754 10,432 142 10,574
Total assets 469,483 41,004 510,487 452,932 34,766 487,698
Liabilities:
Long-term liabilities 8,960 0 8,960 9,657 0 9,657
Customer advances and other liabilities 8,472 12,882 21,354 8,914 4,941 13,855
Accounts payable 14,720 177 14,897 12,641 344 12,985
Environmental cleanup liabilities 1,505 308 1,813 1,548 464 2,012
Total liabilities 33,657 13,367 47,024 32,760 5,749 38,509
Capitalization:
Payable to U.S. Treasury 517,637 (7,944) 509,693 484,803 (13,547) 471,256
Accumulated net revenues (deficit) (81,811) 35,581 (46,230) (64,631) 42,564 (22,067)
Total capitalization 435,826 27,637 463,463 420,172 29,017 449,189
Total liabilities and capitalization $469,483 $41,004 $510,487 $452,932 $34,766 $487,698
Statements of Revenues and Expenses and Accumulated Net RevenuesFor the years ended Sept. 30, 2014 and 2013 (in thousands)
FY 2014 FY 2013
Western Reclamation Total Western Reclamation Total
Operating revenues:
Sales of electric power $12,147 $0 $12,147 $12,020 $0 $12,020
Transmission and other operating revenues 52,134 0 52,134 48,624 0 48,624
Gross operating revenues 64,281 0 64,281 60,644 0 60,644
Income transfers, net (6,704) 9,321 2,617 (8,372) 9,704 1,332
Total operating revenues 57,577 9,321 66,898 52,272 9,704 61,976
Operating expenses:
Operation and maintenance 24,964 15,204 40,168 24,260 7,606 31,866
Purchased power 4,699 0 4,699 5,809 0 5,809
Purchased transmission services 0 0 0 0 0 0
Depreciation 11,639 1,016 12,655 13,460 (1,968) 11,492
Administration and general 7,547 0 7,547 6,863 0 6,863
Total operating expenses 48,849 16,220 65,069 50,392 5,638 56,030
Net operating revenues 8,728 (6,899) 1,829 1,880 4,066 5,946
Interest expenses:
Interest on payable to U.S. Treasury 21,047 84 21,131 2,314 86 2,400
Allowance for funds used during construction (549) 0 (549) (2,204) 0 (2,204)
Net interest on payable to U.S. Treasury 20,498 84 20,582 110 86 196
Interest on long-term liabilities 130 0 130 154 0 154
Net interest expenses 20,628 84 20,712 264 86 350
Net revenues (deficit) (11,900) (6,983) (18,883) 1,616 3,980 5,596
Accumulated net revenues (deficit):
Balance, beginning of year (64,631) 42,564 (22,067) (71,527) 38,584 (32,943)
Change in capitalization (5,280) 0 (5,280) 5,280 0 5,280
Balance, end of year ($81,811) $35,581 ($46,230) ($64,631) $42,564 ($22,067)

82
PICK-SLOAN MISSOURI RIVER BASIN PROGRAM
The Pick-Sloan Missouri River Basin Program, originally the Missouri River Basin Project, was authorized by Congress in the Flood Control Act of 1944 . The mul-tipurpose program provides authorization for construction of certain public works and improvements on rivers and harbors for flood control, generation of hydropower, resources for water supply and irrigation, aid to navigation,
preservation of water quality, enhancement of fish and wildlife and creation of recreation opportunities . Pick-Sloan power is marketed by two Western regions . Western’s Upper Great Plains region markets the Eastern Division and the Rocky Mountain region markets the West-ern Division through the Loveland Area Projects .
Seven mainstem dams and powerplants on the Missouri River produce hydroelectric power for the Eastern Division of the Pick-Sloan . They are: Canyon Ferry Dam in western Montana; Fort Peck Dam at Fort Peck, Montana; Garrison Dam at Riverdale, North Dakota; Oahe Dam at Pierre, South Dakota; Big Bend Dam at Fort Thompson, South Dakota; and the Fort Randall and Gavins Point dams in southern South Dakota . The Yellowtail Dam on the Bighorn River in south-central Montana produces power for both the Eastern and Western divisions of the Pick-Sloan . Including one-half of Yellowtail Dam, Eastern Division power-plants generate more than 10 billion kilowatt-hours in an average year .
Eastern DivisionUGP serves customers
across more than 378,000 square miles in the north-ern Rocky Mountain and Western Plains . Power is delivered through 123 substations and across 7,875 miles of federal trans-mission lines, which connect with other regional transmission systems . In Fiscal Year 1998, UGP implemented the Integrated System, or IS . The IS includes 9,848 miles of transmission lines owned by Basin Electric Power Cooperative, Heartland Consumers Power District and Western . Transmission service over the IS is provided under Western’s Open Access Transmission Tariff . UGP is the tariff administrator for the IS .

83
UGP’s 350-plus customers include rural electric cooperatives, municipalities, public utili-ties, public power districts, Native American tribes, irrigation districts, and federal and state agencies . Energy available after Western meets its firm preference power customer obliga-tions is sold in the competitive energy markets to a variety of power suppliers, including investor-owned utilities and power marketers, as well as preference customers .
UGP’s office is located in Billings, Montana . Other major facilities in the Eastern Division marketing area include the Power Systems Operations Office in Watertown, South Dakota, where the power system is managed and operated to ensure system reliability . Three maintenance offices oversee 12 line crews and eight substation crews in the maintenance of the Eastern Division’s extensive transmission system . They are located in Bismarck, North Dakota; Huron, South Dakota; and Fort Peck, Montana . Miles City, Montana, is home to the UGP’s back-to-back direct-current converter station . The station can receive alternating current from either the east or west electrical system interconnections, convert it into DC, and deliver AC into the opposing system . UGP’s Operations Office performs the scheduling across the Miles City DC interconnection and the Fort Peck office manages maintenance of the Miles City Converter Station .
Runoff into the Missouri River basin was above-normal during 2014 . The light Plains snowpack and above-normal mountain snowmelt was coupled with above-normal summer precipitation in Montana and the Dakotas . UGP experienced near-normal generation of 9 .5 bil-lion kWh in FY 2014 . The region purchased 3 .1 billion kWh at a cost of $138 million to support its firm power obligations . These purchases were mostly due to normal timing differences .
The current Pick-Sloan Eastern Division firm power rate, which became effective Jan . 1, 2010, includes a base rate and a drought-adder component .
The charge components were reviewed during spring 2014, and it was deemed neces-sary to true up the base and drought-adder charge components . UGP initiated a minor rate adjustment process in summer 2014 to true up the charge components, with no change to the overall revenue requirement and charges . This change went into effect on Jan . 1, 2015 .
On Jan . 1, 2010, UGP implemented new transmission formula rates that are “forward looking .” The forward-looking formula rates use estimates of expenses and load that are trued up to actual expenses and load during a future rate recalculation . Also effective Jan . 1, 2010, the formula rates for calculating some ancillary service rates changed and a rate for generator imbalance service and a penalty rate for unreserved use of transmission service were added . Amounts to be charged to customers are recalculated each year using the formula rates and are implemented annually on January 1 .
UGP completed the 2021 Power Marketing Initiative and moved into the contracting phase of the 2021 PMI . UGP’s firm electric service contracts associated with the current marketing plan will expire on Dec . 31, 2020 . The 2021 PMI provides the basis for marketing the long-term firm hydroelectric resources of the Pick-Sloan Missouri River Basin Program—Eastern Division beyond the year 2020 .

84
PICK-SLOAN MISSOURI RIVER BASIN PROGRAM EASTERN DIVISION
Facilities, SubstationsFacility FY 2014 FY 2013
Substations
Number of substations 123 120
Number of transformers 126 127
Transformer capacity (kVA) 10,166,450 10,169,780
Land (fee)
Acres 1,931.60 1,931.60
Hectares 782.03 782.03
Land (easement)
Acres 8.67 8.67
Hectares 3.51 3.51
Land (withdrawal)
Acres 22.93 22.93
Hectares 9.28 9.28
Facilities, Substations, continuedFacility FY 2014 FY 2013
Buildings and communications sites
Number of buildings 185 185
Number of communications sites 207 205
Land (fee)
Acres 183.28 183.28
Hectares 74.20 74.20
Land (easement)
Acres 176.33 174.37
Hectares 71.39 70.60
Transmission LinesVoltage rating
Iowa Minnesota Missouri Montana Nebraska North Dakota South Dakota Total
FY 2014 FY 2013 FY 2014 FY 2013 FY 2014 FY 2013 FY 2014 FY 2013 FY 2014 FY 2013 FY 2014 FY 2013 FY 2014 FY 2013 FY 2014 FY 2013
345-kV
Circuit miles 20.33 20.33 0.00 0.00 0.00 0.00 0.00 0.00 136.99 136.99 40.74 40.74 270.51 270.51 468.57 468.57
Circuit kilometers 32.71 32.71 0.00 0.00 0.00 0.00 0.00 0.00 220.42 220.42 65.55 65.55 435.25 435.25 753.93 753.93
Acres 372.50 372.50 0.00 0.00 0.00 0.00 0.00 0.00 2,505.06 2,505.06 0.00 0.00 5,081.59 5,081.59 7,959.15 7,959.15
Hectares 150.81 150.81 0.00 0.00 0.00 0.00 0.00 0.00 1,014.20 1,014.20 0.00 0.00 2,057.33 2,057.33 3,222.34 3,222.34
230-kV
Circuit miles 164.52 164.52 247.31 247.31 0.00 0.00 561.21 561.21 0.00 0.00 1,103.10 1,103.10 1,765.92 1,765.92 3,842.06 3,842.06
Circuit kilometers 264.71 264.71 397.92 397.92 0.00 0.00 902.99 902.99 0.00 0.00 1,774.89 1,774.89 2,841.37 2,841.37 6,181.87 6,181.88
Acres 2,053.62 2,053.62 3,092.45 3,092.45 0.00 0.00 8,405.64 8,405.64 0.00 0.00 13,007.09 13,004.61 17,359.99 17,337.29 43,918.79 43,893.61
Hectares 831.43 831.43 1,252.01 1,252.01 0.00 0.00 3,403.10 3,403.10 0.00 0.00 5,266.04 5,265.04 7,028.35 7,019.16 17,780.93 17,770.74
161-kV
Circuit miles 193.35 193.35 0.00 0.00 17.95 17.95 283.05 283.05 0.00 0.00 0.00 0.00 0.00 0.00 494.35 494.35
Circuit kilometers 311.10 311.10 0.00 0.00 28.88 28.88 455.43 455.43 0.00 0.00 0.00 0.00 0.00 0.00 795.41 795.41
Acres 2,331.62 2,331.62 0.00 0.00 219.74 219.74 5,073.04 5,027.68 0.00 0.00 0.00 0.00 0.00 0.00 7,624.40 7,579.04
Hectares 943.98 943.98 0.00 0.00 88.96 88.96 2,053.87 2,035.50 0.00 0.00 0.00 0.00 0.00 0.00 3,086.81 3,068.44
115-kV
Circuit miles 0.00 0.00 14.99 14.99 0.00 0.00 597.86 597.86 71.74 71.74 829.22 829.22 1,345.03 1,345.03 2,858.84 2,858.84
Circuit kilometers 0.00 0.00 24.12 24.12 0.00 0.00 961.96 961.96 115.43 115.43 1,334.21 1,334.21 2,164.15 2,164.15 4,599.87 4,599.87
Acres 0.00 0.00 142.92 142.92 0.00 0.00 6,362.29 6,362.06 564.12 564.12 10,593.16 10,591.77 12,253.11 12,251.21 29,915.60 29,912.08
Hectares 0.00 0.00 57.86 57.86 0.00 0.00 2,575.83 2,575.74 228.39 228.39 4,288.74 4,288.18 4,960.78 4,960.02 12,111.61 12,110.19

85
PICK-SLOAN MISSOURI RIVER BASIN PROGRAM EASTERN DIVISION
Transmission Lines, continuedVoltage rating
Iowa Minnesota Missouri Montana Nebraska North Dakota South Dakota Total
FY 2014 FY 2013 FY 2014 FY 2013 FY 2014 FY 2013 FY 2014 FY 2013 FY 2014 FY 2013 FY 2014 FY 2013 FY 2014 FY 2013 FY 2014 FY 2013
100-kV
Circuit miles 0.00 0.00 0.00 0.00 0.00 0.00 0.00 0.00 0.00 0.00 0.00 0.00 0.00 0.00 0.00 0.00
Circuit kilometers 0.00 0.00 0.00 0.00 0.00 0.00 0.00 0.00 0.00 0.00 0.00 0.00 0.00 0.00 0.00 0.00
Acres 0.00 0.00 0.00 0.00 0.00 0.00 125.14 125.14 0.00 0.00 0.00 0.00 0.00 0.00 125.14 125.14
Hectares 0.00 0.00 0.00 0.00 0.00 0.00 50.66 50.66 0.00 0.00 0.00 0.00 0.00 0.00 50.66 50.66
69-kV and below
Circuit miles 0.00 0.00 0.00 0.00 0.00 0.00 73.86 73.86 0.00 0.00 130.43 130.43 7.06 7.06 211.35 211.35
Circuit kilometers 0.00 0.00 0.00 0.00 0.00 0.00 118.84 118.84 0.00 0.00 209.86 209.86 11.36 11.36 340.06 340.06
Acres 0.00 0.00 1.73 1.73 0.00 0.00 560.74 560.74 0.00 0.00 1,371.45 1,376.48 4.90 4.90 1,938.82 1,943.85
Hectares 0.00 0.00 0.70 0.70 0.00 0.00 227.02 227.02 0.00 0.00 555.24 557.28 1.98 1.98 784.95 786.98
Total
Circuit miles 378.20 378.20 262.30 262.30 17.95 17.95 1,515.98 1,515.98 208.73 208.73 2,103.49 2,103.49 3,388.52 3,388.52 7,875.17 7,875.17
Circuit kilometers 608.52 608.52 422.04 422.04 28.88 28.88 2,439.22 2,439.22 335.85 335.85 3,384.52 3,384.51 5,452.13 5,452.13 12,671.15 12,671.15
Acres 4,757.74 4,757.74 3,237.10 3,237.10 219.74 219.74 20,526.85 20,481.26 3,069.18 3,069.18 24,971.70 24,972.86 34,699.59 34,674.99 91,481.90 91,412.87
Hectares 1,926.22 1,926.22 1,310.57 1,310.57 88.96 88.96 8,310.48 8,292.02 1,242.59 1,242.59 10,110.02 10,110.50 14,048.45 14,038.49 37,037.29 37,009.35
PowerplantsState/plant name Operating agency River Initial in-service date Existing number of units Installed capability1
FY 2014 (MW)Actual operating capability (MW)2 Net generation (GWh)3
July 1, 2013 July 1, 2014 FY 2013 FY 2014
Montana
Canyon Ferry Reclamation Missouri Dec 1953 3 50 57 57 273 332
Fort Peck Corps Missouri Jul 1943 5 185 202 203 1,025 764
Yellowtail4,5 Reclamation Big Horn Aug 1966 2 125 143 143 212 508
North Dakota
Garrison Corps Missouri Jan 1956 5 583 426 565 2,064 2,357
South Dakota
Big Bend Corps Missouri Oct 1964 8 494 491 490 821 889
Fort Randall Corps Missouri Mar 1954 8 320 356 360 1,504 1,647
Gavins Point Corps Missouri Sep 1956 3 132 112 74 694 646
Oahe Corps Missouri Apr 1962 7 786 686 738 2,076 2,377
Pick-Sloan Missouri River Basin Program—Eastern Division total 41 2,675 2,473 2,630 8,669 9,520
1 Maximum operating capability is the maximum generating capability of the units' at-unity power factor without exceeding the specified heat rise on each unit and independent of water constraints.2 Actual operating capability represents the operating capability on July 1, but may not represent the coincident or non-coincident peak operating capability for the powerplant, project or Western as a whole.3 Net generation is gross plant generation less plant use. These amounts have not been reduced by other priorities such as project pumping energy.4 Generation from Units 1 and 2 is marketed by the Rocky Mountain region. Generation from Units 3 and 4 is marketed by the Upper Great Plains region. For this table, one-half of the total capability and output is shown under this region.5 Normal sustained maximum capacity of each unit is 62.5 MW but units may be evaluated for higher output on a case-by-case basis.Operating agencies:Reclamation - Bureau of Reclamation, Department of the InteriorCorps - U. S. Army Corps of Engineers

86
PICK-SLOAN MISSOURI RIVER BASIN PROGRAM EASTERN DIVISION
Storage Generation
0
200
400
600
800
1000
1200
14002014 generation Average generation
SepAugJulJunMayAprMarFebJanDecNovOct
Gen
erat
ion
in m
illio
n kW
h
30
40
50
60
70
80
2014 storage Average storage
SepAugJulJunMayAprMarFebJanDecNovOct
Stor
age
in m
illio
n ac
re-fe
et
Active Firm Power Rate Provisions
Fiscal year Rate schedule designation
Capacity charge($/kW of billing
demand)
Energy charge not in excess of delivery
obligationsEffective date Annual composite
rate
2014 P-SED-F11 7.65 19.05 mills/kWhfor all energy 1/1/2010 33.25 mills/kWh
Active Marketing Plan Project Expiration date
Pick-Sloan Missouri River Basin Program—Eastern Division Dec. 31, 2020
Transmission Services RevenuesTransmission service
FY 20141 FY 20132
Revenue ($) Revenue ($)
Wheeling and transmission service 702,891 682,871
Extraordinary wheeling reimbursements 537,475 469,042
Firm network transmission service 58,913,755 53,872,258
Firm point-to-point transmission service 2,577,272 5,970,085
Nonfirm point-to-point transmission service 1,078,853 2,448,010
Short term point-to-point transmission service 36,446 0
Transmission services total 63,846,692 63,442,266 1 Transmission service revenues as presented in this table are $2.1 million greater than the FY 2014 transmission and other operating revenues presented
in the statements of revenues and expenses and accumulated net revenues due to variances between transmission revenue accrual estimates and actual transmission revenue.
2 Transmission service revenues as presented in this table are $2.4 million less than the FY 2013 transmission and other operating revenues presented in the statements of revenues and expenses and accumulated net revenues due to variances between transmission revenue accrual estimates and actual transmission revenue.
Ancillary Services Revenues1
Ancillary service FY 20142 FY 20132
Revenue ($) Revenue ($)
Reactive supply and voltage control service 1,464,341 1,899,541
Scheduling and dispatch service 88,355 92,680
Operating reserves - spinning 1,402,364 1,468,586
Regulation and frequency response 2,105,432 1,903,167
Ancillary services total 5,060,492 5,363,974 1 Excludes $0.9 million $3.3 million in other revenues for FY 2014 and FY 2013, respectively.2 Ancillary services revenues as presented in this table are $0.1 million less than the FY 2014 and FY 2013 transmission and other operating revenues presented
in the statements of revenues and expenses and accumulated net revenues due to variances between ancillary services revenue accrual estimates and actual ancillary services revenue.

87
PICK-SLOAN MISSOURI RIVER BASIN PROGRAM EASTERN DIVISION
Active Transmission Rate ProvisionsYear Rate schedule designation Rate
1/1/2014 - 12/31/2014 Integrated system network transmission rateIntegrated system firm point-to-point rateIntegrated system nonfirm point-to-point rateRegulation and frequency reponse serviceOperating reserve - spinning reserve serviceOperating reserve - supplemental reserve serviceScheduling, system control and dispatch serviceReactive supply and voltage control service
Load ratio share of annual revenue requirement of $195,517,977$2.96 per kW/month4.05 mills/kWh$0.06 per kW/month$0.20 per kW/month$0.20 per kW/month$42.43 per tag/day$0.03 per kW/month
Energy imbalance service i) For deviations within +/- 1.5 percent (minimum of 2 MW) of the scheduled transaction, 100 percent of average incremental cost; ii) For deviations greater than +/- 1.5 percent up to 7.5 percent (or greater than 2 MW up to 10 MW) of the scheduled transaction, 110 percent of incremental cost when energy taken is greater than energy scheduled and 90 percent of incremental cost when energy taken is less than scheduled; iii) For deviations greater than +/- 7.5 percent (or 10 MW) of the scheduled transaction, 125 percent of incremental cost when energy taken is greater than energy scheduled and 75 percent of incremental cost when energy taken is less than scheduled.
Generator imbalance service i) For deviations within +/- 1.5 percent (minimum of 2 MW) of the scheduled transaction, 100 percent of the average incremental cost; ii) For deviations greater than +/- 1.5 percent up to 7.5 percent (or greater than 2 MW up to 10 MW) of the scheduled transaction, 110 percent of the incremental cost when energy delivered is less than generation scheduled and 90 percent of incremental cost when energy delivered is greater than scheduled; iii) For deviations greater than +/- 7.5 percent (or 10 MW) of the scheduled transaction, 125 percent of incremental cost when energy delivered is less than energy scheduled and 75percent of incremental cost when energy delivered is greater than scheduled. As an exception, an intermittent resource will be exempt from this deviation band and will pay the deviation band charges for all deviations greater than the larger of 1.5 percent or 2 MW.
Penalty rate for unreserved use transmission service 200 percent of the transmission service rate for point-to-point service of assessed as follows: the penalty for a single hour will be based upon the rate for daily firm point-to-point service; the penalty for more than one assessment of a given duration (e.g. daily) will increase to the next longest duration (e.g. weekly); the penalty charge for multiple instances of unreserved use within a day will be based on the rate for daily firm point-to-point service; the penalty charge for multiple instances of unreserved use isolated to one calendar week would result in a penalty based on the charge for weekly firm point-to-point service; and the penalty charge for multiple instances of unreserved use during more than one week during a calendar month is based on the charge for monthly firm point-to-point service.
1/1/2013 - 12/31/2013 Integrated system network transmission rateIntegrated system firm point-to-point rateIntegrated system nonfirm point-to-point rateRegulation and frequency reponse serviceOperating reserve - spinning reserve serviceOperating reserve - supplemental reserve serviceScheduling, system control and dispatch serviceReactive supply and voltage control service
Load ratio share of annual revenue requirement of $176,723,580$2.81 per kW/month3.85 mills/kWh$0.06 per kW/month$0.17 per kW/month$0.17 per kW/month$42.42 per tag/day$0.06 per kW/month
Energy imbalance service i) For deviations within +/- 1.5 percent (minimum of 2 MW) of the scheduled transaction, 100 percent of average incremental cost; ii) For deviations greater than +/- 1.5 percent up to 7.5 percent (or greater than 2 MW up to 10 MW) of the scheduled transaction, 110 percent of incremental cost when energy taken is greater than energy scheduled and 90 percent of incremental cost when energy taken is less than scheduled; iii) For deviations greater than +/- 7.5 percent (or 10 MW) of the scheduled transaction, 125 percent of incremental cost when energy taken is greater than energy scheduled and 75 percent of incremental cost when energy taken is less than scheduled.
Generator imbalance service i) For deviations within +/- 1.5 percent (minimum of 2 MW) of the scheduled transaction, 100 percent of the average incremental cost; ii) For deviations greater than +/- 1.5 percent up to 7.5 percent (or greater than 2 MW up to 10 MW) of the scheduled transaction, 110 percent of the incremental cost when energy delivered is less than generation scheduled and 90 percent of incremental cost when energy delivered is greater than scheduled; iii) For deviations greater than +/- 7.5 percent (or 10 MW) of the scheduled transaction, 125 percent of incremental cost when energy delivered is less than energy scheduled and 75 percent of incremental cost when energy delivered is greater than scheduled. As an exception, an intermittent resource will be exempt from this deviation band and will pay the deviation band charges for all deviations greater than the larger of 1.5 percent or 2 MW.
Penalty rate for unreserved-use transmission service 200 percent of the transmission service rate for point-to-point service of assessed as follows: the penalty for a single hour will be based upon the rate for daily firm point-to-point service; the penalty for more than one assessment of a given duration (e.g. daily) will increase to the next longest duration (e.g. weekly); the penalty charge for multiple instances of unreserved use within a day will be based on the rate for daily firm point-to-point service; the penalty charge for multiple instances of unreserved use isolated to one calendar week would result in a penalty based on the charge for weekly firm point-to-point service; and the penalty charge for multiple instances of unreserved use during more than one week during a calendar month is based on the charge for monthly firm point-to-point service.

88
PICK-SLOAN MISSOURI RIVER BASIN PROGRAM EASTERN DIVISION
Power Sales by State and Customer CategoryState/customer category
FY 2014 FY 2013
Long-term (MWh) Other (MWh) Total energy (MWh) Long-term ($) Other ($) Total revenue ($) Energy (MWh) Revenue ($)ArkansasPower marketers 0 0 0 0 1,308,314 1,308,314 0 0Arkansas subtotal 0 0 0 0 1,308,314 1,308,314 0 0CaliforniaPower marketers 0 1 1 0 46 46 0 0California subtotal 0 1 1 0 46 46 0 0ColoradoInvestor-owned utilities 0 54 54 0 2,645 2,645 93 984,028Colorado subtotal 0 54 54 0 2,645 2,645 93 984,028FloridaPower marketers 0 40,894 40,894 0 907,180 907,180 6,974 178,654Florida subtotal 0 40,894 40,894 0 907,180 907,180 6,974 178,654IdahoInvestor-owned utilities 0 0 0 0 0 0 1 47Idaho subtotal 0 0 0 0 0 0 1 47IndianaPower marketers 0 229,958 229,958 0 5,930,773 5,930,773 255,140 5,559,644Indiana subtotal 0 229,958 229,958 0 5,930,773 5,930,773 255,140 5,559,644IowaMunicipalities 682,517 0 682,517 22,716,998 0 22,716,998 681,230 22,658,056Cooperatives 505,335 0 505,335 15,929,279 0 15,929,279 434,408 13,659,204Investor-owned utilities 0 11,825 11,825 0 338,487 338,487 934 23,254Iowa subtotal 1,187,852 11,825 1,199,677 38,646,277 338,487 38,984,764 1,116,572 36,340,514KansasMunicipalities 0 32 32 0 1,647 1,647 50 2,221Power marketers 0 1,359 1,359 0 33,717 33,717 14,694 310,980Kansas subtotal 0 1,391 1,391 0 35,364 35,364 14,744 313,201LouisianaMunicipalities 0 18 18 0 849 849 22 765Public utility districts 0 2 2 0 93 93 10 387Power marketers 0 161 161 0 6,824 6,824 392 15,597Louisiana subtotal 0 181 181 0 7,766 7,766 424 16,749MarylandPower marketers 0 8 8 0 448 448 40 1,515Maryland subtotal 0 8 8 0 448 448 40 1,515MinnesotaMunicipalities 1,413,940 0 1,413,940 44,807,873 0 44,807,873 1,413,853 44,819,009Cooperatives 575,198 0 575,198 19,010,592 0 19,010,592 643,240 21,220,911State agencies 37,543 0 37,543 1,138,985 0 1,138,985 36,734 1,117,316Native American tribes 22,756 0 22,756 756,646 0 756,646 22,756 756,646Power marketers 0 33,433 33,433 0 852,625 852,625 134,732 2,964,270Minnesota subtotal 2,049,437 33,433 2,082,870 65,714,096 852,625 66,566,721 2,251,315 70,878,152MississippiPublic utility districts 0 16 16 0 886 886 225 8,576Mississippi subtotal 0 16 16 0 886 886 225 8,576

89
PICK-SLOAN MISSOURI RIVER BASIN PROGRAM EASTERN DIVISION
Power Sales by State and Customer Category, continuedState/customer category
FY 2014 FY 2013
Long-term (MWh) Other (MWh) Total energy (MWh) Long-term ($) Other ($) Total revenue ($) Energy (MWh) Revenue ($)MissouriMunicipalities 0 17 17 0 1,759 1,759 35 1,464Cooperatives 0 14,995 14,995 0 368,803 368,803 5,934 150,414Investor-owned utilities 0 163 163 0 8,810 8,810 1,576 54,877Power marketers 0 17 17 0 1,188 1,188 47 2,044Missouri subtotal 0 15,192 15,192 0 380,560 380,560 7,592 208,799MontanaCooperatives 421,358 0 421,358 14,231,346 0 14,231,346 421,358 14,232,778State agencies 15,183 0 15,183 473,066 0 473,066 15,060 467,711Irrigation districts 2,720 0 2,720 100,528 0 100,528 3,440 122,095Native American tribes 50,171 0 50,171 1,668,187 0 1,668,187 50,171 1,668,187Investor-owned utilities 0 38 38 0 44,279 44,279 6 34,147Power marketers 0 67,883 67,883 0 1,598,022 1,598,022 60,305 1,434,022Project use 21,851 0 21,851 57,344 0 57,344 23,565 69,404Montana subtotal 511,283 67,921 579,204 16,530,471 1,642,301 18,172,772 573,905 18,028,344NebraskaMunicipalities 571,247 13,066 584,313 22,272,232 317,050 22,589,282 574,802 22,372,040Public utility districts 1,095,003 74 1,095,077 48,123,710 3,848 48,127,558 1,154,130 49,294,977State agencies 134,474 0 134,474 4,237,788 0 4,237,788 134,413 4,231,235Irrigation districts 464 0 464 20,755 0 20,755 508 17,788Native American tribes 24,615 0 24,615 818,447 0 818,447 24,616 818,448Power marketers 0 8,410 8,410 0 232,532 232,532 31,880 690,497Project use 2,954 0 2,954 7,385 0 7,385 3,409 8,704Nebraska subtotal 1,828,757 21,550 1,850,307 75,480,317 553,430 76,033,747 1,923,758 77,433,689NevadaPower marketers 0 1 1 0 43 43 0 0Nevada subtotal 0 1 1 0 43 43 0 0New JerseyPower marketers 0 0 0 0 0 0 164 6,842New Jersey subtotal 0 0 0 0 0 0 164 6,842North DakotaMunicipalities 190,523 0 190,523 6,361,021 0 6,361,021 189,018 6,345,283Cooperatives 1,061,406 1,945,724 3,007,130 44,860,423 56,595,295 101,455,718 2,024,420 67,613,899State agencies 106,794 0 106,794 3,582,765 0 3,582,765 107,384 3,609,040Irrigation districts 636 0 636 19,309 0 19,309 839 23,032Native American tribes 83,795 0 83,795 2,787,269 0 2,787,269 84,419 2,808,991Power marketers 0 158,861 158,861 0 2,929,370 2,929,370 262,591 5,473,040Project use 3,405 0 3,405 46,901 0 46,901 4,506 66,192North Dakota subtotal 1,446,559 2,104,585 3,551,144 57,657,688 59,524,665 117,182,353 2,673,177 85,939,477OhioPower marketers 0 295 295 0 29,239 29,239 386 15,786Ohio subtotal 0 295 295 0 29,239 29,239 386 15,786

90
PICK-SLOAN MISSOURI RIVER BASIN PROGRAM EASTERN DIVISION
Power Sales by State and Customer Category, continuedState/customer category
FY 2014 FY 2013
Long-term (MWh) Other (MWh) Total energy (MWh) Long-term ($) Other ($) Total revenue ($) Energy (MWh) Revenue ($)OklahomaCooperatives 0 13 13 0 712 712 39 1,334Federal agencies 0 27 27 0 890 890 14 414Investor-owned utilities 0 196 196 0 12,406 12,406 560 23,262Power marketers 0 106 106 0 6,887 6,887 257 11,033Oklahoma subtotal 0 342 342 0 20,895 20,895 870 36,043OregonInvestor-owned utilities 0 3 3 0 61 61 1 29Oregon subtotal 0 3 3 0 61 61 1 29South DakotaMunicipalities 698,708 0 698,708 23,461,943 0 23,461,943 698,781 23,460,813Cooperatives 952,766 0 952,766 31,026,613 0 31,026,613 952,236 31,015,501Public utility districts 0 56,888 56,888 0 1,996,807 1,996,807 74,677 2,424,642Federal agencies 50,562 0 50,562 1,659,640 0 1,659,640 47,703 1,569,007State agencies 141,144 490 141,634 4,707,478 20,426 4,727,904 136,419 4,550,666Native American tribes 131,046 3,293 134,339 4,490,704 158,603 4,649,307 134,630 4,612,151Investor-owned utilities 9,341 294,790 304,131 267,977 13,288,335 13,556,312 232,761 7,843,170Project use 3,262 0 3,262 49,836 0 49,836 4,440 62,812South Dakota subtotal 1,986,829 355,461 2,342,290 65,664,191 15,464,171 81,128,362 2,281,647 75,538,762TexasPower marketers 0 71 71 0 4,093 4,093 410 16,359Texas subtotal 0 71 71 0 4,093 4,093 410 16,359WashingtonFederal agencies 0 0 0 0 0 0 3 84Washington subtotal 0 0 0 0 0 0 3 84INTERNATIONALCanadaPower marketers 0 2,264 2,264 0 67,432 67,432 1,374 37,384Canada subtotal 0 2,264 2,264 0 67,432 67,432 1,374 37,384Pick-Sloan Missouri River Basin Program— Eastern Division total1 9,010,717 2,885,446 11,896,163 319,693,040 87,071,424 406,764,464 11,108,815 371,542,678
1 Power revenues as presented in this table are $3.2 million less and $5.5 million greater than the FY 2014 and FY 2013 sales of electric power, respectively, presented in the statements of revenues and expenses and accumulated net revenues due to variances between revenue accrual estimates and actual revenue along with other minor miscellaneous corrections and transactions.

91
PICK-SLOAN MISSOURI RIVER BASIN PROGRAM EASTERN DIVISION
Power Sales by Customer CategoryCustomer category
FY 2014 FY 2013
Long-term (MWh) Other (MWh) Total energy (MWh) Long-term ($) Other ($) Total revenue ($) Energy (MWh) Revenue ($)
Municipalities 3,556,935 13,133 3,570,068 119,620,067 321,305 119,941,372 3,557,791 119,659,651
Cooperatives 3,516,063 1,960,732 5,476,795 125,058,253 56,964,810 182,023,063 4,481,635 147,894,041
Public utility districts 1,095,003 56,980 1,151,983 48,123,710 2,001,634 50,125,344 1,229,042 51,728,582
Federal agencies 50,562 27 50,589 1,659,640 890 1,660,530 47,720 1,569,505
State agencies 435,138 490 435,628 14,140,082 20,426 14,160,508 430,010 13,975,968
Irrigation districts 3,820 0 3,820 140,592 0 140,592 4,787 162,915
Native American tribes 312,383 3,293 315,676 10,521,253 158,603 10,679,856 316,592 10,664,423
Investor-owned utilities 9,341 307,069 316,410 267,977 13,695,023 13,963,000 235,932 8,962,814
Power marketers 0 543,722 543,722 0 13,908,733 13,908,733 769,386 16,717,667
Project use 31,472 0 31,472 161,466 0 161,466 35,920 207,112
Pick-Sloan Missouri River Basin Program—Eastern Division total1 9,010,717 2,885,446 11,896,163 319,693,040 87,071,424 406,764,464 11,108,815 371,542,678
1 Power revenues as presented in this table are $3.2 million less and $5.5 million greater than the FY 2014 and FY 2013 sales of electric power, respectively, presented in the statements of revenues and expenses and accumulated net revenues due to variances between revenue accrual estimates and actual revenue along with other minor miscellaneous corrections and transactions.
Top 5 Customers in Other Revenue1
Rank Customer Revenue ($) Percent of total sales
1 Basin Electric Power Cooperative 56,595,295 65.0
2 Northwestern Public Service 13,288,335 15.3
3 Midcontinent Independent Transmission System Operator Energy Market 5,930,773 6.8
4 Rainbow Energy Marketing Corporation 2,929,370 3.4
5 Heartland Consumers Heartland District 1,961,190 2.3
Total 80,704,963 92.81 Excludes energy sales and power revenues from interdepartmental, interproject and project-use customers.
Top 5 Customers in Other Energy Sales1
Rank Customer Energy (MWh) Percent of total sales
1 Basin Electric Power Cooperative 1,945,724 67.4
2 Northwestern Public Service 294,790 10.2
3 Midcontinent Independent Transmission System Operator Energy Market 229,958 8.0
4 Rainbow Energy Marketing Corporation 158,861 5.5
5 PPL Energy Plus 67,883 2.4
Total 2,697,216 93.51 Excludes energy sales and power revenues from interdepartmental, interproject and project-use customers.
Top 5 Customers in Long-term Revenue1
Rank Customer Revenue ($) Percent of total sales
1 Nebraska Public Power District 36,632,341 11.5
2 East River Electric Power Cooperative 22,081,276 6.9
3 Omaha Public Power District 11,491,369 3.6
4 Central Montana Electric Cooperative 11,436,164 3.6
5 Minnkota Power Cooperative 11,215,044 3.5
Total 92,856,194 29.11 Excludes energy sales and power revenues from interdepartmental, interproject and project-use customers.
Top 5 Customers in Long-term Energy Sales1
Rank Customer Energy (MWh) Percent of total sales
1 Nebraska Public Power District 715,809 8.0
2 East River Electric Power Cooperative 700,634 7.8
3 Omaha Public Power District 379,194 4.2
4 Minnkota Power Cooperative 358,303 4.0
5 Central Power Electric Cooperative 339,689 3.8
Total 2,493,629 27.81 Excludes energy sales and power revenues from interdepartmental, interproject and project-use customers.

92
PICK-SLOAN MISSOURI RIVER BASIN PROGRAM EASTERN DIVISION
Purchased PowerSupplier
FY 20141 FY 20132
Energy (MWh) Costs ($ in thousands) Energy (MWh) Costs ($ in thousands)
NonWestern suppliers
Ameren3 0 0 44,982 1,340
American Electric Power Service Corporation 218 8 702 22
Associated Electric Cooperative 232,665 11,391 50,127 1,742
Basin Electric Power Cooperative 221,541 10,494 725,423 25,485
Black Hills Corporation 3,055 117 14,009 440
Bonneville Power Administration3 7 0 0 0
Cargill Power Markets 630,034 26,994 480,357 15,369
City Utilities of Springfield 16 1 41 2
CLECO Corporation3 3 0 179 9
Constellation Energy Commodities Group3 0 0 24 1
Empire District Electric 21 1 69 3
Entergy Services 25 1 1,880 98
Exelon Generation 26,710 839 32 2
Grand River Dam Authority 23 2 71 7
Heartland Consumers Power District 66,544 1,253 112,619 2,633
Independence3 4 0 20 0
Kansas City Board of Public Utilities 11 1 29 2
Kansas City Power and Light 57,393 1,778 159,266 4,274
KCP&L Greater Missouri Operations Company 25 1 114 4
Lafayette3 2 0 17 1
Louisiana Energy and Power Authority3 2 0 20 1
Midcontinent Independent Transmission System Operator Energy Market 254,087 10,730 133,853 3,902
Missouri River Energy Services 172,973 6,203 45,960 1,087
Nebraska Public Power District 68 3 222 7
Northpoint Energy Solutions 15,754 1,076 28,457 995
NorthWestern Energy 15,704 410 0 4
Northwestern Public Service 77,181 1,348 126,792 2,448
NRG Power Marketing3 3 0 213 10
Oklahoma Gas and Electric 158 8 493 18
Omaha Public Power District 127,391 4,758 123,989 6,086
Pacificorp3 1 0 0 0
PowerEx Corporation 465 23 0 0
PPL Energy Plus 22,651 1,572 10,638 315
Rainbow Energy Marketing Corporation 310,291 15,013 214,393 7,439
South Mississippi Electric Power Association3 2 0 87 4
Southwest Power Pool 0 2,588 0 0
Southwestern Public Service Company 129 5 462 17
Purchased Power, continuedSupplier
FY 20141 FY 20132
Energy (MWh) Costs ($ in thousands) Energy (MWh) Costs ($ in thousands)
Southwestern Power Administration 101 5 92 5
Sunflower Electric Power Corporation 25 1 62 3
Tenaska Power Services Company 39,344 2,505 11,600 445
The Energy Authority 990,002 41,751 679,383 19,008
Westar Energy 40,511 1,646 94,606 3,144
Western Farmers Electric Cooperative 29 2 78 3
NonWestern suppliers subtotal 3,305,169 142,528 3,061,361 96,375
Western suppliers
Loveland Area Projects3 0 0 10 0
Western suppliers subtotal 0 0 10 0
Purchased power total4 3,305,169 142,528 3,061,371 96,375 1 Purchased power as presented in this table is less than the FY 2014 statements of revenues and expenses and accumulated net revenues by $0.1 million due
to $0.2 million in interchange energy excluded from the purchased power table and -$0.3 million in variances between purchased power accrual estimates and actual purchased power.
2 Purchased power as presented in this table is less than the FY 2013 statements of revenues and expenses and accumulated net revenues by $0.5 million due to $0.2 million in interchange energy excluded from the purchased power table and $0.3 million in variances between purchased power accrual estimates and actual purchased power.
3 Purchased power expense was less than $1,000 in FY 2014 and FY 2013.4 The purchased power costs presented in this table include joint marketing plan sales of 217,000 MWh and $4.2 million for FY 2014; and 410,000 MWh and
$7.8 million for FY 2013.

93
PICK-SLOAN MISSOURI RIVER BASIN PROGRAM EASTERN DIVISION
Purchased TransmissionSupplier
FY 2014 FY 2013
Costs ($ in thousands) Costs ($ in thousands)
NonWestern suppliers
Basin Electric Power Cooperative 256 0
Central Electric Cooperative 15 9
Central Power Electric Cooperative 10 10
East River Electric Power Cooperative 11 15
Kandiyohi Power Cooperative 3 3
Loup Valley Rural Public Power District 19 21
Mclean Electric Cooperative 12 19
Minnkota Power Cooperative 196 196
Midcontinent Independent Transmission System Operator Energy Market 2,357 1,094
Montana-Dakota Utilities Company (77) 216
NorthWestern Energy 1,061 674
Moreau-Grand Electric 6 14
Mor-Gran-Sou Electric 18 87
Nebraska Public Power District 556 497
Oahe Electric 20 44
Otter Tail Power Company 2 1
Southern Montana Cooperative 2 4
Southern Power District 10 0
Southwest Power Pool 507 53
Upper Missouri Generation and Transmission Electric 272 289
West Central Electric Cooperative 63 77
NonWestern suppliers subtotal 5,319 3,323
Western suppliers 0 0
Purchased transmission total1 5,319 3,323 1 Purchased transmission as presented in this table is greater than the statements of revenues and expenses and accumulated net revenues by $0.1 million and
$0.2 million in FY 2014 and FY 2013, respectively, due to variances between purchased transmission accrual estimates and actual purchased transmission.

94
PICK-SLOAN MISSOURI RIVER BASIN PROGRAM EASTERN DIVISION
Customers by State and Customer CategoryState/customer category
FY 2014 FY 2013
Long-term Other Total Long-term Other TotalArkansasPower marketers 0 1 1 0 0 0Arkansas subtotal 0 1 1 0 0 0CaliforniaPower marketers 0 1 1 0 0 0California subtotal 0 1 1 0 0 0ColoradoInvestor-owned utilities 0 1 1 0 2 2Colorado subtotal 0 1 1 0 2 2FloridaPower marketers 0 1 1 0 1 1Florida subtotal 0 1 1 0 1 1IdahoInvestor-owned utilities 0 0 0 0 1 1Idaho subtotal 0 0 0 0 1 1IndianaPower marketers 0 1 1 0 1 1Indiana subtotal 0 1 1 0 1 1IowaMunicipalities 49 0 49 49 0 49Cooperatives 4 0 4 3 0 3Investor-owned utilities 0 1 1 0 1 1Iowa subtotal 53 1 54 52 1 53KansasMunicipalities 0 1 1 0 1 1Power marketers 0 2 2 0 3 3Kansas subtotal 0 3 3 0 4 4LouisianaMunicipalities 0 1 1 0 1 1Public utility districts 0 1 1 0 1 1Power marketers 0 1 1 0 1 1Louisiana subtotal 0 3 3 0 3 3MarylandPower marketers 0 1 1 0 2 2Maryland subtotal 0 1 1 0 2 2MinnesotaMunicipalities 49 0 49 48 0 48Cooperatives 15 0 15 16 0 16State agencies 1 0 1 1 0 1Native American tribes 3 0 3 3 0 3Investor-owned utilities 0 0 0 0 0 0Power marketers 0 1 1 0 1 1Minnesota subtotal 68 1 69 68 1 69
Customers by State and Customer Category, continuedState/customer category
FY 2014 FY 2013
Long-term Other Total Long-term Other Total
Mississippi
Public utility districts 0 1 1 0 1 1
Mississippi subtotal 0 1 1 0 1 1
Missouri
Municipalities 0 2 2 0 2 2
Cooperatives 0 1 1 0 1 1
Investor-owned utilities 0 2 2 0 2 2
Power marketers 0 1 1 0 1 1
Missouri subtotal 0 6 6 0 6 6
Montana
Cooperatives 3 0 3 3 0 3
State agencies 1 0 1 1 0 1
Irrigation districts 3 0 3 3 0 3
Native American tribes 5 0 5 5 0 5
Investor-owned utilities 0 1 1 0 1 1
Power marketers 0 1 1 0 1 1
Montana subtotal 12 2 14 12 2 14
Nebraska
Municipalities 53 0 53 53 1 54
Public utility districts 2 0 2 2 0 2
State agencies 8 0 8 8 0 8
Irrigation districts 1 0 1 1 0 1
Native American tribes 4 0 4 4 0 4
Power marketers 0 1 1 0 1 1
Nebraska subtotal 68 1 69 68 2 70
Nevada
Power marketers 0 1 1 0 0 0
Nevada subtotal 0 1 1 0 0 0
New Jersey
Power marketers 0 0 0 0 1 1
New Jersey subtotal 0 0 0 0 1 1
North Dakota
Municipalities 12 0 12 12 0 12
Cooperatives 7 0 7 7 0 7
State agencies 10 0 10 10 0 10
Irrigation districts 1 0 1 1 0 1
Native American tribes 5 0 5 5 0 5
Power marketers 0 1 1 0 1 1
North Dakota subtotal 35 1 36 35 1 36

95
PICK-SLOAN MISSOURI RIVER BASIN PROGRAM EASTERN DIVISION
Customers by State and Customer Category, continuedState/customer category
FY 2014 FY 2013
Long-term Other Total Long-term Other Total
Ohio
Power marketers 0 1 1 0 1 1
Ohio subtotal 0 1 1 0 1 1
Oklahoma
Cooperatives 0 1 1 0 1 1
Federal agencies 0 1 1 0 1 1
Investor-owned utilities 0 1 1 0 1 1
Power marketers 0 1 1 0 1 1
Oklahoma subtotal 0 4 4 0 4 4
Oregon
Investor-owned utilities 0 1 1 0 1 1
Oregon subtotal 0 1 1 0 1 1
South Dakota
Municipalities 33 0 33 33 0 33
Cooperatives 5 0 5 5 0 5
Public utility districts 0 2 2 0 2 2
Federal agencies 1 0 1 1 0 1
State agencies 10 0 10 10 1 11
Native American tribes 8 0 8 8 0 8
Investor-owned utilities 1 1 2 1 1 2
South Dakota subtotal 58 3 61 58 4 62
Texas
Power marketers 0 1 1 0 1 1
Texas subtotal 0 1 1 0 1 1
Washington
Federal agencies 0 0 0 0 1 1
Washington subtotal 0 0 0 0 1 1
INTERNATIONAL
Canada
Power marketers 0 1 1 0 2 2
Canada subtotal 0 1 1 0 2 2
Pick-Sloan Missouri River Basin Program—Eastern Division subtotal 294 37 331 293 43 336
Project use 24 0 24 26 0 26
Pick-Sloan Missouri River Basin Program—Eastern Division total 318 37 355 319 43 362
Summary by Customer CategoryCustomer category
FY 2014 FY 2013
Long-term Other Total Long-term Other Total
Municipalities 196 4 200 195 5 200
Cooperatives 34 2 36 34 2 36
Public utility districts 2 4 6 2 4 6
Federal agencies 1 1 2 1 2 3
State agencies 30 0 30 30 1 31
Irrigation districts 5 0 5 5 0 5
Native American tribes 25 0 25 25 0 25
Investor-owned utilities 1 8 9 1 10 11
Power marketers 0 18 18 0 19 19
Pick-Sloan Missouri River Basin Program—Eastern Division subtotal 294 37 331 293 43 336
Project use 24 0 24 26 0 26
Pick-Sloan Missouri River Basin Program—Eastern Division total 318 37 355 319 43 362

96
PICK-SLOAN MISSOURI RIVER BASIN PROGRAM EASTERN DIVISION
Power Sales and RevenuesCustomer
FY 2014 FY 2013
Energy (MWh) Revenue ($) Energy (MWh) Revenue ($)
MUNICIPALITIES
Iowa
Akron 10,071 348,993 10,071 348,993
Alta 9,442 309,226 9,442 309,226
Alton 7,127 239,951 7,127 239,951
Anita 6,605 214,819 6,605 214,819
Anthon 1,211 41,707 1,165 40,208
Atlantic 32,312 1,089,414 32,312 1,089,414
Auburn 617 20,694 600 20,425
Aurelia 2,117 70,790 2,099 69,039
Breda 3,613 119,819 3,613 119,819
Coon Rapids 11,933 403,583 11,933 403,583
Corning 13,764 465,906 13,764 465,906
Denison 75,926 2,470,199 75,926 2,470,199
Estherville 14,824 470,948 14,824 470,948
Fonda 1,779 60,736 1,779 60,736
Fontanelle 5,050 170,842 5,071 171,208
Glidden 4,764 160,079 4,674 156,032
Graettinger 5,476 181,614 5,476 181,614
Harlan 41,952 1,356,614 41,628 1,336,426
Hartley 14,940 482,829 14,940 482,829
Hawarden 21,904 716,410 21,842 712,283
Hinton 3,035 106,066 3,341 111,673
Kimballton 2,213 74,743 2,241 75,648
Lake Park 7,823 261,386 7,823 261,386
Lake View 16,490 544,374 16,490 544,374
Laurens 14,171 462,298 14,171 462,298
Lenox 10,210 334,908 10,210 334,908
Manilla 6,468 215,144 6,490 214,989
Manning 13,831 417,261 13,708 413,485
Mapleton 10,317 344,613 10,199 339,881
Marathon 769 27,901 769 27,901
Milford 11,602 392,182 11,602 392,182
Neola 1,165 40,529 1,154 39,734
Onawa 24,135 803,189 23,285 778,785
Orange City 31,676 1,044,455 31,676 1,044,455
Paullina 7,319 245,654 7,319 245,654
Pocahontas 5,207 174,492 5,207 174,492
Primghar 5,818 196,523 5,818 196,523
Power Sales and Revenues, continuedCustomer
FY 2014 FY 2013
Energy (MWh) Revenue ($) Energy (MWh) Revenue ($)
Remsen 10,470 347,878 10,470 347,878
Rock Rapids 20,873 687,140 20,873 687,140
Sanborn 11,157 352,626 11,157 352,626
Sergeant Bluff 7,792 249,620 7,792 249,620
Shelby 4,200 140,531 4,200 140,531
Sibley 16,592 541,097 16,592 541,097
Sioux Center 31,935 1,036,485 31,935 1,036,485
Spencer 90,367 3,229,345 90,367 3,229,345
Stanton 4,931 171,507 4,931 171,507
Villisca 9,556 312,636 9,551 312,559
Wall Lake 6,723 224,199 6,723 224,199
Woodbine 10,245 343,043 10,245 343,043
Iowa subtotal 682,517 22,716,998 681,230 22,658,056
Kansas
Kansas City Board of Public Utilities 32 1,647 50 2,221
Kansas subtotal 32 1,647 50 2,221
Louisiana
Lafayette 18 849 22 765
Louisiana subtotal 18 849 22 765
Minnesota
Ada 14,244 453,204 14,244 453,204
Adrian 8,839 286,860 8,839 286,860
Alexandria 96,279 2,992,980 96,279 2,992,980
Barnesville 11,797 372,660 11,797 372,660
Benson 26,869 869,803 26,869 869,803
Breckenridge 28,901 910,039 28,901 910,039
Detroit Lakes 69,655 2,187,112 69,655 2,187,112
East Grand Forks 73,051 2,330,159 73,051 2,330,159
Elbow Lake 9,595 321,704 9,595 321,704
Fairfax 8,890 292,325 8,890 292,325
Fairmont 3,418 118,549 3,418 118,549
Fosston 13,237 436,775 13,237 436,775
Granite Falls 7,863 267,040 7,863 267,040
Halstad 5,222 177,827 5,222 177,827
Hawley 8,499 286,740 8,499 286,740
Henning 4,838 160,734 4,838 160,734
Jackson 25,080 829,295 25,080 829,295
Kandiyohi 3,135 107,122 3,135 107,339

97
PICK-SLOAN MISSOURI RIVER BASIN PROGRAM EASTERN DIVISION
Power Sales and Revenues, continuedCustomer
FY 2014 FY 2013
Energy (MWh) Revenue ($) Energy (MWh) Revenue ($)
Lake Park 3,601 117,840 3,601 117,840
Lakefield 10,927 357,494 10,927 357,494
Litchfield 69,948 2,178,051 69,948 2,178,051
Luverne 47,790 1,502,342 47,790 1,502,342
Madison 14,122 464,099 14,002 465,256
Marshall 129,262 3,761,240 129,262 3,761,239
Melrose 34,968 1,056,336 34,968 1,056,336
Moorhead 227,199 7,283,053 227,199 7,283,053
Mountain Lake 5,403 169,826 5,387 177,480
New Ulm Public Utilities 2,377 76,571 2,469 79,480
Newfolden 2,781 88,331 2,696 88,197
Nielsville 671 23,020 644 22,680
Olivia 22,307 717,160 22,307 717,160
Ortonville 23,207 756,007 23,207 755,077
Redwood Falls 44,340 1,427,840 44,340 1,427,840
Sauk Centre 24,722 785,129 24,722 784,551
Shelly 1,725 56,323 1,782 57,207
Sleepy Eye 8,309 269,695 8,309 269,695
Springfield 5,284 178,840 5,284 178,840
St. James 35,851 1,120,779 35,851 1,119,950
Staples 6,567 203,792 6,567 203,792
Stephen 5,916 200,031 5,916 200,031
Thief River Falls 66,743 2,221,734 66,743 2,221,734
Tyler 8,553 285,160 8,553 285,160
Wadena 42,804 1,347,987 42,804 1,347,987
Warren 12,661 426,205 12,661 426,205
Westbrook 7,331 238,938 7,343 240,065
Willmar 34,286 1,090,126 34,286 1,090,126
Windom 36,494 1,179,673 36,494 1,179,673
Worthington 58,379 1,823,323 58,379 1,823,323
Minnesota subtotal 1,413,940 44,807,873 1,413,853 44,819,009
Missouri
City of Independence 4 1,079 3 147
City of Springfield, Utilities 13 680 32 1,317
Missouri subtotal 17 1,759 35 1,464
Nebraska
Ansley 362 11,793 362 11,793
Arnold 5,838 191,836 5,838 191,836
Auburn 12,842 438,834 12,842 438,834
Power Sales and Revenues, continuedCustomer
FY 2014 FY 2013
Energy (MWh) Revenue ($) Energy (MWh) Revenue ($)
Beatrice 11,181 372,081 11,181 372,081
Beaver City 1,275 42,337 1,275 42,337
Blue Hill 4,844 161,360 4,844 161,360
Broken Bow 11,090 357,774 11,090 357,774
Burwell 2,535 83,495 2,535 83,495
Callaway 3,833 124,445 3,833 124,445
Cambridge 2,409 81,482 2,409 81,482
Crete 12,852 409,288 12,852 409,288
Curtis 1,664 54,918 1,664 54,918
David City 6,316 212,760 6,340 209,992
De Witt 2,428 85,044 2,493 86,304
Deshler 2,138 71,446 2,138 71,446
Emerson 1,816 60,570 1,835 60,441
Fairbury 12,816 415,955 12,816 415,955
Falls City 14,751 498,942 14,751 498,942
Franklin 2,411 82,306 2,440 81,856
Fremont 26,250 841,777 26,250 841,777
Grand Island 33,367 1,113,694 33,367 1,113,694
Hastings 47,150 1,512,483 47,150 1,512,483
Indianola 415 14,436 415 14,436
Laurel 2,423 79,146 2,423 79,146
Lincoln 164,183 8,884,667 156,598 8,744,787
Lyons 2,405 81,840 2,401 81,423
Madison 16,362 509,545 16,346 510,649
Municipal Energy Agency of Nebraska 0 0 260 9,620
Nebraska City 38,206 1,247,593 38,206 1,247,593
Neligh 1,277 43,368 1,298 43,181
Ord 5,851 196,267 5,851 196,267
Oxford 2,408 76,462 2,408 76,462
Pender 2,693 91,742 2,693 91,742
Pierce 1,134 38,255 1,134 38,255
Plainview 2,676 89,765 2,676 89,765
Randolph 2,284 74,668 2,287 74,342
Red Cloud 2,682 87,600 2,682 87,600
Sargent 1,867 65,155 1,867 65,155
Schuyler 21,843 685,061 21,693 675,950
Shickley 254 8,776 254 8,776
South Sioux City 28,392 894,521 27,220 853,380

98
PICK-SLOAN MISSOURI RIVER BASIN PROGRAM EASTERN DIVISION
Power Sales and Revenues, continuedCustomer
FY 2014 FY 2013
Energy (MWh) Revenue ($) Energy (MWh) Revenue ($)
Spalding 3,867 139,562 3,889 139,559
Spencer 368 12,847 368 12,847
Stuart 1,245 40,865 1,245 40,865
Syracuse 1,214 41,069 1,214 41,069
Tecumseh 3,966 133,345 3,966 133,345
Wahoo 10,478 336,293 10,478 336,293
Wakefield 8,282 245,688 7,775 231,550
Wayne 9,723 318,303 9,723 318,303
West Point 4,873 158,738 4,873 158,738
Wilber 8,664 291,842 8,145 270,495
Winside 2,264 77,808 2,263 78,479
Wisner 11,135 374,837 11,135 374,837
Wood River 711 24,598 711 24,598
Nebraska subtotal 584,313 22,589,282 574,802 22,372,040
North Dakota
Cavalier 17,761 592,274 17,795 592,102
Grafton 35,892 1,181,427 35,892 1,181,427
Hillsboro 14,671 467,809 14,671 467,809
Hope 2,561 87,569 2,561 87,569
Lakota 10,543 360,897 10,543 360,897
Maddock 2,478 85,791 2,478 85,791
Northwood 11,143 368,202 11,143 368,202
Park River 15,064 497,019 15,064 497,019
Riverdale 2,088 74,069 2,088 74,079
Sharon 1,223 42,039 1,223 42,039
Stanton 1,219 39,393 1,209 38,579
Valley City 75,880 2,564,532 74,351 2,549,770
North Dakota subtotal 190,523 6,361,021 189,018 6,345,283
South Dakota
Aberdeen 3,047 98,339 3,012 96,072
Arlington 7,504 241,215 7,504 241,215
Aurora 1,754 59,778 1,754 59,778
Badger 1,347 45,397 1,487 50,467
Beresford 12,270 442,726 12,270 442,726
Big Stone City 9,830 297,415 9,830 297,415
Brookings 103,619 3,335,511 103,619 3,335,511
Bryant 2,679 87,403 2,679 87,403
Burke 6,021 199,558 6,011 198,195
Colman 3,925 136,643 3,925 136,643
Power Sales and Revenues, continuedCustomer
FY 2014 FY 2013
Energy (MWh) Revenue ($) Energy (MWh) Revenue ($)
Estelline 5,189 171,292 5,189 171,292
Faith 6,213 224,144 6,205 225,143
Flandreau 14,591 504,093 14,591 504,093
Fort Pierre 12,466 464,216 12,466 464,216
Groton 10,024 329,846 10,024 329,846
Hecla 3,314 109,960 3,306 111,448
Howard 8,357 276,046 8,357 276,046
Langford 2,228 77,399 2,233 77,045
Madison 55,525 1,758,618 55,525 1,758,618
Mclaughlin 7,006 233,558 7,065 238,884
Miller 20,281 678,443 20,281 683,334
Parker 9,463 310,968 9,493 310,905
Pickstown 1,513 49,888 1,513 49,888
Pierre 114,403 4,160,048 114,403 4,152,593
Plankinton 6,569 221,777 6,569 221,777
Sioux Falls 43,599 1,384,859 43,599 1,384,859
Tyndall 8,076 301,818 8,076 301,822
Vermillion 41,949 1,413,159 41,949 1,413,159
Volga 10,592 311,614 10,592 311,614
Watertown 123,945 4,072,811 123,945 4,072,811
Wessington Springs 8,004 287,015 8,004 286,970
White 915 30,077 915 30,077
Winner 32,490 1,146,309 32,390 1,138,948
South Dakota subtotal 698,708 23,461,943 698,781 23,460,813
Municipalities subtotal 3,570,068 119,941,372 3,557,791 119,659,651
COOPERATIVES
Iowa
Central Iowa Power Cooperative 85,093 2,668,550 82,207 2,606,994
Corn Belt Power Cooperative 132,783 4,185,215 132,783 4,185,207
L&O Power Cooperative 68,042 2,208,516 0 0
Northwest Iowa Power Cooperative 219,417 6,866,998 219,418 6,867,003
Iowa subtotal 505,335 15,929,279 434,408 13,659,204
Minnesota
Agralite Electric Cooperative 43,599 1,430,828 43,114 1,422,535
Brown County Rural Electric 29,350 962,121 29,507 964,798
Federated Rural Electric Association 48,254 1,511,340 49,583 1,534,065
Itasca-Mantrap Cooperative Electric Association 23,833 758,825 23,833 758,825

99
PICK-SLOAN MISSOURI RIVER BASIN PROGRAM EASTERN DIVISION
Power Sales and Revenues, continuedCustomer
FY 2014 FY 2013
Energy (MWh) Revenue ($) Energy (MWh) Revenue ($)
Kandiyohi Power Cooperative 31,436 938,687 31,436 938,687
L&O Power Cooperative 0 0 68,042 2,208,516
Lake Region Cooperative Electrical Association 69,719 2,402,692 69,506 2,399,046
Mcleod Cooperative Power Association 11,381 374,433 11,553 377,380
Meeker Cooperative Light and Power 23,247 790,122 23,518 794,754
Minnesota Valley Cooperative 51,307 1,745,625 51,307 1,747,428
Nobles Cooperative Electric 51,097 1,716,655 50,943 1,714,021
Redwood Electric Cooperative 31,185 980,179 30,997 976,963
Runestone Electric Association 43,373 1,486,214 43,658 1,491,093
South Central Electric Association 40,229 1,279,222 39,842 1,272,604
Stearns Cooperative Electric Association 48,835 1,654,907 48,523 1,649,578
Todd-Wadena Electric Cooperative 28,353 978,742 27,878 970,618
Minnesota subtotal 575,198 19,010,592 643,240 21,220,911
Missouri
Associated Electric Cooperative 14,995 368,803 5,934 150,414
Missouri subtotal 14,995 368,803 5,934 150,414
Montana
Big Horn County Electric Cooperative 14,156 467,309 14,156 467,309
Central Montana Electric Cooperative 339,689 11,436,164 308,822 10,376,467
Southern Montana Cooperative 67,513 2,327,873 98,380 3,389,002
Montana subtotal 421,358 14,231,346 421,358 14,232,778
North Dakota
Basin Electric Power Cooperative 1,947,049 67,738,799 964,122 33,948,035
Capital Electric Cooperative 12,174 423,807 12,174 423,807
Central Power Electric Cooperative 317,869 9,980,081 318,073 9,981,507
KEM Electric Cooperative 32,566 1,151,597 32,566 1,151,875
Minnkota Power Cooperative 358,303 11,215,044 358,303 11,211,749
Mor-Gran-Sou Electric Cooperative 26,578 887,487 26,591 886,795
Upper Missouri Generation and Transmission Electric Cooperative
312,591 10,058,903 312,591 10,010,131
North Dakota subtotal 3,007,130 101,455,718 2,024,420 67,613,899
Power Sales and Revenues, continuedCustomer
FY 2014 FY 2013
Energy (MWh) Revenue ($) Energy (MWh) Revenue ($)
Oklahoma
Western Farmers Electric Cooperative 13 712 39 1,334
Oklahoma subtotal 13 712 39 1,334
South Dakota
East River Electric Power Cooperative 700,634 22,081,276 700,818 22,081,812
Grand Electric Cooperative 25,819 849,267 25,819 849,401
Northern Electric Cooperative 6,931 236,336 6,212 220,142
Rosebud Electric Cooperative 59,456 2,151,757 59,456 2,151,772
Rushmore Electric Power Cooperative 159,926 5,707,977 159,931 5,712,374
South Dakota subtotal 952,766 31,026,613 952,236 31,015,501
Cooperatives subtotal 5,476,795 182,023,063 4,481,635 147,894,041
PUBLIC UTILITY DISTRICTS
Louisiana
Louisiana Energy and Power Authority 2 93 10 387
Louisiana subtotal 2 93 10 387
Mississippi
South Mississippi Electric Power Association 16 886 225 8,576
Mississippi subtotal 16 886 225 8,576
Nebraska
Nebraska Public Power District 715,843 36,633,561 766,877 37,607,724
Omaha Public Power District 379,234 11,493,997 387,253 11,687,253
Nebraska subtotal 1,095,077 48,127,558 1,154,130 49,294,977
South Dakota
Heartland Consumers Power District 55,883 1,961,190 56,107 1,819,281
Missouri River Energy Services 1,005 35,617 18,570 605,361
South Dakota subtotal 56,888 1,996,807 74,677 2,424,642
Public utility districts subtotal 1,151,983 50,125,344 1,229,042 51,728,582
FEDERAL AGENCIES
Oklahoma
Southwestern Power Administration 27 890 14 414
Oklahoma subtotal 27 890 14 414
South Dakota
Ellsworth Air Force Base 50,562 1,659,640 47,703 1,569,007
South Dakota subtotal 50,562 1,659,640 47,703 1,569,007

100
PICK-SLOAN MISSOURI RIVER BASIN PROGRAM EASTERN DIVISION
Power Sales and Revenues, continuedCustomer
FY 2014 FY 2013
Energy (MWh) Revenue ($) Energy (MWh) Revenue ($)
Washington
Bonneville Power Administration 0 0 3 84
Washington subtotal 0 0 3 84
Federal agencies subtotal 50,589 1,660,530 47,720 1,569,505
STATE AGENCIES
Minnesota
Southwest State University 37,543 1,138,985 36,734 1,117,316
Minnesota subtotal 37,543 1,138,985 36,734 1,117,316
Montana
Montana State University-Bozeman 15,183 473,066 15,060 467,711
Montana subtotal 15,183 473,066 15,060 467,711
Nebraska
Beatrice State Developmental Center 5,755 193,675 6,120 199,840
Hastings Regional Center 5,645 183,849 5,645 183,849
Nebraska State Penitentiary 8,361 276,245 8,361 276,245
Norfolk Regional Center 2,446 84,761 2,446 84,761
Peru State College 1,709 57,400 1,621 56,230
University of Nebraska-Lincoln 102,093 3,165,285 102,093 3,165,285
University of Nebraska-Omaha 6,555 212,384 6,217 200,836
Wayne State College 1,910 64,189 1,910 64,189
Nebraska subtotal 134,474 4,237,788 134,413 4,231,235
North Dakota
Dakota College at Bottineau 1,066 35,944 1,083 35,840
Mclean-Sheridan 638 23,079 628 23,011
Missouri West 295 15,196 302 15,534
North Dakota Development Center 4,347 137,000 4,601 145,314
North Dakota Mill and Elevator Association 24,679 798,593 24,679 798,593
North Dakota State College of Science 8,238 292,751 8,130 288,630
North Dakota State Hospital-Jamestown 5,061 172,155 5,061 172,155
North Dakota State School for the Deaf 468 16,621 538 18,974
Southwest Water Authority 17,940 690,986 18,300 710,549
University of North Dakota-Grand Forks 44,062 1,400,440 44,062 1,400,440
North Dakota subtotal 106,794 3,582,765 107,384 3,609,040
Power Sales and Revenues, continuedCustomer
FY 2014 FY 2013
Energy (MWh) Revenue ($) Energy (MWh) Revenue ($)
South Dakota
Black Hills State University 7,597 246,875 7,411 242,816
Lewis & Clark Regional Water System 10,333 473,284 9,503 421,578
Mike Durfee State Prison 4,067 138,781 3,981 136,481
Northern State University-Aberdeen 8,584 291,140 8,898 301,063
South Dakota Developmental Center-Redfield 3,726 116,919 3,771 118,319
South Dakota Human Services Center-Yankton 6,267 222,155 6,640 231,286
South Dakota School of Mines and Technology 11,447 372,617 11,778 379,415
South Dakota State Penitentiary 7,217 237,271 7,637 249,419
South Dakota State University-Brookings 46,861 1,507,840 41,563 1,360,029
University of South Dakota-Vermillion 35,535 1,121,022 35,237 1,110,260
South Dakota subtotal 141,634 4,727,904 136,419 4,550,666
State agencies subtotal 435,628 14,160,508 430,010 13,975,968
IRRIGATION DISTRICTS
Montana
Hammond Irrigation District 208 7,573 292 10,771
Hysham Irrigation District 1,686 53,052 2,251 71,800
Prairie County Water and Sewer District 826 39,903 897 39,524
Montana subtotal 2,720 100,528 3,440 122,095
Nebraska
Loup Basin Reclamation District 464 20,755 508 17,788
Nebraska subtotal 464 20,755 508 17,788
North Dakota
Garrison Diversion 636 19,309 839 23,032
North Dakota subtotal 636 19,309 839 23,032
Irrigation districts subtotal 3,820 140,592 4,787 162,915
NATIVE AMERICAN TRIBES
Minnesota
Lower Sioux 11,787 391,918 11,787 391,918
Upper Sioux Indian Community 1,205 40,069 1,205 40,069
White Earth Indian Reservation 9,764 324,659 9,764 324,659
Minnesota subtotal 22,756 756,646 22,756 756,646

101
PICK-SLOAN MISSOURI RIVER BASIN PROGRAM EASTERN DIVISION
Power Sales and Revenues, continuedCustomer
FY 2014 FY 2013
Energy (MWh) Revenue ($) Energy (MWh) Revenue ($)
Montana
Chippewa Cree Tribe 2,479 82,423 2,479 82,423
Crow Tribe 4,150 137,988 4,150 137,988
Fort Belknap Indian Community 11,206 372,601 11,206 372,601
Fort Peck Tribe 21,345 709,724 21,345 709,724
Northern Cheyenne Tribe 10,991 365,451 10,991 365,451
Montana subtotal 50,171 1,668,187 50,171 1,668,187
Nebraska
Omaha Tribe of Nebraska 7,616 253,241 7,617 253,242
Ponca Tribe of Nebraska 5,815 193,349 5,815 193,349
Santee Sioux Tribe 2,930 97,414 2,930 97,414
Winnebago Tribe 8,254 274,443 8,254 274,443
Nebraska subtotal 24,615 818,447 24,616 818,448
North Dakota
Belcourt and Fort Totten-BIA 2,002 67,647 2,625 89,369
Spirit Lake Sioux Tribe 16,864 560,741 16,865 560,741
Standing Rock Sioux Tribe 20,025 665,833 20,025 665,833
Three Affiliated Tribes 13,360 444,212 13,360 444,212
Turtle Mountain Band of Chippewa 31,544 1,048,836 31,544 1,048,836
North Dakota subtotal 83,795 2,787,269 84,419 2,808,991
South Dakota
Cheyenne River Sioux Tribe 19,960 663,670 19,960 663,670
Crow Creek Sioux Tribe 2,177 72,390 2,177 72,390
Lower Brule Sioux Tribe 4,585 152,455 4,585 152,455
Mni Wiconi 6,901 411,974 7,191 374,817
Oglala Sioux Tribe 51,759 1,720,979 51,759 1,720,979
Rosebud Sioux Tribe 31,490 1,047,036 31,490 1,047,036
Sisseton-Wahpeton Sioux Tribe 7,809 259,664 7,810 259,664
Yankton Sioux Tribe 9,658 321,139 9,658 321,140
South Dakota subtotal 134,339 4,649,307 134,630 4,612,151
Native American tribes subtotal 315,676 10,679,856 316,592 10,664,423
INVESTOR-OWNED UTILITIES
Colorado
Southwestern Public Service Company 54 2,645 93 3,282
Public Service Company of Colorado 0 0 0 980,746
Colorado subtotal 54 2,645 93 984,028
Power Sales and Revenues, continuedCustomer
FY 2014 FY 2013
Energy (MWh) Revenue ($) Energy (MWh) Revenue ($)
Idaho
Idaho Power 0 0 1 47
Idaho subtotal 0 0 1 47
Iowa
Alliant Energy Services 11,825 338,487 934 23,254
Iowa subtotal 11,825 338,487 934 23,254
Missouri
Kansas City Power and Light 138 7,642 1,506 51,949
KCP&L Greater Missouri Operations Company 25 1,168 70 2,928
Missouri subtotal 163 8,810 1,576 54,877
Montana
Northwestern Energy 38 44,279 6 34,147
Montana subtotal 38 44,279 6 34,147
Oklahoma
Oklahoma Gas and Electric 196 12,406 560 23,262
Oklahoma subtotal 196 12,406 560 23,262
Oregon
Pacificorp 3 61 1 29
Oregon subtotal 3 61 1 29
South Dakota
Black Hills Power and Light 9,341 267,977 21,932 602,153
Northwestern Public Service 294,790 13,288,335 210,829 7,241,017
South Dakota subtotal 304,131 13,556,312 232,761 7,843,170
Investor-owned utilities subtotal 316,410 13,963,000 235,932 8,962,814
POWER MARKETERS
Arkansas
Southwestern Power Pool 0 1,308,314 0 0
Arkansas subtotal 0 1,308,314 0 0
California
Naturener USA 1 46 0 0
California subtotal 1 46 0 0
Florida
The Energy Authority 40,894 907,180 6,974 178,654
Florida subtotal 40,894 907,180 6,974 178,654
Indiana
MISO Energy Market 229,958 5,930,773 255,140 5,559,644
Indiana subtotal 229,958 5,930,773 255,140 5,559,644

102
PICK-SLOAN MISSOURI RIVER BASIN PROGRAM EASTERN DIVISION
Power Sales and Revenues, continuedCustomer
FY 2014 FY 2013
Energy (MWh) Revenue ($) Energy (MWh) Revenue ($)
Kansas
Endure Energy 0 0 6,997 157,456
Sunflower Electric Power Corporation 51 5,281 72 3,534
Westar Energy 1,308 28,436 7,625 149,990
Kansas subtotal 1,359 33,717 14,694 310,980
Louisiana
CLECO Corporation 161 6,824 392 15,597
Louisiana subtotal 161 6,824 392 15,597
Maryland
Constellation Energy Commodities Group 0 0 17 581
Excelon Generation 8 448 23 934
Maryland subtotal 8 448 40 1,515
Minnesota
Cargill Power Marketers 33,433 852,625 134,732 2,964,270
Minnesota subtotal 33,433 852,625 134,732 2,964,270
Missouri
Empire District Electric 17 1,188 47 2,044
Missouri subtotal 17 1,188 47 2,044
Montana
PPL Energyplus 67,883 1,598,022 60,305 1,434,022
Montana subtotal 67,883 1,598,022 60,305 1,434,022
Nebraska
Tenaska Power Services 8,410 232,532 31,880 690,497
Nebraska subtotal 8,410 232,532 31,880 690,497
Nevada
Sierra Pacific Power Company 1 43 0 0
Nevada subtotal 1 43 0 0
New Jersey
NRG Power Marketing 0 0 164 6,842
New Jersey subtotal 0 0 164 6,842
North Dakota
Rainbow Energy Marketing Corporation 158,861 2,929,370 262,591 5,473,040
North Dakota subtotal 158,861 2,929,370 262,591 5,473,040
Ohio
American Electric Power Service 295 29,239 386 15,786
Ohio subtotal 295 29,239 386 15,786
Power Sales and Revenues, continuedCustomer
FY 2014 FY 2013
Energy (MWh) Revenue ($) Energy (MWh) Revenue ($)
Oklahoma
Grand River Dam Authority 106 6,887 257 11,033
Oklahoma subtotal 106 6,887 257 11,033
Texas
Entergy Services 71 4,093 410 16,359
Texas subtotal 71 4,093 410 16,359
INTERNATIONAL
Canada
Northpoint Energy Solutions 2,264 67,432 1,274 35,084
Powerex 0 0 100 2,300
Canada subtotal 2,264 67,432 1,374 37,384
Power marketers subtotal 543,722 13,908,733 769,386 16,717,667
PROJECT USE
Montana
Montana (11 customers) 21,851 57,344 23,565 69,404
Montana subtotal 21,851 57,344 23,565 69,404
Nebraska
Nebraska (one customer) 2,954 7,385 3,409 8,704
Nebraska subtotal 2,954 7,385 3,409 8,704
North Dakota
North Dakota (seven customers) 3,405 46,901 4,506 66,192
North Dakota subtotal 3,405 46,901 4,506 66,192
South Dakota
South Dakota (five customers) 3,262 49,836 4,440 62,812
South Dakota subtotal 3,262 49,836 4,440 62,812
Project-use subtotal 31,472 161,466 35,920 207,112
Pick-Sloan Missouri River Basin Program—Eastern Division total1 11,896,163 406,764,464 11,108,815 371,542,678
1 Power revenues as presented in this table are $3.2 million less and $5.5 million greater than the FY 2014 and FY 2013 sales of electric power, respectively, presented in the statements of revenues and expenses and accumulated net revenues due to variances between revenue accrual estimates and actual revenue along with other minor miscellaneous corrections and transactions.

103
PICK-SLOAN MISSOURI RIVER BASIN PROGRAM WESTERN AND EASTERN DIVISIONS
Status of Repayment (dollars in thousands) Cumulative 20131 ($) Adjustment ($) Annual 20142 ($) Cumulative 20143 ($)
REVENUE:
Gross operating revenue 11,508,891 931 626,966 12,136,788
Income transfers (net) 1,408 0 0 1,408
Total operating revenue 11,510,299 931 626,966 12,138,196
ExPENSES:
O&M and other3 4,538,822 7,339 200,836 4,746,997
Purchase power and other 3,501,233 0 181,066 3,682,299
Interest
Federally financed 2,530,122 (815) 114,481 2,643,788
Non-federally financed 44,056 0 2,182 46,238
Total interest 2,574,178 (815) 116,663 2,690,026
Total expense 10,614,233 6,524 498,565 11,119,322
(Deficit)/surplus revenue (433,616) (6,494) 111,726 (328,384)
INVESTMENT:
Federally financed power 3,175,249 0 53,515 3,228,764
Non-federally financed power 23,255 0 0 23,255
Nonpower 729,805 3,696 0 733,501
Total investment 3,928,309 3,696 53,515 3,985,520
INVESTMENT REPAID:
Federally financed power 1,248,623 901 16,256 1,265,780
Non-federally financed power 4,485 0 419 4,904
Nonpower 76,574 0 0 76,574
Total investment repaid 1,329,682 901 16,675 1,347,258
INVESTMENT UNPAID:
Federally financed power 1,926,626 (901) 37,259 1,962,984
Non-federally financed power 18,770 0 (419) 18,351
Nonpower 653,231 3,696 0 656,927
Total investment unpaid 2,598,627 2,795 36,840 2,638,262
FUND BALANCES:
Colorado River Development 0 0 0 0
Working capital 0 0 0 0
PERCENT OF INVESTMENT REPAID TO DATE:
Federal 39.32% 39.20%
Non-federal 19.29% 21.09%
Nonpower 10.49% 10.44%1 This column ties to the cumulative FY 2013 numbers on Page 103 of the FY 2013 Statistical Appendix.2 Based on FY 2014 final audited financial statements.3 Based on FY 2014 final audited financial statements.

104
PICK-SLOAN MISSOURI RIVER BASIN PROGRAM WESTERN AND EASTERN DIVISIONS
Balance SheetsAs of Sept. 30, 2014 and 2013 (in thousands)
FY 2014 FY 2013
Western Reclamation Corps Total Western Reclamation Corps Total
Assets
Completed utility plant $1,939,890 $480,564 $1,025,600 $3,446,054 $1,891,409 $465,193 $1,017,134 $3,373,736
Accumulated depreciation (916,622) (342,761) (564,369) (1,823,752) (878,362) (339,253) (553,933) (1,771,548)
Net completed plant 1,023,268 137,803 461,231 1,622,302 1,013,047 125,940 463,201 1,602,188
Construction work-in-progress 80,013 15,494 67,675 163,182 80,206 2,321 48,205 130,732
Net utility plant 1,103,281 153,297 528,906 1,785,484 1,093,253 128,261 511,406 1,732,920
Cash 239,516 64,147 76,116 379,779 245,567 38,097 96,479 380,143
Accounts receivable, net 76,606 (59) 0 76,547 71,174 465 0 71,639
Regulatory assets 20,792 22,968 36,465 80,225 21,056 23,580 23,582 68,218
Other assets 41,434 0 4,832 46,266 41,453 0 4,411 45,864
Total assets 1,481,629 240,353 646,319 2,368,301 1,472,503 190,403 635,878 2,298,784
Liabilities:
Long-term liabilities 0 18,351 0 18,351 1,690 18,770 0 20,460
Customer advances and other liabilities 22,840 6,823 4,740 34,403 22,854 7,888 7,236 37,978
Accounts payable 7,644 2,849 7,355 17,848 7,314 2,611 8,088 18,013
Environmental cleanup liabilities 5,754 813 0 6,567 5,770 1,029 0 6,799
Total liabilities 36,238 28,836 12,095 77,169 37,628 30,298 15,324 83,250
Capitalization:
Payable to U.S. Treasury 1,926,959 230,514 778,817 2,936,290 1,953,498 207,529 793,928 2,954,955
Accumulated net revenues (deficit) (481,568) (18,997) (144,593) (645,158) (518,623) (47,424) (173,374) (739,421)
Total capitalization 1,445,391 211,517 634,224 2,291,132 1,434,875 160,105 620,554 2,215,534
Total liabilities and capitalization $1,481,629 $240,353 $646,319 $2,368,301 $1,472,503 $190,403 $635,878 $2,298,784

105
PICK-SLOAN MISSOURI RIVER BASIN PROGRAM WESTERN AND EASTERN DIVISIONS
Statements of Revenues and Expenses and Accumulated Net Revenues1
For the years ended Sept. 30, 2014 and 2013 (in thousands)
FY 2014 FY 2013
Western Reclamation Corps Total Western Reclamation Corps Total
Operating revenues:
Sales of electric power $494,371 $0 $0 $494,371 $455,127 $0 $0 $455,127
Transmission and other operating revenues 131,200 1,233 162 132,595 121,570 1,085 194 122,849
Gross operating revenues 625,571 1,233 162 626,966 576,697 1,085 194 577,976
Income transfers, net (160,839) 74,979 85,859 (1) (205,526) 147,481 58,045 0
Total operating revenues 464,732 76,212 86,021 626,965 371,171 148,566 58,239 577,976
Operating expenses:
Operation and maintenance 103,084 35,685 39,517 178,286 97,371 38,811 38,684 174,866
Purchased power 166,255 0 0 166,255 124,303 0 0 124,303
Purchased transmission services 14,811 0 0 14,811 13,737 0 0 13,737
Depreciation 44,679 3,506 11,404 59,589 46,001 22,263 11,023 79,287
Administration and general 23,100 0 0 23,100 21,967 0 0 21,967
Total operating expenses 351,929 39,191 50,921 442,041 303,379 61,074 49,707 414,160
Net operating revenues (deficit) 112,803 37,021 35,100 184,924 67,792 87,492 8,532 163,816
Interest expenses:
Interest on payable to U.S. Treasury 87,342 10,537 22,260 120,139 85,885 9,412 23,139 118,436
Allowance for funds used during construction (2,938) (655) (2,065) (5,658) (3,537) (1,175) (1,831) (6,543)
Net interest on payable to U.S. Treasury 84,404 9,882 20,195 114,481 82,348 8,237 21,308 111,893
Interest on long-term liabilities 104 2,078 0 2,182 237 2,120 0 2,357
Net interest expenses 84,508 11,960 20,195 116,663 82,585 10,357 21,308 114,250
Net revenues (deficit) 28,295 25,061 14,905 68,261 (14,793) 77,135 (12,776) 49,566
Accumulated net revenues (deficit):
Balance, beginning of year (518,623) (47,424) (173,374) (739,421) (514,048) (53,788) (159,957) (727,793)
Irrigation assistance 0 0 0 0 0 (69,911) 0 (69,911)
Change in capitalization 8,760 3,366 13,876 26,002 10,218 (860) (641) 8,717
Balance, end of year ($481,568) ($18,997) ($144,593) ($645,158) ($518,623) ($47,424) ($173,374) ($739,421)1 Loveland Area Projects consist of the Fryingpan-Arkansas and the Pick-Sloan Missouri River Basin Program—Western Division projects. The statements of revenues and expenses and accumulated net revenues (financial statements) for Loveland Area Projects only include the Fryingpan-Arkansas project, and the Western
Division is combined with the Pick-Sloan Missouri River Basin Program–Eastern Division. To reconcile the sales and purchased power/transmission cost tables and financial statements for these projects, the Fryingpan-Arkansas project and the Eastern and Western divisions need to be added together.

106
SALT LAKE CITY AREA/INTEGRATED PROJECTS
Power generated at the Colorado River Storage Project plants and from the Col-lbran and Rio Grande projects was combined into the Salt Lake City Area/Inte-grated Projects on Oct . 1, 1987, and is marketed under the Post-2004 General Power Marketing and Allocation Criteria .
Generation from the Colorado River Storage Project and its participating projects (Dolores and Seedskadee), and from the Collbran and Rio Grande projects, are mar-keted as the Salt Lake City Area/Integrated Projects . SLCA/IP’s Fiscal Year 2014 net genera-tion was 4 .2 billion kilowatt-hours, or about 23 percent less-than-average net generation . Average net generation for the integrated projects since 1989 is about 5 .5 billion kWh .
SLCA/IP power marketed by Western increased 4 percent from 5 .7 billion kWh in FY 2013 to 5 .9 billion kWh in FY 2014 . This year, power revenues increased by 7 percent from $163 million in FY 2013 to $174 million in FY 2014 . To supplement firm contractual require-ments and other obligations, Western purchased 2 .8 million million megawatt-hours in FY 2013 and 2 .9 MWh in FY 2014 .
CollbranThe Collbran Project, located in west-central Colorado about 35 miles northeast of
Grand Junction near the town of Collbran, was authorized by Congress on July 3, 1952 . Con-struction of the project started in 1957 and was essentially completed in 1962 .
Collbran developed a major part of the unused water of Plateau Creek and its principal tributaries for irrigation, flood control, recreational and fish and wildlife benefits . It includes several small diversion dams, 34 miles of canals, 19 miles of pipeline and two powerplants (Upper and Lower Molina) with a combined capacity of 14 megawatts . Net generation in FY 2014 was 44 million kilowatt-hours . The five-year average generation is 37 million kWh .
Rio GrandeThe Rio Grande Project was authorized by the Rio Grande Reclamation Project Act of
Feb . 25, 1905 . The project is located on the Rio Grande River in south-central New Mexico . Elephant Butte Dam, 125 miles north of El Paso, Texas, was completed in 1916 . Caballo Dam, a flood control and re-regulating reservoir, located 13 miles downstream, was added to the project in 1938 .
Elephant Butte Powerplant and the 115-kilovolt transmission system were added in 1940 and 1952, respectively . The transmission system was sold to the Plains Electric Generation and Transmission Cooperative in 1979 . Hot Springs Substation was sold to Truth or Consequences, New Mexico, in 1984 . The three-unit powerplant has an operating capacity of 28 megawatts .
Elephant Butte Powerplant produced net generation of 13 million kilowatt-hours in Fiscal Year 2014 . The five-year average is 30 million kWh .
Colorado River StorageThe Colorado River Storage Project was authorized by the Colorado River Storage
Project Act of April 11, 1956 . It consists of four major storage units: Glen Canyon, on the Colorado River in Arizona near the Utah border; Flaming Gorge on the Green River in Utah near the Wyoming border; Navajo, on the San Juan River in northwestern New Mexico near the Colorado border; and the Wayne N . Aspinall unit (formerly Curecanti), on the Gunnison River in west-central Colorado .
CRSP has a combined storage capacity that exceeds 31 .9 million acre-feet . The project provides water-use developments in the upper Colorado River Basin while still maintaining water deliveries to the lower Colorado River as required by the Colorado River Compact . Five federal powerplants are associated with the project . Operating capacity of CRSP’s 16 generating units is 1,727,350 kilowatts . With an average 5 .2 billion kilowatt-hours of net generation for the past five years, CRSP provides for the electrical needs of more than 1 million people spread across Colorado, Utah, New Mexico and Arizona . Portions of south-ern California, Nevada and Wyoming are also served by CRSP power . More than 3,738 circuit kilometers of high-voltage transmission lines are strung throughout these states to deliver power to customers .
Inflow at Lake Powell was 47 percent of average in Fiscal Year 2013 . Reclamation’s releases from Lake Powell were 8 .15 million acre-feet . CRSP hydrogeneration produced 4 million megawatt-hours in FY 2014 .

107
Seedskadee The Seedskadee Project is located in southwestern Wyoming in the Upper Green River
Basin, which is part of the Upper Colorado River Basin . Seedskadee was authorized for construction as a participating project of the Colorado River Storage Project by the Colorado River Storage Project Act of April 11, 1956 .
The project’s Fontenelle Dam and Reservoir were completed in April 1964 . Power facili-ties associated with the dam were completed in January 1966 . These included a powerplant and switchyard at Fontenelle Dam and necessary transmission lines to interconnect with the CRSP transmission system at Flaming Gorge Powerplant . The powerplant has since been uprated to 10 megawatts . Fontenelle Powerplant came online in 1968 .
The authorizing legislation required that power’s share of the project’s allocated costs be repaid from power revenues from Fontenelle Powerplant .
Net generation in Fiscal Year 2014 was 59 million kilowatt-hours . The five-year average generation is 48 million kWh .
DoloresThe Dolores Project, located in Montezuma and Dolores counties in southwestern
Colorado was authorized for construction as a participating project of the Colorado River Storage Project by Public Law 90-537, on Sept . 30, 1968; and Public Law 98-569, on Oct . 30, 1984 . Construction of the project began in 1977 . This multipurpose project provides 12 .8 megawatts of installed power generating capacity along with municipal and industrial water, irrigation water, and recreation and fish and wildlife enhancement . Primary storage is provided by McPhee Dam and Reservoir on the Dolores River .
Powerplants are located on McPhee Dam and Towaoc Canal to generate power for the CRSP power system . McPhee Dam Powerplant operates year-round on fishery releases from McPhee Reservoir, while the Towaoc Canal Powerplant operates from April to October on irrigation water supply conveyed through the canal . The powerplants at McPhee Dam, which was completed in 1992, and at Towaoc Canal, which was completed in 1993, produce 1,283 kilowatts and 11,495 kW, respectively, for use in the CRSP power system . Net generation in Fiscal Year 2014 was 21 million kilowatt-hours . The five-year average generation is 19 million kWh .
Similar to the Seedskadee Project, the authorizing legislation requires that power’s share of the project’s allocated costs be repaid from power revenues from the two Dolores powerplants .

108
SALT LAKE CITY AREA/INTEGRATED PROJECTS
Facilities, SubstationsFacility FY 2014 FY 2013SubstationsNumber of substations 36 36Number of transformers 32 32Transformer capacity (kVA) 6,224,250 6,224,250Land (fee)Acres 748.22 748.22Hectares 302.92 302.92Land (easement)Acres 50.15 50.15Hectares 20.30 20.30Land (withdrawal)Acres 128.26 128.26Hectares 51.93 51.93
Facilities, Substations, continuedFacility FY 2014 FY 2013
Buildings and communications sites
Number of buildings 72 72
Number of communications sites 68 68
Land (fee)
Acres 45.65 41.15
Hectares 18.48 16.66
Land (easement)
Acres 0.74 0.74
Hectares 0.30 0.30
Transmission LinesVoltage rating
Arizona Colorado New Mexico Utah Wyoming TotalFY 2014 FY 2013 FY 2014 FY 2013 FY 2014 FY 2013 FY 2014 FY 2013 FY 2014 FY 2013 FY 2014 FY 2013
345-kVCircuit miles 476.99 476.99 315.75 315.75 22.14 22.14 16.98 16.98 36.40 36.40 868.26 868.26 Circuit kilometers 767.48 767.48 508.04 508.04 35.62 35.62 27.32 27.32 58.57 58.57 1,397.03 1,397.03 Acres 8,563.08 8,563.08 7,300.27 7,300.27 579.39 579.39 308.17 308.17 773.72 773.72 17,524.63 17,524.63 Hectares 3,466.84 3,466.84 2,955.58 2,955.58 234.57 234.57 124.77 124.77 313.25 313.25 7,095.01 7,095.01 230-kVCircuit miles 198.83 198.83 637.17 637.35 58.17 58.17 0.00 0.00 91.98 93.10 986.15 987.45 Circuit kilometers 319.92 319.92 1,025.21 1,025.50 93.60 93.60 0.00 0.00 148.00 149.80 1,586.73 1,588.82 Acres 2,467.08 2,467.08 7,813.98 7,813.98 1,092.01 1,092.01 0.00 0.00 1,372.07 1,372.07 12,745.14 12,745.14 Hectares 998.82 998.82 3,163.56 3,163.56 442.11 442.11 0.00 0.00 555.50 555.50 5,159.99 5,159.99 138-kVCircuit miles 0.00 0.00 188.03 188.03 0.00 0.00 118.66 118.66 0.00 0.00 306.69 306.69 Circuit kilometers 0.00 0.00 302.54 302.54 0.00 0.00 190.92 190.92 0.00 0.00 493.46 493.46 Acres 0.00 0.00 1,455.03 1,455.03 0.00 0.00 1,065.64 1,065.64 0.00 0.00 2,520.67 2,520.67 Hectares 0.00 0.00 589.08 589.08 0.00 0.00 431.43 431.43 0.00 0.00 1,020.51 1,020.51 115-kVCircuit miles 0.00 0.00 135.47 135.38 0.00 0.00 0.00 0.00 0.00 0.00 135.47 135.38 Circuit kilometers 0.00 0.00 217.97 217.83 0.00 0.00 0.00 0.00 0.00 0.00 217.97 217.83 Acres 0.00 0.00 1,186.59 1,186.07 0.00 0.00 0.00 0.00 0.00 0.00 1,186.59 1,186.07 Hectares 0.00 0.00 480.40 480.19 0.00 0.00 0.00 0.00 0.00 0.00 480.40 480.19 69-kV and belowCircuit miles 5.45 5.45 17.34 17.34 3.63 3.63 0.32 0.32 0.00 0.00 26.74 26.74 Circuit kilometers 8.77 8.77 27.90 27.90 5.84 5.84 0.51 0.51 0.00 0.00 43.02 43.02 Acres 34.06 34.06 296.19 296.19 12.44 12.44 37.69 37.69 0.00 0.00 380.38 380.38 Hectares 13.79 13.79 119.92 119.92 5.04 5.04 15.26 15.26 0.00 0.00 154.01 154.01 TotalCircuit miles 681.27 681.27 1,293.76 1,293.85 83.94 83.94 135.96 135.96 128.38 129.50 2,323.31 2,324.52 Circuit kilometers 1,096.17 1,096.17 2,081.66 2,081.81 135.06 135.06 218.75 218.75 206.57 208.37 3,738.21 3,740.16 Acres 11,064.22 11,064.22 18,052.06 18,051.54 1,683.84 1,683.84 1,411.50 1,411.50 2,145.79 2,145.79 34,357.41 34,356.89 Hectares 4,479.45 4,479.45 7,308.54 7,308.33 681.72 681.72 571.46 571.46 868.75 868.75 13,909.92 13,909.71

109
SALT LAKE CITY AREA/INTEGRATED PROJECTS
Storage
Generation
0
200
400
600
800
1000
2014 generation Average generation
SepAugJulJunMayAprMarFebJanDecNovOct
Gene
ratio
n in
mill
ion
kWh
5
10
15
20
25
30
352014 storage Average storage
SepAugJulJunMayAprMarFebJanDecNovOct
Stor
age
in m
illio
n ac
re-fe
et
Active Rate ActionsRate order
number Project Type of rate action Date of notice of public participation Rate schedule designation
Effective date of rate (first day of first full
billing period)
Annual incremental ($ in thousands) Notes Date submitted
to FERCDate of FERC confirmation
WAPA-161 Salt Lake City Area/Integrated Projects Firm power
Extension 9/8/2008 SLIP-F9 10/1/2008 21,283 N/A 9/4/2008 8/4/2009
WAPA-161 Colorado River Storage Project Transmission
Extension 9/8/2008 SP-PTP7, SP-NW3, SP-NFT6
10/1/2008 N/A N/A 9/4/2008 8/4/2009
WAPA-161 Colorado River Storage Project Ancillary services
Extension 9/8/2008 SP-SD3, SP-RS3, SP-EI3, SP-FR3, SP-SSR3
10/1/2008 N/A N/A 9/4/2008 8/4/2009
WAPA-163 Loveland Area Projects, Colorado River Storage Project, Pacific Northwest-Pacific Southwest Intertie, Central Arizona Project and Parker-Davis
New formula rates for use under WestConnect's Point-to-Point Regional Transmission Service Participation Agreement
11/6/2013 WC-8 6/1/2014 N/A N/A 12/4/2014 Pending
Active Marketing Plan Project Expiration date
Salt Lake City Area/Integrated Projects 9/30/2024
Active Firm Power Rate ProvisionsFiscal year Rate schedule
designationCapacity charge
($/kW of billing demand)Energy charge not in excess
of delivery obligations Effective date Annual composite rate
2014 SLIP-F9 5.18 12.19 mills/kWh 10/1/2009 29.62 mills/kWh
Active Transmission and Ancillary Services Rate ProvisionsFiscal year Rate schedule designation Rate
2014 SP-PTP7, Firm point-to-point transmission service $1.11 per kW/month
2014 SP-NW3, Network integration transmission Network customer's load ratio share times 1/12 total test year net annual revenue requirement.
2014 SP-NFT6, Nonfirm point-to-point transmission service Mutually agreed by Western and purchasing entity up to 1.51 mills/kWh.
2014 SP-SD3, Scheduling system control and dispatch Included in transmission rate. RM and DSW rate schedules apply for non-transmission, accordingly.
2014 SP-RS3, Reactive and voltage control services RM and DSW rate schedules apply, accordingly.
2014 SP-EI3, Energy imbalance RM and DSW rate schedules apply, accordingly.
2014 SP-FR3, Regulation and frequency response $5.18 per kW/month if available; or RM rate schedules apply accordingly.
2014 SP-SSR3, Spinning and supplemental reserves Rate under the Western Systems Power Pool contract.

110
SALT LAKE CITY AREA/INTEGRATED PROJECTS
PowerplantsState/plant name Operating agency River Initial in-service date Existing number of units Installed capability 1
FY 2014 (MW)Actual operating capability (MW)2 Net generation (GWh)3
July 1, 2013 July 1, 2014 FY 2013 FY 2014
Arizona
Glen Canyon Reclamation Colorado Sep 1964 8 1,320 661 674 3,507 3,110
Colorado
Blue Mesa Reclamation Gunnison Sep 1967 2 86 73 77 134 198
Crystal Reclamation Gunnison Sep 1978 1 32 27 31 102 123
Lower Molina Reclamation Pipeline Dec 1962 1 5 4 5 3 17
McPhee Reclamation Dolores Jun 1993 1 1 0 1 1 3
Morrow Point Reclamation Gunnison Dec 1970 2 162 136 143 194 268
Towaoc Reclamation Canal Jun 1993 1 11 4 9 9 18
Upper Molina Reclamation Pipeline Dec 1962 1 9 7 8 11 27
New Mexico
Elephant Butte Reclamation Rio Grande Nov 1940 3 28 5 8 9 13
Utah
Flaming Gorge Reclamation Green Nov 1963 3 152 54 78 307 362
Wyoming
Fontenelle Reclamation Green May 1968 1 10 5 13 35 59
Salt Lake City Area/Integrated Projects total 24 1,816 976 1,047 4,312 4,198 1 Maximum operating capability is the maximum generating capability of the units' at-unity power factor without exceeding the specified heat rise on each unit and independent of water constraints.2 Actual operating capability represents the operating capability on July 1, but may not represent the coincident or non-coincident peak operating capability for the powerplant, project or Western as a whole.3 Net generation is gross plant generation less plant use. These amounts have not been reduced by other priorities such as project pumping energy.Operating agencies:Reclamation - Bureau of Reclamation, Department of the Interior
Power Sales by Customer CategoryCustomer category
FY 20141 FY 20132
Long-term (MWh) Pass-through (MWh) Other (MWh) Total energy (MWh) Long-term ($) Pass-through ($) Other ($) Total revenue ($) Energy (MWh) Revenue ($)
Municipalities 1,381,701 477,120 454,631 2,313,452 41,057,991 17,179,442 19,590,654 77,828,087 2,905,548 89,345,524
Cooperatives 2,599,312 158,076 76,248 2,833,636 73,318,579 3,423,664 2,630,762 79,373,005 2,260,186 64,207,981
Federal agencies 149,449 55,181 1,359 205,989 4,704,094 2,042,793 16,937 6,763,824 149,839 4,350,620
State agencies 436,199 14,849 35,503 486,551 12,686,856 542,504 820,985 14,050,345 452,967 13,152,342
Irrigation districts 126,542 167,182 6,235 299,959 4,042,203 6,016,318 690,512 10,749,033 224,751 6,878,006
Native American tribes 514,253 101,384 1,561 617,198 12,457,590 3,587,534 19,028 16,064,152 745,406 20,418,600
Investor-owned utilities 0 0 43,034 43,034 0 0 1,077,195 1,077,195 12,303 337,073
Power marketers 0 0 19,734 19,734 0 0 437,816 437,816 45,549 1,399,281
Interproject 0 0 5,584 5,584 0 0 232,703 232,703 3,731 174,130
Project use 18,701 0 33 18,734 477,917 0 715 478,632 95,653 2,464,672
Salt Lake City Area/Integrated Projects total 5,226,157 973,792 643,922 6,843,871 148,745,230 32,792,255 25,517,307 207,054,792 6,895,933 202,728,229 1 Power revenues as presented in this table are $36.7 million greater than the FY 2014 sales of electric power presented in the statements of revenues and expenses and accumulated net revenues (financial statements) due to the following: $37.0 million in net Western Replacement Power sales of which $32.4 million are
classified as other activities in Western's annual report, and the remaining $4.6 million are are classified as hydroelectric activities in Western's annual report; -$0.3 million in variances between revenue accrual estimates and actual revenue along with other miscellaneous corrections and transactions.2 Power revenues as presented in this table are $33.6 million greater than the FY 2013 sales of electric power presented in the statements of revenues and expenses and accumulated net revenues (financial statements) due to the following: $37.0 million in net Western Replacement Power sales of which $32.6 million are
classified as other activities in Western's annual report, and the remaining $4.4 million are classified as hydroelectric activities in Western's annual report; -$3.4 million in variances between revenue accrual estimates and actual revenue along with other miscellaneous transactions.

111
SALT LAKE CITY AREA/INTEGRATED PROJECTS
Power Sales by State and Customer CategoryState/customer category
FY 20141 FY 20132
Long-term (MWh) Pass-through (MWh) Other (MWh) Total energy (MWh) Long-term ($) Pass-through ($) Other ($) Total revenue ($) Energy (MWh) Revenue ($) ArizonaMunicipalities 51,574 118,040 73,746 243,360 2,200,237 4,212,347 2,666,706 9,079,290 245,894 7,642,696 Cooperatives 50,359 0 6,182 56,541 1,486,191 0 132,813 1,619,004 51,582 1,523,132 Federal agencies 17,782 52,496 1,359 71,637 955,568 1,928,006 16,937 2,900,511 9,663 306,446 State agencies 329,142 0 35,503 364,645 9,604,812 0 820,985 10,425,797 329,552 9,480,409 Irrigation districts 126,542 167,182 6,235 299,959 4,042,203 6,016,318 76,012 10,134,533 224,751 6,878,006 Native American tribes 405,727 101,384 1,561 508,672 9,536,950 3,587,534 19,028 13,143,512 722,777 19,796,253 Investor-owned utilities 0 0 2,198 2,198 0 0 70,094 70,094 427 11,618 Interproject 0 0 794 794 0 0 23,334 23,334 0 0 Project use 0 0 0 0 0 0 0 0 0 Arizona subtotal 981,126 439,102 127,578 1,547,806 27,825,961 15,744,205 3,825,909 47,396,075 1,584,646 45,638,560 CaliforniaMunicipalities 0 0 0 0 0 0 0 0 46 1,340 California subtotal 0 0 0 0 0 0 0 0 46 1,340 ColoradoMunicipalities 242,834 7,299 20,309 270,442 6,529,871 123,254 541,877 7,195,002 796,003 21,087,486 Cooperatives 2,079,530 107,981 68,365 2,255,876 58,085,619 1,514,309 2,426,120 62,026,048 1,679,028 46,881,628 Federal agencies 5,746 0 0 5,746 225,755 0 0 225,755 133 2,965 State agencies 0 0 0 0 0 0 0 0 5,227 204,044 Native American tribes 6,574 0 0 6,574 175,999 0 0 175,999 6,525 175,999 Investor-owned utilities 0 0 4,916 4,916 0 0 112,893 112,893 277 12,953 Interproject 0 0 4,790 4,790 0 0 209,369 209,369 3,731 174,130 Project use 18,701 0 33 18,734 477,917 0 715 478,632 10,603 380,297 Colorado subtotal 2,353,385 115,280 98,413 2,567,078 65,495,161 1,637,563 3,290,974 70,423,698 2,501,527 68,919,502 MarylandPower marketers 0 0 0 0 0 0 0 0 3,199 85,974 Maryland subtotal 0 0 0 0 0 0 0 0 3,199 85,974 NebraskaMunicipalities 0 0 1,166 1,166 0 0 24,287 24,287 0 0 Power marketers 0 0 0 0 0 0 0 0 1 80 Nebraska subtotal 0 0 1,166 1,166 0 0 24,287 24,287 1 80 NevadaState agencies 88,212 14,849 0 103,061 2,575,376 542,496 0 3,117,872 100,643 2,998,823 Native American tribes 637 0 0 637 18,424 0 0 18,424 0 0 Investor-owned utilities 0 0 455 455 0 0 8,940 8,940 842 17,864 Power marketers 0 0 1,878 1,878 0 0 63,504 63,504 744 23,014 Nevada subtotal 88,849 14,849 2,333 106,031 2,593,800 542,496 72,444 3,208,740 102,229 3,039,701 New MexicoMunicipalities 185,223 2,178 350,201 537,602 5,673,721 75,959 15,820,768 21,570,448 507,877 18,695,193 Cooperatives 51,881 0 0 51,881 1,236,904 30 0 1,236,934 51,943 1,236,846 Federal agencies 97,246 0 0 97,246 2,708,543 3 0 2,708,546 108,564 3,104,090 Native American tribes 96,839 0 0 96,839 2,606,906 0 0 2,606,906 11,901 332,478 Investor-owned utilities 0 0 14,895 14,895 0 0 397,790 397,790 8,204 240,279

112
SALT LAKE CITY AREA/INTEGRATED PROJECTS
Power Sales by State and Customer Category, continuedState/customer category
FY 20141 FY 20132
Long-term (MWh) Pass-through (MWh) Other (MWh) Total energy (MWh) Long-term ($) Pass-through ($) Other ($) Total revenue ($) Energy (MWh) Revenue ($) Power marketers 0 0 0 0 0 0 0 0 9,215 193,459 Project use 0 0 0 0 0 0 0 0 82,540 2,028,378 New Mexico subtotal 431,189 2,178 365,096 798,463 12,226,074 75,992 16,218,558 28,520,624 780,244 25,830,723 New YorkPower marketers 0 0 17,726 17,726 0 0 371,957 371,957 28,425 990,026 New York subtotal 0 0 17,726 17,726 0 0 371,957 371,957 28,425 990,026 North DakotaCooperatives 0 0 1,701 1,701 0 0 71,829 71,829 0 0 North Dakota subtotal 0 0 1,701 1,701 0 0 71,829 71,829 0 0 OregonInvestor-owned utilities 0 0 270 270 0 0 7,646 7,646 331 11,170 Oregon subtotal 0 0 270 270 0 0 7,646 7,646 331 11,170 South DakotaInvestor-owned utilities 0 0 20,300 20,300 0 0 479,832 479,832 2,222 43,189 South Dakota subtotal 0 0 20,300 20,300 0 0 479,832 479,832 2,222 43,189 TexasPower marketers 0 0 0 0 0 0 0 0 3,965 106,728 Texas subtotal 0 0 0 0 0 0 0 0 3,965 106,728 UtahMunicipalities 897,166 348,988 9,069 1,255,223 26,507,479 12,757,863 531,135 39,796,477 1,349,834 41,755,786 Cooperatives 417,384 50,095 0 467,479 12,505,462 1,909,325 0 14,414,787 477,471 14,561,972 Federal agencies 28,675 2,685 0 31,360 814,228 114,784 0 929,012 31,479 937,119 State agencies 18,845 0 0 18,845 506,668 8 0 506,676 17,545 469,066 Irrigation districts 0 0 0 0 0 0 614,500 614,500 Native American tribes 2,526 0 0 2,526 67,018 0 0 67,018 2,262 61,577 Project use 0 0 0 0 0 0 0 0 2,510 55,997 Utah subtotal 1,364,596 401,768 9,069 1,775,433 40,400,855 14,781,980 1,145,635 56,328,470 1,881,101 57,841,517 WyomingMunicipalities 4,904 615 140 5,659 146,683 10,019 5,881 162,583 5,894 163,023 Cooperatives 158 0 0 158 4,403 0 0 4,403 162 4,403 Native American tribes 1,950 0 0 1,950 52,293 0 0 52,293 1,941 52,293 Wyoming subtotal 7,012 615 140 7,767 203,379 10,019 5,881 219,279 7,997 219,719 INTERNATIONALCanadaPower marketers 0 0 130 130 0 0 2,355 2,355 0 0 Canada subtotal 0 0 130 130 0 0 2,355 2,355 0 0 Salt Lake City Area/Integrated Projects total 5,226,157 973,792 643,922 6,843,871 148,745,230 32,792,255 25,517,307 207,054,792 6,895,933 202,728,229 1 Power revenues as presented in this table are $36.7 million greater than the FY 2014 sales of electric power presented in the statements of revenues and expenses and accumulated net revenues (financial statements) due to the following: $37.0 million in net Western Replacement Power sales of which $32.4 million are
classified as other activities in Western's annual report, and the remaining $4.6 million are are classified as hydroelectric activities in Western's annual report; -$0.3 million in variances between revenue accrual estimates and actual revenue along with other miscellaneous corrections and transactions.2 Power revenues as presented in this table are $33.6 million greater than the FY 2013 sales of electric power presented in the statements of revenues and expenses and accumulated net revenues (financial statements) due to the following: $37.0 million in net Western Replacement Power sales of which $32.6 million are
classified as other activities in Western's annual report, and the remaining $4.4 million are classified as hydroelectric activities in Western's annual report; -$3.4 million in variances between revenue accrual estimates and actual revenue along with other miscellaneous transactions.

113
SALT LAKE CITY AREA/INTEGRATED PROJECTS
Customers by State and Customer CategoryState/customer category
FY 2014 FY 2013
Long-term Other Total Long-term Other TotalArizonaMunicipalities 5 0 5 6 0 6Cooperatives 2 2 4 4 1 5Federal agencies 4 0 4 2 0 2State agencies 1 0 1 1 0 1Irrigation districts 12 0 12 12 0 12Native American tribes 22 0 22 23 0 23Investor-owned utilities 0 2 2 0 1 1Arizona subtotal 46 4 50 48 2 50CaliforniaMunicipalities 0 0 0 0 1 1California subtotal 0 0 0 0 1 1ColoradoMunicipalities 15 0 15 15 0 15Cooperatives 7 0 7 7 0 7Federal agencies 1 0 1 1 0 1State agencies 0 0 0 1 0 1Native American tribes 2 0 2 2 0 2Investor-owned utilities 0 1 1 1 0 1Colorado subtotal 25 1 26 27 0 27IdahoIrrigation districts 1 0 1 0 0 0Idaho subtotal 1 0 1 0 0 0MarylandPower marketers 0 0 0 0 1 1Maryland subtotal 0 0 0 0 1 1MinnesotaPower marketers 0 0 0 0 0 0Minnesota subtotal 0 0 0 0 0 0NebraskaMunicipalities 0 1 1 0 0 0Power marketers 0 0 0 1 0 1Nebraska subtotal 0 1 1 1 0 1NevadaState agencies 1 0 1 1 0 1Native American tribes 2 0 2 0 0 0Investor-owned utilities 0 1 1 1 1 2Power marketers 0 1 1 1 0 1Nevada subtotal 3 2 5 3 1 4New MexicoMunicipalities 5 0 5 5 0 5Cooperatives 4 0 4 4 0 4Federal agencies 4 0 4 4 0 4
Customers by State and Customer Category, continuedState/customer category
FY 2014 FY 2013
Long-term Other Total Long-term Other TotalNative American tribes 24 0 24 23 0 23Investor-owned utilities 0 1 1 1 0 1Power marketers 0 0 0 0 1 1New Mexico subtotal 37 1 38 37 1 38New YorkPower marketers 0 1 1 1 0 1New York subtotal 0 1 1 1 0 1North DakotaCooperatives 0 1 1 0 0 0North Dakota subtotal 0 1 1 0 0 0OregonInvestor-owned utilities 0 1 1 1 0 1Oregon subtotal 0 1 1 1 0 1South DakotaInvestor-owned utilities 0 1 1 1 0 1South Dakota subtotal 0 1 1 1 0 1TexasPower marketers 0 0 0 0 1 1Texas subtotal 0 0 0 0 1 1UtahMunicipalities 9 0 9 8 0 8Cooperatives 1 0 1 1 0 1Federal agencies 3 0 3 3 0 3State agencies 3 0 3 2 0 2Irrigation districts 0 1 1 0 0 0Native American tribes 3 0 3 1 0 1Utah subtotal 19 1 20 15 0 15WyomingMunicipalities 2 0 2 1 0 1Cooperatives 1 0 1 1 0 1Native American tribes 1 0 1 1 0 1Wyoming subtotal 4 0 4 3 0 3INTERNATIONALCanadaPower marketers 0 1 1 0 0 0Canada subtotal 0 1 1 0 0 0Salt Lake City Area/Integrated Projects subtotal 135 15 150 137 7 144
Interproject 0 3 3 2 0 2Project use 2 0 2 6 0 6Salt Lake City Area/Integrated Projects total 137 18 155 145 7 152

114
SALT LAKE CITY AREA/INTEGRATED PROJECTS
Summary by Customer CategoryCustomer category
FY 2014 FY 2013
Long-term Other Total Long-term Other Total
Municipalities 36 1 37 35 1 36
Cooperatives 15 3 18 17 1 18
Federal agencies 12 0 12 10 0 10
State agencies 5 0 5 5 0 5
Irrigation districts 13 1 14 12 0 12
Native American tribes 54 0 54 50 0 50
Investor-owned utilities 0 7 7 5 2 7
Power marketers 0 3 3 3 3 6
Salt Lake City Area/Integrated Projects subtotal 135 15 150 137 7 144
Interproject 0 3 3 2 0 2
Project use 2 0 2 6 0 6
Salt Lake City Area/Integrated Projects total 137 18 155 145 7 152

115
SALT LAKE CITY AREA/INTEGRATED PROJECTS
Top 5 Customers in Long-term Revenue1
Rank Customer Revenue ($) Percent of total sales
1 Tri-State Generation and Transmission Association 43,417,759 29.2
2 Deseret Generation and Transmission 12,529,326 8.4
3 Platte River Power Authority 12,364,497 8.3
4 Utah Associated Municipal Power 11,734,856 7.9
5 Salt River Project 9,604,812 6.5
Total 89,651,250 60.31 Excludes energy sales and power revenues from interdepartmental, interproject and project-use customers.
Top 5 Customers in Long-term Energy Sales1
Rank Customer Energy (MWh) Percent of total sales
1 Tri-State Generation and Transmission Association 1,531,077 29.3
2 Platte River Power Authority 455,833 8.7
3 Deseret Generation and Transmission 418,210 8.0
4 Utah Associated Municipal Power 387,309 7.4
5 Salt River Project 329,142 6.3
Total 3,121,571 59.71 Excludes energy sales and power revenues from interdepartmental, interproject and project-use customers.
Top 5 Customers in Other Revenue1
Rank Customer Revenue ($) Percent of total sales
1 Farmington 10,965,642 43.9
2 Los Alamos County 4,855,126 19.4
3 Page 2,628,169 10.5
3 Tri-State Generation and Transmission Association 1,356,193 5.4
4 Platte River Power Authority 848,326 3.4
Total 20,653,456 82.61 Excludes energy sales and power revenues from interdepartmental, interproject and project-use customers.
Top 5 Customers in Other Energy Sales1
Rank Customer Energy (MWh) Percent of total sales
1 Farmington 243,325 38.8
2 Los Alamos County 106,876 17.0
3 Page 70,585 11.2
4 Tri-State Generation and Transmission Association 35,503 5.7
5 Salt River Project 41,261 6.6
Total 497,550 79.31 Excludes energy sales and power revenues from interdepartmental, interproject and project-use customers.
Purchased PowerSupplier
FY 2014 FY 2013
Energy (MWh) Cost ($ in thousands) Energy (MWh) Cost ($ in thousands)
NonWestern suppliers
Arizona Electric Power Cooperative 74,618 3,358 3,600 161
Arizona Public Service Company 47,993 2,118 5,684 253
Basin Electric Power Coop. 0 0 4,827 114
Basin West 113,149 3,087 162,530 3,787
Black Hills Power and Light 81,855 5,440 81,454 3,025
Citi Group Energy 0 0 36,558 1,126
Constellation Power Source 0 0 3,555 95
Morgan Stanley 270,934 10,413 306,324 10,112
Municipal Energy Agency of Nebraska 5,465 244 1,880 39
Nevada Power Company 777 94 0 0
PacifiCorp 267,397 10,134 393,052 12,233
Platte River Power Authority 76,697 2,533 31,598 658
PPL Energy Plus 0 0 132,229 3,675
Public Service Company of Colorado 210,791 7,823 85,721 3,436
Public Service Company of New Mexico 63,550 2,803 42,197 1,605
Salt River Project 516,156 22,074 211,380 8,029
Silver State 0 0 304,530 10,340
Tenaska Power 240 6 0 0
Trans Alta 0 0 22,524 569
Tri-State Generation and Transmission Association 132,459 5,063 38,802 1,415
Tucson Electric Power Company 0 0 12,761 493
Utah Municipal Power Agency 540 19 0 0
NonWestern suppliers subtotal 1,862,621 75,209 1,881,206 61,165
Western suppliers
Loveland Area Projects1 127,672 3,402 21,133 720
Western Area Colorado Missouri Balancing Authority 31,807 873 57,712 1,548
Western suppliers subtotal 159,479 4,275 78,845 2,268
Purchased power total2 2,022,100 79,484 1,960,051 63,4331 Includes purchases made under Interagency Agreement No. 99-SLC-0392; however, does not include purchases made for Western Replacement Power.2 Purchased power costs as presented in this table are $0.7 million greater and $2.9 million less, respectively, than the FY 2014 and FY 2013 purchased
power reported in the Colorado River Storage Project statements of revenues and expenses and accumulated net revenues. Differences of $0.7 million and $2.5 million are, respectively, due to variances between purchased power accrual estimates and actual purchased power, and $0.4 million in Glen Canyon environmental experiments for FY 2013.

116
SALT LAKE CITY AREA/INTEGRATED PROJECTS
Purchased TransmissionSupplier
FY 20141 FY 20131
Cost ($ in thousands) Cost ($ in thousands)
NonWestern suppliers
Black Hills Colorado Electric 0 1
Bridger Valley Electric 26 2
Delta-Montrose Electric Association 7 8
Deseret Generation and Transmission Association 2,562 2,557
El Paso Electric Company 58 63
Empire Electric 103 100
PacifiCorp 2,828 2,858
Public Service Company of Colorado 95 261
Public Service Company of New Mexico 3,428 2,278
Salt River Project 3 5
Tri-State Generation and Transmission Association 1 0
NonWestern suppliers subtotal 9,111 8,133
Western suppliers
Pacific NW-SW Intertie 3,067 2,270
Western suppliers subtotal 3,067 2,270
Purchased transmission total 12,178 10,4031 Purchase transmission costs as presented in this table exceed the statements of revenues and expenses and accumulated net revenues for the Colorado River
Storage Project by about $6.3 million for FY 2014 and $1.3 million for FY 2013 due to variances between purchased transmission accrual estimates and actual purchased transmission.
Pass-through Purchased Power Western Replacement Power (WRP)Supplier
FY 2014 FY 2013
Energy (MWh) Cost ($ in thousands) Energy (MWh) Cost ($ in thousands)
NonWestern suppliers
Aggregated Energy Services 284 9 228 9
Arizona Electric Power Cooperative 40,720 2,153 9,525 391
Arizona Public Service Company 19,520 955 33,085 1,359
Basin Electric Power Cooperative 29,402 846 31,656 770
Basin West 0 0 75,672 1,835
Black Hills Power 92,274 3,238 77,424 3,412
Calpine Energy Services 0 0 600 20
CAP-Navajo 60 2 28 1
Cargill 25 1 0 0
Colorado River Agency 3,813 115 3,411 94
Colorado Springs Utilities 37,890 1,626 21,313 863
Constellation 0 0 2,045 124
Desert Southwest Regional office 3,265 85 2,461 50
El Paso Electric 0 0 45 1
Farmington, N.M. 210 6 585 12
Gila River (PGR & ENTERGA) 2,374 147 1,641 61
JP Morgan 0 0 320 12
Los Alamos County 0 0 50 1
Los Angeles Department of Water and Power 38 3 102 5
Morgan Stanley 11,610 364 34,115 1,608
Municipal Energy Agency of Nebraska 31,341 1,074 13,784 501
Nevada Power Company 9,609 501 15,415 632
PacifiCorp 38,129 1,416 22,536 771
Platte River Power Authority 60,216 1,524 47,127 2,045
PowerEx Corporation 2,645 215 2,453 123
PPL Energy Plus 0 0 31,916 885
Public Service Company of Colorado 87,815 3,564 19,060 904
Public Service Company of New Mexico 81,226 3,310 88,965 3,556
Resource Management Services 3,388 110 1,260 37
Rainbow Energy 0 0 920 79
Salt River Project 58,502 2,991 42,037 1,845
Silver State 9,285 283 24,924 955
St. George 0 0 13 0
Sunflower 0 0 700 23
Tenaska Power 430 17 10,164 469

117
SALT LAKE CITY AREA/INTEGRATED PROJECTS
Pass-through Purchased Power Western Replacement Power (WRP), continuedSupplier
FY 2014 FY 2013
Energy (MWh) Cost ($ in thousands) Energy (MWh) Cost ($ in thousands)
Trans Alta 0 0 25,807 989
Tri-State Generation and Transmission Association 56,671 1,783 18,959 620
Tucson Electric Power Company 10,007 425 3,147 106
Utah Associated Municipal Power Systems 276 9 147 4
Utah Municipal Power Agency 5,259 222 4,311 169
NonWestern suppliers subtotal 696,284 26,994 667,951 25,341
Western suppliers
Colorado River Storage Project 0 0 152,539 3,574
Loveland Area Projects 66,166 1,704 46,484 1,015
Western Area Colorado Missouri Balancing Authority 117,607 3,437 0 0
Western suppliers subtotal 183,773 5,141 199,023 4,589
Purchased Western Replacement Power total1 880,057 32,135 866,974 29,930
1 Western Replacement Power purchases are classified as 'other' in the combining power system statements of revenues and expenses and accumulated net revenues. The WRP purchases as presented in this table are $0.2 million and $2.7 million less than the purchase power reported in the Schedule 2 for FY 2014 and FY 2013, respectively, due to variances between purchased power accrual estimates and actual purchased power along with other miscellaneous minor transactions.
Transmission Services RevenuesTransmission service
FY 2014 FY 2013
Revenue ($) Revenue ($)
Wheeling and transmission service 0 0
Firm network transmission service 195,711 240,628
Firm point-to-point transmission service 11,437,485 11,832,094
Nonfirm point-to-point transmission service 4,073,429 4,137,447
Short term point-to-point transmission service 79,440 11,625
Transmission services total1 15,786,065 16,221,794 1 Transmission services revenues as presented in this table are $0.9 million and $0.1 million less than the FY 2014 and FY 2013 transmission and other
operating revenues, respectively, presented in the statements of revenues and expenses and accumulated net revenues due to variances between transmission revenue accrual estimates and actual transmission revenue along with other miscellaneous minor transactions.
Ancillary Services Revenues1
Ancillary service FY 2014 FY 2013
Revenue ($) Revenue ($)
Reactive supply and voltage control service 621,916 148,526
Scheduling and dispatch service 541,833 407,161
Operating reserves - spinning and supplemental 3,370,683 3,976,983
Regulation and frequency response 1,009,244 941,663
Energy imbalance service 338,732 199,447
Miscellaneous nonpower revenue - revolving fund 0 0
Ancillary services total2 5,882,408 5,673,780 1 Excludes $3.9 million and $7.7 million in other revenues for FY 2014 and FY 2013, respectively.2 Ancillary services revenues as presented in this table are $0.2 million less than the FY 2014 transmission and other operating revenues presented in the
statements of revenues and expenses and accumulated net revenues due to variances between ancillary services revenue accrual estimates and actual ancillary services revenue along with other minor miscellaneous corrections and transactions.

118
SALT LAKE CITY AREA/INTEGRATED PROJECTS
Power Sales and RevenuesCustomer
FY 20141 FY 20132
Energy (MWh) Revenue ($) Energy (MWh) Revenue ($)
MUNICIPALITIES
Arizona
Mesa 21,849 698,089 20,329 634,358
Municipal Energy Agency of Nebraska 0 0 20 790
Page 102,015 3,503,880 111,243 3,287,639
Safford 91,478 3,833,693 86,338 2,844,049
Thatcher 23,429 915,347 23,382 747,579
Yuma 4,589 128,281 4,582 128,281
Arizona subtotal 243,360 9,079,290 245,894 7,642,696
California
Needles 0 0 46 1,340
California subtotal 0 0 46 1,340
Colorado
Arkansas River Power Authority 8,519 236,032 10,537 293,518
Aspen 5,691 144,100 5,654 144,100
Center 5,246 141,937 5,126 142,001
Colorado Springs Utilities 172,011 4,500,925 144,032 4,128,286
Delta 6,210 162,702 6,124 162,706
Fleming 270 7,554 274 7,553
Fort Morgan 31,179 887,127 31,900 889,187
Frederick 175 4,363 214 6,107
Glenwood Springs 6,167 154,210 6,089 154,210
Gunnison 22,420 609,424 21,998 610,569
Haxtun 1,901 54,094 1,919 54,093
Holyoke 6,299 176,150 6,250 176,150
Oak Creek 1,430 39,313 1,396 39,313
Platte River Power Authority 0 0 551,729 14,202,622
Wray 2,924 77,071 2,761 77,071
Colorado subtotal 270,442 7,195,002 796,003 21,087,486
Nebraska
Municipal Energy Agency of Nebraska 1,166 24,287 0 0
Nebraska subtotal 1,166 24,287 0 0
New Mexico
Aztec 8,850 238,029 8,655 238,029
Farmington 369,145 14,862,529 346,766 12,850,286
Gallup 15,851 445,860 14,966 416,700
Los Alamos County 122,670 5,404,781 116,363 4,570,929
Truth Or Consequences 21,086 619,249 21,127 619,249
New Mexico subtotal 537,602 21,570,448 507,877 18,695,193
Power Sales and Revenues, continuedCustomer
FY 20141 FY 20132
Energy (MWh) Revenue ($) Energy (MWh) Revenue ($)
Utah
Brigham City 36,186 1,063,295 36,248 1,063,230
Heber Light and Power 48,310 1,191,562 46,558 1,135,942
Helper 1,498 40,696 1,500 40,694
Murray City 77,159 2,532,751 0 0
Price 5,897 165,441 5,955 167,572
Raton Public Service 5,179 141,614 3,111 84,824
St. George 127,093 4,062,735 127,287 3,912,443
Utah Associated Municipal Power3 635,396 20,932,472 743,008 23,426,093
Utah Municipal Power Agency 318,505 9,665,911 386,167 11,924,988
Utah subtotal 1,255,223 39,796,477 1,349,834 41,755,786
Wyoming
Torrington 5,659 162,583 5,894 163,023
Wyoming subtotal 5,659 162,583 5,894 163,023
Municipalities subtotal 2,313,452 77,828,087 2,905,548 89,345,524
COOPERATIVES
Arizona
Aggregated Energy Services 30 1,260 138 4,141
Arizona Electric Power Cooperative 31,442 869,051 25,686 749,651
Navopache Electric 24,727 736,540 24,776 736,540
Resource Management Services 342 12,153 674 24,084
Sulphur Springs Valley 0 0 308 8,716
Arizona subtotal 56,541 1,619,004 51,582 1,523,132
Colorado
Animas La Plata OM&R Association 8,209 174,627 437 8,379
Basin Electric Power Cooperative 0 0 2,772 140,163
Grand Valley Rural Power Lines 7,183 171,637 7,063 171,494
Holy Cross Electric Association 41,921 1,078,178 42,104 1,047,106
Intermountain Rural Electric Association 49,781 1,242,154 51,342 1,238,462
Platte River Power Authority 571,168 14,500,068 0 0
Tri-State Generation and Transmission Association 1,552,931 44,213,033 1,550,237 43,629,385
Yampa Valley Electric Association 24,683 646,351 25,073 646,639
Colorado subtotal 2,255,876 62,026,048 1,679,028 46,881,628
New Mexico
Central Valley Electric Cooperative 13,900 333,987 13,917 333,963
Farmers Electric Cooperative 11,394 281,373 11,409 281,355
Lea County Electric Cooperative 13,900 311,237 13,914 311,210
Roosevelt County Electric Cooperative 12,687 310,337 12,703 310,318
New Mexico subtotal 51,881 1,236,934 51,943 1,236,846

119
SALT LAKE CITY AREA/INTEGRATED PROJECTS
Power Sales and Revenues, continuedCustomer
FY 20141 FY 20132
Energy (MWh) Revenue ($) Energy (MWh) Revenue ($)
North Dakota
Basin Electric Power Cooperative 1,701 71,829 0 0
North Dakota subtotal 1,701 71,829 0 0
Utah
Deseret Generation and Transmission4 467,479 14,414,787 477,471 14,561,972
Utah subtotal 467,479 14,414,787 477,471 14,561,972
Wyoming
Willwood Light and Power Company 158 4,403 162 4,403
Wyoming subtotal 158 4,403 162 4,403
Cooperatives subtotal 2,833,636 79,373,005 2,260,186 64,207,981
FEDERAL AGENCIES
Arizona
Colorado River Agency-BIA 2,442 71,249 0 0
Luke Air Force Base 5,360 157,151 6,480 201,633
San Carlos Irrigation Project-BIA 60,642 2,561,858 0 0
Yuma Proving Grounds 3,193 110,253 3,183 104,813
Arizona subtotal 71,637 2,900,511 9,663 306,446
Colorado
Bureau of Reclamation 0 0 133 2,965
Pueblo Chemical Depot 5,746 225,755 0 0
Colorado subtotal 5,746 225,755 133 2,965
New Mexico
Albuquerque Operations Office 69,986 1,973,220 81,257 2,368,994
Cannon Air Force Base 5,455 147,618 5,463 147,609
Holloman Airforce Base 7,907 211,698 7,921 211,698
Kirtland Air Force Base 13,898 376,010 13,923 375,789
New Mexico subtotal 97,246 2,708,546 108,564 3,104,090
Utah
Defense Depot Ogden 10,451 321,090 10,471 321,073
Hill Airforce Base 16,585 490,810 16,677 498,942
Tooele Army Base 4,324 117,112 4,331 117,104
Utah subtotal 31,360 929,012 31,479 937,119
Federal agencies subtotal 205,989 6,763,824 149,839 4,350,620
STATE AGENCIES
Arizona
Salt River Project 364,645 10,425,797 329,552 9,480,409
Arizona subtotal 364,645 10,425,797 329,552 9,480,409
Colorado
Pueblo Chemical Depot 0 0 5,227 204,044
Colorado subtotal 0 0 5,227 204,044
Power Sales and Revenues, continuedCustomer
FY 20141 FY 20132
Energy (MWh) Revenue ($) Energy (MWh) Revenue ($)
Nevada
Colorado River Commission 103,061 3,117,872 100,643 2,998,823
Nevada subtotal 103,061 3,117,872 100,643 2,998,823
Utah
Uintah Water Conservation District 1,327 37,579 0 0
University of Utah 12,999 348,233 13,018 348,210
Utah State University 4,519 120,864 4,527 120,856
Utah subtotal 18,845 506,676 17,545 469,066
State agencies subtotal 486,551 14,050,345 452,967 13,152,342
IRRIGATION DISTRICTS
Arizona
Chandler Heights Citrus5 776 28,298 0 0
Electrical District No. 25 29,576 864,055 38,431 1,195,902
Electrical District No. 35 91,533 3,350,339 23,246 656,471
Electrical District No. 45 66,333 2,431,067 54,292 1,725,566
Electrical District No. 55 27,422 931,139 21,931 719,036
Electrical District No. 65 11,797 251,024 8,086 217,062
Electrical District No. 75 7,621 163,877 7,765 214,664
Maricopa County Water5 13,896 309,564 13,908 378,012
Ocotillo5 7,696 262,925 7,053 217,496
Roosevelt Irrigation District5 36,908 1,324,781 37,330 1,159,016
Roosevelt Water Conservation District 0 0 2,760 80,306
San Tan Irrigation District5 4,228 145,374 7,571 239,772
Wellton-Mohawk Irrigation District5 2,173 72,090 2,378 74,703
Arizona subtotal 299,959 10,134,533 224,751 6,878,006
Utah
Weber Basin Water Conservancy District 0 614,500 0 0
Utah subtotal 0 614,500 0 0
Irrigation districts subtotal 299,959 10,749,033 224,751 6,878,006
NATIVE AMERICAN TRIBES
Arizona
Aha Macav Power Service 1,026 29,720 1,027 29,719
Ak-Chin Indian Community 41,332 1,651,850 34,375 1,465,272
Cocopah Indian Tribe 315 9,323 3,589 104,330
Colorado River Agency-BIA 0 0 2,463 71,620
Colorado River Indian Tribe 19,017 521,148 19,587 521,149
Fort Mcdowell Yavapai Nation 676 19,999 3,023 84,590
Gila River Indian Community 52,497 1,420,948 57,110 1,688,196
Havasupai Tribe 70 2,087 671 19,478

120
SALT LAKE CITY AREA/INTEGRATED PROJECTS
Power Sales and Revenues, continuedCustomer
FY 20141 FY 20132
Energy (MWh) Revenue ($) Energy (MWh) Revenue ($)
Hopi Tribe 837 24,758 8,498 246,717
Hualapai Tribe 181 5,365 1,897 55,083
Las Vegas Paiute Tribe 156 4,608 1,905 55,444
Navajo Tribal Utility Authority 378,295 9,038,095 474,452 12,003,272
Paiute Indian Tribe of Utah 46 1,357 480 13,932
Pascua Yaqui Tribe 307 9,093 3,607 104,885
Pueblo of Isleta 330 9,772 3,393 98,523
Salt River Pima-Maricopa 3,985 117,889 19,269 540,197
San Carlos Apache Tribe 1,126 33,304 12,181 353,932
San Carlos Irrigation Project-BIA 0 0 59,184 1,869,777
Tohono O'Odham Utility Authority 7,687 220,852 7,331 216,349
Tonto Apache Tribe 104 3,076 1,124 32,630
Yavapai Apache Tribe 436 12,909 5,149 149,735
Yavapai Prescott Indian Tribe 240 7,093 2,367 68,684
Yomba Shoshone 9 266 95 2,739
Arizona subtotal 508,672 13,143,512 722,777 19,796,253
Colorado
Southern Ute Indian Tribe 4,600 123,170 4,568 123,170
Ute Mountain Ute Tribe 1,974 52,829 1,957 52,829
Colorado subtotal 6,574 175,999 6,525 175,999
Nevada
Duckwater Shoshone Tribe 252 7,293 0 0
Ely Shoshone Tribe 385 11,131 0 0
Nevada subtotal 637 18,424 0 0
New Mexico
Alamo Navajo 703 20,381 249 6,970
Canoncito Navajo 518 15,011 143 3,945
Jicarilla Apache 1,726 49,886 867 24,163
Mescalero Apache 3,635 105,412 1,289 36,042
Nambe Pueblo 229 6,651 81 2,275
Navajo Agricultural Products Industry 73,931 1,942,887 0 0
Pueblo Laguna 2,765 80,169 980 27,411
Picuris Pueblo 178 5,210 62 1,774
Pueblo Acoma 1,534 44,496 544 15,212
Pueblo De Cochiti 67 1,975 270 7,517
Pueblo Jemez 888 25,711 315 8,797
Pueblo of San Juan 1,113 32,241 394 11,024
Pueblo of Sandia 243 7,198 1,150 32,214
Pueblo of Taos 1,045 30,173 372 10,332
Power Sales and Revenues, continuedCustomer
FY 20141 FY 20132
Energy (MWh) Revenue ($) Energy (MWh) Revenue ($)
Pueblo of Tesuque 178 5,270 803 22,465
Pueblo of Zia 284 8,218 101 2,812
Pueblo of Zuni 4,087 118,355 1,451 40,487
Pueblo Pojoaque 890 25,734 316 8,807
Pueblo San Felipe 126 3,716 494 13,782
Pueblo San Ildefonso 235 6,811 83 2,329
Pueblo Santa Clara 888 25,676 315 8,785
Pueblo Santo Domingo 131 3,860 583 16,312
Ramah Navajo 1,323 38,253 470 13,093
Santa Ana Pueblo 122 3,612 569 15,930
New Mexico subtotal 96,839 2,606,906 11,901 332,478
Utah
Goshute Reservation 189 5,441 0 0
Ute Indian Tribe 2,337 61,577 2,262 61,577
Utah subtotal 2,526 67,018 2,262 61,577
Wyoming
Wind River Reservation 1,950 52,293 1,941 52,293
Wyoming subtotal 1,950 52,293 1,941 52,293
Native American tribes subtotal 617,198 16,064,152 745,406 20,418,600
INVESTOR-OWNED UTILITIES
Arizona
Arizona Public Service Company 742 38,778 427 11,618
Tucson Electric Power Company 1,456 31,316 0 0
Arizona subtotal 2,198 70,094 427 11,618
Colorado
Public Service Company of Colorado 4,916 112,893 277 12,953
Colorado subtotal 4,916 112,893 277 12,953
Nevada
Nevada Power Company 455 8,940 299 6,685
Tucson Electric Power Company 0 0 543 11,179
Nevada subtotal 455 8,940 842 17,864
New Mexico
Public Service Company of New Mexico 14,895 397,790 8,204 240,279
New Mexico subtotal 14,895 397,790 8,204 240,279
Oregon
Pacificorp 270 7,646 331 11,170
Oregon subtotal 270 7,646 331 11,170
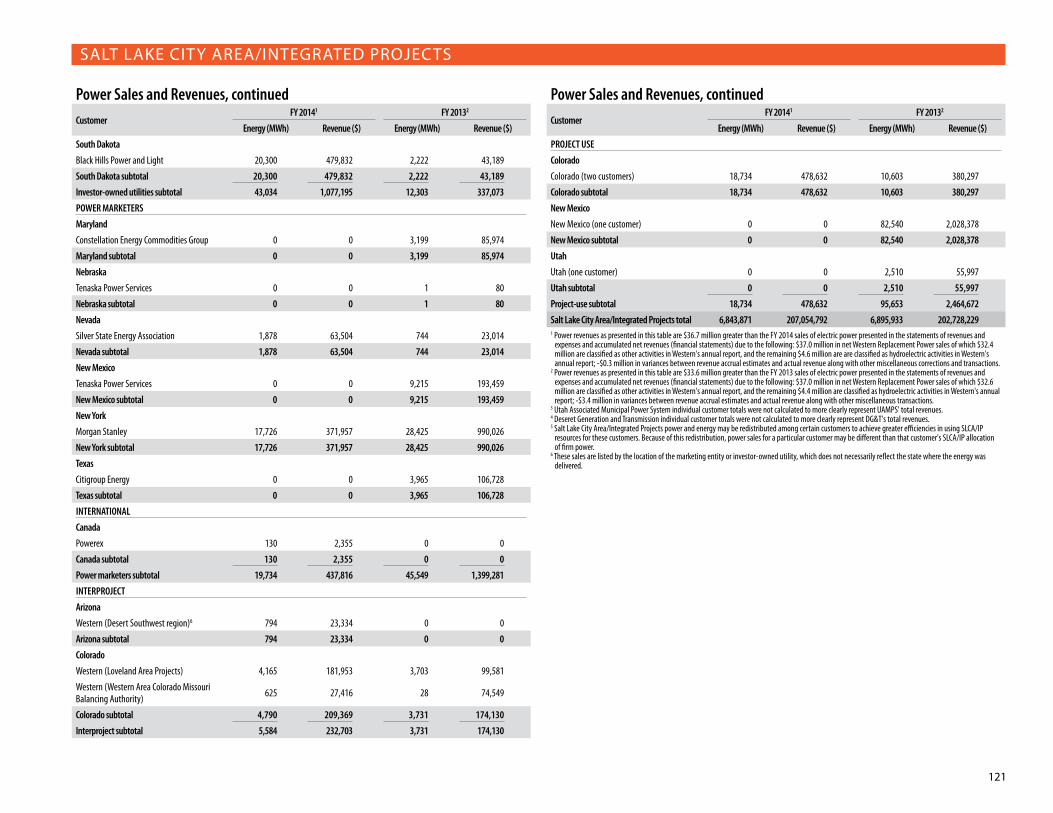
121
SALT LAKE CITY AREA/INTEGRATED PROJECTS
Power Sales and Revenues, continuedCustomer
FY 20141 FY 20132
Energy (MWh) Revenue ($) Energy (MWh) Revenue ($)
South Dakota
Black Hills Power and Light 20,300 479,832 2,222 43,189
South Dakota subtotal 20,300 479,832 2,222 43,189
Investor-owned utilities subtotal 43,034 1,077,195 12,303 337,073
POWER MARKETERS
Maryland
Constellation Energy Commodities Group 0 0 3,199 85,974
Maryland subtotal 0 0 3,199 85,974
Nebraska
Tenaska Power Services 0 0 1 80
Nebraska subtotal 0 0 1 80
Nevada
Silver State Energy Association 1,878 63,504 744 23,014
Nevada subtotal 1,878 63,504 744 23,014
New Mexico
Tenaska Power Services 0 0 9,215 193,459
New Mexico subtotal 0 0 9,215 193,459
New York
Morgan Stanley 17,726 371,957 28,425 990,026
New York subtotal 17,726 371,957 28,425 990,026
Texas
Citigroup Energy 0 0 3,965 106,728
Texas subtotal 0 0 3,965 106,728
INTERNATIONAL
Canada
Powerex 130 2,355 0 0
Canada subtotal 130 2,355 0 0
Power marketers subtotal 19,734 437,816 45,549 1,399,281
INTERPROJECT
Arizona
Western (Desert Southwest region)6 794 23,334 0 0
Arizona subtotal 794 23,334 0 0
Colorado
Western (Loveland Area Projects) 4,165 181,953 3,703 99,581
Western (Western Area Colorado Missouri Balancing Authority) 625 27,416 28 74,549
Colorado subtotal 4,790 209,369 3,731 174,130
Interproject subtotal 5,584 232,703 3,731 174,130
Power Sales and Revenues, continuedCustomer
FY 20141 FY 20132
Energy (MWh) Revenue ($) Energy (MWh) Revenue ($)
PROJECT USE
Colorado
Colorado (two customers) 18,734 478,632 10,603 380,297
Colorado subtotal 18,734 478,632 10,603 380,297
New Mexico
New Mexico (one customer) 0 0 82,540 2,028,378
New Mexico subtotal 0 0 82,540 2,028,378
Utah
Utah (one customer) 0 0 2,510 55,997
Utah subtotal 0 0 2,510 55,997
Project-use subtotal 18,734 478,632 95,653 2,464,672
Salt Lake City Area/Integrated Projects total 6,843,871 207,054,792 6,895,933 202,728,229 1 Power revenues as presented in this table are $36.7 million greater than the FY 2014 sales of electric power presented in the statements of revenues and
expenses and accumulated net revenues (financial statements) due to the following: $37.0 million in net Western Replacement Power sales of which $32.4 million are classified as other activities in Western's annual report, and the remaining $4.6 million are are classified as hydroelectric activities in Western's annual report; -$0.3 million in variances between revenue accrual estimates and actual revenue along with other miscellaneous corrections and transactions.
2 Power revenues as presented in this table are $33.6 million greater than the FY 2013 sales of electric power presented in the statements of revenues and expenses and accumulated net revenues (financial statements) due to the following: $37.0 million in net Western Replacement Power sales of which $32.6 million are classified as other activities in Western's annual report, and the remaining $4.4 million are classified as hydroelectric activities in Western's annual report; -$3.4 million in variances between revenue accrual estimates and actual revenue along with other miscellaneous transactions.
3 Utah Associated Municipal Power System individual customer totals were not calculated to more clearly represent UAMPS' total revenues.4 Deseret Generation and Transmission individual customer totals were not calculated to more clearly represent DG&T's total revenues.5 Salt Lake City Area/Integrated Projects power and energy may be redistributed among certain customers to achieve greater efficiencies in using SLCA/IP
resources for these customers. Because of this redistribution, power sales for a particular customer may be different than that customer's SLCA/IP allocation of firm power.
6 These sales are listed by the location of the marketing entity or investor-owned utility, which does not necessarily reflect the state where the energy was delivered.

122
SALT LAKE CITY AREA/INTEGRATED PROJECTS
COLLBRAN PROJECT Status of Repayment (dollars in thousands)
Cumulative 2013 1 ($) Adjustment ($) Annual 2014 2 ($) Cumulative 2014 3 ($)
REVENUE:
Gross operating revenue 63,978 0 961 64,939
Income transfers (net) 36 0 0 36
Total operating revenue 64,014 0 961 64,975
ExPENSES:
O&M and other3 29,639 0 1,607 31,246
Purchase power and other 0 0 0 0
Interest
Federally financed 12,071 0 6 12,077
Non-federally financed 0 0 0 0
Total interest 12,071 0 6 12,077
Total expense 41,710 0 1,613 43,323
(Deficit)/surplus revenue 964 0 (966) (2)
INVESTMENT:
Federally financed power 16,281 0 5,747 22,028
Non-federally financed power 0 0 0 0
Nonpower 5,059 0 0 5,059
Total investment 21,340 0 5,747 27,087
INVESTMENT REPAID:
Federally financed power 16,281 0 314 16,595
Non-federally financed power 0 0 0 0
Nonpower 5,059 0 0 5,059
Total investment repaid 21,340 0 314 21,654
INVESTMENT UNPAID:
Federally financed power 0 0 5,433 5,433
Non-federally financed power 0 0 0 0
Nonpower 0 0 0 0
Total investment unpaid 0 0 5,433 5,433
FUND BALANCES:
Colorado River Development 0 0 0 0
Working capital 0 0 0 0
PERCENT OF INVESTMENT REPAID TO DATE:
Federal 100.00% 75.34%
Non-federal N/A N/A
Nonpower 100.00% 100.00%1 This column ties to the cumulative FY 2013 numbers on Page 122 of the FY 2013 Statistical Appendix.2 Based on FY 2014 final audited financial statements.
COLORADO RIVER STORAGE PROJECT Status of Repayment (dollars in thousands)
Cumulative 20131 ($) Adjustment ($) Annual 2014 2 ($) Cumulative 2014 3 ($)
REVENUE:
Gross operating revenue 5,314,134 0 190,582 5,504,716
Income transfers (net) (20,691) 0 (2,363) (23,054)
Total operating revenue 5,293,443 0 188,219 5,481,662
ExPENSES:
O&M and other3 1,747,797 25,678 75,158 1,848,634
Purchase power and Wheeling4 1,617,061 (797) 85,167 1,701,431
Interest
Federally financed5 761,941 (4,645) (358) 756,938
Non-federally financed 604 4,645 593 5,843
Total interest 762,545 0 235 762,780
Total expense 4,127,403 24,881 160,561 4,312,845
(Deficit)/surplus revenue (3) (24,881) 24,881 (3)
INVESTMENT:
Federally financed power 1,177,384 0 9,790 1,187,174
Non-federally financed power 0 0 0 0
Nonpower 1,187,331 0 (1,813) 1,185,518
Total investment 2,364,715 0 7,976 2,372,691
INVESTMENT REPAID:
Federally financed power 1,118,289 0 0 1,118,289
Non-federally financed power 0 0 0 0
Nonpower 47,754 0 2,777 50,531
Total investment repaid 1,166,043 0 2,777 1,168,820
INVESTMENT UNPAID:
Federally financed power 59,095 0 9,790 68,885
Non-federally financed power 0 0 0 0
Nonpower 1,139,577 0 (4,590) 1,134,987
Total investment unpaid 1,198,672 0 5,200 1,203,872
FUND BALANCES:
Colorado River Development 0 0 0 0
Working capital 0 0 0 0
PERCENT OF INVESTMENT REPAID TO DATE:
Federal 94.98% 94.20%
Non-federal N/A N/A
Nonpower 4.02% 4.26%1 This column ties to the cumulative FY 2013 numbers on Page 122 of the FY 2013 Statistical Appendix.2 Based on FY 2014 final audited financial statements.3 Gains and losses for 2014 (CRSP losses on disposition of assets).4 Unbooked environmental studies5 Reclassified interest

123
SALT LAKE CITY AREA/INTEGRATED PROJECTS
DOLORES PROJECT Status of Repayment (dollars in thousands)
Cumulative 20131 ($) Adjustment ($) Annual 20142 ($) Cumulative 20143 ($)
REVENUE:
Gross operating revenue 55,388 0 3,182 58,570
Income transfers (net) 1,225 0 (114) 1,111
Total operating revenue 56,613 0 3,068 59,681
ExPENSES:
O&M and other3 7,867 (27) 444 8,283
Purchase power and other 0 0 0 0
Interest
Federally financed 40,950 0 1,950 42,900
Non-federally financed 0 0 0 0
Total interest 40,950 0 1,950 42,900
Total expense 48,817 (27) 2,394 51,184
(Deficit)/surplus revenue (1) 27 (27) (1)
INVESTMENT:
Federally financed power 38,231 0 114 38,345
Non-federally financed power 0 0 0 0
Nonpower 0 0 0 0
Total investment 38,231 0 114 38,345
INVESTMENT REPAID:
Federally financed power 7,797 0 701 8,498
Non-federally financed power 0 0 0 0
Nonpower 0 0 0 0
Total investment repaid 7,797 0 701 8,498
INVESTMENT UNPAID:
Federally financed power 30,434 0 (587) 29,847
Non-federally financed power 0 0 0 0
Nonpower 0 0 0 0
Total investment unpaid 30,434 0 (587) 29,847
FUND BALANCES:
Colorado River Development 0 0 0 0
Working capital 0 0 0 0
PERCENT OF INVESTMENT REPAID TO DATE:
Federal 20.39% 22.16%
Non-federal N/A N/A
Nonpower N/A N/A1 This column ties to the cumulative FY 2013 numbers on Page 123 of the FY 2013 Statistical Appendix.2 Based on FY 2014 final audited financial statements.3 Per Schedule 11, net loss (gain) on disposition
RIO GRANDE PROJECT Status of Repayment (dollars in thousands)
Cumulative 20131 ($) Adjustment ($) Annual 20142 ($) Cumulative 20143 ($)
REVENUE:
Gross operating revenue 106,067 0 2,527 108,594
Income transfers (net) 0 0 0 0
Total operating revenue 106,067 0 2,527 108,594
ExPENSES:
O&M and other3 64,742 0 2,080 66,822
Purchase power and other 4,774 0 0 4,774
Interest
Federally financed 14,680 0 116.193 14,796
Non-federally financed 0 0 0 0
Total interest 14,680 0 116 14,796
Total expense 84,196 0 2,197 86,393
(Deficit)/surplus revenue (265) 0 264 (1)
INVESTMENT:
Federally financed power 19,901 0 80 19,981
Non-federally financed power 0 0 0 0
Nonpower 5,802 0 0 5,802
Total investment 25,703 0 80 25,783
INVESTMENT REPAID:
Federally financed power 16,334 0 66 16,400
Non-federally financed power 0 0 0 0
Nonpower 5,802 0 0 5,802
Total investment repaid 22,136 0 66 22,202
INVESTMENT UNPAID:
Federally financed power 3,567 0 14 3,581
Non-federally financed power 0 0 0 0
Nonpower 0 0 0 0
Total investment unpaid 3,567 0 14 3,581
FUND BALANCES:
Colorado River Development 0 0 0 0
Working capital 0 0 0 0
PERCENT OF INVESTMENT REPAID TO DATE:
Federal 82.08% 82.08%
Non-federal N/A N/A
Nonpower 100.00% 100.00%1 This column ties to the cumulative FY 2013 numbers on Page 123 of the FY 2013 Statistical Appendix.2 Based on FY 2014 final audited financial statements.

124
SALT LAKE CITY AREA/INTEGRATED PROJECTS
SEEDSKADEE PROJECT Status of Repayment (dollars in thousands)
Cumulative 20131 ($) Adjustment ($) Annual 20142 ($) Cumulative 20143 ($)
REVENUE:
Gross operating revenue 32,991 0 110 33,101
Income transfers (net) 600 0 1,026 1,626
Total operating revenue 33,591 0 1,136 34,727
ExPENSES:
O&M and other3 16,468 (18) 952 17,402
Purchase power and other 0 0 0 0
Interest
Federally financed 6,289 0 185 6,474
Non-federally financed 0 0 0 0
Total interest 6,289 0 185 6,474
Total expense 22,757 (18) 1,137 23,876
(Deficit)/surplus revenue 1,747 18 (1) 1,764
INVESTMENT:
Federally financed power4 9,087 0 345 9,432
Non-federally financed power 0 0 0 0
Nonpower 0 0 0 0
Total investment 9,087 0 345 9,432
INVESTMENT REPAID:
Federally financed power 9,087 0 0 9,087
Non-federally financed power 0 0 0 0
Nonpower 0 0 0 0
Total investment repaid 9,087 0 0 9,087
INVESTMENT UNPAID:
Federally financed power 0 0 345 345
Non-federally financed power 0 0 0 0
Nonpower 0 0 0 0
Total investment unpaid 0 0 345 345
FUND BALANCES:
Colorado River Development 0 0 0 0
Working capital 0 0 0 0
Percent of investment repaid to date:
Federal 100.00% 96.34%
Non-federal N/A N/A
Nonpower N/A N/A1 This column ties to the cumulative FY 2013 numbers on Page 124 of the FY 2013 Statistical Appendix.2 Based on FY 2014 final audited financial statements.3 Gains and losses4 In lieu of expensing capitalized investments, the surplus will be transferred to Colorado River Storage Project for mandatory payments in FY 2015.

125
SALT LAKE CITY AREA/INTEGRATED PROJECTS COLLBRAN PROJECT
Balance SheetsAs of Sept. 30, 2014 and 2013 (in thousands)
FY 2014 FY 2013
Western Reclamation Total Western Reclamation Total
Assets
Completed utility plant $557 $16,183 $16,740 $557 $10,436 $10,993
Accumulated depreciation (423) (6,989) (7,412) (412) (6,935) (7,347)
Net completed plant 134 9,194 9,328 145 3,501 3,646
Construction work-in-progress 118 17 135 92 5,717 5,809
Net utility plant 252 9,211 9,463 237 9,218 9,455
Cash 27 88 115 3 307 310
Regulatory assets 1 68 69 0 88 88
Total assets 280 9,367 9,647 240 9,613 9,853
Liabilities:
Customer advances and other liabilities 3 78 81 4 115 119
Accounts payable 0 13 13 0 163 163
Environmental cleanup liabilities 0 0 0 0 17 17
Total liabilities 3 91 94 4 295 299
Capitalization:
Payable to U.S. Treasury (3,118) 8,884 5,766 (2,374) 7,425 5,051
Accumulated net revenues 3,395 392 3,787 2,610 1,893 4,503
Total capitalization 277 9,276 9,553 236 9,318 9,554
Total liabilities and capitalization $280 $9,367 $9,647 $240 $9,613 $9,853
Statements of Revenues and Expenses and Accumulated Net RevenuesFor the years ended Sept. 30, 2014 and 2013 (in thousands)
FY 2014 FY 2013
Western Reclamation Total Western Reclamation Total
Operating revenues:
Sales of electric power $918 $0 $918 $1,072 $0 $1,072
Transmission and other operating revenues 0 43 43 0 42 42
Gross operating revenues 918 43 961 1,072 42 1,114
Income transfers, net 0 0 0 (1,518) 1,518 0
Total operating revenues 918 43 961 (446) 1,560 1,114
Operating expenses:
Operation and maintenance 109 1,485 1,594 25 974 999
Depreciation 11 53 64 11 163 174
Administration and general 13 0 13 5 0 5
Total operating expenses 133 1,538 1,671 41 1,137 1,178
Net operating revenues 785 (1,495) (710) (487) 423 (64)
Interest expenses:
Interest on payable to U.S. Treasury 0 56 56 1 115 116
Allowance for funds used during construction 0 (50) (50) (1) (122) (123)
Net interest on payable to U.S. Treasury 0 6 6 0 (7) (7)
Net interest expenses 0 6 6 0 (7) (7)
Net revenues (deficit) 785 (1,501) (716) (487) 430 (57)
Accumulated net revenues:
Balance, beginning of year 2,610 1,893 4,503 3,097 1,463 4,560
Irrigation assistance 0 0 0 0 0 0
Balance, end of year $3,395 $392 $3,787 $2,610 $1,893 $4,503

126
SALT LAKE CITY AREA/INTEGRATED PROJECTS COLORADO RIVER STORAGE PROJECT
Balance SheetsAs of Sept. 30, 2014 and 2013 (in thousands)
FY 2014 FY 2013
Western Reclamation Total Western Reclamation Total
Assets
Completed utility plant $654,130 $490,512 $1,144,642 $651,271 $509,822 $1,161,093
Accumulated depreciation (404,589) (353,009) (757,598) (390,945) (347,709) (738,654)
Net completed plant 249,541 137,503 387,044 260,326 162,113 422,439
Construction work-in-progress 20,046 67,105 87,151 7,217 50,938 58,155
Net utility plant 269,587 204,608 474,195 267,543 213,051 480,594
Cash 148,093 37,619 185,712 169,768 56,258 226,026
Accounts receivable, net 21,661 4 21,665 32,617 5 32,622
Regulatory assets 21,787 5,040 26,827 22,711 6,801 29,512
Other assets 18,116 0 18,116 16,616 0 16,616
Total assets 479,244 247,271 726,515 509,255 276,115 785,370
Liabilities:
Long-term liabilities 23,905 0 23,905 24,049 0 24,049
Customer advances and other liabilities 42,298 5,874 48,172 39,339 7,764 47,103
Accounts payable 13,576 1,099 14,675 11,958 300 12,258
Environmental cleanup liabilities 2,347 0 2,347 2,323 540 2,863
Total liabilities 82,126 6,973 89,099 77,669 8,604 86,273
Capitalization:
Payable to U.S. Treasury 211,095 43,610 254,705 172,598 152,037 324,635
Accumulated net revenues (deficit) 186,023 196,688 382,711 258,988 115,474 374,462
Total capitalization 397,118 240,298 637,416 431,586 267,511 699,097
Total liabilities and capitalization $479,244 $247,271 $726,515 $509,255 $276,115 $785,370
Statements of Revenues and Expenses and Accumulated Net RevenuesFor the years ended Sept. 30, 2014 and 2013 (in thousands)
FY 2014 FY 2013
Western Reclamation Total Western Reclamation Total
Operating revenues:
Sales of electric power $163,625 $0 $163,625 $161,855 $0 $161,855
Transmission and other operating revenues 26,664 293 26,957 25,839 3,514 29,353
Gross operating revenues 190,289 293 190,582 187,694 3,514 191,208
Income transfers, net (116,077) 113,714 (2,363) (48,007) 48,754 747
Total operating revenues 74,212 114,007 188,219 139,687 52,268 191,955
Operating expenses:
Operation and maintenance 38,803 27,124 65,927 39,223 25,062 64,285
Purchased power 78,834 0 78,834 66,289 0 66,289
Purchased transmission services 6,333 0 6,333 9,115 0 9,115
Depreciation 14,109 5,301 19,410 15,899 2,786 18,685
Administration and general 9,231 0 9,231 8,492 0 8,492
Total operating expenses 147,310 32,425 179,735 139,018 27,848 166,866
Net operating revenues (deficit) (73,098) 81,582 8,484 669 24,420 25,089
Interest expenses:
Interest on payable to U.S. Treasury (25) 4,691 4,666 (104,627) (23,174) (127,801)
Allowance for funds used during construction (701) (4,323) (5,024) (724) (3,684) (4,408)
Net interest on payable to U.S. Treasury (726) 368 (358) (105,351) (26,858) (132,209)
Interest on long-term liabilities 593 0 593 604 0 604
Net interest expenses (133) 368 235 (104,747) (26,858) (131,605)
Net revenues (deficit) (72,965) 81,214 8,249 105,416 51,278 156,694
Accumulated net revenues (deficit):
Balance, beginning of year 258,988 115,474 374,462 153,572 64,196 217,768
Irrigation assistance 0 0 0 0 0 0
Balance, end of year $186,023 $196,688 $382,711 $258,988 $115,474 $374,462

127
SALT LAKE CITY AREA/INTEGRATED PROJECTS DOLORES PROJECT
Balance SheetsAs of Sept. 30, 2014 and 2013 (in thousands)
FY 2014 FY 2013
Western Reclamation Total Western Reclamation Total
Assets
Completed utility plant $9,315 $28,944 $38,259 $9,249 $28,939 $38,188
Accumulated depreciation (3,915) (8,357) (12,272) (3,694) (7,989) (11,683)
Net completed plant 5,400 20,587 25,987 5,555 20,950 26,505
Construction work-in-progress 171 0 171 409 0 409
Net utility plant 5,571 20,587 26,158 5,964 20,950 26,914
Cash 12,082 872 12,954 9,832 397 10,229
Regulatory assets 1 1 2 1 9 10
Other assets 0 850 850 0 342 342
Total assets 17,654 22,310 39,964 15,797 21,698 37,495
Liabilities:
Customer advances and other liabilities 3 1 4 76 31 107
Accounts payable 0 0 0 12 0 12
Environmental cleanup liabilities 0 0 0 0 4 4
Total liabilities 3 1 4 88 35 123
Capitalization:
Payable to U.S. Treasury 16,282 27,638 43,920 14,409 26,965 41,374
Accumulated net revenues (deficit) 1,369 (5,329) (3,960) 1,300 (5,302) (4,002)
Total capitalization 17,651 22,309 39,960 15,709 21,663 37,372
Total liabilities and capitalization $17,654 $22,310 $39,964 $15,797 $21,698 $37,495
Statements of Revenues and Expenses and Accumulated Net RevenuesFor the years ended Sept. 30, 2014 and 2013 (in thousands)
FY 2014 FY 2013
Western Reclamation Total Western Reclamation Total
Operating revenues:
Sales of electric power $3,182 $0 $3,182 $3,112 $0 $3,112
Transmission and other operating revenues 0 0 0 0 23 23
Gross operating revenues 3,182 0 3,182 3,112 23 3,135
Income transfers, net (2,550) 2,436 (114) (3,284) 3,197 (87)
Total operating revenues 632 2,436 3,068 (172) 3,220 3,048
Operating expenses:
Operation and maintenance 104 340 444 235 603 838
Depreciation 264 367 631 226 376 602
Administration and general 1 0 1 35 0 35
Total operating expenses 369 707 1,076 496 979 1,475
Net operating revenues (deficit) 263 1,729 1,992 (668) 2,241 1,573
Interest expenses:
Interest on payable to U.S. Treasury 95 1,756 1,851 95 1,755 1,850
Allowance for funds used during construction 99 0 99 (19) 0 (19)
Net interest on payable to U.S. Treasury 194 1,756 1,950 76 1,755 1,831
Net interest expenses 194 1,756 1,950 76 1,755 1,831
Net revenues (deficit) 69 (27) 42 (744) 486 (258)
Accumulated net revenues (deficit):
Balance, beginning of year 1,300 (5,302) (4,002) 2,044 (5,788) (3,744)
Balance, end of year $1,369 ($5,329) ($3,960) $1,300 ($5,302) ($4,002)
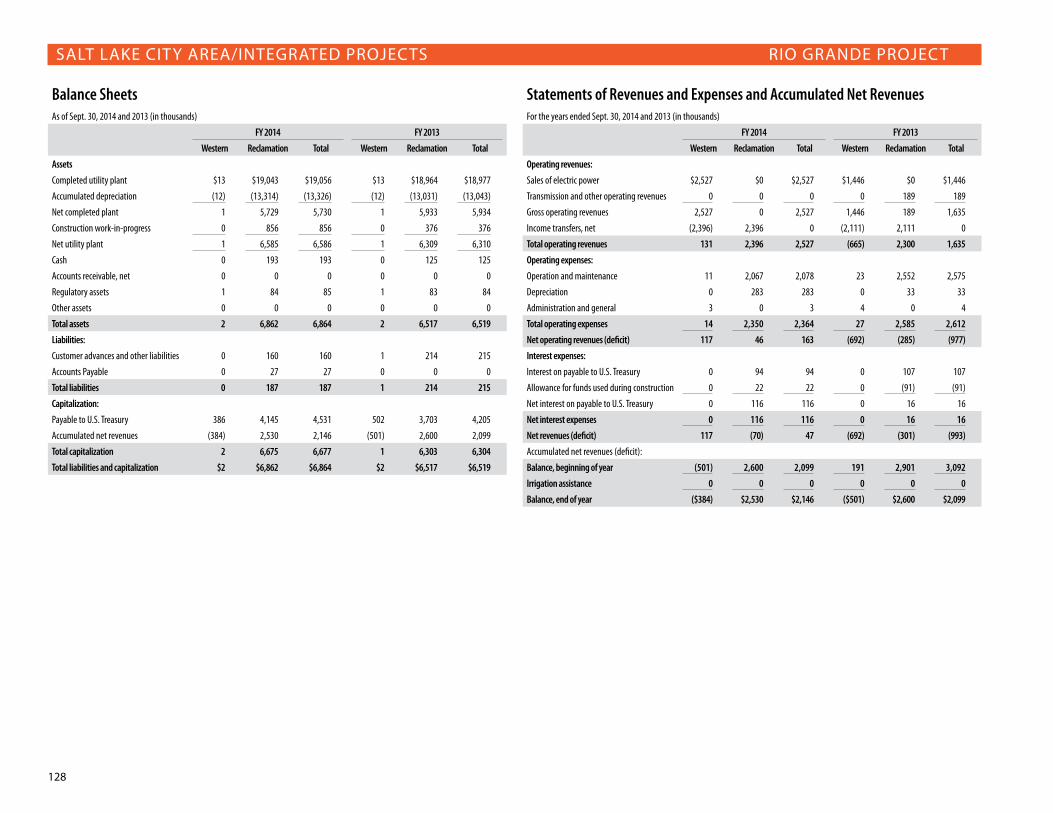
128
SALT LAKE CITY AREA/INTEGRATED PROJECTS RIO GRANDE PROJECT
Balance SheetsAs of Sept. 30, 2014 and 2013 (in thousands)
FY 2014 FY 2013
Western Reclamation Total Western Reclamation Total
Assets
Completed utility plant $13 $19,043 $19,056 $13 $18,964 $18,977
Accumulated depreciation (12) (13,314) (13,326) (12) (13,031) (13,043)
Net completed plant 1 5,729 5,730 1 5,933 5,934
Construction work-in-progress 0 856 856 0 376 376
Net utility plant 1 6,585 6,586 1 6,309 6,310
Cash 0 193 193 0 125 125
Accounts receivable, net 0 0 0 0 0 0
Regulatory assets 1 84 85 1 83 84
Other assets 0 0 0 0 0 0
Total assets 2 6,862 6,864 2 6,517 6,519
Liabilities:
Customer advances and other liabilities 0 160 160 1 214 215
Accounts Payable 0 27 27 0 0 0
Total liabilities 0 187 187 1 214 215
Capitalization:
Payable to U.S. Treasury 386 4,145 4,531 502 3,703 4,205
Accumulated net revenues (384) 2,530 2,146 (501) 2,600 2,099
Total capitalization 2 6,675 6,677 1 6,303 6,304
Total liabilities and capitalization $2 $6,862 $6,864 $2 $6,517 $6,519
Statements of Revenues and Expenses and Accumulated Net RevenuesFor the years ended Sept. 30, 2014 and 2013 (in thousands)
FY 2014 FY 2013
Western Reclamation Total Western Reclamation Total
Operating revenues:
Sales of electric power $2,527 $0 $2,527 $1,446 $0 $1,446
Transmission and other operating revenues 0 0 0 0 189 189
Gross operating revenues 2,527 0 2,527 1,446 189 1,635
Income transfers, net (2,396) 2,396 0 (2,111) 2,111 0
Total operating revenues 131 2,396 2,527 (665) 2,300 1,635
Operating expenses:
Operation and maintenance 11 2,067 2,078 23 2,552 2,575
Depreciation 0 283 283 0 33 33
Administration and general 3 0 3 4 0 4
Total operating expenses 14 2,350 2,364 27 2,585 2,612
Net operating revenues (deficit) 117 46 163 (692) (285) (977)
Interest expenses:
Interest on payable to U.S. Treasury 0 94 94 0 107 107
Allowance for funds used during construction 0 22 22 0 (91) (91)
Net interest on payable to U.S. Treasury 0 116 116 0 16 16
Net interest expenses 0 116 116 0 16 16
Net revenues (deficit) 117 (70) 47 (692) (301) (993)
Accumulated net revenues (deficit):
Balance, beginning of year (501) 2,600 2,099 191 2,901 3,092
Irrigation assistance 0 0 0 0 0 0
Balance, end of year ($384) $2,530 $2,146 ($501) $2,600 $2,099

129
SALT LAKE CITY AREA/INTEGRATED PROJECTS SEEDSKADEE PROJECT
Balance SheetsAs of Sept. 30, 2014 and 2013 (in thousands)
FY 2014 FY 2013
Western Reclamation Total Western Reclamation Total
Assets
Completed utility plant $1,380 $7,685 $9,065 $1,166 $7,580 $8,746
Accumulated depreciation (986) (3,263) (4,249) (925) (3,157) (4,082)
Net completed plant 394 4,422 4,816 241 4,423 4,664
Construction work-in-progress 0 203 203 437 57 494
Net utility plant 394 4,625 5,019 678 4,480 5,158
Cash 416 236 652 1,399 71 1,470
Regulatory assets (1) 20 19 1 40 41
Other assets 0 0 0 0 0 0
Total assets 809 4,881 5,690 2,078 4,591 6,669
Liabilities:
Customer advances and other liabilities 1 31 32 5 41 46
Accounts payable 0 19 19 0 0 0
Environmental cleanup liabilities 0 0 0 0 18 18
Total liabilities 1 50 51 5 59 64
Capitalization:
Payable to U.S. Treasury 9,066 (8,940) 126 8,705 (7,806) 899
Accumulated net revenues (deficit) (8,258) 13,771 5,513 (6,632) 12,338 5,706
Total capitalization 808 4,831 5,639 2,073 4,532 6,605
Total liabilities and capitalization $809 $4,881 $5,690 $2,078 $4,591 $6,669
Statements of Revenues and Expenses and Accumulated Net RevenuesFor the years ended Sept. 30, 2014 and 2013 (in thousands)
FY 2014 FY 2013
Western Reclamation Total Western Reclamation Total
Operating revenues:
Sales of electric power $62 $0 $62 $1,603 $0 $1,603
Transmission and other operating revenues 0 48 48 0 20 20
Gross operating revenues 62 48 110 1,603 20 1,623
Income transfers, net (1,369) 2,395 1,026 (1,531) 871 (660)
Total operating revenues (1,307) 2,443 1,136 72 891 963
Operating expenses:
Operation and maintenance 34 909 943 59 865 924
Depreciation 88 106 194 14 377 391
Administration and general 7 0 7 11 0 11
Total operating expenses 129 1,015 1,144 84 1,242 1,326
Net operating revenues (deficit) (1,436) 1,428 (8) (12) (351) (363)
Interest expenses:
Interest on payable to U.S. Treasury (9) (5) (14) 33 3 36
Allowance for funds used during construction 199 0 199 (33) 0 (33)
Net interest on payable to U.S. Treasury 190 (5) 185 0 3 3
Net interest expenses 190 (5) 185 0 3 3
Net revenues (deficit) (1,626) 1,433 (193) (12) (354) (366)
Accumulated net revenues (deficit):
Balance, beginning of year (6,632) 12,338 5,706 (6,620) 12,692 6,072
Balance, end of year ($8,258) $13,771 $5,513 ($6,632) $12,338 $5,706

130
OTHER PROJECTSCentral Arizona1
The Central Arizona Project is one of three related water development projects that make up the Colorado River Basin Project . The others are the Dixie and the Upper Basin projects . The Central Arizona Project was developed for Arizona and western New Mexico; the Dixie Project for southeastern Utah; and the Upper Basin Project for Colorado and New Mexico .
Congress authorized CAP in 1968 to improve water resources in the Colorado River Basin . Segments of the 1968 authorization allowed federal participation in the Navajo Gen-erating Station, which has three coal-fired steam electric generating units for a combined ca-pacity of 2 .25 million kilowatts . Construction of the plant, located near Lake Powell at Page, Arizona, began in 1970 . Navajo began generating in 1976 . The federal share of 24 .3 percent, or 546,750 kW, is used to power the pumps that move Colorado River water through the CAP canal . Power that is surplus to CAP pumping requirements and any needs for desalting and protecting pumping facilities is currently marketed under the Navajo Power Marketing Plan adopted on Dec . 1, 1987 .
On Oct . 1, 2012, CAP moved into Western’s Desert Southwest region’s balancing author-ity . DSW schedules and operates the federal share of Navajo Generating Station used to serve CAP pumping loads and markets the remaining energy as Navajo Surplus . The amount of capacity and energy marketed varies monthly depending on an annual determination of the Central Arizona Project energy requirements for pumping .
The federal share of Navajo net generation increased from 4,349 gigawatt-hours in Fiscal Year 2013 to 4,423 GWh in FY 2014 .
Falcon-AmistadThe Falcon-Amistad Project consists of two international dams located on the Rio
Grande River between Texas and Mexico . The United States and Mexico share and operate separate powerplants on each side of the river . The power output is divided evenly between the two nations . The State Department’s International Boundary and Water Commission operates the U .S . portion of the project .
Falcon Dam is located about 130 miles (209 km) upstream from Brownsville, Texas . Congress authorized the United States’ portion of construction, operation and maintenance in 1950 . Construction was started in that year and completed in 1954 . The United States’ share of Falcon Powerplant capacity is 31,500 kilowatts . The powerplant came online in 1954 .
Amistad Dam is located about 300 miles upstream from Falcon Dam . Amistad Powerplant was constructed by the U .S . Army Corps of Engineers, as agent for the IBWC . The United States’ portion of construction, operation and maintenance was authorized by the Mexican-American Treaty Act of 1950 . Amistad Powerplant has a generation capacity of 66,000 kW . Construction was started in 1960 and completed in 1969 . Its two generating units came online in 1983 .
Project power is marketed to one cooperative in south Texas via Central Power and Light Company’s transmission system . A total of 116 million kilowatt-hours of energy was delivered in Fiscal Year 2014 .
The five-year net generation average is 184 million kWh . Repayment is made through annual installments . Western received $7 million in FY 2014 . These installments are estab-lished in advance by Western and the customers on or before Aug . 31 of the year preceding the appropriate fiscal year . Each annual installment pays the amortized portion of the U .S . in-vestment in the Falcon and Amistad hydroelectric facilities with interest, and associated op-eration, maintenance and administrative costs . This repayment schedule does not depend upon the amount of power and energy delivered or the amount of generation each year .
1 CAP is included in sales and revenue data, but not reflected in financial statements for hydropower projects because Western does not have responsibility for CAP repayment.

131
Pacific Northwest-Pacific Southwest IntertieThe Pacific NW-SW Intertie was authorized by Section 8 of the Pacific Northwest Power
Marketing Act of Aug . 31, 1964 . Originally, the Intertie was to be a combined alternate-cur-rent and direct-current transmission system, intended to connect the Pacific Northwest with the Desert Southwest . As authorized, the overall project was to be a cooperative construc-tion venture between federal and non-federal entities .
Due to delays in construction funding, certain line segments were postponed so much that interest from potential users waned . These events resulted in the delay of AC line con-struction and the indefinite delay of DC line construction . Consequently, the facilities that were constructed provide only AC transmission service .
Western’s portion of the Intertie consists of two parts, a northern portion and a south-ern portion . The northern portion is administered by Western’s Sierra Nevada region and is incorporated, for repayment and operation, with the Central Valley Project .
Included in the northern portion is the California-Oregon Transmission Project, a 350-mile, 500-kilovolt line running from Caption Jack Substation near Malin, Oregon, to Tracy, California . Western is one of the COTP owners and has rights to 177 megawatts of the line’s 1,600-MW capacity . When COTP was designed, plans included a 500-kV line between Los Banos and Gates substations in central California to mitigate grid congestion on Path 15 . This section was not constructed at the time for many reasons, but was completed in November 2005 as the Los Banos-to-Gates No .3 500-kV transmission line and provides the congestion relief . Western owns this 84-mile, 500-kV transmission line and 10 percent of the transmission system rights . Western’s cost-recovery mechanism is contained in filings before the Federal Energy Regulatory Commission .
The southern portion is administered by Western’s Desert Southwest region and is treated as a separate, stand-alone project for repayment and operational purposes . It consists of a 238-mile, 345-kV line from Mead Substation in Nevada to Liberty Substation in Arizona; a 19-mile, 230-kV line from Liberty to Westwing Substation in Arizona; a 22-mile, 230-kV line from Westwing to Pinnacle Peak Substation in Arizona; and two segments that came online in April 1996—the 260-mile, 500-kV Mead-to-Phoenix AC line between Mar-ketplace Substation in Nevada and Perkins Substation in Arizona and the 202-mile, 500-kV Mead-to-Adelanto AC line between Marketplace and the existing Adelanto Substation in southern California .
Provo RiverThe Provo River Project was authorized in 1935 . Construction on the project, which
includes Deer Creek Dam and Powerplant on the Provo River in Utah, began in 1938 but, because of World War II, was not completed until 1951 . The powerplant, authorized on Aug . 20, 1951, was completed and generation began in 1958 . Its maximum operating capacity is 5,200 kilowatts .
Since 1994, Provo River Project power has been marketed by Western to Utah Municipal Power Agency, Utah Associated Municipal Power Systems and Heber Light and Power in the Provo River drainage . The customers purchase all power generation from the project and pay annual payments based upon the estimates of operation, maintenance and replace-ment expenses for the Deer Creek Powerplant . The payments are not dependent upon the power and energy made available for sale or the rate of generation each year . An estimate of actual expense is made at the end of the year and is included in the next year’s payments .
The five-year generation average is 25 million kilowatt-hours . A total of 18 million kWh of energy was sold and a total of $272,127 in revenue was collected in FY 2014 .
Provo River Project customers pay all operating, maintenance and replacement expens-es of the project each year and, in return, receive all of the energy produced by the project .
WashoeThe Washoe Project in west-central Nevada and east-central California was designed to
improve the regulation of runoff from the Truckee and Carson River system and to provide supplemental irrigation water and drainage, as well as water for municipal, industrial and fishery use . Additionally, it offers flood protection, fish and wildlife benefits and recreation .
The project was authorized by the Washoe Project Act of Aug . 1, 1956, and was con-structed between 1960 and 1976, with the powerplant at the Stampede Dam added in 1986 . Prosser Creek Dam, Marble Creek Dam and Pyramid Lake fishway are also part of the project . The powerplant at Stampede Dam has a maximum installed capacity of 3 .6 megawatts .
Generation from the Stampede Powerplant is provided to the Truckee Donner Public Utility District and the City of Fallon pursuant to Contract No . 07-SNR-01026 . This nonfirm energy is valued at 75 percent of the average monthly, current and previous year’s Inter-continental Exchange Mid-C On/Off-Peak price . The revenue from sales is reduced by the project-use and station service power costs . The current rate case was published in the Federal Register July 22, 2008 (73 FR 42565) . Rate Schedule SNF-7 became effective Aug . 1, 2008, and its expiration was extended until Sept . 30, 2017 . The Fiscal Year 2014 net genera-tion was 10 million kilowatt-hours, compared to 15 million kWh in FY 2013 .

132
OTHER PROJECTS CENTRAL ARIzONA
Power Sales and RevenuesCustomer
FY 2014 FY 2013
Energy (MWh) Revenue ($) Energy (MWh) Revenue ($)MUNICIPALITIESArizonaWickenburg 13,564 597,743 13,858 441,170 Arizona subtotal 13,564 597,743 13,858 441,170 CaliforniaGlendale 80 2,366 0 0 Los Angeles 478 13,684 0 0 California subtotal 558 16,050 0 0 Municipalities subtotal 14,122 613,793 13,858 441,170 COOPERATIVESArizonaArizona Electric Power Cooperative 8,938 269,116 6,743 150,181 Tuscon Electric Power Company 0 0 220 5,280 Arizona subtotal 8,938 269,116 6,963 155,461 Cooperatives subtotal 8,938 269,116 6,963 155,461 STATE AGENCIESArizonaSalt River Project 471,887 42,152,568 506,776 40,377,299 Arizona subtotal 471,887 42,152,568 506,776 40,377,299 State agencies subtotal 471,887 42,152,568 506,776 40,377,299 IRRIGATION DISTRICTSArizonaAguila Irrigation District 23,575 835,520 16,814 535,426 Buckeye Water Conservation District 11,794 410,108 10,316 332,422 Electrical District No. 4 0 0 6,260 172,431 Electrical District No. 5 0 0 2,097 57,785 Electrical District No. 7 14,203 443,385 13,917 423,592 Electrical District No. 8 237,159 8,629,158 199,759 6,676,851 Harquahala Valley Power District 72,216 2,617,821 60,350 2,024,437 Maricopa County Water 19,702 626,251 11,847 366,001 McMullen Valley Water Conservation District 55,336 1,989,559 47,619 1,613,051 Roosevelt Irrigation District 35,013 1,240,972 32,363 1,061,666 Tonopah Irrigation District 19,111 670,547 17,791 595,420 Arizona subtotal 488,109 17,463,321 419,133 13,859,082 Irrigation districts subtotal 488,109 17,463,321 419,133 13,859,082 INVESTOR-OWNED UTILITIESArizonaArizona Public Service Company 72,949 2,324,268 156,746 5,061,581 Central Arizona Water Conservation 43,412 1,249,801 17,064 426,282 Tuscon Electric Power Company 1,171 25,717 0 0 Arizona subtotal 117,532 3,599,786 173,810 5,487,863
Power Sales and Revenues, continuedCustomer
FY 2014 FY 2013
Energy (MWh) Revenue ($) Energy (MWh) Revenue ($)NevadaNevada Power Company 0 0 1,198 29,150 Nevada subtotal 0 0 1,198 29,150 Investor-owned utilities subtotal 117,532 3,599,786 175,008 5,517,013 POWER MARKETERSArizonaTenaska Power Services 0 0 5,567 114,420 Arizona subtotal 0 0 5,567 114,420 FloridaGila River LP 41 861 0 0 Florida subtotal 41 861 0 0 MarylandConstellation Energy Commodities Group 0 0 52,116 1,344,314 Maryland subtotal 0 0 52,116 1,344,314 NebraskaTenaska Power Services 0 0 5,265 126,300 Nebraska subtotal 0 0 5,265 126,300 NevadaNevada Power Company 8,527 235,141 0 0 Sierra Pacific Power Company 23 552 0 0 Nevada subtotal 8,550 235,693 0 0 New YorkMorgan Stanley 1,817 47,067 0 0 New York subtotal 1,817 47,067 0 0 TexasEDF Trading North America 0 0 30,613 859,074 Macquarie Energy 278,010 13,121,148 377,724 9,503,328 Texas subtotal 278,010 13,121,148 408,337 10,362,402 INTERNATIONALCanadaPowerex 0 0 4,150 84,978 Canada subtotal 0 0 4,150 84,978 Power marketers subtotal 288,418 13,404,769 475,435 12,032,414 INTERPROJECTColoradoWestern (Desert Southwest region) 273 6,186 28 728 Colorado subtotal 273 6,186 28 728 Interproject subtotal 273 6,186 28 728 Central Arizona total1, 2 1,389,279 77,509,539 1,597,201 72,383,167 1 Central Arizona sales of electric power are classified as 'other' in the combining power system statements of revenues and expenses and accumulated net
revenues because Western is not responsible for CAP's repayment.2 Power revenues as presented in this table are $3.4 million greater than and $5.1 million less than the FY 2014 and FY 2013 sales of electric power presented
in the statements of revenues and expenses and accumulated net revenues, respectively, due to variances between revenue accrual estimates and actual revenue along with other miscellaneous transactions.

133
OTHER PROJECTS CENTRAL ARIzONA
PowerplantsState/plant name Operating agency River Initial in-service date Existing number of units Installed capability
FY 2014 (MW)Actual operating capability (MW) Net generation (GWh)
July 1, 2013 July 1, 2014 FY 2013 FY 2014
Arizona
Navajo SRP N/A May 1974 3 574 547 547 4,349 4,423
Central Arizona total 3 574 547 547 4,349 4,423
Facilities, SubstationsFacility FY 2014 FY 2013
Substations
Number of substations 9 9
Number of transformers 2 0
Transformer capacity (kVA) 60,000 0
Buildings and communications sites
Number of buildings 2 2
Number of communication sites 11 11
Transmission Services Revenues1
Transmission serviceFY 20141 FY 20132
Revenue ($) Revenue ($)
Wheeling and transmission service 0 0
Firm point-to-point transmission service 4,933,603 5,525,047
Nonfirm point-to-point transmission service 1,092 271
Short-term firm point-to-point 100,674 0
Transmission services total2 5,035,369 5,525,3181 Transmission service revenues as presented in this table are $0.6 million less than the FY 2014 transmission and other operating revenues presented in the
statements of revenues and expenses and accumulated net revenues due to the following: $0.5 million in reliability sales excluded from the transmission revenue table and $0.1 million in variances between transmission revenue accrual estimates and actual transmission revenue.
2 Transmission service revenues as presented in this table are $0.8 million less than the FY 2013 transmission and other operating revenues presented in the statements of revenues and expenses and accumulated net revenues due to the following: $0.2 million in reliability sales excluded from the transmission revenue table and $0.2 million in transmission losses excluded from the transmission revenue table.
Ancillary Services Revenues1, 2
Ancillary service FY 2014 FY 2013
Revenue ($) Revenue ($)
Scheduling and dispatch service 0 0
Regulation and frequency response 88,671 146,129
Ancillary services total3 88,671 146,1291 The transmission revenues table, ancillary services revenues table and all reconciling items need to be added together to agree to the total transmission and
other operating revenues presented in the statements of revenues and expenses and accumulated net revenues. 2 Excludes $4.6 million in other revenues consisting of the following: $4.3 million in reimbursable O&M work and $318,000 in other miscellaneous minor
transactions. 3 Ancillary services revenues as presented in this table are $9,000 less than the FY 2014 transmission and other operating revenues amount presented in
the statements of revenues and expenses and accumulated net revenues due to variances between ancillary services revenue accrual estimates and actual ancillary services revenue amounts along with other miscellaneous minor transactions.
Customers by State and Customer CategoryState/customer category
FY 2014 FY 2013
Long-term Other Total Long-term Other TotalArizonaMunicipalities 0 1 1 0 1 1Cooperatives 0 1 1 0 2 2State agencies 0 1 1 0 1 1Irrigation districts 0 9 9 0 11 11Investor-owned utilities 0 3 3 0 2 2Power marketers 0 0 0 0 1 1Arizona subtotal 0 15 15 0 18 18CaliforniaMunicipalities 0 2 2 0 0 0California subtotal 0 2 2 0 0 0FloridaPower marketers 0 1 1 0 0 0Florida subtotal 0 1 1 0 0 0MarylandPower marketers 0 0 0 0 1 1Maryland subtotal 0 0 0 0 1 1NebraskaPower marketers 0 0 0 0 1 1Nebraska subtotal 0 0 0 0 1 1NevadaInvestor-owned utilities 0 0 0 0 1 1Power marketers 0 2 2 0 0 0Nevada subtotal 0 2 2 0 1 1New YorkPower marketers 0 1 1 0 0 0New York subtotal 0 1 1 0 0 0TexasPower marketers 0 1 1 0 2 2Texas subtotal 0 1 1 0 2 2INTERNATIONALCanadaPower marketers 0 0 0 0 1 1Canada subtotal 0 0 0 0 1 1Central Arizona subtotal 0 22 22 0 24 24Interproject 0 1 1 0 1 1Central Arizona total 0 23 23 0 25 25

134
OTHER PROJECTS CENTRAL ARIzONA
Balance SheetsAs of Sept. 30, 2014 and 2013 (in thousands)
FY 2014 FY 2013
Western Reclamation Total Western Reclamation Total
Assets
Cash ($1,206) $0 ($1,206) ($142) $0 ($142)
Accounts receivable, net 7,836 0 7,836 10,253 0 10,253
Regulatory assets 349 0 349 292 0 292
Other assets 804 0 804 898 0 898
Total assets 7,783 0 7,783 11,301 0 11,301
Liabilities:
Customer advances and other liabilities 6,921 0 6,921 10,489 0 10,489
Accounts payable 80 0 80 44 0 44
Total liabilities 7,001 0 7,001 10,533 0 10,533
Capitalization:
Payable to U.S. Treasury 0 0 0 0 0 0
Accumulated net revenues 782 0 782 768 0 768
Total capitalization 782 0 782 768 0 768
Total liabilities and capitalization $7,783 $0 $7,783 $11,301 $0 $11,301
Statements of Revenues and Expenses and Accumulated Net RevenuesFor the years ended Sept. 30, 2014 and 2013 (in thousands)
FY 2014 FY 2013
Western Reclamation Total Western Reclamation Total
Operating revenues:
Sales of electric power $74,126 $0 $74,126 $77,528 $0 $77,528
Transmission and other operating revenues 11,257 0 11,257 11,110 0 11,110
Gross operating revenues 85,383 0 85,383 88,638 0 88,638
Income transfers, net (78,533) 0 (78,533) (83,583) 0 (83,583)
Total operating revenues 6,850 0 6,850 5,055 0 5,055
Operating expenses:
Operation and maintenance 4,479 0 4,479 3,416 0 3,416
Purchase power 1,348 0 1,348 1,029 0 1,029
Adminstrative and general 1,197 0 1,197 954 0 954
Total operating expenses 7,024 0 7,024 5,399 0 5,399
Net operating revenues (deficit) (174) 0 (174) (344) 0 (344)
Interest expenses:
Interest on payable to U.S. Treasury 12 0 12 8 0 8
Allowance for funds used during construction 0 0 0 0 0 0
Net interest on payable to U.S. Treasury 12 0 12 8 0 8
Net revenues (deficit) (186) 0 (186) (352) 0 (352)
Accumulated net revenues (deficit):
Balance, beginning of year 768 0 768 972 0 972
Change in capitalization 200 0 200 148 0 148
Balance, end of year $782 $0 $782 $768 $0 $768
Active Rate Actions
Rate order number Project Type of rate action Date of notice of public participation
Rate schedule designation
Effective date of rate(first day of first full billing
period)
Annual incremental($ in thousands) Notes Date submitted to FERC Date of FERC confirmation
WAPA-158 Central Arizona Extension 3/26/2013 CAP-FT2, CAP-NFT2, CAP-NITS2 1/1/2013 N/A None 3/25/2013 N/A
Active Transmission Services Rate ProvisionsFiscal year Rate schedule designation Rate
2014 CAP-FT2 - Firm point-to-point transmission service $12.32 kW/year
2014 CAP-NFT2 - Nonfirm point-to-point transmission service 1.41 mills/kWh
2014 CAP-NITS2 - Network integration transmission service Customer load ratio share x 1/12 annual revenue requirement.
Summary by Customer CategoryCustomer category
FY 2014 FY 2013
Long-term Other Total Long-term Other TotalMunicipalities 0 3 3 0 1 1Cooperatives 0 1 1 0 2 2State agencies 0 1 1 0 1 1Irrigation districts 0 9 9 0 11 11Investor-owned utilities 0 3 3 0 3 3Power marketers 0 5 5 0 6 6Central Arizona subtotal 0 22 22 0 24 24Interproject 0 1 1 0 1 1Central Arizona total 0 23 23 0 25 25

135
OTHER PROJECTS FALCON-AMISTAD
PowerplantsState/plant name Operating agency River Initial in-service date Existing number of units Installed capability
FY 2014 (MW)Actual operating capability (MW) Net generation (GWh)
July 1, 2013 July 1, 2014 FY 2013 FY 2014
Texas
Amistad IBWC Rio Grande Jun 1983 2 66 0 50 66 76
Falcon IBWC Rio Grande Oct 1954 3 32 8 8 56 41
Falcon-Amistad total 5 98 8 58 122 117
Active Rate ActionsRate order number Project Type of rate action Date of notice of public
participationRate schedule designation
Effective date of rate(first day of first full billing period)
Annual incremental($ in thousands) Notes Date submitted to FERC Date of FERC confirmation
WAPA-143 Falcon-Amistad Renewal N/A N/A 6/8/2009 N/A Expires 6/7/2014 6/17/2009 12/17/2009
WAPA-164 Falcon-Amistad Extension N/A N/A 6/8/2014 N/A 5-year extension 5/2/2014 Pending
Active Marketing PlanProject Expiration date
Falcon-Amistad 6/8/2033
Power Sales and RevenuesCustomer
FY 2014 FY 2013
Energy (MWh) Revenue ($) Energy (MWh) Revenue ($)
COOPERATIVES
Texas
South Texas Electric Cooperative 115,713 6,844,812 159,142 8,084,124
Texas subtotal 115,713 6,844,812 159,142 8,084,124
Cooperatives subtotal 115,713 6,844,812 159,142 8,084,124
Falcon-Amistad total1 115,713 6,844,812 159,142 8,084,124 1 Power revenues as presented in this table agree to the FY 2014 and FY 2013 sales of electric power presented in the statements of revenues and expenses and
accumulated net revenues.

136
OTHER PROJECTS FALCON-AMISTAD
Status of Repayment (dollars in thousands)Cumulative 20131 ($) Adjustment ($) Annual 20142 ($) Cumulative 2014
REVENUE:
Gross operating revenue 144,161 0 6,844 151,005
Income transfers (net) 243 0 0 243
Total operating revenue 144,404 0 6,844 151,248
ExPENSES:
O&M and other 53,785 0 2,542 56,327
Purchase power and other 0 0 0 0
Interest
Federally financed 69,425 0 1,828 71,253
Non-Federally financed 0 0 0 0
Total interest 69,425 0 1,828 71,253
Total expense 123,210 0 4,370 127,580
(Deficit)/surplus revenue3 2,174 0 1,739 3,913
INVESTMENT:
Federally financed power 48,192 0 158 48,350
Non-federally financed power 0 0 0 0
Nonpower 0 0 0 0
Total investment 48,192 0 158 48,350
INVESTMENT REPAID:
Federally financed power4 19,020 0 735 19,755
Non-federally financed power 0 0 0 0
Nonpower 0 0 0 0
Total investment repaid 19,020 0 735 19,755
INVESTMENT UNPAID:
Federally financed power 29,172 0 (577) 28,595
Non-federally financed power 0 0 0 0
Nonpower 0 0 0 0
Total investment unpaid 29,172 0 (577) 28,595
FUND BALANCES:
Colorado River Development 0 0 0 0
Working capital 0 0 0 0
PERCENT OF INVESTMENT REPAID TO DATE:
Federal 39.47% 40.86%
Non-federal N/A N/A
Nonpower N/A N/A1 This column ties to the cumulative FY 2013 numbers on Page 136 of the FY 2013 Statistical Appendix.2 Based on FY 2014 final audited financial statements.3 Surplus amount reflects $1,290,623 unliquidated obligations (International Boundary Waters Commission) and $449,533 credit to customer (South Texas Electric
Cooperative).4 Required payment as scheduled by compound interest amortization.

137
OTHER PROJECTS FALCON-AMISTAD
Balance SheetsAs of Sept. 30, 2014 and 2013 (in thousands)
FY 2014 FY 2013
Western IBWC Total Western IBWC Total
Assets
Completed utility plant $0 $48,301 $48,301 $0 $48,143 $48,143
Accumulated depreciation 0 (27,529) (27,529) 0 (26,651) (26,651)
Net completed plant 0 20,772 20,772 0 21,492 21,492
Construction work-in-progress 0 0 0 0 68 68
Net utility plant 0 20,772 20,772 0 21,560 21,560
Cash 12,960 0 12,960 10,369 0 10,369
Accounts receivable, net 570 0 570 674 0 674
Regulatory assets 2 87 89 1 101 102
Other assets 0 73 73 0 124 124
Total assets 13,532 20,932 34,464 11,044 21,785 32,829
Liabilities:
Customer advances and other liabilities 2 231 233 1 349 350
Accounts payable 164 144 308 317 2 319
Total liabilities 166 375 541 318 351 669
Capitalization:
Payable to U.S. Treasury 428 35,412 35,840 412 35,064 35,476
Accumulated net revenues (deficit) 12,938 (14,855) (1,917) 10,314 (13,630) (3,316)
Total capitalization 13,366 20,557 33,923 10,726 21,434 32,160
Total liabilities and capitalization $13,532 $20,932 $34,464 $11,044 $21,785 $32,829
Statements of Revenues and Expenses and Accumulated Net RevenuesFor the years ended Sept. 30, 2014 and 2013 (in thousands)
FY 2014 FY 2013
Western IBWC Total Western IBWC Total
Operating revenues:
Sales of electric power $6,845 $0 $6,845 $8,084 $0 $8,084
Gross operating revenues 6,845 0 6,845 8,084 0 8,084
Income transfers, net (3,999) 3,999 0 (5,620) 5,606 (14)
Total operating revenues 2,846 3,999 6,845 2,464 5,606 8,070
Operating expenses:
Operation and maintenance 20 2,458 2,478 13 3,034 3,047
Depreciation 0 878 878 0 873 873
Administration and general 5 60 65 3 63 66
Total operating expenses 25 3,396 3,421 16 3,970 3,986
Net operating revenues (deficit) 2,821 603 3,424 2,448 1,636 4,084
Interest expenses:
Interest on payable to U.S. Treasury 0 1,828 1,828 0 1,868 1,868
Net interest expenses 0 1,828 1,828 0 1,868 1,868
Net revenues (deficit) 2,821 (1,225) 1,596 2,448 (232) 2,216
Accumulated net revenues (deficit):
Balance, beginning of year 10,314 (13,630) (3,316) 7,882 (13,398) (5,516)
Change in capitalization (197) 0 (197) (16) 0 (16)
Balance, end of year $12,938 ($14,855) ($1,917) $10,314 ($13,630) ($3,316)

138
OTHER PROJECTS PACIFIC NW-SW INTERTIE
Facilities, SubstationsFacility FY 2014 FY 2013SubstationsNumber of substations 9 9Number of transformers 11 12Transformer capacity (kVA) 8,368,320 8,378,320Land (fee)Acres 315.72 315.72Hectares 127.82 127.82Land (easement)Acres 85.64 85.64Hectares 34.67 34.67Land (withdrawal)Acres 4,402.55 4,402.55Hectares 1,782.41 1,782.41Buildings and communications sitesNumber of buildings 14 14Number of communications sites 10 10
Transmission LinesVoltage rating
Arizona California Nevada Total
FY 2014 FY 2013 FY 2014 FY 2013 FY 2014 FY 2013 FY 2014 FY 2013500-kVCircuit miles 231.90 231.90 372.40 372.40 24.00 24.00 628.30 628.30 Circuit kilometers 373.13 373.13 599.19 599.19 38.62 38.62 1,010.94 1,010.94 Acres 5,361.79 5,361.79 5,176.65 5,176.65 2,214.91 2,214.91 12,753.35 12,753.35 Hectares 2,170.77 2,170.77 2,095.81 2,095.81 896.73 896.73 5,163.31 5,163.31 345-kVCircuit miles 226.50 226.50 0.00 0.00 10.50 10.50 237.00 237.00 Circuit kilometers 364.44 364.44 0.00 0.00 16.89 16.89 381.33 381.33 Acres 4,117.50 4,117.50 0.00 0.00 185.40 185.40 4,302.90 4,302.90 Hectares 1,667.01 1,667.01 0.00 0.00 75.06 75.06 1,742.07 1,742.07 230-kV Circuit miles 74.80 74.80 33.60 33.60 0.00 0.00 108.40 108.40 Circuit kilometers 120.35 120.35 54.06 54.06 0.00 0.00 174.41 174.41 Acres 384.77 384.77 572.84 572.84 0.00 0.00 957.61 957.61 Hectares 155.78 155.78 231.92 231.92 0.00 0.00 387.70 387.70 69-kV and belowCircuit miles 0.00 0.00 0.00 0.00 0.00 0.00 0.00 0.00 Circuit kilometers 0.00 0.00 0.00 0.00 0.00 0.00 0.00 0.00 Acres 0.00 0.00 0.00 0.00 278.78 278.78 278.78 278.78 Hectares 0.00 0.00 0.00 0.00 112.87 112.87 112.87 112.87 TotalCircuit miles 533.20 533.20 406.00 406.00 34.50 34.50 973.70 973.70 Circuit kilometers 857.92 857.92 653.25 653.25 55.51 55.51 1,566.68 1,566.68 Acres 9,864.06 9,864.06 5,749.49 5,749.49 2,679.09 2,679.09 18,292.64 18,292.64 Hectares 3,993.56 3,993.56 2,327.73 2,327.73 1,084.66 1,084.66 7,405.95 7,405.95
Transmission Services RevenuesTransmission service
FY 20141 FY 20132
Revenue ($) Revenue ($)
Firm point-to-point transmission service 30,051,212 26,739,037
Nonfirm point-to-point transmission service 1,121,433.00 630,803
Short term point-to-point transmission service 1,420,853.00 1,315,858
Transmission services total 32,593,498 28,685,6981 Transmission service revenues as presented in this table are $7.3 million less than the FY 2014 transmission and other operating revenues presented in the
statements of revenues and expenses and accumulated net revenues due to the following: $1.2 million in reliability sales excluded from the transmission revenue table; $6.9 million in transmission losses excluded from the transmission revenue table; -$0.4 million in transfers to Parker-Davis; and -$0.4 million in variances between transmission revenue accrual estimates and actual transmission revenue.
2 Transmission service revenues as presented in this table are $5.8 million less than the FY 2013 transmission and other operating revenues presented in the statements of revenues and expenses and accumulated net revenues due to the following: $1.6 million in reliability sales excluded from the transmission revenue table; $4.3 million in transmission losses excluded from the transmission revenue table; and -$0.1 million in variances between transmission revenue accrual estimates and actual transmission revenue.
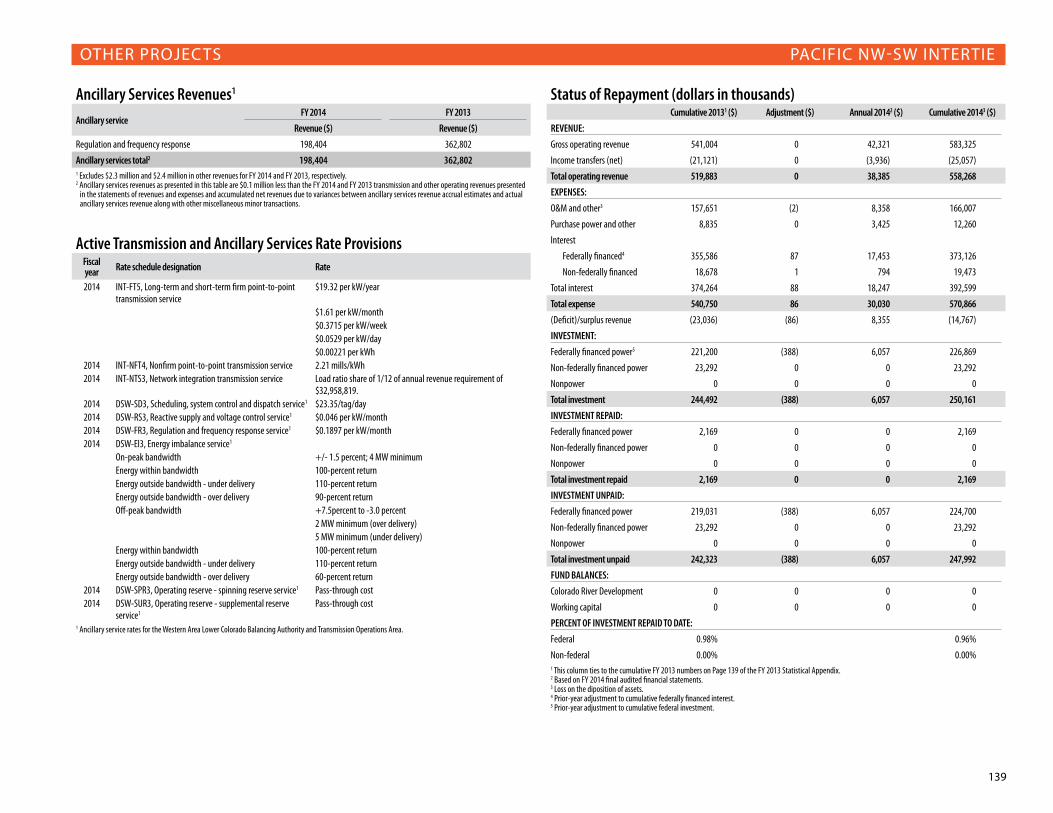
139
OTHER PROJECTS PACIFIC NW-SW INTERTIE
Status of Repayment (dollars in thousands)Cumulative 20131 ($) Adjustment ($) Annual 20142 ($) Cumulative 20143 ($)
REVENUE:
Gross operating revenue 541,004 0 42,321 583,325
Income transfers (net) (21,121) 0 (3,936) (25,057)
Total operating revenue 519,883 0 38,385 558,268
ExPENSES:
O&M and other3 157,651 (2) 8,358 166,007
Purchase power and other 8,835 0 3,425 12,260
Interest
Federally financed4 355,586 87 17,453 373,126
Non-federally financed 18,678 1 794 19,473
Total interest 374,264 88 18,247 392,599
Total expense 540,750 86 30,030 570,866
(Deficit)/surplus revenue (23,036) (86) 8,355 (14,767)
INVESTMENT:
Federally financed power5 221,200 (388) 6,057 226,869
Non-federally financed power 23,292 0 0 23,292
Nonpower 0 0 0 0
Total investment 244,492 (388) 6,057 250,161
INVESTMENT REPAID:
Federally financed power 2,169 0 0 2,169
Non-federally financed power 0 0 0 0
Nonpower 0 0 0 0
Total investment repaid 2,169 0 0 2,169
INVESTMENT UNPAID:
Federally financed power 219,031 (388) 6,057 224,700
Non-federally financed power 23,292 0 0 23,292
Nonpower 0 0 0 0
Total investment unpaid 242,323 (388) 6,057 247,992
FUND BALANCES:
Colorado River Development 0 0 0 0
Working capital 0 0 0 0
PERCENT OF INVESTMENT REPAID TO DATE:
Federal 0.98% 0.96%
Non-federal 0.00% 0.00%1 This column ties to the cumulative FY 2013 numbers on Page 139 of the FY 2013 Statistical Appendix. 2 Based on FY 2014 final audited financial statements.3 Loss on the diposition of assets.4 Prior-year adjustment to cumulative federally financed interest.5 Prior-year adjustment to cumulative federal investment.
Ancillary Services Revenues1
Ancillary service FY 2014 FY 2013
Revenue ($) Revenue ($)
Regulation and frequency response 198,404 362,802
Ancillary services total2 198,404 362,8021 Excludes $2.3 million and $2.4 million in other revenues for FY 2014 and FY 2013, respectively.2 Ancillary services revenues as presented in this table are $0.1 million less than the FY 2014 and FY 2013 transmission and other operating revenues presented
in the statements of revenues and expenses and accumulated net revenues due to variances between ancillary services revenue accrual estimates and actual ancillary services revenue along with other miscellaneous minor transactions.
Active Transmission and Ancillary Services Rate ProvisionsFiscal year Rate schedule designation Rate
2014 INT-FT5, Long-term and short-term firm point-to-point transmission service
$19.32 per kW/year
$1.61 per kW/month$0.3715 per kW/week$0.0529 per kW/day$0.00221 per kWh
2014 INT-NFT4, Nonfirm point-to-point transmission service 2.21 mills/kWh2014 INT-NTS3, Network integration transmission service Load ratio share of 1/12 of annual revenue requirement of
$32,958,819.2014 DSW-SD3, Scheduling, system control and dispatch service1 $23.35/tag/day2014 DSW-RS3, Reactive supply and voltage control service1 $0.046 per kW/month2014 DSW-FR3, Regulation and frequency response service1 $0.1897 per kW/month2014 DSW-El3, Energy imbalance service1
On-peak bandwidth +/- 1.5 percent; 4 MW minimumEnergy within bandwidth 100-percent returnEnergy outside bandwidth - under delivery 110-percent returnEnergy outside bandwidth - over delivery 90-percent returnOff-peak bandwidth +7.5percent to -3.0 percent
2 MW minimum (over delivery)5 MW minimum (under delivery)
Energy within bandwidth 100-percent returnEnergy outside bandwidth - under delivery 110-percent returnEnergy outside bandwidth - over delivery 60-percent return
2014 DSW-SPR3, Operating reserve - spinning reserve service1 Pass-through cost2014 DSW-SUR3, Operating reserve - supplemental reserve
service1Pass-through cost
1 Ancillary service rates for the Western Area Lower Colorado Balancing Authority and Transmission Operations Area.

140
OTHER PROJECTS PACIFIC NW-SW INTERTIE
Balance SheetsAs of Sept. 30, 2014 and 2013 (in thousands)
FY 2014 FY 2013
Western Reclamation Total Western Reclamation Total
Assets
Completed utility plant $246,309 $0 $246,309 $240,330 $0 $240,330
Accumulated depreciation (131,915) 0 (131,915) (126,249) 0 (126,249)
Net completed plant 114,394 0 114,394 114,081 0 114,081
Construction work-in-progress 8,613 0 8,613 7,133 0 7,133
Net utility plant 123,007 0 123,007 121,214 0 121,214
Cash 61,313 0 61,313 60,210 0 60,210
Accounts receivable (164) 0 (164) 384 0 384
Regulatory assets 6,282 0 6,282 7,268 0 7,268
Other assets 443 0 443 701 0 701
Total assets 190,881 0 190,881 189,777 0 189,777
Liabilities:
Long-term liabilities 8,332 0 8,332 10,138 0 10,138
Customer advances and other liabilities 1,378 0 1,378 1,549 0 1,549
Accounts payable 254 0 254 219 0 219
Environmental cleanup liabilities 337 0 337 331 0 331
Total liabilities 10,301 0 10,301 12,237 0 12,237
Capitalization:
Payable to U.S. Treasury 328,898 0 328,898 328,470 0 328,470
Accumulated net deficit (148,318) 0 (148,318) (150,930) 0 (150,930)
Total capitalization 180,580 0 180,580 177,540 0 177,540
Total liabilities and capitalilzation $190,881 $0 $190,881 $189,777 $0 $189,777
Statements of Revenues and Expenses and Accumulated Net RevenuesFor the years ended Sept. 30, 2014 and 2013 (in thousands)
FY 2014 FY 2013
Western Reclamation Total Western Reclamation Total
Operating revenues:
Transmission and other operating revenues $42,321 $0 $42,321 $37,340 $0 $37,340
Gross operating revenues 42,321 0 42,321 37,340 0 37,340
Income transfers, net (3,936) 0 (3,936) (2,174) 0 (2,174)
Total operating revenues 38,385 0 38,385 35,166 0 35,166
Operating expenses:
Operation and maintenance 6,769 0 6,769 6,880 0 6,880
Purchased power 3,425 0 3,425 3,166 0 3,166
Depreciation 5,742 0 5,742 5,746 0 5,746
Administration and general 1,590 0 1,590 1,448 0 1,448
Total operating expenses 17,526 0 17,526 17,240 0 17,240
Net operating revenues 20,859 0 20,859 17,926 0 17,926
Interest expenses:
Interest on payable to U.S. Treasury 17,801 0 17,801 18,017 0 18,017
Allowance for funds used during construction (348) 0 (348) (338) 0 (338)
Net interest on payable to U.S. Treasury 17,453 0 17,453 17,679 0 17,679
Interest on long-term liabilities 794 0 794 941 0 941
Net interest expenses 18,247 0 18,247 18,620 0 18,620
Net deficit 2,612 0 2,612 (694) 0 (694)
Accumulated net deficit:
Balance, beginning of year (150,930) 0 (150,930) (150,236) 0 (150,236)
Balance, end of year ($148,318) $0 ($148,318) ($150,930) $0 ($150,930)

141
OTHER PROJECTS PROVO RIVER
PowerplantsState/plant name Operating agency River Initial in-service date Existing number of units Installed capability
FY 2014 (MW)Actual operating capability (MW) Net generation (GWh)
July 1, 2013 July 1, 2014 FY 2013 FY 2014
Utah
Deer Creek PRWUA Provo Feb 1958 2 5 5 5 18 18
Provo River total 2 5 5 5 18 18
Active Rate ActionsRate order number Project Type of rate action Date of notice of public
participation Rate schedule designation Effective date of rate (first day of first billing period)
Annual incremental ($ in thousands) Notes Date submitted to FERC Date of FERC
confirmation
WAPA-149 Provo Renewal N/A N/A 4/1/2010 N/A Expires 3/31/2015 2/2/2010 11/2/2010
Active Marketing PlanProject Expiration date
Provo River 9/30/2024
Power Sales and RevenuesCustomer
FY 2014 FY 2013
Energy (MWh) Revenue ($) Energy (MWh) Revenue ($)
MUNICIPALITIES
Utah
Heber Light and Power 728 16,328 958 18,492
Utah Associated Municipal Power 2,872 65,310 3,764 73,969
Utah Municipal Power Agency 8,522 190,489 13,609 215,743
Utah subtotal 12,122 272,127 18,331 308,204
Municipalities subtotal 12,122 272,127 18,331 308,204
Provo River total1 12,122 272,127 18,331 308,204 1 Power revenues as presented in this table differ from the FY 2014 sales of electric power presented in the statements of revenues and expenses and
accumulated net revenues due to variances between revenue accrual estimates and actual revenue.

142
OTHER PROJECTS PROVO RIVER
Status of Repayment (dollars in thousands) Cumulative 20131 ($) Adjustment ($) Annual 20142 ($) Cumulative 20143 ($)
REVENUE:
Gross operating revenue 10,147 23 249 10,419
Income transfers (net) 0 0 0 0
Total operating revenue 10,147 23 249 10,419
ExPENSES:
O&M and other3 6,890 0 232 7,122
Purchase power and other 203 0 0 203
Interest
Federally financed 927 0 0 927
Non-federally financed 0 0 0 0
Total interest 927 0 0 927
Total expense 8,020 0 232 8,252
(Deficit)/surplus revenue 195 23 18 235
INVESTMENT:
Federally financed power 1,740 0 0 1,740
Non-federally financed power 0 0 0 0
Nonpower 192 0 0 192
Total investment 1,932 0 0 1,932
INVESTMENT REPAID:
Federally financed power 1,740 0 0 1,740
Non-federally financed power 0 0 0 0
Nonpower 192 0 0 192
Total investment repaid 1,932 0 0 1,932
Investment unpaid:
Federally financed power 0 0 0 0
Non-federally financed power 0 0 0 0
Nonpower 0 0 0 0
Total investment unpaid 0 0 0 0
FUND BALANCES:
Colorado River Development 0 0 0 0
Working capital 0 0 0 0
PERCENT OF INVESTMENT REPAID TO DATE:
Federal 100.00% 100.00%
Non-federal N/A N/A
Nonpower 100.00% 100.00%1 This column ties to the cumulative FY 2013 numbers on Page 142 of the FY 2013 Statistical Appendix.2 Based on FY 2014 final audited financial statements.3 Difference in revenues due to timing issue between billing and finance.

143
OTHER PROJECTS PROVO RIVER
Balance SheetsAs of Sept. 30, 2014 and 2013 (in thousands)
FY 2014 FY 2013
Western Reclamation Total Western Reclamation Total
Assets
Completed utility plant $179 $1,505 $1,684 $179 $1,505 $1,684
Accumulated depreciation (63) (200) (263) (58) (190) (248)
Net completed plant 116 1,305 1,421 121 1,315 1,436
Construction work-in-progress 0 639 639 0 220 220
Net utility plant 116 1,944 2,060 121 1,535 1,656
Cash 0 707 707 1 1,056 1,057
Accounts receivable, net 0 0 0 26 0 26
Regulatory assets 1 1 2 1 1 2
Other assets 0 0 0 0 0 0
Total assets 117 2,652 2,769 149 2,592 2,741
Liabilities:
Customer advances and other liabilities 1 1 2 2 123 125
Accounts payable 0 44 44 0 23 23
Total liabilities 1 45 46 2 146 148
Capitalization:
Payable to U.S. Treasury 5,293 (3,319) 1,974 5,301 (3,456) 1,845
Accumulated net revenues (deficit) (5,177) 5,926 749 (5,154) 5,902 748
Total capitalization 116 2,607 2,723 147 2,446 2,593
Total liabilities and capitalization $117 $2,652 $2,769 $149 $2,592 $2,741
Statements of Revenues and Expenses and Accumulated Net RevenuesFor the years ended Sept. 30, 2014 and 2013 (in thousands)
FY 2014 FY 2013
Western Reclamation Total Western Reclamation Total
Operating revenues:
Sales of electric power $249 $0 $249 $308 $0 $308
Gross operating revenues 249 0 249 308 0 308
Income transfers, net (262) 262 0 (295) 295 0
Total operating revenues (13) 262 249 13 295 308
Operating expenses:
Operation and maintenance 4 227 231 6 103 109
Depreciation 4 10 14 4 (406) (402)
Administration and general 2 0 2 3 0 3
Total operating expenses 10 237 247 13 (303) (290)
Net operating revenues (deficit) (23) 25 2 0 598 598
Interest expenses:
Interest on payable to U.S. Treasury 0 9 9 0 2 2
Allowance for funds used during construction 0 (8) (8) 0 (2) (2)
Net interest expenses 0 1 1 0 0 0
Net revenues (deficit) (23) 24 1 0 598 598
Accumulated net revenues (deficit):
Balance, beginning of year (5,154) 5,902 748 (5,154) 5,304 150
Irrigation assistance 0 0 0 0 0 0
Balance, end of year ($5,177) $5,926 $749 ($5,154) $5,902 $748

144
OTHER PROJECTS WASHOE
Nonfirm Power Rate ProvisionsFiscal year Rate schedule
designationCapacity charge
($/kW of billing demand)Energy charge not in excess of
delivery obligations Effective date Annual composite rate
2014 SNF-7 NoneFormula rate: Pursuant to contract, change monthly based on market
10/1/2013 N/A
Active Marketing PlanProject Expiration date
Washoe 12/31/2024
Active Rate ActionsRate order number Project Type of rate action Date of notice of public
participationRate schedule designation
Effective date of rate(first day of first full billing period)
Annual incremental($ in thousands) Notes Date submitted to FERC Date of FERC confirmation
WAPA-160 Washoe Rate extension 2/22/2013 SNF-7 8/1/2008 N/A FERC confirmed Washoe's formula rate extension on Sept. 5, 2013. Therefore, the formula rate is extended until Sept. 30, 2017.
4/24/2013 9/5/2013
Power Sales and RevenuesCustomer
FY 2014 FY 2013
Energy (MWh) Revenue ($) Energy (MWh) Revenue ($)
MUNICIPALITIES
California
Truckee-Donner Public Utilities District and City of Fallon 9,887 211,983 14,512 241,270
California subtotal 9,887 211,983 14,512 241,270
Municipalities subtotal 9,887 211,983 14,512 241,270
Washoe total1, 2 9,887 211,983 14,512 241,270 1 Power sales from Washoe are nonfirm and under a long-term contract.2 Power revenues as presented in this table differ from the FY 2014 and FY 2013 sales of electric power presented in the statements of revenues and expenses
and accumulated net revenues due to variances between revenue accrual estimates and actual revenue along with other miscellaneous transactions.
PowerplantsState/plant name Operating agency River Initial in-service date Existing number of units Installed capability
FY 2014 (MW)Actual operating capability (MW) Net generation (GWh)
July 1, 2013 July 1, 2014 FY 2013 FY 2014
California
Stampede Reclamation Little Truckee Dec 1986 2 4 3 3 15 10
Washoe total 2 4 3 3 15 10

145
OTHER PROJECTS WASHOE
Status of Repayment (dollars in thousands) Cumulative 20131 ($) Adjustment ($) Annual 20142 ($) Cumulative 2014 ($)
REVENUE:
Gross operating revenue 10,788 0 687 11,475
Income transfers (net) 0 0 0 0
Total operating revenue 10,788 0 687 11,475
ExPENSES:
O&M and other 2,625 0 13 2,638
Purchase power and other 3,064 0 207 3,271
Interest
Federally financed 5,888 0 100 5,988
Non-federally financed 0 0 0 0
Total interest 5,888 0 100 5,988
Total expense 11,577 0 320 11,897
(Deficit)/surplus revenue (789) 0 367 (422)
INVESTMENT:
Federally financed power 2,749 (108) 0 2,641
Non-federally financed power 0 0 0 0
Nonpower 0 0 0 0
Total investment 2,749 (108) 0 2,641
INVESTMENT REPAID:
Federally financed power 0 0 0 0
Non-federally financed power 0 0 0 0
Nonpower 0 0 0 0
Total investment repaid 0 0 0 0
INVESTMENT UNPAID:
Federally financed power 2,749 (108) 0 2,641
Non-federally financed power 0 0 0 0
Nonpower 0 0 0 0
Total investment unpaid 2,749 (108) 0 2,641
FUND BALANCES:
Colorado River Development 0 0 0 0
Working capital 0 0 0 0
PERCENT OF INVESTMENT REPAID TO DATE:
Federal 0.00% 0.00%
Non-federal N/A N/A1 This column ties to the cumulative FY 2013 numbers on Page 145 of the FY 2013 Statistical Appendix.2 Based on FY 2014 final audited financial statements.

146
OTHER PROJECTS WASHOE
Balance SheetsAs of Sept. 30, 2014 and 2013 (in thousands)
FY 2014 FY 2013
Western Reclamation Total Western Reclamation Total
Assets
Completed utility plant $216 $8,459 $8,675 $216 $8,459 $8,675
Accumulated depreciation (132) (7,306) (7,438) (126) (7,185) (7,311)
Net completed plant 84 1,153 1,237 90 1,274 1,364
Net utility plant 84 1,153 1,237 90 1,274 1,364
Cash 4 0 4 4 36 40
Accounts receivable, net 108 0 108 141 0 141
Regulatory assets 1 86 87 0 46 46
Total assets 197 1,239 1,436 235 1,356 1,591
Liabilities:
Customer advances and other liabilities 0 109 109 0 72 72
Accounts payable 0 0 0 1 0 1
Total liabilities 0 109 109 1 72 73
Capitalization:
Payable to U.S. Treasury 61 2,927 2,988 106 3,422 3,528
Accumulated net revenues (deficit) 136 (1,797) (1,661) 128 (2,138) (2,010)
Total capitalization 197 1,130 1,327 234 1,284 1,518
Total liabilities and capitalization $197 $1,239 $1,436 $235 $1,356 $1,591
Statements of Revenues and Expenses and Accumulated Net RevenuesFor the years ended Sept. 30, 2014 and 2013 (in thousands)
FY 2014 FY 2013
Western Reclamation Total Western Reclamation Total
Operating revenues:
Sales of electric power $215 $0 $215 $208 $0 $208
Transmission and other operating revenues 472 0 472 472 0 472
Gross operating revenues 687 0 687 680 0 680
Income transfers, net (466) 466 0 (509) 509 0
Total operating revenues 221 466 687 171 509 680
Operating expenses:
Operation and maintenance (1) 13 12 (2) 71 69
Purchased power 207 0 207 197 0 197
Depreciation 5 121 126 5 (207) (202)
Administration and general 3 0 3 3 0 3
Total operating expenses 214 134 348 203 (136) 67
Net operating revenues (deficit) 7 332 339 (32) 645 613
Interest expenses:
Interest on payable to U.S. Treasury 2 98 100 3 124 127
Net interest expenses 2 98 100 3 124 127
Net revenues (deficit) 5 234 239 (35) 521 486
Accumulated net revenues (deficit):
Balance, beginning of year 128 (2,138) (2,010) 160 (2,739) (2,579)
Change in capitalization 3 107 110 3 80 83
Balance, end of year $136 ($1,797) ($1,661) $128 ($2,138) ($2,010)

Customer, long-termAn entity that has an allocation and received a bill at least one month out of Fiscal Year 2013 .
Long-term sales/revenueSales to, and revenue from, preference customers directly related to Western’s marketing plans and its purchases of power to support those deliveries, plus custom product .
(Note: custom product is a combination of products and services, excluding provisions for load growth, which may be made available by Western per customer request, using the customer’s base resource and supplemental purchases made by Western .)
Other sales/revenueSales or revenue not included in the long-term category—including all remaining short-term sales, regardless of whether or not they are firm, nonfirm, surplus, etc .
Pass-through cost sales/revenueSales or revenue that Western makes on behalf of its customers and for which Western passes through the full cost of those sales and the full benefit of that revenue, excluding
custom product .
TERM DEFINITIONS
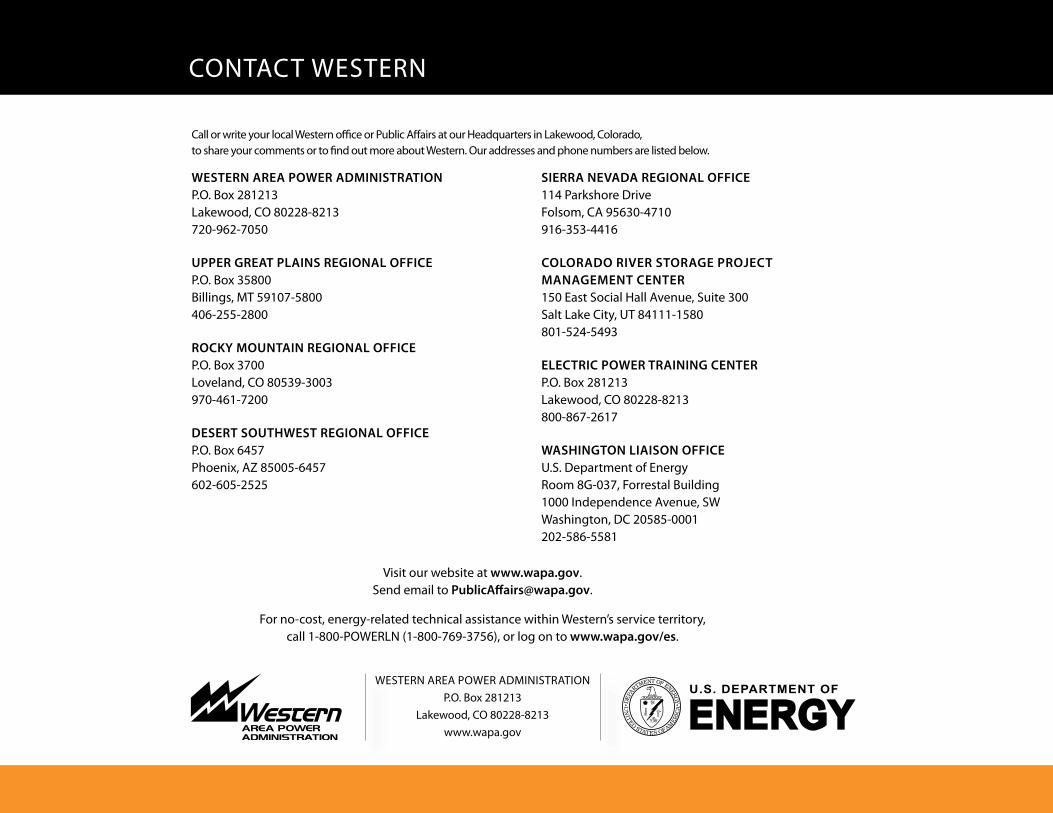
Call or write your local Western office or Public Affairs at our Headquarters in Lakewood, Colorado, to share your comments or to find out more about Western . Our addresses and phone numbers are listed below .
WESTERN AREA POWER ADMINISTRATIONP .O . Box 281213 Lakewood, CO 80228-8213 720-962-7050
UPPER GREAT PLAINS REGIONAL OFFICEP .O . Box 35800 Billings, MT 59107-5800 406-255-2800
ROCKY MOUNTAIN REGIONAL OFFICEP .O . Box 3700 Loveland, CO 80539-3003 970-461-7200
DESERT SOUTHWEST REGIONAL OFFICEP .O . Box 6457 Phoenix, Az 85005-6457 602-605-2525
SIERRA NEVADA REGIONAL OFFICE114 Parkshore Drive Folsom, CA 95630-4710 916-353-4416
COLORADO RIVER STORAGE PROjECT MANAGEMENT CENTER150 East Social Hall Avenue, Suite 300 Salt Lake City, UT 84111-1580 801-524-5493
ELECTRIC POWER TRAINING CENTERP .O . Box 281213 Lakewood, CO 80228-8213 800-867-2617
WASHINGTON LIAISON OFFICEU .S . Department of Energy Room 8G-037, Forrestal Building 1000 Independence Avenue, SW Washington, DC 20585-0001 202-586-5581
Visit our website at www.wapa.gov .Send email to [email protected] .
For no-cost, energy-related technical assistance within Western’s service territory, call 1-800-POWERLN (1-800-769-3756), or log on to www.wapa.gov/es .
CONTACT WESTERN
I
R
T OF ENEGYD
EPA
RTMEN
U
E
NIT
ED
STAT S OFA
ER
CA
M
WESTERN AREA POWER ADMINISTRATIONP .O . Box 281213
Lakewood, CO 80228-8213www .wapa .gov


![Powering agriculture with renewable energy [compatibility mode]](https://cdn.vdocuments.us/doc/165x107/58f9ada6760da3da068b9a7a/powering-agriculture-with-renewable-energy-compatibility-mode.jpg)


