
Power Development ProgramPower Development Program(Power Supply Plan)(Power Supply Plan)
Result of PDP(2004-2013)
- Ms. Thelma Ejercito (DOE)
Methodology, Workflow and Technical Issues
- Mr. Hiromi Sakakibara (JICA)

Work Sharing of the PDP? DOE : Main Player for Preparing the PDP
? Coordination of the schedule with related organizations ? Preparation of the PDP with the JICA study team? Documentation of the PDP? Public consultation? Submission of the PDP to the congress
? JICA : To assist the DOE? Technical assistance for the PDP simulation? Technical coordination among the related organization? Technical analysis of the specific project? Confirmation of the future data collection flow

Collaboration with DOE

Integration with Subordinate Programs
? Transmission Development Plan (TDP)? Coordination of Power Sources & Transmission
Lines? Interconnection Issues
? Distribution Development Plan (DDP)? Data Collection and confirmation for Demand
Forecasting
? Missionary Electrification Development Plan (MEDP)? Power Development Plan for Un-energized Area
Integration PolicyIntegration & Coordination
of all Projects
Data Integration
Document Integration

Data CollectionData Collection

- A Generation Company shall submit to DOE any information as may be required by the DOE for the preparation of the PDP, subject to appropriate measures to preserve the confidentiality of proprietary or commercially sensitive information.
EPIRA RegulationEPIRA Regulation

- Daily operation report of the system (Luzon, Visayas and Mindanao) are informed by the system operator. However:
-Reports are submitted in the form of paper document
-Generation facility data described in the report are not sufficient for the PDP
Present SituationPresent Situation
There is no effective data gathering system to collect the necessary information for the PDP

DOE has to collect the necessary data for the PDP directly from all generation companies in future.
In order to relieve the data collection & integration work, the followings are expected:
- To collect it in the form of electronic files.
- To use the integrated data format
Data Collection IssuesData Collection Issues

Data collection was conducted for PIOUs in this study by using the integrated electronic format
Data Collection for this studyData Collection for this study
- 15 out of the 19 distribution utilities answered the questionnaire.
- 11 of which submitted in the form of Paper document
- 4 submitted electronic copy- 1 submitted by using individual format

Data Collection Flow in Future
Electronic File
DOE
PIOUs IPPs &GENCOs
Future PDP
In This Study
- Generation Facility Data for Power Supply Plan
- Demand and Supply data for demand forecasting
- Name of facilities contributing the power system
AS a Part of DDP (for PIOUs)
Common Data

Simulation MethodologySimulation Methodology

Simulation SoftwareSimulation Software
WASP-IV:-For calculating the optimal (least cost) power development plan
GTMax :- For evaluating the power flow and the optimal location of power sources
The following software are used for preparing the PDP:

Inside of Simulation SoftwareInside of Simulation Software
Base Load
Medium Load
Peak Load
- WASP-IV -- Operation Cost Calculation by Duration
Method
- Reliability Analysis by Probabilistic Approach
- Calculation of Optimal Power Development by Dynamic Programming Method
Duration
Demand
Optimal Location, Interconnection issues can not be treated by WASP-IV

Inside of Simulation Software
Thermal Plant A Thermal Plant B
Demand BDemand A
Power flow from HA to HB
- GTMax analyzes the optimal power dispatch ( operation ) chronologically.
- Power flow of the interconnection is calculated automatically.
- By changing the connection point of new power sources, optimal location can be calculated.
- GTMax -
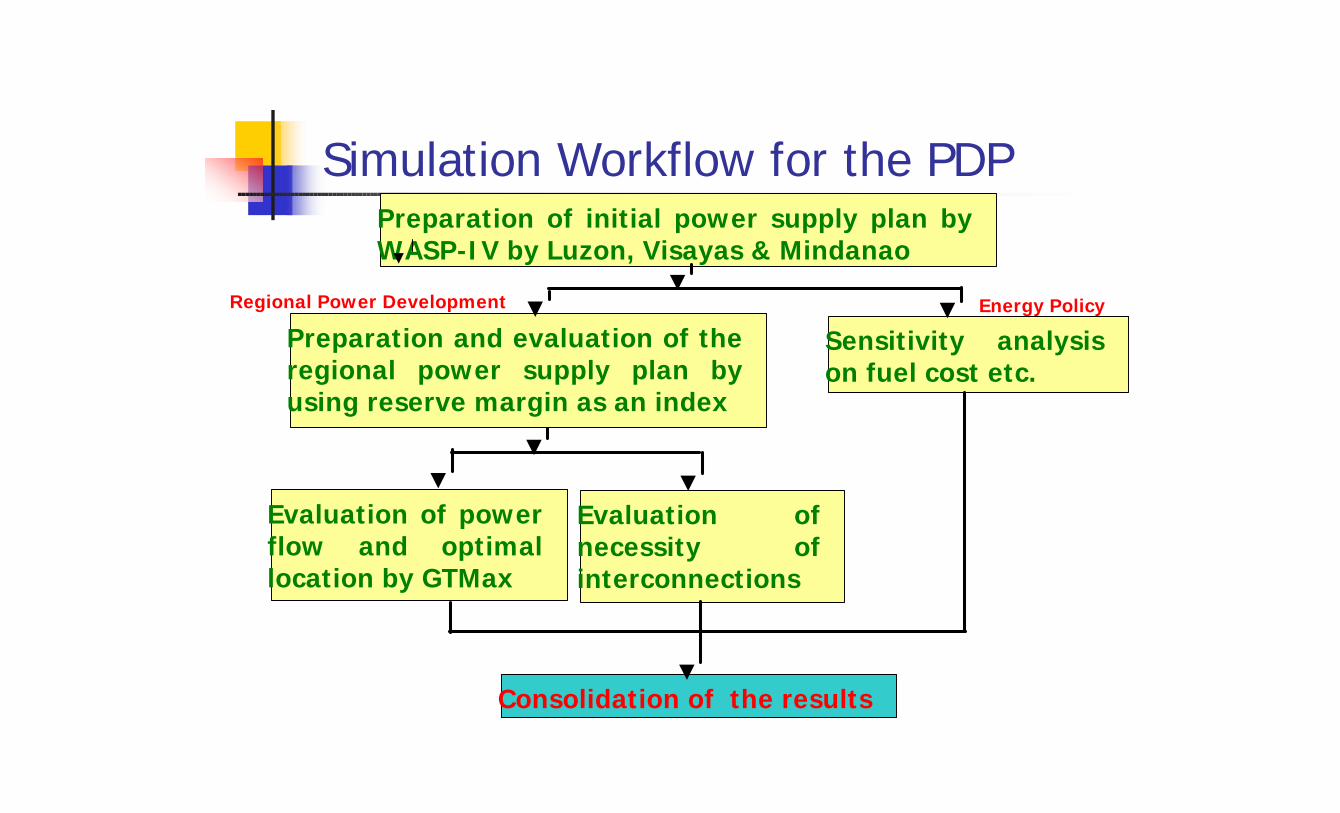
Simulation Workflow for the PDPPreparation of initial power supply plan by WASP-IV by Luzon, Visayas & Mindanao
Preparation and evaluation of the regional power supply plan by using reserve margin as an index
Sensitivity analysis on fuel cost etc.
Evaluation of power flow and optimal location by GTMax
Evaluation of necessity of interconnections
Consolidation of the results
Regional Power Development Energy Policy

Regional Power Development Plan
Output Of WASP-IV

Simulation Workflow for the PDPPreparation of initial power supply plan by WASP-IV by Luzon, Visayas & Mindanao
Evaluation and correction of the regional power supply plan by using reserve margin as an index
Sensitivity analysis on fuel cost etc.
Evaluation of power flow and optimal location by GTMax
Evaluation of necessity of interconnections
Consolidation of the results
Regional Power Development Energy Policy
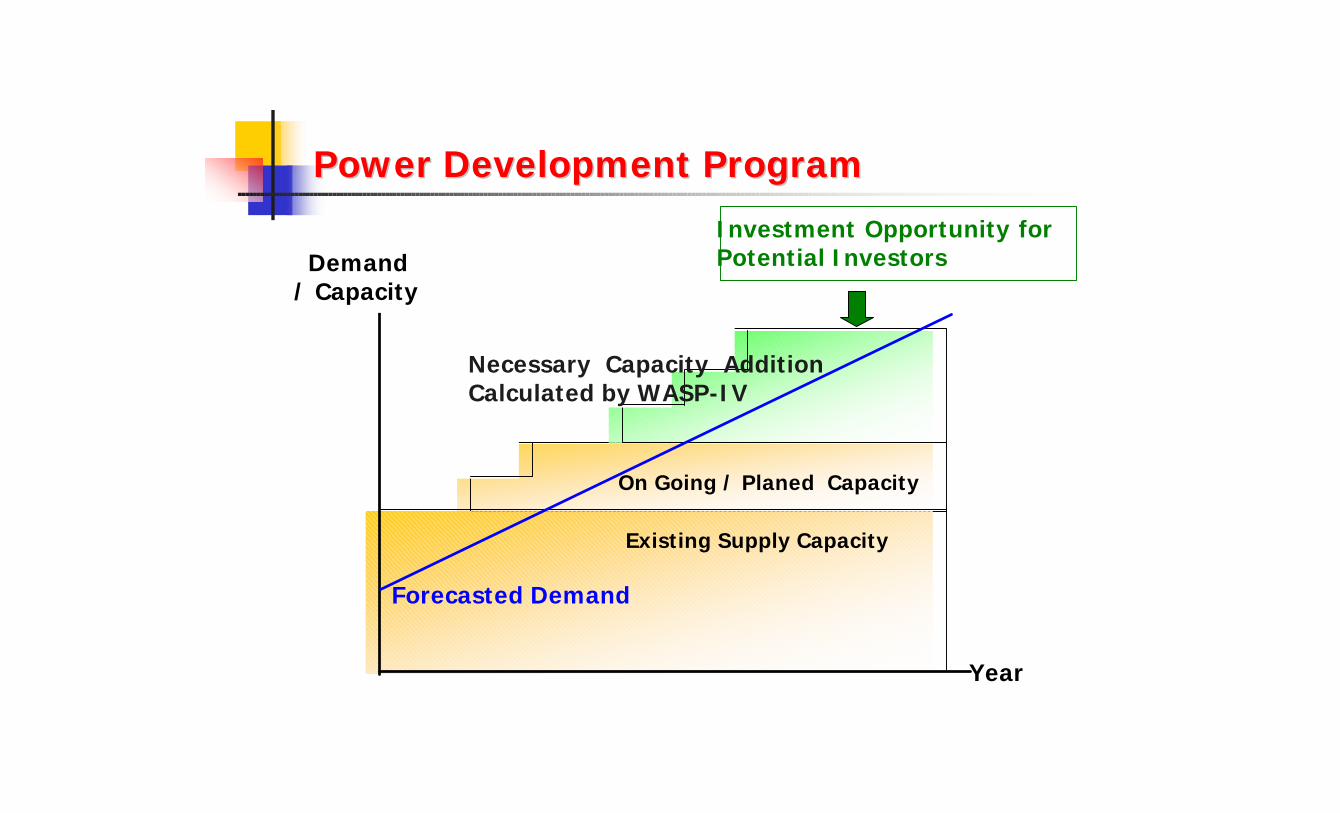
Power Development ProgramPower Development Program
Year
Demand / Capacity
Forecasted Demand
Existing Supply Capacity
On Going / Planed Capacity
Necessary Capacity Addition Calculated by WASP-IV
Investment Opportunity for Potential Investors

Regional Power Supply Balance in 2006Panay
Negros
Cebu
Bohol

Interconnection Power Flow in 2006
Interconnection Study

Simulation Software ( WASP-IV GTMax )

Simulation Workshop

PDP assumptionsPDP assumptions

Reliability Criteria for Planning
?LOLP (Loss of Load Probability)Probability of blackout in the system
considering the forced outage, maintenance--- 1 day / Year
?GRM (Generation Reserve Margin)Reserve capacity against the peak demandGRM= System Capacity – Peak Demand
Peak Demand--- 13.2 %
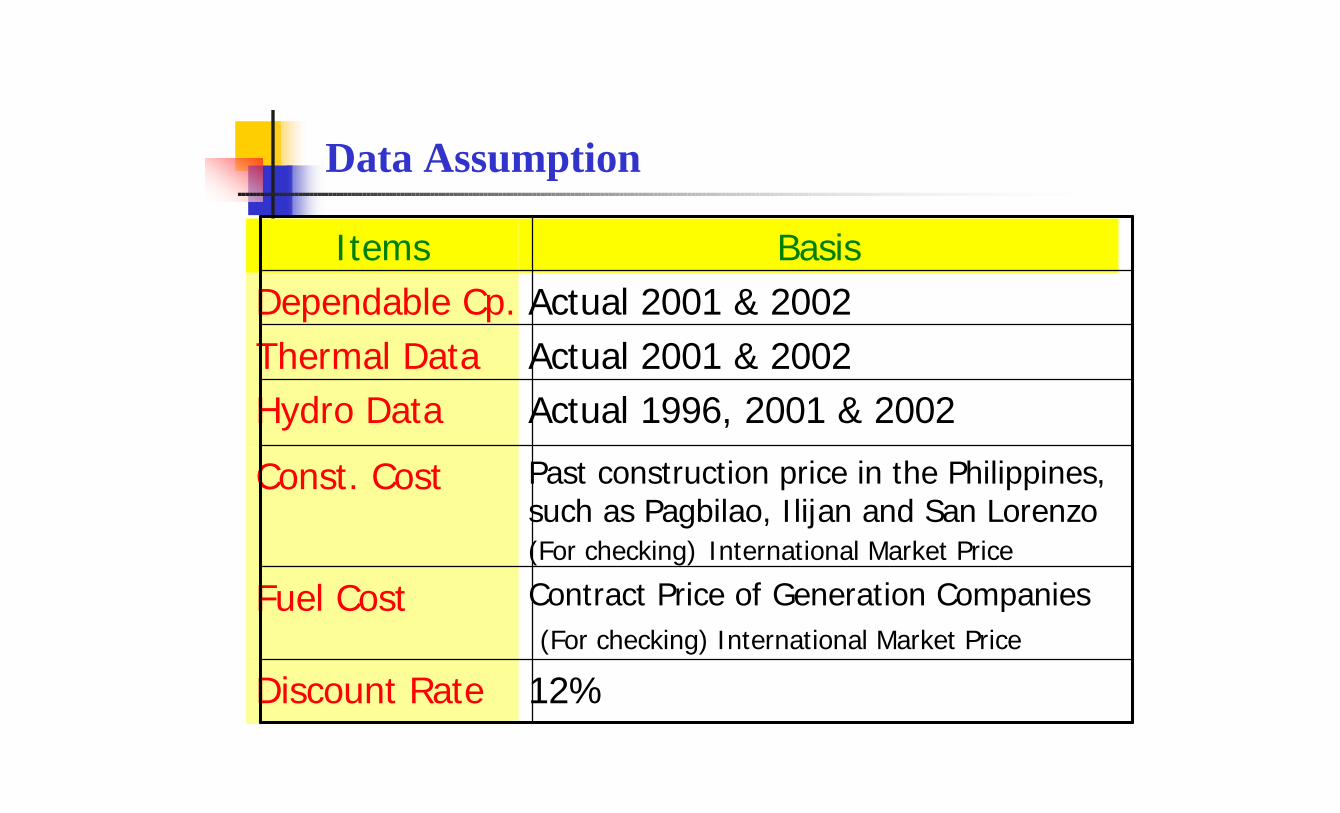
Data Assumption
12%Discount Rate
Contract Price of Generation Companies(For checking) International Market Price
Fuel Cost
Past construction price in the Philippines, such as Pagbilao, Ilijan and San Lorenzo(For checking) International Market Price
Const. Cost
Actual 1996, 2001 & 2002Hydro DataActual 2001 & 2002Thermal DataActual 2001 & 2002Dependable Cp.
BasisItems

Committed ProjectCommitted Project
64200
100402050
3504025
MW
20042006
Transfer PB103-104Mindanao Coal
Mindanao
2004200520052005
Transfer Pinamucan Northern Negros GeoPNOC-Palinpinon GeoVictrias Bioenergy
Visayas
200420062006
Kalayaan 3 & 4PNOC-EDC WindNorth-wind Power
LuzonYearProject NameArea

RetirementRetirement
64
36.5226455
43.8
650210
MW
2009PB103-104Mindanao
20072007200720112011
Panay DPP1 Bohol DPPPB101Cebu Land Base GTCebu DPP
Visayas
20102009
Malaya 1 & 2Hopewell GT*
LuzonYearProject NameArea
*Already Disconnected

Candidate for Simulation
? For Luzon? Coal fired plant (300MW:Coal)? Combined cycle power plant (300MW:Gas)? Gas turbine power plant (150MW:Oil)
? For Visayas, Mindanao? Coal fired plant (50MW:Coal)? Diesel power plant (50MW:Oil)? Gas turbine power plant (50MW:Oil)

Screening Curve
0
100
200
300
400
500
600
700
800
900
1,000
0.0% 10.0% 20.0% 30.0% 40.0% 50.0% 60.0% 70.0% 80.0% 90.0% 100.0%Capacity Factor
$/kw
-Yea
r
CL30
CC30
GT15
DSL
Geo
Hydro
CoalCombined
Cycle (Gas)GT (Oil)

Result of the PDP(2004Result of the PDP(2004--2013)2013)

B A S E L O A D M I D R A N G E P E AKING
200320042005200620072008 450 2009 900 2010 1,800 300 2011 900 2012 1,200 300 2013 1,200
T O T AL 6,000 1,050
T O T AL/GRID 7,050
L U Z O N
CAPACITY ADDITIONS: LOW GDP

MW
50
4050
8050
12050
16050
20050
Additions 0 0 0 0 0 0 450 1350 3150 4350 5550 7050
Committed 0 0 350 350 415 415 415 415 415 415 415 415
Existing 10435 10520 10520 10520 10520 10520 10520 10310 9660 9660 9660 9660
Peak 6,039 6,454 6,967 7,564 8,272 8,982 9,822 10,771 11,812 12,954 14,206 15,579
2002 2003 2004 2005 2006 2007 2008 2009 2010 2011 2012 2013
Power Supply and Demand Profile
Luzon
Demand
Existing Capacity
CommittedIndicative

CAPACITY ADDITIONS: LOW
BASELOAD MIDRANGE PEAKING
2003 0 0 1002004 - - - 2005 - - - 2006 - 50 50 2007 - - - 2008 - - 100 2009 - - 200 2010 - 150 50 2011 100 150 100 2012 150 50 50 2013 150 50 50
TOTAL 400 450 700
TOTAL/GRID 1,550
VISAYAS

MW
50
550
1050
1550
2050
2550
3050
3550
Additions 100 100 100 200 200 300 500 700 1050 1300 1550
Committed 210 210 210 210 210 210 210 210 210
Existing 1424 1424 1424 1424 1424 1357 1357 1357 1357 1277 1277 1277
Peak 936 1,006 1,093 1,196 1,319 1,442 1,591 1,759 1,946 2,153 2,381 2,634
2002 2003 2004 2005 2006 2007 2008 2009 2010 2011 2012 2013
Power Supply and Demand Profile
Visayas
Demand
Existing Capacity
Committed
Indicative
100

CAPACITY ADDITIONS: LOW
BASELOAD MIDRANGE PEAKING
200320042005 50 200620072008 100 2009 150 2010 150 2011 100 2012 100 50 2013 100 50 50
TOTAL 600 100 200
TOTAL/GRID 900
MINDANAO

MW
50
550
1050
1550
2050
2550
3050
Additions 50 50 50 150 300 450 600 750 900
Committed 48 48 248 248 248 200 200 200 200 200
Existing 1321 1321 1321 1321 1321 1321 1321 1321 1321 1321 1321 1321
Peak 995 1,049 1,117 1,197 1,292 1,384 1494 1,617 1,750 1,893 2,048 2,216
2002 2003 2004 2005 2006 2007 2008 2009 2010 2011 2012 2013
Power Supply and Demand Profile
Mindanao
Demand
Existing
Committed
Indicative

MW
500
5,500
10,500
15,500
20,500
25,500
Addition 0 100 100 150 250 250 900 2150 4300 6000 7600 9500
Committed 0 0 498 608 873 873 873 825 825 825 825 825
Existing 13,179 13,264 13,264 13,264 13,264 13,197 13,197 12,987 12,337 12,257 12,257 12,257
Peak 7,970 8,508 9,177 9,957 10,883 11,808 12,906 14,148 15,508 17,000 18,636 20,429
2002 2003 2004 2005 2006 2007 2008 2009 2010 2011 2012 2013
Power Supply and Demand Profile
Philippines
Investment Opportunity

PROJECT MW YEAR AVAILABLE
LuzonMakban Geo Rehabilitation 220 2005Tiwi Geo Rehabilitation 220 2005Bacman Optimization 40 2007Sucat NG Conversion 450-850 MW 2007
Limay Expansion (LNG) unit 1 250 2007
Limay Expansion (LNG) unit 2 250 2008Mariveles Greenfield (LNG) unit 1 600 2008Mariveles Greenfield (LNG) unit 2 600 2009
VisayasMirant Diesel PP (Iloilo) 40 2004Trans-Asia Diesel PP (Boracay) 7.5 2004Southern Leyte Geothermal 100 2008KEPCO Clean Coal PP (Panay) 100 2005
MindanaoMt. Apo Geothermal Expansion 20 2006Tagoloan Hydro 68 2008Sultan Kudarat Coal PP 150-200 2013Agus 3 Hydro 225 2013Pulangi V 300 2013
INDICATIVE PROJECTS

P o w e r G e n e r a t io n , i n T W h
0 . 0 0
2 0 . 0 0
4 0 . 0 0
6 0 . 0 0
8 0 . 0 0
1 0 0 . 0 0
1 2 0 . 0 0
1 4 0 . 0 0
2 0 0 3 2 0 0 4 2 0 0 5 2 0 0 6 2 0 0 7 2 0 0 8 2 0 0 9 2 0 1 0 2 0 1 1 2 0 1 2 2 0 1 3
H y d r o C o a l G a s G e o O il - B a s e d O t h e r s
2004 2006 2008 2010 2013
Oil-Based 17.4 13.12 16.6 9.9 7.4
Coal 36.7 30.54 31.9 23.7 17.7
Gas 18.8 30.62 26.9 22.4 17.0
Hydro 13.1 11.24 9.8 8.1 6.2
Geo 14.0 14.24 14.3 12.0 9.2
NRE 0.0 0.22 0.2 0.2 0.1
Others 0.0 0.02 0.4 23.7 42.3
GENERATION MIX (%)
Total Phils.

FUEL REQUIREMENTS
(2003 – 2013)
OIL-BASED - 168 Million Barrels
NATURAL GAS - 1,419 Billion Cubic Feet
COAL - 105 Million Tons
Local - 24 Million Tons
Imported - 81 Million Tons
Technical IssuesTechnical Issues
?Fuel Price Impact
?Interconnection Issue

Fuel Price Impact
(1) Sensitivity Study
-Present PriceOil & Others
-Present PriceCoal
- Present Price- 95%, 90%, 85% and 80%
of Present Price
Natural Gas
ScenarioFuel Name
To enhance the effective use of natural gas, price impact of natural gas is studied
Objective:

(Unit:MW)
(1) Sensitivity Study
7500
6000
1050
4200
2100
750300
6300
450
0
2000
4000
6000
8000
Total Coal Gas Oil Coal Gas Oil Coal Gas Oil
Base Case Gas Price 90% Gas Price 80%
Necessary Development for 10 years (2004-2013)

Consideration
(1)Sensitivity Study
?Natural gas is one of clean fossil energy.?Initial investment of gas fired power plant is cheaper than that of coal fired power plant.
? In order to enhance the effective use of domestic natural gas, gas price should be determined deliberately.
? On the other hand, initial investment cost of gas infrastructure might be great.
? Therefore, the effort to decrease the gas price should be continued in future.

Basic Approach for Interconnection
Simulation for Independent Area : A
Simulation for Synthesized Area: A +B
Construction / Up-rating Cost of Interconnection
Total System Cost ( Investment & Operation Cost)
should be compared
Project A : No Interconnection Project B: New Interconnection
Simulation for Independent Area : B
(2) Interconnection Issues
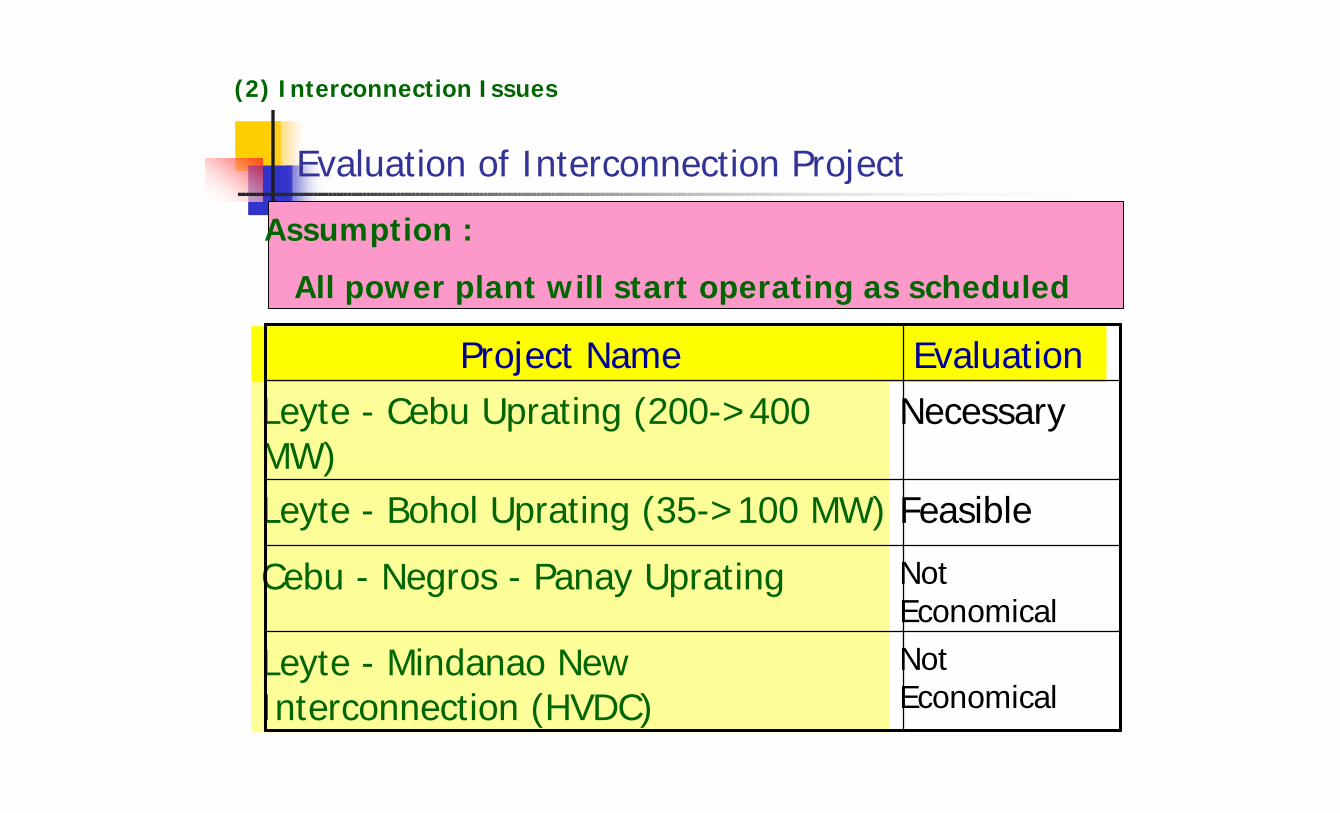
Evaluation of Interconnection Project
Not Economical
Leyte - Mindanao New Interconnection (HVDC)
Not Economical
Cebu - Negros - Panay Uprating
FeasibleLeyte - Bohol Uprating (35->100 MW)
NecessaryLeyte - Cebu Uprating (200->400 MW)
EvaluationProject Name
Assumption :
All power plant will start operating as scheduled
(2) Interconnection Issues

Interconnection Power Flow in 2006
(2) Interconnection Issues

Consideration? From the point of economical view, some
interconnection projects are considered as not economical.
? However, power plant will not always start operating as scheduled.
? In addition, Merit of interconnection is not only economic operation but also improvement of reliability.
Further evaluation should be required on the necessity of interconnection projects.
(2)Interconnection Study


