
Power Considerations for Educational Studies with Restricted Samples that Use
State Tests as Pretest and Outcome Measures
June 2010
Presentation at the Institute for Education Sciences Research Conference
Russell Cole ● Josh Haimson ● Irma Perez-Johnson ● Henry May
The research reported here was supported by the National Center for Education Evaluation and Regional Assistance, U.S. Department of Education, through contract ED-04-CO-0112 to Mathematica Policy Research.
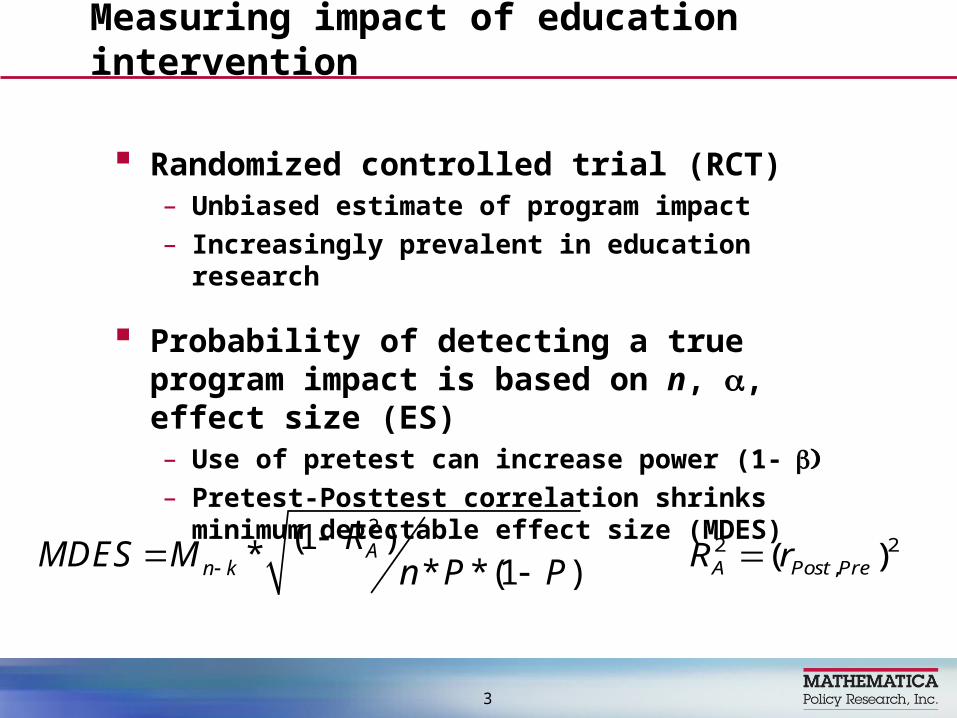
Randomized controlled trial (RCT)– Unbiased estimate of program impact– Increasingly prevalent in education research
Probability of detecting a true program impact is based on n, , effect size (ES)– Use of pretest can increase power (1-– Pretest-Posttest correlation shrinks minimum
detectable effect size (MDES)
Measuring impact of education intervention
3
2(1 )* * *(1 )A
n kRMDES M n P P
2 2
,( )A Post PreR r

MDES Increases as Pretest-Posttest Correlation Decreases
4

State assessments as outcomes– Used to define proficiency for AYP
– Universal in grades 3–8 (Math and ELA)
– Minimizes burden
– Low(er) cost and scale scores readily available
State tests tend to have lower CSEM at middle of ability distribution– Largest CSEM at tails
– Variance (2) can be partitioned into explainable and unexplainable (measurement error) components
– Given increased CSEM at tails, samples of students selected at tails will have higher proportions of unexplainable variance
State Tests Prevalent, But Appropriate?
5

If there is greater measurement error for low-performing students, does this mean that pretest-posttest correlations will be attenuated?
To capture variability in correlation coefficients associated to measurement error, select samples with different average achievement levels and calculate r
Compare pretest-posttest correlations across different achievement levels (and across states) to inform power calculations
General Methodology
6
(i.e. )Pre,Post|Prer

Research Questions
7
What is the average pretest-posttest correlation coefficient for samples of students selected at different pretest achievement levels?
Do correlation coefficients differ by state?

4 complete states + 2 large districts from 2 additional states
3 years of population data – 2 sets of pre-post correlations – (Year1,Year2), (Year2,Year3)
English/Language Arts & Mathematics
Grades 3–8
Population Data
8

1. Sample pretest achievement level determinedA. Lowest performers
B. Proficiency threshold
C. Average performers
2. Grade grouping (pretest year)A. Early elementary (grades 3 and 4)
B. Late elementary (grade 5)
C. Middle school (grades 6 and 7)
Analysis Decisions
9

For each state, year, subject, and grade-group:
1. Pretest standardization
2. Selection of study samples (n = 500)
3. Calculation of pretest-posttest correlation
– 6 states, 2 years pre-post data, 2 subjects, 3 grade groups for each achievement level
4. Cross-cutting aggregation (ANOVA)
Analysis Procedure
10

Pretest-Posttest Correlations Attenuated for Lowest-Performing Samples
11

Large Variation in Pretest-Posttest Correlation Across States
12

Observed for Power Analysis
13
r = .89r = .60r = .37
Pre,Post|Prer
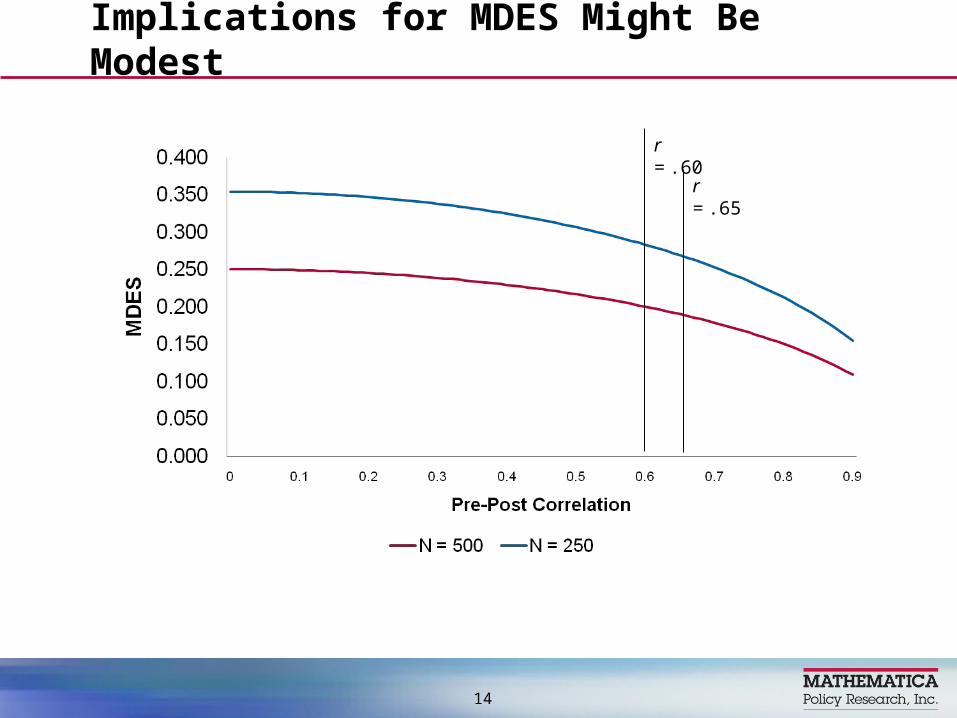
Implications for MDES Might Be Modest
14
r = .60
r = .65

Pretest-posttest correlations – Large attenuation when homogeneous sample
selected– Might be lower than anticipated for low performers
on state assessments– Similar for ELA/Mathematics and across grade levels– Affected by other factors (ceiling/floor effects)
Use available administrative records to gauge
Discussion/Summary
15
Pre,Post|Prer
Thank you
May, Henry, Irma Perez-Johnson, Joshua Haimson, Samina Sattar, and Phil Gleason (2009). “Using State Tests in Education
Experiments: A Discussion of the Issues.” (NCEE 2009-013). Washington, DC: National Center for Education Evaluation and
Regional Assistance, Institute of Education Sciences, U.S. Department of Education.
http://ies.ed.gov/ncee/pdf/2009013.pdf
16


