
Walden UniversityScholarWorks
Walden Dissertations and Doctoral Studies Walden Dissertations and Doctoral StudiesCollection
2018
Poverty Rate and Occurrence of Foodborne IllnessRisk Factors in Retail FacilitiesMargolite Joseph CesarWalden University
Follow this and additional works at: https://scholarworks.waldenu.edu/dissertations
Part of the Environmental Sciences Commons, and the Epidemiology Commons
This Dissertation is brought to you for free and open access by the Walden Dissertations and Doctoral Studies Collection at ScholarWorks. It has beenaccepted for inclusion in Walden Dissertations and Doctoral Studies by an authorized administrator of ScholarWorks. For more information, pleasecontact [email protected].

Walden University
College of Health Sciences
This is to certify that the doctoral dissertation by
Margolite Joseph Cesar
has been found to be complete and satisfactory in all respects,
and that any and all revisions required by
the review committee have been made.
Review Committee
Dr. James Rohrer, Committee Chairperson, Public Health Faculty
Dr. Maria Del Pilar Martin, Committee Member, Public Health Faculty
Dr. Joseph Robare, University Reviewer, Public Health Faculty
Chief Academic Officer
Eric Riedel, Ph.D.
Walden University
2018

Abstract
Poverty Rate and Occurrence of Foodborne Illness Risk Factors in Retail Facilities
by
Margolite Joseph Cesar
BS Chemistry, University of Florida
BS Zoology, University of Florida
Dissertation Submitted in Partial Fulfillment
of the Requirements for the Degree of
Doctor of Philosophy
Public Health
Walden University
February 2018

Abstract
Despite the efforts of food safety regulations and rules, food contamination remains a public
health concern and prevalent vehicle of pathogens. This study identifies the predictors of
food risk in different types of food establishments in Miami Dade County, Florida during the
period November 2014 - November 2016. Guided by the epidemiologic triangle model, this
correlational study analyzed the log number of risk factor violations and failure rates
controlling for US Census sociodemographic data (2010 to 2014) for the food establishment
neighborhoods by using linear and logistic regression. Results indicated that most of food
entity types are significant predictors of risk violations. Among all the significant predictor
food establishments, grocery stores (b = 2.877. p < 0.001) had a higher increase in
violations. For the demographic variables, the only significant variable was the number of
single parent households (B = .001, p = 0.022). The result reveals a significant association
between food entity types and failing inspection (p < 0.005). Among all the entity types,
convenience store with significant food service and/or packaged ice (22.2 %) have the
highest percentage fail rate within inspection rate outcome. Findings indicate that a risk-
based approach to food risk factor violations frequency could reduce the number of
violations, particularly in convenience and grocery stores with the most violations and
failing rate.

Poverty Rate and Occurrence of Foodborne Illness Risk Factors in Retail Facilities
by
Margolite Joseph Cesar
BS Chemistry/Biochemistry, University of Florida
BS Zoology, University of Florida
Dissertation Submitted in Partial Fulfillment
of the Requirements for the Degree of
Doctor of Philosophy
Public Health
Walden University
February 2018
Dedication
I dedicate my dissertation work to my family and many friends. A special feeling of
gratitude to my loving husband, Ernst Cesar and wonderful son, Toussaint Joseph, for being
there for me throughout the entire doctorate program. Both of you have been my best
cheerleaders. My lovely cousin/best friend, Cindy Watson, have never left my side and have
spent many hours of proofreading. I also dedicate this dissertation to my many friends, co-
workers, and church family who have supported me throughout the process. I will always
appreciate all they have done, especially Mark French and Patty Lewandowski for
recommending me for a scholarship, Deloris Lloyd whose words of encouragement and
push for tenacity ring in my ears, and Jonathan Pelt for helping me with the topic.

Acknowledgments
At the exceptionally onset, I yield myself before the Almighty Lord for favoring me with the
leading of what I could have had. Be it this dissertation, the personnel associated with or the
outcome of this research pursuit, all of it HIS GRACE, MERCY, and BLESSINGS. He has
made this possible, and I thank the Almighty Lord with all humility and surrender. I am
grateful to everyone who has helped me in my struggle to achieve my dream of becoming a
Ph. D. I want to thank my committee members who were more than generous with their
expertise and precious time. A special thanks to Dr. James Rohrer, my committee chair for
his countless hours of reflecting, reading, encouraging, and most of all patience throughout
the entire process. Thank you Dr. Maria Martin, for agreeing to serve on my committee. I
would like to acknowledge and thank my school division for allowing me to conduct my
research and providing any assistance requested. I also would like to acknowledge the
inspirational instruction and guidance of Dr. Miller Tiffiani. Finally, I would like to thank
Sara Wander and Jacqueline Johnson who assisted me with the data for this project. Their
excitement and willingness to provide the data made the completion of this research an
enjoyable experience.

i
Table of Contents
List of Tables ..................................................................................................................... vi
Chapter 1: Introduction to the Study ....................................................................................1
Introduction ....................................................................................................................1
Background ....................................................................................................................5
Problem Statement .........................................................................................................8
Purpose of the Study ......................................................................................................9
Research Questions Hypotheses ..................................................................................11
Conceptual Framework ................................................................................................13
Nature of the Study ......................................................................................................14
Definitions....................................................................................................................15
Scope and Delimitations ..............................................................................................17
Limitations ...................................................................................................................18
Significance..................................................................................................................19
Summary ......................................................................................................................20
Chapter 2: Literature Review .............................................................................................21
Introduction ..................................................................................................................21

ii
Literature Search Strategy............................................................................................23
Theoretical Foundation: The Epidemiological Triangle .............................................24
Review of Studies related to Key Concepts:Foodborne Disease Inspection and
Food Safety ......................................................................................................25
Definition of Foodborne Disease .......................................................................... 25
Definition of Food Safety ..................................................................................... 26
Definition of Food Contaminants ......................................................................... 27
Epidemiology of Foodborne Diseases .................................................................. 28
Risk Factors Contributing to foodborne Illness in Food Service
Establishments ......................................................................................... 30
Risk Factors Associate with Establishments ........................................................ 30
Risk Factors Associate with Cross-Contamination .............................................. 31
Risk Factors Associate with Personal Hygiene ................................................... 32
Risk Factors Associate with Temperature ........................................................... 33
Importance of Food Safety.................................................................................... 35
Importance of Inspections for food Safety and Foodborne Illness ....................... 36
Food Safety in Florida .......................................................................................... 38

iii
Number of Food Inspections ................................................................................. 42
Foodborne Illnesses in Relation to Food Establiments ......................................... 43
Foodborne Illnesses in Relation to Different Races/Ethnicity, Socioeconomic
Status Populations ..................................................................................... 45
Critique of Methods .....................................................................................................53
Summary and Conclusions ..........................................................................................56
Gap Addressed by this Study ................................................................................ 58
Summary ............................................................................................................... 60
Chapter 3: Research Method ..............................................................................................62
Introduction ..................................................................................................................62
Research Design and Approach ............................................................................ 62
Methodology ................................................................................................................67
Target Population and Method.............................................................................. 67
Sampling of Risk Factors Assessement and Routine Inspection .......................... 68
Risk Factors assessement ...................................................................................... 69
Instrumentation and Operationalization of Constructs ......................................... 74
Statistical Data Analysis Plan ............................................................................... 76

iv
Reliability to Validity ..................................................................................................77
Ethical Procedures .......................................................................................................78
Summary ......................................................................................................................78
Chapter 4: Results ..............................................................................................................80
Purpose of the Study ....................................................................................................80
Data Collection Sources ...............................................................................................80
Selection of Food Establisment Entity Types ..............................................................81
Research Questions and Hypotheses ...........................................................................83
Descriptive Statistics ....................................................................................................89
Data Analysis: One-Way Analysis .............................................................................94
Data Analysis: Regression Analysis ...........................................................................96
Data Analysis: Cross-Tabulation Analysis .................................................................99
Data Analysis: Binary Logistic Regression .............................................................103
Summary of Findings .................................................................................................106
Chapter 5: Discussion, Conclusions, and Recommendations ..........................................108
Introduction ................................................................................................................108
Interpretation of the Findings.....................................................................................109

v
Comparing the Findings to Prior Research ...............................................................110
Limitations of the Study.............................................................................................111
Recommendation for Action ......................................................................................112
Social Change ............................................................................................................113
Conclusion .................................................................................................................114
References ........................................................................................................................116

vi
List of Tables
Table 1: Summary of the Literature on Foodborne illnesses, Food safety, Food
Establishment, and populations of different races/ethnicities, Socioeconomic Status
food safety Outcomes ............................................................................................... 50
Table 2: Descriptive Statistics: Dependent Variable (Number of risk Violations) .......... 90
Table 3: Frequency of Pass/Fail rating ............................................................................. 91
Table 4: Frequency Table: Independent Variables Food Entity Types…………………..92
Table 5: Mean Block group socio-demographic characteristics associated with 3435
routine risk violation inspection ………………………………………………….93
Table 6: One-Way ANOVA of Violations: Independent Variables, entity types (P<0.001)
……………………………………………………………………………………………….95
Table 7: Linear Regression Analysis of Violations (adjusted R-square=0.519,……………
P<0.001)...................................................................................................................97
Table 8: Percentage of Food Entity Type and Fail/Pass Crosstab………………….......99
Table 9: Food Entity Type and Fail/Pass Rate………………………………....…......102
Table 10: Logistic Regression Model Summary for Dependent Variable (Pass/Fail Rate)
………………………………………………………………………….103

vii
Table 11: Logistic RegressionClassification for Dependent Variable (Pass/Fail Rate)
Independent Variable (Food entity types) ………………………………………103
Table 12: Logistic RegressionAnalysis of Fail Rate Independent Variable (Food entity types,
and Demographic area) …………………………………………………..105
Table A1: Most Common Violation and Information Collected on Food Saety Inspection
Statewide…………………………………………………………………..128
List of Figures
Figure 1: Epidemiology Triangle (Person, Place, Time) ...................................................14
Figure 2. Histogram chart: Dependent Variable (Number of Risk Violation) ..................90
Figure A1: Food Safety Inspection Districts……………………………………………127
Figure A2: Food Establishment Inspection Report…………………………………….131
1
Chapter 1: Introduction to the Study
Chapter Overview
This chapter provides the introduction and background to the study, including the
statement of the problem, purpose, research questions, hypotheses, theoretical basis, nature,
operational definitions, significance, scope, delimitations, and limitations of the study.
Introduction
Foodborne illnesses are a serious public health concern. Centers for Disease Control
and Prevention (CDC) estimates that each year roughly 1 in 6 Americans (or 48 million
people) gets sick, 128,000 are hospitalized, and 3,000 die of foodborne diseases (CDC,
2016). Foodborne illnesses are closely linked to improper food safety practices that lead to
the proliferation of pathogenic microorganisms in food (Hamade, 2015). Biological hazards
are the biggest threat to food safety. There are 31 known pathogens that can cause foodborne
illness (CDC, 2016), and they are responsible for about 21 % of the foodborne illnesses and
the remaining 79 % are caused by unspecified agents (CDC, 2016). These unspecified
agents were defined as: agents with insufficient data to estimate agent-specific burden;
known agents not yet identified as causing foodborne illness; microbes, chemicals, or other
substances known to be in food whose ability to cause illness is unproven; and agents not
yet identified (CDC, 2016).
Most outbreaks of foodborne illness are caused by consumed contaminated products
that have entered the food chain at some point from farm to fork. Hospitalization rates

2
reflect the seriousness of foodborne disease outbreaks; for example, 88% of patients with
Listeria infections required hospitalization, compared with 36% for Yersinia, 37% for E. coli
O157, and 22% for Salmonella. Food-borne diseases are known to contribute to both human
morbidity and mortality as well as to health care costs (Campbell et al., 1998). The United
State Department of Agriculture (USDA-ERS) also estimates that food-borne illness
triggered by just five foodborne pathogens - Campylobacter, Salmonella, E. coli O157:H7,
Listeria monocytogenes and Toxoplasma gondii- cause $6.9 billion in medical costs, lost
productivity, and premature deaths each year in the United States (USDA-ERS, 2000). A
recent study conducted by Roberts (2007) estimates the societal costs of all acute food-borne
illness is a total of U$1.4 trillion.
Today, most Americans do not question the safety of the food that they choose to
consume (Goodacre, Doel, Habron, & Petruv, 1999) in part because of the existence of
government organizations, such as the Food and Drug Administration (FDA), the U.S.
Department of Agriculture (USDA), the Centers for Disease Control and Prevention (CDC),
and even local and state health departments, all of which implement safety protocols that
have greatly influenced the way that food is produced and prepared in the United States
(Wilcock et al., 2004). The American public generally trusts that the food they purchase and
eat is safe for consumption, but the most current evidence states that, despite the regulations
imposed by these oversight organizations and the current knowledge of disease-causing
agents in relation to food and food sources, food-borne illness still accounts for upwards of
48 million illnesses annually in the United States (Wilcock et al. 2004 & Gould et al. 2011).

3
Of these illnesses, any occurrence of two or more similar illnesses that result from the
consumption of a common food is considered a “food-borne disease outbreak,” as per CDC
standards since 1992 (CDC 2011).
While all are at risk, other than what is known about food-borne illness in younger
and older age groups, the relationship between foodborne illness risk and access to food
entity establishments is unclear. Little is known about which demographic groups or entity
establishment type in the United States are at highest risk for food borne infection and which
groups should be targeted for educational efforts. Race, ethnicity, or income has not
traditionally been used to track the incidence rates of food-borne illness. Regarding the
relationship between demographic area and foodborne illness, relatively few studies have
been conducted and the findings are inconsistent. For example, the Food-borne Diseases
Active Surveillance Network (FoodNet) quantifies and monitors the incidence of laboratory-
confirmed cases of Salmonella, Campylobacter, Listeria, Shiga-toxin producing E. coli,
Shigella, Yersinia and Vibrio. The FoodNet catchment area was not chosen to equally
represent all racial and ethnic groups, and even in the expanded FoodNet population,
Hispanics and those living below the poverty level are underrepresented when compared to
the general American population (6% vs. 12%, and 11 vs. 14%, respectively) (Hardnett et
al., 2004). Some limited numbers of studies have found that low income populations are
more likely to experience greater rates of gastrointestinal illness. Over the past decade,
analysis of FoodNet tracking data to examine the burden of food-borne illness on minority
racial and ethnic populations has revealed trends related to their demographics. Additionally,

4
since 2008, FoodNet final reports each year have reported incidence rates of bacterial
pathogens by race and ethnicity (CDC, 2016). There is growing evidence that individuals of
minority racial and ethnic groups suffer from greater rates of some food-borne illnesses
(Quinlan, 2013).
Socioeconomic populations might experience greater risks for food-borne illness at
supermarkets or convenient stores. A growing collection of public health research
(Bermudez-Millan et al., 2004; Dharod et al., 2007; Henley et al., 2012; Kwon et al. 2008;
Meer & Misner, 2000; Quinlan, 2013; Trepka et al., (2006); Wenrich et al., 2003) has
indicated that low-income neighborhoods have different access to food sources at the retail
level. The concept of neighborhood disparities, in accessibility of food outlets, has been
recognized by the U.S. Department of Agriculture as Food Deserts. Food Deserts mean there
is a lack of large supermarkets and tends to be an abundance of smaller grocers,
convenience, and fast food retailers (Quinlan, 2013). Studies have started to investigate food
safety risk available at small independent retailers in the food desert environment. Those
studies are included a combination of surveys at the retail level as well as use of inspection
violation rates as a deputation for safety (Quinlan, 2013).
The lack of accurate statistics and limited scholarly research concerning microbial
violation practices among low economic status areas and different entity types can
contribute to this phenomenon. It is essential that research on food safety practice
compliance and noncompliance among food service workers in low-income areas be

5
conducted in their sociocultural setting to be able to contribute varying health promotion
programs. It is also essential in that it will help generate scholarly documentation that may
assist health policy makers to create new policies to improve public health.
Background
Food safety is a high priority around the world. Regulatory agencies such as local,
county, and state health departments conduct routine health inspections of food handling
facilities. Although food safety regulatory efforts address the entire food chain (from
production to the retail level) (National Research Council, 2010), these processes do not
guarantee that food products, especially uncooked fresh foods, are free from potentially
pathogenic bacteria.
There are many opportunities for food to become contaminated and are responsible
for several illnesses worldwide. The CDC documents five contributory factors in the
occurrence of foodborne illness in restaurants: food items from unsafe sources, poor
personal hygiene, inadequate cooking temperatures, improper cold or hot holding
temperature of foods, and unclean food contact equipment (FDA, 2010). Manes et al. (2013)
reported that approximately 25% of food employees did not always wash their hands, 33%
did not change gloves between tasks, and more than 50% of food handlers did not ensure the
food’s required minimum cooking temperature. Over the past few decades, the CDC and the
Environmental Health Specialist network (EHS-net) collaborated on several research
projects to understand the contributing factors for foodborne illness in restaurants and food

6
establishments. In each study, sick employees, poor personal hygiene, and insanitary food
preparation practices greatly contributed to foodborne outbreaks in different areas (Brown,
2013). The microbial load present in ready-to-eat (RTE) is a function of the number of
microorganisms present in the raw materials, opportunities for further microbial growth and
survival, their destruction due to processing, and the extent of any additional contamination.
These commodities, which are ready for immediate human consumption, are considered
high-risk for several microbial hazards, receiving special attention from official controls
regulation and food business operators. RTE food are appreciated for their unique flavors
and convenience, however, the unhygienic conditions in which these foods are prepared,
stored, and served raise a question regarding their microbiological quality. Researchers have
investigated the microbiological quality of street vended foods in different countries. Syn et
al. (2013) conducted a bacteriological assessment of the environment and food products at
different stages of processing during the manufacture of RTE chicken franks, chicken
bologna and bacon at a large meat processing plant in Trinidad, West Indies. The findings
suggest that 50% (10 of 20) of precooked mixtures of bacon and bologna were contaminated
with Listeria spp., including four with L. monocytogenes. Pre-cooked mixtures of franks and
bologna also contained E. coli (35 and 0.72 log10 CFU/g individually) while 5 (12.5%) of
40 pre-cooked mixtures of chicken franks had Salmonella spp(species). Aerobic bacteria
exceeded acceptable international standards in 46 (82.1%) of 56 pre-cooked and 6 (16.7%)
of 36 post cooked samples.

7
In addition to the above study, 1,049 samples of pre-packed ready to eat sliced meats
purchased in SME’s (small to medium sized enterprises) in the United Kingdom were
examined to detect and/or enumerate Listeria monocytogenes and other Listeria spp.
Samples were also examined to determine numbers of the hygiene indicator organisms
Escherichia coli and Enterobacteriaceae. The overall result show that Listeria
monocytogenes was detected in 3.8% of samples and Listeria spp. was detected in 7.0% of
samples. Enterobacteriaceae were enumerated from 36.2% of samples and the mean count
(log10 cfu/g) was 2.96 ± 1.47. E. coli were enumerated from five samples (0.48%).
Infections with this organism are associated with a high rate of sickness or mortality;
therefore, it is important that prevalence of exposure to this organism are pinpointed and
factors contributing to infections identified.
Because of the heightened concern in foodborne illnesses and outbreaks, the Food
Safety Department of Agriculture developed local regulation, routine, complaint, follow-up,
and other special food establishment inspections, to ensure effective food preparation and
handling practices (Waters et al., 2013). To improve food safety practices, the U.S. Food
and Drug Administration (FDA) recommends that local regulatory agencies utilize
innovative methods of effective food establishment inspection, including the use of critical
violations as an indicator of foodborne illness (FDA, 2010).
The Florida Department of Agriculture and Regulation Administration (HLRA)
enforced the 2012 food code through their food safety and hygiene inspection service

8
division to safeguard public health. Additionally, the program inspected and monitored
establishments to ensure food was safe, unadulterated, and honestly presented to their
consumer. The department conducted periodic inspections of the city’s existing food
establishments. These inspections help the department to assess the risk of foodborne illness
such as priority, priority foundation and core violations and to evaluate food safety practice.
However, the frequency of priority violations and its relationship to foodborne illness and
resident complaint has not been investigated in the State of Florida.
Problem Statement
Despite the efforts of food safety regulations and rules, food contamination remains a
public health concern and a prevalent vehicle of pathogens (Quinlan, 2013). According to
the Centers for Disease Control and Prevention (CDC, 2016), 1 in 6 Americans (or 48
million people) gets sick, 128,000 are hospitalized, and 3,000 die of food-borne diseases
each year. Those diseases are transmitted through contaminated food by the major
pathogens, Campylobacter, Salmonella, Listeria, and E. coli O157 (Quinlan, 2013). Two-
thirds of foodborne illness outbreaks in the United States are associated with restaurants or delis
(Gould et al., 2013). Several outbreak investigations have shown that the main contributors to
Food Borne Illnesses (FBI) outbreaks in food service establishments are predominantly
linked to (a) bare hand contact when handling ready to eat foods, (b) improper hand
washing, (c) poor maintenance of food contact surfaces of equipment and utensils, (d) cross-
contamination of raw or cooked foods, and (d) inadequate temperature maintenance (Todd et
9
al., 2007). Access to contaminated foods exposes the population to an increased exposure of
food pathogens (Quinlan, 2013). Evidence indicates that individuals of low income and
minority groups may have greater risk to food contamination exposure at the food retail or
food service level (Quinlan, 2013). Studies have shown that high microbial loads were found
on produce from markets in low income areas (Koro et al., 2010; Newman et al., 2015).
Since 2008, FoodNet has released reports quantifying the incidence rates of bacterial
pathogens by race and ethnicity (Quinlan, 2013). If, as emerging data suggest, low income
and minority populations experience greater rates of food-borne illnesses, the question that
arises is to identify the retail outlet types these populations might be experiencing greater
risk of exposure to foodborne pathogens (Quinlan, 2013; Cheng et al, 2013; Thomas, 2012;
Varga et al, 2013). Studies have also failed to identify whether these differences are
associated with risk for FBI. Currently, FBI are of increasing concern and the proportion of
illnesses experienced by communities in different SES and/or demographics is still unclear
(Newman et al., 2015). Harris et. al (2014) suggested that further research is appropriate to
direct to the locations where critical food safety violations are high where training program
could be developed to eliminate these differences in locations.
Purpose of the study
The goal of the study is to identify the predictors of food-borne illness and food
safety risks from food entity establishments available to populations of different income
levels and different racial compositions in Florida during the period 2014-2016. The unit of

10
analysis will be the food entity establishments (retail facilities). Quantitative statistical
analysis was used to examine the relationship between the poverty rates and the foodborne
illness risk in food entity establishments in Florida, while controlling for and evaluating
effects of covariates known to affect poverty status.
Existing data datasets, utilizing records from Florida Department of Agriculture
Food Safety, will be used to answer the research question. The Florida Department of
Agriculture has a program that provides a functional database and supports food safety and
consumer protection in the state of Florida. Records (2013 to 2016) of sanitation and safety
inspections conducted by Department of Agriculture Food Safety on public food entity
establishments will be used to analyze retail food service and food safety risks. Samples are
obtained from routine inspections, Re-inspections, and complaint inspections. Routine
inspections are periodic inspections that are performed as a part of the on-going food safety
initiative. Re-inspections are completed when a facility has violations that need corrections
in more than the standard period. Complaint inspections are performed in response to a
citizen’s complaint. Both routine and complaint inspections are unannounced inspections
(FDACS, n.d.). Each inspection report is a print of conditions present at the time of the
inspection. On any given day, an establishment may have fewer or more violations than
noted in their most recent inspection. Local retail entities will either be independent
businesses or have a sister retail entity within the state of Florida only. The entity categories
of interest were as follows: Supermarkets, grocery, convenience stores, health market, retail
bakery, minor outlet, shopping center kiosk, flea market, mobile vendor, and specialty store.

11
Geographic information systems (GIS) will be used to plot entity establishments’ listings
from the database, and foodborne illness risk violations over poverty in Miami Dade
County. For my project, I will extract data from the Florida Department of Agriculture and
Consumer Services database to analyze the trend of food safety violations and factors of
food borne illnesses. This data set will assist in identifying foodborne illness risk factors that
need priority attention.
Research Questions/Hypotheses
RQ1- Quantitative: What are the associations between the frequencies of inspection rating
fail and the poverty level of the area when controlling for food facility type, race/ethnicity,
age, gender, and income level?
HO1: There is no association between the frequency of inspection rating fail and the poverty
level of the area when controlling for food facility type, race/ethnicity, age, and gender.
HO2: There is an association between the frequency of inspection rating fail and the poverty
level of the area when controlling for food facility type, race/ethnicity, age, and gender.
RQ2- Quantitative: Is there a relationship between the number of risk violations (food from
unsafe sources, inadequate cooking, improper hot/cold holding temperatures, contaminated
equipment, and poor personal hygiene) and the poverty level of the area when controlling
for food facility type, race/ethnicity, age, and gender?
HO1: The number of risk violations (food from unsafe sources, inadequate cooking,
improper hot/cold holding temperatures, contaminated equipment, and poor personal

12
hygiene) is associated with the poverty level of the area when controlling for food facility
type, race/ethnicity, age, and gender.
HO2: The number of risk violations (food from unsafe sources, inadequate cooking,
improper hot/cold holding temperatures, contaminated equipment, and poor personal
hygiene) is associated with the poverty level of the area when controlling for food facility
type, race/ethnicity, age, and gender.
RQ3- Quantitative: Is there a relationship between food entity type (Supermarkets, grocery,
convenience stores, health market, retail bakery, minor outlet, shopping center kiosk, flea
market, mobile vendor, and specialty store) and the number of food violations cited when
controlling for poverty level, race/ethnicity, age, and gender?
HO1: There is no association between the food entity type and the number of food violations
when controlling for poverty level, race/ethnicity, age, and gender.
HO2: There is association between the food entity type and the number of food violations
cited when controlling for poverty level, race/ethnicity, age, and gender.
RQ4—Quantitative: Does the food entity operation type (Supermarkets, grocery,
convenience stores, health market, retail bakery, minor outlet, shopping center kiosk, flea
market, mobile vendor, and specialty store) have an impact on the number of inspection
failures when controlling for poverty level, race/ethnicity, age, and gender?
H01: There is no association between the food entity operation type (Supermarkets, grocery,
convenience stores, health market, retail bakery, minor outlet, shopping center kiosk, flea

13
market, mobile vendor, and specialty store) and number of inspection failures when
controlling for poverty level, race/ethnicity, age, and gender.
HO2: There is an association between the food entity operation type (Supermarkets, grocery,
convenience stores, health market, retail bakery, minor outlet, shopping center kiosk, flea
market, mobile vendor, and specialty store) and the number of inspection failures when
controlling for when controlling for poverty level, race/ethnicity, age, and gender.
Framework
The Epidemiologic Triangle is a model that scientists have developed for studying
essential characteristic of the disease. Epidemiology triangle helps in identifying the major
risk factors and shows the relationship between the three characteristic factors that influence
the occurrence and prevention of the disease. For this study, the epidemiologic triangle
represented diagrammatically where it represented the interaction between person, place,
and time (Fig 1). Time is the periodic trend, and the periodic trend may indicate a change or
stability in the establishment characteristics. A person, individual or group of individuals
who are susceptible to the risk factors and the pertinent characteristics noted as age, sex,
socioeconomic status, race/ethnicity, and education. The place is the entity establishment
type in the geographic zone where the individual can be, where the violation can occur, and
where the individual can become infected from the food violated source. The three above
mentioned components of the triad co-exist independently; a condition occurs only when
there is an interaction between them (Fig 1). The epidemiological triangle model would be

14
the most effective framework for this study because it will help in the designing of
intervention strategies for food safety.
Figure 1. Epidemiology triangle. Adapted from [Nelson, K.E. & Williams C. F. (2007).
Infectious Disease Epidemiology: Theory and Practice, 2nd Edition. Jones and Bartlett
Publishers. Boston, Massachusetts.]
Nature of the Study
This quantitative study will employ an observational design. The presence of
foodborne illness risk factors and fail ratings in food entity will be the dependent variable
and percent poverty in the area with the primary independent variable with the type of retail
facility (supermarkets, grocery, and convenience stores), and the percent estimates of
Inspection failing rate and number risk factors
violations
Person
Group and population demographic
Place
Food entity with violation in inspection
Time
Trend and period of time

15
housing units, households, persons below poverty, civilian (age 16+) unemployed, persons
aged 65 and older, persons aged 17 and younger, civilian noninstitutionalized population
with a disability estimate, single parent household with children under 18 estimate, minority
(all persons except white, non-Hispanic), persons (age 5+) who speak English "less than
well", mobile homes, households with no vehicle available, persons in institutionalized
group quarters, serving as control variables. Data on food entity facilities (collected for
period 2013 to 2016) will be obtained from the Florida Department of Agriculture database
to compare the prevalence of foodborne illness risk factors and fail ratings from the location
of food store. The database will provide the information on the location of food entity
establishment by type (Supermarkets, grocery, convenience stores, health market, retail
bakery, minor outlet, shopping center kiosk, flea market, mobile vendor, and specialty
store), as well as a description of the inspection results. Data available from the U.S. Census
Bureau will be used to identify census tracts of the categories that fit our definition for the
different population demographics.
Definition of study variable
Food borne illness risk factors: are some extensive categories of contributing factors
directly relate to food safety concerns within retail and food service establishments.
Example of Food borne illness risk factors include: food items from unsafe sources, poor
personal hygiene, inadequate cooking temperatures, improper cold or hot holding
temperature of foods, and unclean food contact equipment (FDA, 2010).

16
Facility/Entity: means any establishment, structure, or structures under one
ownership at one general physical location, or, in the case of a mobile facility, traveling to
multiple locations, that manufactures/processes, packs, or holds food for consumption in the
United States 21 CFR1.227(Code of Federal Regulations, Title 21, Volume 1).
Various types of entities used in this study, and the FDACS have defined them as:
Super-Market: A store that allows individuals to purchase an array of foods that may contain
five or more registers, 15,000 or greater total square footage, including display, preparation,
and storage areas.
Grocery stores: A store like supermarkets in which they offer consumers by contain four or
fewer checking out registers, and they are less than 15,000 total square footage, including
display, preparation, and storage areas.
Convenience stores: A store that offers a limited array of groceries or fuel for motor
vehicles; such stores will likely offer coffee and other beverages to consumers.
Convenience Stores with limited food service: A store that offers consumers prepared foods,
individually portioned. These stores mainly offer snack foods and other processes foods,
such as hotdogs. No retail food processing occurs on site.
Convenience Stores with significant food service: A store that prepares food on site but also
sales limited groceries.
Minor Food Outlet: A store that mainly functions as a grocery store but likely offer food
service to consumers on a minor scale than convenience stores.

17
The US Census Bureau is in accordance with the American Community Survey (ACS) on
the definition of demographic. The ACS break the poverty level and the demographic area
down into different elements as follows:
-Population estimate, 2010-2014 ACS
-Housing units estimate, 2010-2014 ACS
-Households estimate, 2010-2014 ACS
-Persons below poverty estimate, 2010-2014 ACS
-Civilian (age 16+) unemployed estimate, 2010-2014 ACS
-Persons aged 65 and older estimate, 2010-2014 ACS
-Persons aged 17 and younger estimate, 2010-2014 ACS
-Percentage of civilian noninstitutionalized population with a disability
estimate, 2010-2014 ACS
-Single parent household with children under 18 estimate, 2010-2014 ACS
-Minority (all persons except white, non-Hispanic) estimate, 2010-2014 ACS
-Persons (age 5+) who speak English "less than well", 2010-2014 ACS
-Mobile homes estimate, 2010-2014 ACS
-Households with no vehicle available estimate, 2010-2014 ACS
-Persons in institutionalized group quarters estimate, 2010-2014 ACS

18
Scope/Delimitation/Limitations
Scope
The scope of this study is to explore how food-borne illness and food safety risks and
inspection rating from food entity neighborhood sociodemographic characteristics could
predict the foodborne illness exposure from food safety inspection outcomes. The
prevalence of those foodborne-illness and safety risk factor violations considered to be food
from unsafe sources, inadequate cooking, improper hot/cold holding temperatures,
contaminated equipment, and poor personal hygiene. Only those risk factors violations are
presented. Other risk factor or contaminants, including chemical (e.g., pesticides,
pharmaceutical agents, and toxins) and physical (e.g., metal fragments, dust, and dirt)
violation, are not discussed.
Delimitation
The data in this study was limited to food establishment routine inspection collected
in district 13 with results, fail. Hence, the data collected are not representative of the entire
state of Florida or the United States. Only data from the period of 14 January 2014 through
December 2016 were analyzed. The Florida Department of Agriculture, food safety program
is based on the 2009 Food Code Model (FDA, 2009a) and the Florida Health and Safety
Code, which has the purpose of safeguard public health, assure that consumers obtain food
that is safe, unadulterated, detect food establishment’s operational needs and prevent food-
borne illness outbreaks (HCPHES,2011).

19
Limitations
The main limitations to this study came from the use of secondary data. However
great the use of secondary data is they do come with certain limitation. A major limitation of
using secondary data is there is a chance of mistakes in the data due to such things as
incorrect reporting or incorrect data inputting or just simple human error. Due to the large
sample size, this will be minimized. Data randomization will not be done; some of the
limitations the researcher cannot control for as it were critical in this study to have all the
available data on food safety practices included due to their importance. Another limitation
was the possibility that the documentation of inspections was not consistent. High risk food
establishments require three routine inspections a year and medium risk establishments 14
require two routine inspections. Thus, there may be a lack of data regarding health
inspections conducted because health inspectors were not able to conduct routine inspections
as required due to varying reasons, such as lack of time, high work load, and other pressing
public health issues that are the responsibilities of public health inspectors.
Significance
In 2014, there were 8,061 food products recalls by Food and Drug Administration
(Thrall, 2016). Many of these recalls have been high risk recalls, largely due to potential
contamination due to either E. coli O157:H7, Salmonella, or undeclared allergens. Chang et
al. (2009) indicates that the incidence rates of salmonellosis and shigellosis are positively
and independently associated with high poverty areas. The food supply chain is one of the

20
most important supply chains in the US economy. However, it has also suffered from many
safety incidents. Quinlan (2013) found that food safety problems are more prevalent at
small, independently owned markets, low-income and minority populations shop. Risks
include produce with high microbial counts, bacteria in milk, and fecal coliform
contamination (Quinlan, 2013; Silbergeld et al, 2013). Populations with low socioeconomic
status (SES) and minority populations have greater access to small corner store markets and
less access to supermarkets (Quinlan, 2013). Currently food-borne illnesses are of
increasing concern, and the proportion of illnesses experienced by low income groups
compared to high income groups is still not clear (Newman et al., 2015). The study will
help to fill a gap in the literature about the association between food retail risk and the
different demographic risk factors to food-borne illnesses, which may lead to decreased
food-borne illness risk in South Florida with similar characteristics. This study will
contribute to the professional practice in public health in the areas of food safety helping to
reduce the risks of food-borne illnesses. It could also bring positive social change by
increasing awareness and understanding of food-borne illness risks to consumers from
different population groups in South Florida.
The purpose of Chapter 1 was accomplished as stated in the introduction by
establishing the framework of the study. An introduction of the subject matter and a
statement of the problem were provided, and the purpose of the study was described.
Research questions/hypotheses were presented, along with a justification of the need for the
study. In addition, basic assumptions, delimitations, limitations, and definitions of terms

21
were discussed. Chapter 2 follows with a comprehensive review of the literature related to
the study topic and methodology.

22
Chapter 2: Literature Review
Introduction
Foodborne illnesses are an important public health problem worldwide (Quinlan,
2016). The World Health Organization (WHO) has created an initiative to estimate the
global burden of foodborne illnesses, and they have stated that the achievement of certain
Millennium Development Goals is being directly compromised due to foodborne illness
(McLinden, 2014). However, governments have finite resources with which to address the
health of their populations, and thus require high-quality scientific evidence to prioritize
resource allocation. Accurate burden of illness estimates is useful for decision makers
seeking to allocate resources to address the issues caused by foodborne pathogens
(McLinden, 2014).
Foodborne illnesses are costly not only to those who suffer from it, but they also
generate a considerable disease burden and economic loss. According to the United States
Department of Agriculture (USDA), foodborne illness costs the United States economy
between $10-83 billion United States dollars (USD) per year (McLinden et. al, 2014). In
Australia and New Zealand, the cost of foodborne illness has been estimated at $1.289
billion and $86 million USD per year (McLinden et. al, 2014). In Europe, the annual cost of
foodborne illness was estimated to be $171 million USD in Sweden and $2 million USD in
Croatia (McLinden et. al, 2014).

23
There are numerous areas inside the food establishment chain, from the cultivated to
the retail foundation, where foods may be contaminated and/or misused. It is subsequently
critical for all ranges of food production to be carefully observed and controlled so that
the hazard of food-borne illness is diminished. Contributing components to foodborne
infection in the food establishment incorporate food handler (e.g., norovirus), insufficient
hand washing by nourishment handlers, and cross-contamination between items. Numerous
foodborne illnesses happen since of misused food in foodservice and food retail foundations.
Research has demonstrated that food preparation practices in the establishment were most
commonly associated with outbreaks of Escherichia coli O157 (100% of outbreaks), C.
perfringens (81%), and Salmonella (58%) infections. Variables relating to defilement
exterior the eatery were most common among outbreaks of Vibrio infection (100% of
outbreaks), histamine fish poisoning (89%), and E. coli O157:H7 infection (80%). Since
foods prepared in these establishments are the closest link to ingestion by the consumer,
monitoring, and control of food-borne risks is most critical at the foodservice and food retail
end of the food production.
In this chapter, I provide a review of the extant literature related to this research
where the summarized evidence indicates that individuals of low economic and minority
groups may have greater exposure to food-borne illness. In the first section, I illustrate the
current food safety system in the United States and the evidence related to the role of food
safety programs and inspectors in food-borne Illness. I discuss the causes of food-borne
illness in establishments and how food safety surveillance data provide a guideline as to

24
what areas of food safety need improvements to reduce the occurrence of food-borne illness.
Studies use food safety surveillance data to understand the epidemiology of food-borne
diseases. Following this, I present studies that show disparities in trends of foodborne
diseases for different populations. Finally, I highlight the gaps in the current literature on
food safety.
Literature Search Strategy
I conducted a literature review search to reveal theoretical gaps in food-borne disease
research. I reviewed articles from 2013 to 2016 that addressed factors related food borne
infections, food safety program and inspector roles in national level food safety surveillance
data, food-borne illness in relation to ready-to-eat foods at the retail level, and incidence of
food-borne illness for populations of different races/ethnicities, and socioeconomic status
populations. Academic Search Premier, Walden University library, Proquest, PubMed, and
Google Scholar were used to extract scholar (Peer Reviewed) journals that related to food
borne illness and to the gaps of research on food borne illness in America. Key search terms
were food safety, food safety education, certified food safety managers, food safety
practices, ServSafe, restaurants food-borne illness outbreaks, critical violations, and food
safety training. Additional research was conducted using citations of articles in the
literature. Further research was conducted to identify and download more articles related to
food safety using the key terms. The result of the search included 80 journals where 16
journals were selected, and the remaining journals were expelled as less important sources. I
25
focused on the 16 significant journals that published in the past 5 years. Significant articles
selected are summarized in the literature matrix in Table 1.
Theoretical Framework Foundation: The Epidemiologic Triangle
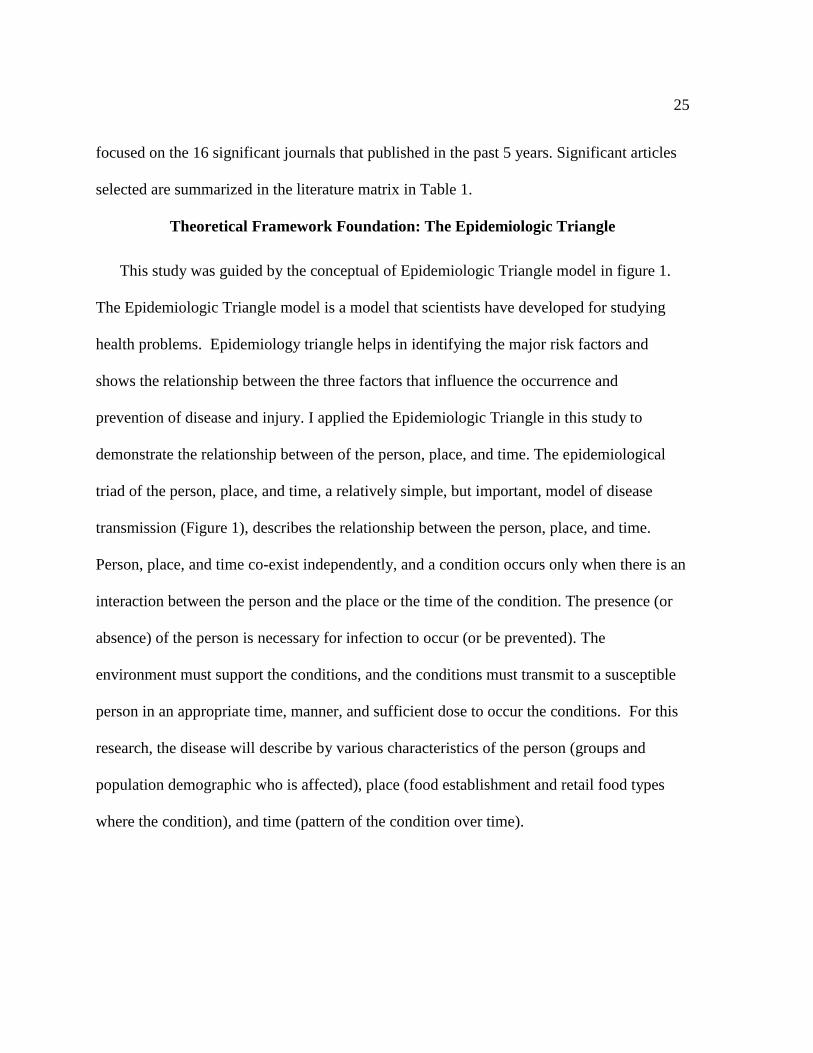
This study was guided by the conceptual of Epidemiologic Triangle model in figure 1.
The Epidemiologic Triangle model is a model that scientists have developed for studying
health problems. Epidemiology triangle helps in identifying the major risk factors and
shows the relationship between the three factors that influence the occurrence and
prevention of disease and injury. I applied the Epidemiologic Triangle in this study to
demonstrate the relationship between of the person, place, and time. The epidemiological
triad of the person, place, and time, a relatively simple, but important, model of disease
transmission (Figure 1), describes the relationship between the person, place, and time.
Person, place, and time co-exist independently, and a condition occurs only when there is an
interaction between the person and the place or the time of the condition. The presence (or
absence) of the person is necessary for infection to occur (or be prevented). The
environment must support the conditions, and the conditions must transmit to a susceptible
person in an appropriate time, manner, and sufficient dose to occur the conditions. For this
research, the disease will describe by various characteristics of the person (groups and
population demographic who is affected), place (food establishment and retail food types
where the condition), and time (pattern of the condition over time).

26
In this model, food in the retail establishments is considered safe when it has reasonably
demonstrated that no harm will result from its consumption by people. Food is considered
contamination if there is anything in the establishment that reduces the safety or quality of
the food. Food can be contaminated by biological, chemical, or physical hazards. This study
will focus primarily on biological hazards and chemical since they are the most common
hazard in foodservice and food retail. There are many areas within the food production
chain, from the farm to the retail establishment, where foods may be contaminated and/or
mishandled. It is therefore important for all areas of food production to be carefully
monitored and controlled so that the risk of foodborne illness is decreased. Many foodborne
illnesses occur because of mishandled foods in foodservice and food retail establishments.
Review of Studies Related to Key Concept: Food- borne Disease Inspections, and Food
Safety
Definition of Food-borne Disease
Foodborne illness is a preventable public health challenge that causes an estimated
48 million illnesses and 3,000 deaths each year in the United States. An illness comes from
eating contaminated food (USDA, 2013). The onset of symptoms may occur within minutes
to weeks and often presents itself as flu-like symptoms, as the ill person may experience
symptoms such as nausea, vomiting, diarrhea, or fever. Because the symptoms are often flu-
like, many people may not recognize that harmful bacteria or other pathogens in food cause
the illness (USDA, 2013). The problems of food safety in the developed countries differ

27
considerably from those of developing countries. Whereas, in developing countries
traditional methods of processing and packaging, improper holding temperature, poor
personal hygiene of food handlers is still observed during food marketing and technology
(Mensah et al., 2002).
Food Safety
Food is crucial for life but can as it served such as a critical reason if it is secure and
secure to ingest. Food can be characterized as eatable substances whether in common or
made state which, from an open wellbeing point of view frame portion of the human count
calories (Will and Guenther, 2007). Understanding the need of getting to sound and
nutritiously sound foods is imperative for all. Food security is a broader term, which implies
an affirmation that food will not cause hurt to the customer when it is arranged and/or eaten
agreeing to its expecting utilize. This can be accomplished through the utilization of
different assets and techniques to guarantee that all sorts of foods are legitimately put away,
arranged, and protected so that they are secure for utilization (WHO, 2000). Practicing this
level of food sanitation starts with the buy or securing of distinctive food items and closes
with the appropriate capacity of scraps for future utilize. One of the most vital viewpoints of
practicing food security includes anticipating foods from getting to be sullied. Making
beyond any doubt, foods are put away appropriately goes a long way in dodging any sort of
food defilement. Essential kitchen sanitation rules are imperative component of any food
security methodology (Jevs'niket al., 2006a). Food elaborated with satisfactory hygienic

28
standards is one of the essential conditions for promoting and preserving health, and
inadequate control is one of the factors responsible for the occurrence of foodborne disease
outbreaks (Oliveira et al., 2003).
Lacking food security is a significant contribution to the burden of disease in
developing countries including Kenya and ought to be tended to as the food framework
creates along with related speculation in public health. The overwhelming burden of
foodborne illnesses forces considerable financial misfortunes to person, families, health
system and entire nation. Financial misfortunes because of rejected nourishment sends out
due to deficiencies in food security and too regularly exceptionally critical.
Food Contaminants
Separated from objectionable materials, such as rust, earth, hair machine parts, nails,
and jolts (physical contaminants), food contaminants drop into two wide categories;
biological agents such as bacteria, viruses, molds, antibiotics, parasites, and their toxins,
which can cause a wide range of illnesses and chemicals such as lead cadmium, lead,
mercury, nitrites, and organic compounds which can have both acute and chronic health
effects. Such contaminants can pick up to get the food chain at any of many stages during
growing, processing, preparation, or storage. Microbiological sources stand out for posturing
an awesome hazard to public health since of the seriousness of the clinical indications and
the expansive number of food and microorganisms that can be involved (Silva et al., 2003).

29
Generally, pathogenic microbes have been the most predominant food security
danger, with viral cases taking after closely behind concurring to a CDC report on the
etiology of foodborne sickness (CDC, 2004). Such pathogens cannot be recognized
organoleptically (seen, noticed, or tasted) but can cause infection of shifting seriousness,
which may result in passing. Microbial sources account for upwards of 95% of all detailed
foodborne infection episodes (Marshal and Dickson, 1998). Studies of microbial pathogens
and poisons have been distributed in a few valuable compilations (CDC, 2002, Lynch et al.,
2006). Most of the outlines concur in their conclusion that bacterial pathogens are
dependable for the lion’s share (>80%) of flare-ups cases. Individual of the
Enterobacteriacea, Salmonella serovas, enterophathogenic E. coli, and Shigella ssp and
individuals of the campylobacterageic, Campylobacteraceae, campylobacter jejuni and C.
coli, are mindful of the lion’s share (>70%) of foodborne bacterial sickness. Of auxiliary
significance are harmful contamination by Clostridium perfringens and Bacillus cereus,
intoxications by Streptoccoccus spp and Listeria monocytogenes (Johnson, 2003, pp 30).
Chemical nourishment security dangers change broadly, but the most common issues cited
in the writing incorporate defilement with pesticides, allergens, and characteristic poisons,
counting scrombotoxins found in angle and mycotoxins found in crops. Remote objects, or
physical dangers, are the slightest likely to influence expansive numbers of individuals and a
rule are effectively recognized (Johnson, 2003, pp 30).

30
Epidemiology of Foodborne Diseases
A foodborne disease outbreak defines as two or more illnesses caused by the same
germ (e.g., a toxin, virus, or bacteria) which link to eating the same food. Each year, >9
million foodborne illnesses are estimated to be caused by major pathogens acquired in the
United States. CDC estimates that each year roughly 48 million people gets sick from a
foodborne illness, 128,000 hospitalized, and 3,000 die. 9.4 million of these estimated
illnesses are caused by 31 known pathogens, but the majority (38.4 million) are the result of
“unspecified agents” (Scallan et al. 2011). Because the difference in illness caused by
known and unknown foodborne agents is so great, when the CDC released its foodborne
illness reports in 2011, the authors published two separate reports, one detailing the 31
known pathogens and the other explaining the large amount of illness unaccounted for by an
identified agent (CDC, 2011). The “top five pathogens causing domestically acquired
foodborne illness” are norovirus (5,461,731 per year), Salmonella (nontyphoidal, 1,027,561
per year), Clostridium perfringens (965,958 per year), Campylobacter spp. (845,024 per
year), and Staphylococcus aureus (241,148 per year) (Scallan et al. 2011). The “top five
pathogens causing domestically acquired foodborne illness resulting in hospitalization” are
Salmonella (nontyphoidal, 19,336 per year), norovirus (14,663 per year), Campylobacter
spp. (8,463 per year), Toxoplasma gondii (4,428 per year), and E. coli (STEC) O157 (2,138
per year) (Scallan et al. 2011). Finally, the “top five pathogens causing domestically
acquired foodborne illnesses resulting in death” are Salmonella (nontyphoidal, 378 per

31
year), Toxoplasma gondii (327 per year), Listeria monocytogenes (255 per year), norovirus
(149 per year), and Campylobacter spp. (76 per year) (Scallan et al. 2011).
Although outbreak-associated infections account for only a small proportion of
culture-confirmed infections, outbreaks are associated with substantial morbidity and played
an important role in our understanding of the epidemiology of foodborne illness (Gould et
al., 2013). Outbreaks can occur in many settings, but eating in a restaurant is a risk factor for
acquiring a foodborne illness (Gould et al., 2013). More than half of all foodborne disease
outbreaks reported to the Centers for Disease Control and Prevention (CDC) are associated
with eating in restaurants or delicatessens (Gould et al., 2013). Guzewich and Ross (2013)
and Olsen et al. (2000) suggested that poor personal hygiene of food workers is a
contributing factor to foodborne illness outbreaks. With restaurants being the location
commonly identified for food-borne illnesses, it is critical that employees and managers
understand the causes of food-borne illness and ways to prevent food-borne illness.
Risk factors contributing to foodborne illness in food service establishments
Risk factors and food safety violations typically cause foodborne illnesses commonly
to occur in five categories: food from unsafe sources, inadequate cooking, improper hot/cold
holding temperatures, contaminated equipment, and poor personal hygiene (Roberts et al.,
2012). The criticality of violation is interpreted by a safety and quality of food that produced
for human consumption in developing countries continue to increase because of foodborne
disease outbreaks attributed to unsafe raw food, abused temperature, poor storage

32
infrastructures, inadequate cooking, poor personal hygiene, improper handling methods, and
cross- contamination of cooked food with uncooked raw food.
Risk factors associated within establishments
To gain a better understanding of the risks associated with restaurants and foodborne
illness, a network of environmental health specialists referred to as EHS-Net was
established. EHS-Net conducts food safety research and surveillance in restaurants,
identifying how and why food-borne illness outbreaks occur and translating the knowledge
into preventive practices (Hedberg et al., 2013). EHS-Net is a network of environmental health
specialists and epidemiologists collaborating and exchanging ideas with laboratories, food
protection programs, the Environmental Health Branch of the National Center of Environmental
Health at CDC, the Food and Drug Administration, and FoodNet. Important information on food
safety policies and practices have been found by EHS-Net in conducting to these
environmental assessment studies. Gould et. al (2013) found among 457 foodborne disease
outbreaks reported in 2006 and 2007 by FoodNet sites, 300 (66%) were restaurant
associated, and of these 295 (98%) had at least one reported contributing factor. Of the 257
outbreaks with a single etiology reported, contributing factors associated with food worker
health and hygiene were reported for 165 outbreaks (64%), factors associated with food
preparation practices within the establishment were reported for 88 outbreaks (34%), and
factors associated with contamination introduced before reaching the restaurant were
reported for 56 outbreaks (22%).

33
Risk factors associated with cross-contamination
The transfer of germs from one food items to another is called cross contamination.
Inadequate food preparation practices, including cooking and cross-contamination factors,
are associated with approximately 3.5 million cases at a cost of4.3 billion USD, annually
Approximately 10 to 20% of food-borne disease outbreaks are due to contamination by the
food handler (Zain & Naing, 2002). It is also well known that cross-contamination and
improper cooking temperatures contribute to the burden of food-borne illness; several
studies have been conducted and have observed these two risk factors. Improper food-
handling practices in the food industry are the number one cause of staphylococcus
foodborne disease outbreaks. Aseffa (2015) was assessed the bacterial hand contamination
and associated factors among 230 food handlers working in the student cafeterias of Jimma
University main campus. They found that 114 (49.6%) were tested positive for one or more
potential foodborne bacterial contaminants, and 73 (31.7%) were tested positive for enteric
pathogens. A total of 171 bacterial hand contaminants was isolated. S. aureus 54(23.5%),
Klebsiella spp. 37 (16.1%), E. coli 25 (10.9%), Enterobacter spp. 21(9.1%), Citrobacter spp.
10 (4.3%), Serratiamarcescens 6 (2.6%), Pseudomonas aeruginosa 8 (3.5%), Proteus spp. 5
(2.2%), Providencia rettegri 3 (1.3), and salmonella spp. 2 (0.9%) were isolated with their
corresponding prevalence rate. Bacterial hand contamination rate has significant association
with service years.

34
Food handlers frequently have small understanding of the chance of microbial or
chemical defilement of nourishment or hot dodge them (Hobbs and Roberts, 1993). A
survey conducted by Williamson, Gravani & Lawless (1992) revealed that unsafe use of
kitchen utensils was common. Their result showed that 37% of the survey respondents
would only rinse the knife and cutting board used to cut fresh meat prior to using the same
items again to chop fresh vegetables for a salad. On the other hand, 5% of the respondents
would simply start chopping the vegetables with the same knife and cutting board. They
summarized that only 54% would wash the knife and cutting board with soap and water
prior to chopping the fresh vegetables.
Risk factors associated with personal hygiene
Poor hygiene and handling food cause more than 90% of the food safety problems.
Insights appeared that disgraceful hand washing alone accounts for more than 25% of all
foodborne diseases (Weinstein, 1991). Manning & Snider (1993) found that some personal
hygiene and handling practices of workers did not support their knowledge and attitudes
about hygiene and cross contamination. Food handlers play a major role in the transmission
of food borne pathogens via hands. Food handlers are the most important sources for the
transfer of microbial pathogens to food either from their hair, skin, hand, digestive systems,
respiratory tracts, or from contaminated food prepared and served by them. The hands are
the last line of defense against exposure to pathogens which can occur either directly from
the hand to the mouth, eye, nose, or other area of the skin, or indirectly by “handling” of

35
food or water. A research was designed to determine the level of bacterial contamination
among food handlers working at various restaurants in Kano state metropolis, Kano Nigeria.
135 samples were collected from the palm of food handlers of 15 different restaurants, in
which each sample obtained, were cultured, bacteria isolated, identified, and characterized
per standard procedure. Result shows that among 8 different species of bacteria isolated and
identified, Escherichia coli has the occurrence of 20.3%, Enterobacter spp 15.4%, Shigella
spp 14.7%, Staphylococcus aureus 14.7%, Salmonella spp 13.9%, Klebsiella spp 11.9%,
Streptococcus spp 6.2%, and Vibrio spp with occurrence of 2.8%. The result of this research
shows the occurrence of pathogenic bacteria on the hands of food handlers working in these
various restaurants (Yusuf, 2016).
Risk factors associated with associated with the temperature of food
As explained by McSwane et al. (2004), controlling temperature of food cook is vital
in assuring that food service establishment complies with food safety regulations. Food
borne illness may be resulted from temperature abuse while preparing a dish. National
Restaurant Association Educational Foundation (NRAEF) (2012) has reported that time
temperature abuse arises when food has been allowed to remain for a long time at
temperatures favorable to bacterial growth. McSwane et al. (2004) further added that the
abuse of temperature also may be caused by insufficient amount of cooking or reheating
time and desired temperatures that should eliminate the existence of harmful microorganism.
The usage of devices in measuring food temperature such as thermometers, thermocouples

36
and infrared reading is essential in determining whether the food was in the danger zone or
otherwise (McSwane et al., 2004). Nott & Hall (1999) explained that the major purpose of
cooking is to increase the palatability of food, the heating of many foods is essential to kill
bacteria thereby increasing the foodstuff's safety and storage life. In practice, pasteurization
and other sterilization processes require stringent assurance that all parts of the food product
have been heated above a certain temperature for a defined period (Nott & Hall, 1999).
Several studies have reported that poor holding and cooking temperature control was a main
factor contributing to food borne outbreaks (Todd, 1997). Improper holding temperature of
food also can contribute to the growth of certain bacteria through its spores because not all
these spores will be destroyed with heating processes (McSwane et al., 2004). Thus it is
important for all food handlers to recognize their responsibilities in ensuring that all food
prepared were monitored in every stages of its preparation.
The risk that is of greatest concern for food-borne illness transmission involves
employees working while ill. Carpenter et al. (2013) interviewed food service workers and
discovered that 20% reported working while having symptoms such as vomiting and
diarrhea. From 2001 through 2008 in the United States, food service workers were linked to
food-borne illness outbreaks of norovirus (Hall et al., 2012). The FDA (2012b) has
designated symptoms associated with food-borne illness, which include vomiting, diarrhea,
jaundice, sore throat accompanied by a fever, and open wounds. The FDA indicated that five
food-borne illnesses are commonly transmitted through food— Salmonella, Shigella,

37
Norovirus, Shiga-toxin producing E. coli, and Hepatitis A—and must be reported by an
employee to a manager or person in charge. Clearly, it is important that managers and
employees understand the causes of food-borne illness and appreciate the need for not
working while ill, good hygienic practices, and practicing food safety to prevent food-borne
illness outbreaks. In addition, employees should be trained to understand and gain
knowledge of food safety practices and should be observed by a manager who is certified in
food safety.
Importance of food safety
Over the past two decades, food security safety measures have been basic thought of
the consumer’s in-house and restaurant assurance decision-making plan (Onyeneho, S. N., &
Hedberg, C. W. (2013). The noteworthy of food security has extended during the on-going
press releases recognizing contaminated food products sold to the public and the partiality of
restaurateurs to continue harming secure taking care of directions (Harris et al., 2014).
Disillusionments of restaurateurs and sellers to prepare staff, implement safe food handling
practices, and implement systems to deliver safe food as mandated by the United States
Department of Agriculture (USDA), the United States Food and Drug Administration
(FDA), and the Centers for Disease Control and Prevention (CDC), proceeds to be a concern
for food safety systems nation-wide (Harris et al. et al., 2014). Consumers are uncertain
almost whether restaurants are genuinely secure places to eat, and they have small certainty
that retail food outlets are centering on ensuring their supporters (Harrington, 2009). In

38
despite o proceeded endeavors to direct food safety in foodservice operations, most the
detailed cases of foodborne illness can be followed back to open eating foundations that
incorporate eateries (Harris et al. et al., 2014).
Importance of Inspections in Food Safety and Food-Borne Illness
Inspections have been a part of food safety regulatory activities since the earliest
days of public health. The term "routine inspection" has been used to describe periodic
inspections conducted as part of an on-going regulatory scheme. Routine Health inspections
are conducted in restaurants and food establishment service to prevent food-borne illness by
ensuring that food is handled correctly and prepared safely. However, health inspections
alone have not been effective in reducing critical violations due to unsafe food handling
practices (Cruz et al., 2001; Jones et al., 2013; Newbold et al., 2015; Phillips et al., 2012).
In a prior r study, Irwin et al. (2012) analyzed the association between routine
inspections and food-borne illness in restaurants and found a significant association between
inspections and food-borne illness from restaurants. Reproducing the think about by Irwin et
al. 1989, Cruz et al. (2001) tested the association between food-borne illness and violations
cited during routine inspections using a random sample of 127 restaurants that were divided
into those that had outbreaks (n = 51) and those with no outbreaks (n = 76). However, there
were factually critical different between the two groups, and no basic infringement had been
cited among 45% of the case restaurants prior to an outbreak. Results demonstrated that
restaurant inspections alone do not effectively predict outbreaks, but that food safety training

39
and a HACCP plan are required in the prevention of food-borne illness. Cruz (2016)
conducted a study with 51 outbreak inspection reports of restaurants to determine the
usefulness of restaurant inspections in predicting food-borne outbreaks in Miami–Dade
County, Fla. Result show that restaurant inspections in Miami–Dade County did not predict
outbreaks.
Basic infringement posture considerable health hazards and likely to contribute to
foodborne illness. Statewide survey data (1993-2000) from restaurants in Tennessee were
reviewed by Jones et al. (2004). A total of 167,575 restaurant inspections was examined to
determine whether inspection scores could predict food-borne illness. Researchers reported
that there was no critical distinction between mean scores of restaurants with reported
outbreaks and mean scores for those with no reported outbreaks. Violations most commonly
cited during routine inspections among restaurants with reported outbreaks were the same
ones cited among restaurants that were not involved in outbreaks. However, Cruz et al.
(2001) found that case restaurants, when compared to the controls, were three times more
likely to be cited for vermin and had larger seating capacities; both variables are related to
outbreaks. Jones et al. reported that before an outbreak was reported, the mean score for the
restaurant’s last inspection was 81.2% and was 81.6% for the previous inspection was,
whereas restaurants with no reported outbreak had mean scores from 80.2% to 83.8%.
However, in the Cruz et al. study, case restaurants’ scores were less to be the most favorable
(70%), while the control group had a rating of 80%. One limitation to the Jones et al. study
was limited data on outbreaks in Tennessee, which suggested that scores alone are not a
40
direct reflection of a restaurant in the prediction of food-borne illness. In both studies,
violations most commonly cited during routine inspections improper heating and cooling,
improper cooking, holding, and storage. More education and food safety training is needed
in restaurants; along with the appropriate regulatory action such as inspection follow-up to
prevent the occurrence of food-borne illness.
Scores alone are not a coordinate reflection on a restaurant in the prediction of
foodborne illness. Just because a restaurant scores 90 or above, one ought to not expect that
there was no basic violation cited that might pose a risk; moreover, a restaurant with a score
of <80 may have a few violations but no basic that pose a risk for food-borne illness. To
avoid food-borne illness, there are different extra factors such as extensive education,
training, or HACCP (Hard Analysis Critical Control Point) plan that must be established. In
addition, researchers in the past studies suggested that other factors such as policies and
standardization of inspectors have an influence the inspection process of restaurants in
preventing food-borne illness. Health inspections of restaurants play a part in food security
but alone are not sufficient in avoiding foodborne illness. Reviews, in common, allow a
preview appearing what ranges of a foundation require enhancement.
Food safety in Florida
Levels of participation between the CDC, USDA, state-regulated restaurant and
lodging licensing boards, and inspection services offering training and support to restaurant
operators and food handlers are at an all-time high; however, the consistent monitoring of

41
the quality of these programs is not (Murphy et al., 2011). In Florida, a food service
establishment is defined as any place where food is prepared or provided in individual
proportions for consumption on or off the premises and includes restaurants, delis, take-out
food premises, and similar type establishments (Florida Health, 2012a). All food service
establishments are subject to the requirements of Florida Regulation 339/88R, Food and
Food Handling Establishments Regulation under The Florida Public Health Act (Florida
Health, 2014b). Food safety programs in Florida mandate that both food handlers and
managers of retail food operations achieve certification within 60 days of employment.
Specifically, Florida Food Statutes (#509-049) require the Division of Business and
Professional Regulation (DBPR) to monitor certifications, and re-certification every three
years. Training must do by an approved state-evaluated provider (U.S. Public Health
Service, 2001).
Public Health Inspectors conduct food service establishment inspections. The Florida
Department of Agriculture and Consumer Services (FDACS), Division of Food Safety
Bureau of Food and Meat Inspections regulate food establishments. FDACS regulates over
4,500 manufactured food entities in the State of Florida and is responsible for permitting
these facilities. Public health inspections determine if regulatory requirements and industry
standard practices are being followed with respect to food temperature control, food
protected from contamination, employee hygiene and hand washing, food handling and
procedures for cleaning and/or sanitizing equipment or food contact surfaces, pest control
and storage/removal of waste (Allwood et al., 1999; Yeager et al., 2013). Health Inspection

42
can happen as 1) a routine inspection, which is an inspection of a facility that perform at
relatively consistent intervals and determine compliance with the Florida Food Regulation
(Florida Health, 2014a). 2) A re-inspection, which is an inspection of a facility that is
performed to determine if noncompliant food safety practices noted in the previous routine
inspection have been corrected. 3) Additional inspections which occur as necessary, such as
investigation of food-borne illnesses and food-borne outbreaks, investigation of consumer
complaints and correction of noncompliance with the Florida Food and Food Handling
Establishments Regulation (Florida Health, 2012).
Each visit by the Public Health Inspector creates an inspection report that is given to
the operator. The health inspection reports either affirm that the food premise is compliant
with regulations, or to illuminate that there are food safety practices that are not being
followed and that must be addressed. Those food premises that are compliant will be
reviewed as per next schedule routine inspection date (Florida Health, 2012). Those food
premises with food safety practice(s) noncompliance will require a re-inspection inside and
endorsed time, which is demonstrated by the health inspector to guarantee compliance with
the regulation.
In Florida, food establishments are classified in three categories: food handling
establishment, food processing plant and food service establishment. A food handling
establishment includes a food service establishment, retail food store, food processing plant,
temporary food service establishment, meat processing plant or any place, premise were
food is manufactured, processed, prepared, packaged, stored, or handled, or sold or offered

43
for sale (Manitoba Health, 2014a). A food processing plant is a Commercial establishment
in which food is manufactured, processed, or packaged. A food services establishment is any
place where food is prepared or provided for individual consumption, does not include a
food processing plant or retail food (Florida Health, 2012).
Food safety practices of the regulation may be considered critical or non-critical.
Critical practices are those that, on the off chance that cleared out uncorrected, are more
likely to cause or contribute if let uncorrected, are more likely to cause or contribute to food
contamination or food-borne illness. Critical conditions include the following; water supply,
food source, food condition, food protection, food handling, cold food storage, hot food
storage, pest/animal control, equipment Sanitation, utensil sanitation, staff/employee health
and hygiene, manual dishwashing and mechanical dishwashing and construction (Florida
Health, 2014a). During each routine inspection, the inspector checks all conditions. When a
food safety practice is considered critical, an immediate corrective action is required by the
food establishment operator and a re-inspection is to be conducted in a timely manner. When
a food safety practice is considered non-critical, more time is generally given to the operator
to provide corrective action (Florida Health, 2012).
At the time of this study, violations found in restaurant inspections in Florida are
categorized as critical violations, non-critical violations, and risk factors. This study
investigates the high-risk infractions (critical violations) that inspectors found in low SES
foodservice operations. Further, foodservice status as a chain or a non-chain type and
location of the food business depended on the district where the foodservice operates.

44
Critical food safety violations are those infractions that, if not corrected, are more likely to
directly contribute to food contamination or illness. Some examples of these include poor
temperature control, improper cooking or holding of food, cross contamination, or improper
reheating of food items (Florida Department of Business and Professional Regulations,
2013).
Non-critical violations are those practices that do not directly relate to foodborne
illness risk, but are preventative measures used to control environmental conditions. Some
examples include poor maintenance of food and non-food contact surfaces, improper storage
and handling of clean equipment and utensils. Risk factors are those food preparation
practices and behaviors that increase the chances of foodborne illness outbreaks such as
improper holding times and temperatures, contaminated equipment, cross contamination,
poor personal hygiene, employee health, and demonstration of knowledge (Florida
Department of Business and Professional Regulations, 2013).
Number of food safety inspections
Most of regulatory agencies use scoring methods to rate food establishments.
Depending on the system used, establishment scoring may provide an indication of how well
a food establishment is complying with the food safety rules of the regulatory agency. The
number of food safety inspections that are conducted in restaurants varies by city, county,
and state. This variation in the number of inspections may be one of the reasons that there is
disparity in the number of food safety incidents in restaurants. Another variable in ensuring

45
that the public is protected while dining out is the ability to have consistent results from
health inspectors. Because the health code allows professionals to use their own judgment
when grading food safety inspections, there is room for error. The health inspectors around
the country do not have consistent standards that they must follow and training in which
they must participate (Lee et al., 2012). This fact seems to highlight the need to have health
inspections more frequently to help the restaurant operation get a more consistent and less
biased perspective of their restaurant. It should also be noted that Lee et al. (2012)
discovered that inspector and operation type influences inspection scores. With the number
of districts in the state of Florida and inspectors assigned to each, inspection scores may
vary based on the individual knowledge and training of the inspector. The current study will
determine how many health inspections are performed relative to chain and non-chain
restaurants to determine if there are any differences.
Foodborne Illness in Relation to Food Establishment Inspections
Jones et al. published a state-wide study from Tennessee that correlated mean
inspection scores of restaurants to mean scores of restaurants who had foodborne disease
outbreaks (Jones et al. 2012). Very few studies correlating restaurant inspections to
foodborne illness outbreaks exist, and this 2004 study appears to be the most rigorous.
Though they did not include “special inspections performed in response to customer
complaints or to follow-up on deficiencies noted in semi-annual inspections” or “inspections

46
of schools, correctional facilities, and bars that did not serve food,” they did include the
inspection results from the semi-annual inspections (Jones et al. 2012).
The researchers discovered that inspection results were extremely variable and
dependent on the year in which they were performed, the person performing the inspection,
and the region where the restaurant had been established (Jones et al. 2012). All the different
types of restaurants (fast food, independent, chain) had similar mean inspection scores, but
restaurants serving types of cuisine had some variation in mean inspection scores, with Thai
scoring highest and Indian scoring almost ten points below Thai on average (Jones et al.
2012). However, the mean inspection scores of restaurants over the seven-year study period
were very similar, and no significant conclusion linking poor inspection scores to foodborne
illness outbreaks could be established (Jones et al. 2012).
Citing “methodological problems” with performing these kind of studies, the authors
discuss the “rarity of reported foodborne outbreaks in relation to the number of restaurants
and the small percentage of suspected foodborne illnesses linked to epidemiologically
confirmed, restaurant associated outbreaks,” which poses major problems to the scientific
analysis of restaurants and foodborne illness (Jones et al. 2012). Jones et al. mention that the
few other similar studies have churned up varied results, with some finding that routine
inspection scores can accurately predict the occurrence of foodborne illness, as in the
Seattle-King County Experience (Irwin et al. 2014), and a few finding that there is no
relationship, as in a study of Miami-Dade County in 2001 (Cruz et al., 2013).

47
Foodborne Illness in Relation of Different Races/Ethnicities, Socioeconomic Status
Populations
There are few numbers of population-based ecological studies that assessed area-
level associations between enteric infections and socioeconomic status (SES) indicators. A
past study in the Greater Toronto Area has shown a relationship between socioeconomic
status and S. Enteritidis infection. Retrospective data on S. Enteritidis infections from 2007
to 2009 were obtained from Ontario’s reportable disease surveillance database and were
grouped at the forward sortation area (FSA) – level. The study demonstrated that FSAs with
high and low average median family income, medium proportion of visible minority
population, and high average number of children at home per census family had the highest
S. Enteritidis infection rates (Varga et al, 2013). In 2001, the incidence of Shigella infection
in Miami Dade was greater in Non-Hispanic Blacks (9.4 per 100,000) when compared to
Non-Hispanic White (2.0) and Hispanic (4.2) (Thomas, 2012). Similarly, Cheng et al.
(2013) reviewed Foodborne Diseases Active Surveillance Network (FoodNet), reports of
laboratory-confirmed non-Typhi Salmonella infections in infants from 1996–2008 found
that 2008 incidence remained highest among blacks (141.0 of 100 000 vs 113.5 of 100 000
among whites and 109.9 of 100 000 among Asians). Recent FoodNet data continues to show
that Hispanics and African Americans, but not Asians, experience greater incidence of
Shigella when compared to Caucasians. Percent African American, percent Hispanic,
percent urban population and number of food handlers in the population were all positively
associated with incidence of shigellosis (Quilan, 2013).
48
Goldstein (2016) recently evaluated the association between community
socioeconomic factors, animal feeding operations, and campylobacteriosis incidence rates
from the Foodborne Diseases Active Surveillance Network (FoodNet) case data (2004–
2010; n = 40,768) and socioeconomic and environmental data from the 2010 Census of
Population and Housing, the 2011 American Community Survey, and the 2007 U.S. Census
of Agriculture. The study found Community socioeconomic and environmental factors were
associated with both lower and higher campylobacteriosis rates. Zip codes with higher
percentages of African Americans had lower rates of campylobacteriosis (incidence rate
ratio [IRR]) = 0.972; 95 % confidence interval (CI) = 0.970,0.974). In Georgia, Maryland,
and Tennessee, three leading broiler chicken producing states, zip codes with broiler
operations had incidence rates that were 22 % (IRR = 1.22; 95 % CI = 1.03,1.43), 16 %
(IRR = 1.16; 95 % CI = 0.99,1.37), and 35 % (IRR = 1.35; 95 % CI = 1.18,1.53) higher than
those of zip codes without broiler operations. In Minnesota and New York FoodNet
counties, two top dairy producing areas, zip codes with dairy operations had significantly
higher campylobacteriosis incidence rates (IRR = 1.37; 95 % CI = 1.22, 1.55; IRR = 1.19; 95
% CI = 1.04,1.36) (Goldstein, 2016)
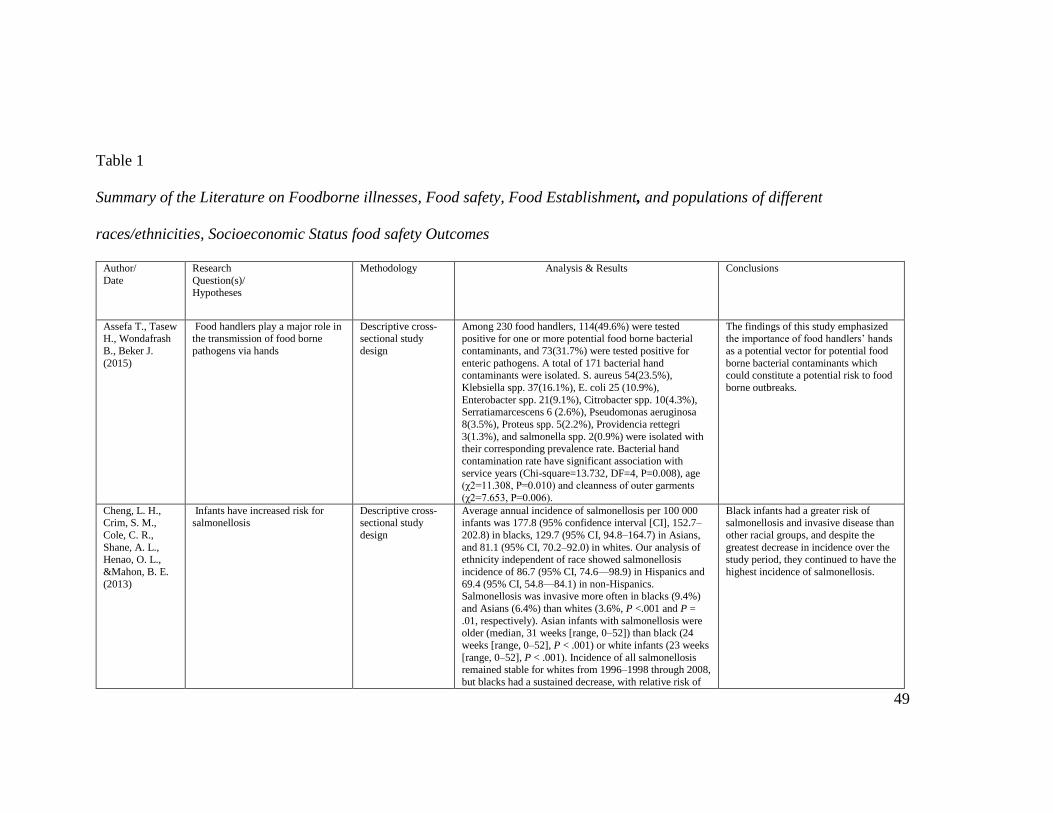
49
Table 1
Summary of the Literature on Foodborne illnesses, Food safety, Food Establishment, and populations of different
races/ethnicities, Socioeconomic Status food safety Outcomes
Author/
Date
Research
Question(s)/ Hypotheses
Methodology Analysis & Results Conclusions
Assefa T., Tasew H., Wondafrash
B., Beker J.
(2015)
Food handlers play a major role in the transmission of food borne
pathogens via hands
Descriptive cross-sectional study
design
Among 230 food handlers, 114(49.6%) were tested positive for one or more potential food borne bacterial
contaminants, and 73(31.7%) were tested positive for
enteric pathogens. A total of 171 bacterial hand contaminants were isolated. S. aureus 54(23.5%),
Klebsiella spp. 37(16.1%), E. coli 25 (10.9%),
Enterobacter spp. 21(9.1%), Citrobacter spp. 10(4.3%), Serratiamarcescens 6 (2.6%), Pseudomonas aeruginosa
8(3.5%), Proteus spp. 5(2.2%), Providencia rettegri
3(1.3%), and salmonella spp. 2(0.9%) were isolated with
their corresponding prevalence rate. Bacterial hand
contamination rate have significant association with
service years (Chi-square=13.732, DF=4, P=0.008), age (χ2=11.308, P=0.010) and cleanness of outer garments
(χ2=7.653, P=0.006).
The findings of this study emphasized the importance of food handlers’ hands
as a potential vector for potential food
borne bacterial contaminants which could constitute a potential risk to food
borne outbreaks.
Cheng, L. H., Crim, S. M.,
Cole, C. R.,
Shane, A. L., Henao, O. L.,
&Mahon, B. E.
(2013)
Infants have increased risk for salmonellosis
Descriptive cross-sectional study
design
Average annual incidence of salmonellosis per 100 000 infants was 177.8 (95% confidence interval [CI], 152.7–
202.8) in blacks, 129.7 (95% CI, 94.8–164.7) in Asians,
and 81.1 (95% CI, 70.2–92.0) in whites. Our analysis of ethnicity independent of race showed salmonellosis
incidence of 86.7 (95% CI, 74.6—98.9) in Hispanics and
69.4 (95% CI, 54.8—84.1) in non-Hispanics. Salmonellosis was invasive more often in blacks (9.4%)
and Asians (6.4%) than whites (3.6%, P <.001 and P =
.01, respectively). Asian infants with salmonellosis were older (median, 31 weeks [range, 0–52]) than black (24
weeks [range, 0–52], P < .001) or white infants (23 weeks
[range, 0–52], P < .001). Incidence of all salmonellosis remained stable for whites from 1996–1998 through 2008,
but blacks had a sustained decrease, with relative risk of
Black infants had a greater risk of salmonellosis and invasive disease than
other racial groups, and despite the
greatest decrease in incidence over the study period, they continued to have the
highest incidence of salmonellosis.

50
Author/ Date
Research Question(s)/
Hypotheses
Methodology Analysis & Results Conclusions
0.48 (95% CI, .37–.63) in 2008 compared with 1996–
1998. However, 2008 incidence remained highest among
blacks (141.0 of 100 000 vs 113.5 of 100 000 among whites and 109.9 of 100 000 among Asians).
Dahiru, Y.J.,
Abubakar, F.A.,
Idris, H., and
Abdullahi, S.A
(2016).
Food can become contaminated via
dirty hands if there is lack of proper
hygiene among the food handlers
when handling food.
Descriptive cross-
sectional study
design
Result shows that among 8 different species of bacteria
isolated and identified, Escherichia coli has the
occurrence of 20.3%, Enterobacter spp 15.4%,
Shigellaspp 14.7%, Staphylococcus aureus 14.7%,
Salmonella spp 13.9%, Klebsiellaspp 11.9%, Streptococcus spp 6.2%, and Vibrio spp with occurrence
of 2.8%.
The result of this research shows the
occurrence of pathogenic bacteria on
the hands of food handlers working in
these various restaurants.
Jacob, R. ( 2012) The temperature of storage of eggs and milk will be higher in stores
located in low SES and minority
racial/ethnic areas compared to stores of high SES and Caucasian
areas. 2. The aerobic plate count
(APC) in RTE lunchmeat, sandwiches, fruits, greens, herbs
and milk will be higher in stores
located in low SES and minority
racial/ethnic areas compared to
stores in high SES and Caucasian
census tracts. 3. Counts of indicator organisms (total coliform and fecal
coliforms) will be higher in RTE
lunchmeat, sandwiches, fruits, greens and herbs in stores located
in low SES and minority
racial/ethnic areas compared to stores in high SES and Caucasian
census tracts. 4. The percentage of
RTE lunchmeat, sandwiches, fruits, greens and herbs contaminated with
E. coli will be higher in stores
located in low SES and minority racial/ethnic areas compared to
stores in high SES and Caucasian
census tracts. 5. The percentage of RTE lunchmeat, sandwiches, fruits,
greens and herbs contaminated with
Methods described in the Food and
Drug
Administration Bacteriological
Analytical Manual
(FDA, 2001) were used to enumerate
the levels of
Aerobic Plate
Count, Coliforms,
Fecal coliforms,
Escherichia coli and Staphylococcus
aureus and detect
the resence/absence of Listeria
monocytogenes.
Retail stores located in low SES tracts had higher temperature of storage of eggs and higher aerobic plate
counts in milk than any other tract category studied. These
results indicate that low SES populations may be exposed to products stored in-store at less safe temperatures, which
could compromise the quality and safety of the final
product.
microbial counts for these products appear to be high in samples from retail
stores located in Asian census tracts,
but the limited number of samples from this study did not make possible any
comparison between the different tract
categories.

51
Author/ Date
Research Question(s)/
Hypotheses
Methodology Analysis & Results Conclusions
S. aureus will be higher in stores
located in low SES and minority
racial/ethnic areas compared to stores in high SES and Caucasian
census tracts.
Jones, T. F.,
Pavlin, B. I.,
LaFleur, B. J.,
Ingram, L. A., & Schaffner, W.
(2004)
We postulated that an inspection
system that effectively addressed
the goal of improving food safety
would be uniform, consistent, and focused on identifying
characteristics known to affect food
safety.
Inspections were
performed by using
standardized forms
including 44 scored items with a
possible total score
of 100. Of those 44 items, 13 were
designated as
“critical”.
None of the 12 most commonly cited violations were
among those designated as “critical” food safety hazards.
The critical violation most commonly cited was the
improper storage or use of toxic items (for example, storing cleaning fluids on a shelf next to food), which was
the 13th most commonly cited violation during routine
inspections.
These items include condition surfaces
that do not contact food, floors, walls
and ceilings, lighting, and ventilation.
Such factors would be expected to substantially influence an observer’s
impression of overall cleanliness and
safety of an operation, but isolated characteristics have not been shown to
correlate with food safety.
Silbergeld, E.K.,
Frisancho, J.A.,
Gittelsohn, J., Anderson, E. T.,
Steeves,
differences in neighborhood level
food access may be associated with
consumer exposure to food borne microbial contamination.
neighborhood level
risk factors for
differential exposures to food
borne microbes
Microbial contamination of both chicken and beef
products was highly prevalent (S. aureus-13/32 for
chicken and 14/32 for beef; E. coli 21/32 for chicken and 12/32 for beef). Small stores were more likely to sell food
carrying these microbes as well as MDR strains of both E.
coli and S. aureus, and chicken was more likely to carry
E. coli as compared to ground beef.
this study must be considered as
exploratory as it is the first study
designed to test associations between food access and food safety
Matthew F.
Blum & Carol A. Resnick, 2013
Scallan E,
Hoekstra RM, Angulo FJ,
Tauxe RV, Widdowson M-
A, Roy SL, et al.
(2011).
we estimated the number of
laboratory-confirmed illnesses in the United States by applying
incidence from FoodNet to the estimated US population for 2006
Descriptive cross-
sectional study design
Most (58%) illnesses were caused by norovirus, followed
by nontyphoidal Salmonella spp. (11%), Clostridium perfringens (10%), and Campylobacter spp. (9%).
Leading causes of hospitalization were nontyphoidal Salmonella spp. (35%), norovirus
(26%), Campylobacter spp. (15%),
and Toxoplasma gondii (8%). Leading causes of death were nontyphoidal Salmonella spp.
(28%), T. gondii (24%), Listeria monocytogenes (19%),
and norovirus (11%).
Data used in the current study came
from a variety of sources and were of variable quality and representativeness.
FoodNet sites, from which we used data for 10 pathogens, are not completely
representative of the US population, but
1 study indicated that demographic data from FoodNet and from the 2005 US
census did not differ much

52
Critique of the Methodology
The main purpose of this research project is to establish the relationship between
food-borne illness and food safety risks from food service establishments available to
populations of different income levels and different racial compositions in Florida food
establishment risk categories (defined as very high risk, high risk, and moderate risk), and
the CDC risk factors to foodborne illness outbreaks of improper holding times, improper
hand washing, poor hygiene practices, bare hand contact, and inadequate cleaning and
sanitizing of food contact surfaces. This research question has the goal to identify the
potential risk of foodborne illness caused by food establishments in Florida. Studies
exploring this question in other settings have approached their research methodology
implementing a case-control design, descriptive epidemiology, or the use of secondary
data from a local health department.
Harris et al. (2014) conducted a case-control study to determine the relationship
between the number of critical food safety violations and the restaurant’s status as either
a chain or independent foodservice provider and location. The State of Florida
categorized the restaurant operations per the type of license obtained, chain or
independent. Chain restaurants are defined as multi-unit restaurants owned or operated by
the same company or individual that total seven locations or more. Data for the current
study was retrieved from the public records for the fiscal years 2009–2010 and 2010–
2011. The study found that both the aggregate number of critical violations and risk
factors and the number of individual critical violations and risk factors were significantly
different among chain and non-chain restaurants in the state of Florida. Results indicate

53
that the number of critical violations received is impacted by both the location of the
restaurant and whether the restaurant is independently operated or a chain. The current
study assists in explaining underlying reasons for repeated food safety violations despite
Florida have required food safety training certification of restaurant managers and
training of their staff; providing implications for academics and foodservice practitioners
alike. The study was significant as it assessed changes in critical violations over a three-
year period. However, a weakness of the study was location; it was only representative of
one county in Alabama, thus the findings could not be generalized to all food
establishments. Additionally, data examined was not consistent, it was not until 2010 that
non-compliant food establishments received critical violations (personnel
training/certification), which would account for the large increase of violations in 2010.
The study provided no statistical difference between food safety practices among food
certified staff and non-food certified staff.
In a similar study, Russo (2012) quantitatively analyzed 2005- 2010 foodborne
illness data, restaurant inspection data, and census-derived socioeconomic and
demographic data within Harris County, Texas. The main research question investigated
involved determining the extent to which contextual and regulatory conditions distinguish
outbreak and non-outbreak establishments within Harris County. Two groups of Harris
County establishments were analyzed: outbreak and non-outbreak restaurants. Contextual
and regulatory conditions were found to be minimally associated with the occurrence of
foodborne outbreaks within Harris County. Across both the categories (outbreak and non-
outbreak establishments), variables included were extremely similar in means, and when

54
possible to observe, distributions. The variables analyzed in this study, both regulatory
and contextual, were not found to significantly allocate the establishments into their
correct outbreak or non-outbreak categories. The implications of these findings are that
regulatory processes and guidelines in place in Harris County do not effectively to
distinguish outbreak from non-outbreak restaurants. Even when this study suggests that
no socioeconomic or racial/ethnic patterns are apparent in the incidence of foodborne
disease, it also showed the benefits of using secondary data to examine characteristics
expected to be associated with a foodborne illness from food retail operations.
Petran et al. (2013) used data collected during inspections in Minnesota to illness
likelihood compared with data from routine inspections conducted at non-outbreak
restaurants. The goal was to identify differences in recorded violations. Significantly
more violations were recorded at restaurants that had outbreaks. Most these violations
were related to contamination in the facility and environment and to food handling
procedures. Relative risks also were calculated for violations significantly more likely to
occur at locations that had outbreaks of norovirus infection, Clostridium
perfringens infection or toxin-type illness, and Salmonella infection. These three
pathogens are estimated to cause most foodborne illnesses in the United States. Meta-
analysis of composited data for the three pathogens revealed 11 violations significantly
more likely (α < 0.05) to be identified during routine inspections at outbreak restaurants
than during inspections at no outbreak restaurants. The study was significant because it
assessed a variety of critical violations associated with food safety. The results indicated
that both outbreak restaurants and no outbreak restaurants differ in number of violation

55
by overall inspection outcome and that critical violation was a concern in food outbreaks
of norovirus infection establishments. However, a limitation of the study was the findings
were not generalized to more pathogen that could occur in food establishments. Also,
Data from other states should be evaluated to determine what differences if any might
be detected.
The best study that attempts to explain the purpose and methodology of this
dissertation is the risks of access study by Darcey & Quinlan (2011). The researchers
used the Geographic information systems (GIS) to plot retail food listings, from two
databases, and foodservice critical health code violations (CHV) over poverty in
Philadelphia Co., Pennsylvania. Chi-square statistic was utilized to test interaction
between poverty and store type of retail food access produced by both source. These
results confirm an association of increased access to chain food markets for low poverty
areas and increased access to corner markets/groceries for high poverty areas in
Philadelphia. Furthermore, results suggest that data source can affect the assessment of
food environments and subsequent interpretation of degree of impact on residents’ health.
These results also indicate an association of higher rates of violations and longer periods
between inspections with lowest poverty rates.
Summary and Conclusions
Despite intensified prevention efforts, foodborne illness remains a persistent
problem in the United States. Food can become contaminated at any point in the farm-to-
table continuum, as well as in consumers' own kitchens. Taken together, there were three
case control studies (Harris et al., 2014; Russo, 2012; Darcey & Quinlan, 2011; and

56
Petran et al., 2013) of the nine studies that demonstrated the relationship between the
number of critical food safety violations and the restaurant’s status. These studies
demonstrated the potential needs for tracking risks for FBI. Majority of the three typically
utilizing very similar comparison of critical code violations method to indicate sanitation
challenges in the retail outlet or foodservice facility. Most of them have also
demonstrated that variety of critical violations associated with foodborne risk factors.
Most of the researchers used define the variables as well as explain how those variables
have been studied. That helped in gathering a better understanding of the amount of
research that had been done on each of these variables.
The limited amount of data and implications of these study findings however,
makes it impossible to draw conclusions as to whether retail food access may be
contributing to higher rates of foodborne illnesses among populations who access their
food from these types of retailers. The study by Russo (2012) identified lack of a control
group as a study limitation. If feasible, future studies should include control groups to
assist in determining associations between the intervention and outcomes of such disease.
More retrospective studies such as the one by Gillespie et al. (2010) may provide more
insight as to whether the food environment is contributing to greater rates of foodborne
illness.
The design is appropriate to answer the questions of the studies. A critically
weakness of some of study design is the appropriate sample size to answer the research
question was not demonstrated. The approach of thinking about how sample is
statistically representing the population is not present. To be able to find how sample as

57
being statistically representative of a wider population requires using a probability
sampling method. There are formulas that are used to estimate the sample size needed to
produce a confidence interval estimate with a specified margin of error, or to ensure that
a test of hypothesis has a high probability of detecting a meaningful difference in the
parameter if one exists (Sullivan, 2012). Determining the appropriate sample size will
help strength the study and limit the sampling error (Sullivan, 2012). Sampling error can
occur when there is a fluctuation of the statistical value from one sample to another when
it is calculated from the same population to minimize those type errors in a study,
In overall, the results of all the studies are presented clearly and specifically
address each research question. Every hypothesis was tested. Appropriate descriptive
(mean and standard deviation) and inferential statistics are presented in organized tables
and described in the text. The authors set and specify the probability value before
addressing the results of the study. Results are related to the original hypotheses and
other research studies. Generalizations are consistent with results. The authors
recommend future research based on their statistical as well as practical findings. For
example, they discuss the need to continue their longitudinal study to better understand
food safety risks associated with food service facilities (Quinlan, 2013)
Gap Addressed by this Study
Most studies described using case control and individual hospital data were
prospective; some were randomized controlled studies. While these studies are assisting
in established associations of foodborne illness risk factors in food establishments, they
do not directly reflect the safety of food service facilities in low income environment as
58
compared to food service facilities available to population of higher income. Thus, it is
surprising that the issue of food establishment in low-income and foodborne illness risk
factors has received relatively little attention. In part because key databases food
establishment violations and related foodborne illness do not contain information on
household income or do not track foodborne illness risk by income.
In the connections between income and foodborne illnesses, there are few recent
studies on the subject. The greatest attention to the issue has demonstrated that low
income and minority populations have different patterns of access to food at the retail
level. A growing body of public health research (Quinlan, 2012) has demonstrated that
low income and minority populations have different patterns of access to food at the retail
level. This concept has been recognized and defined by the U.S. Department of
Agriculture as “Food Deserts” where there is a lack of large supermarkets and tends to be
an abundance of smaller grocers, convenience, and fast food retailers (USDA, 2013,
USDA,2016). A small body of research has begun to attempt to assess the food safety
risks of food deserts and the small independent retailers they are made up of through a
combination of survey at the retail level as well as use of inspection violation rates as a
proxy for safety. Retrospective studies of where food was purchased by those who did
become ill from such pathogens are needed to determine if the food desert presents a
greater risk of exposure. One study linked increased listeriosis with increased social
deprivation also found that when compared to the public, those with listeriosis were less
likely to purchase foods from supermarkets and more likely to purchase food from
convenience and smaller local stores

59
Given the high rate of foodborne outbreaks associated with foodservice, increased
dependence of populations living in food deserts on foodservice, and evidence that both
independent ethnic restaurants (Kwon et al, 2010,Darcey et al. 2011) and retail food
facilities in the food desert environment (Signs et al, 2011, Koro et al, 2010) may face
greater challenges to food safety and sanitation, this study seems demonstrating that low
income is an area which needs further exploration to determine if retail foodservice
facilities are contributing to increased rates of some foodborne illnesses by minority and
low SES populations.
Summary
The purpose of this literature review was to construct groundwork and analyze the
current literature existing for the anticipated epidemiological study, which intended to
identify the predictors of food-borne illness and food safety risks from food service
establishments available to populations of different income levels and different racial
compositions in Florida during the period 2014-2016. As well, the literature review
explained potential Risk factors and food safety violations that typically cause foodborne
illnesses in food in food establishments. The significance of this problem in the United
States was also discussed, including a discussion of the leading pathogens contributing to
acquiring foodborne illness, hospitalization, and deaths follow, as well as their
epidemiology in the United States. Due to the complexity of this issue, studies related to
foodborne Illness in Relation to food establishment inspections and incidence of
foodborne illness for populations of different races/ethnicities, socioeconomic status
Populations were also discussed. A section was dedicated to studies associated with food

60
establishments, food handling and preparation, and foodborne illness. Existing federal
and state regulations and health inspections as part of the food safety surveillance system
in the United States were also described. A short section regarding the correlation in
inspection scores of restaurants and disease outbreaks was also presented. Lastly,
different methodologies of studies related to food establishments, food handling and
preparation, and potential risks of foodborne illness, were discussed to point out gaps in
the literature, as well as to justify the methodology of this study.
The focal points of the following chapters were on the design of the study, the
results of the study, the discussion of findings and conclusions from the study. In
Chapter 3 presented detailed information on the design of the study and analysis of the
data. Chapter 4 shows the results of the study, followed by the discussion of findings in
Chapter 5, which attempted to answer the different research questions of the relationship
between the food establishment risk categories and the risk factors to foodborne illness
previously described.

61
Chapter 3: Research Methodology
Introduction
This quantitative cross-sectional study used secondary analysis of data previously
collected by Food Safety, Florida Department of Agricultural, and inspection report from
the period of January 2014 to December 2016. The purpose of this research project was
to establish the relationship between food establishment risk categories and the poverty
level. The main objective was to predict the food-borne illness and food safety risks from
food service establishments available to populations of different income levels and
different demographic compositions in Florida. The data on contributing risk factors to
foodborne illness and categories of food establishments were obtained from Florida
Department of Agriculture Division- Food Safety Program. I address the proposed
methodology and justification for this study in this chapter.
In addition, I elaborate on the research design and the setting and sample set of
the data I utilized, the instrumentation and materials required to obtain the secondary data
set, the method of data collection, and analysis of data. To conclude the chapter, I discuss
the protective and safeguard measures of participants’ rights and data set.
Research Design and Approach
The supporting evidence of this research design is presented in Chapter 2. Even
though many case-control studies have been used to determine the risk of foodborne
illness (Buchholz et al., 2002; Cruz, Katz, & Suarez, 2001; Irwin et al., 1989), recent
studies have also demonstrated the effective use of secondary data in a cross-sectional

62
design (Jones et al., 2004; Serapiglia, Kennedy, Thompson, & de Burger, 2007). A case
control study starts from cases and controls (i,e. from diseased patients and absolutely
disease free controls), therefore, the information about risk factors responsible for
occurrence of disease in patients and controls should be collected. The cross sectional
design is a prevalence study that looks at single point of time. Cross sectional studies
inform on certain study variables; diseases under study should collect from defined study
population in a defined geographic area at a defined period time. Since a cross sectional
study involves the observation of a population at one point in time (Babbie, 2007), this
study quantitatively analyzed foodborne illness risk factors data, with census-derived
economic, socioeconomic, and demographic data within Miami Dade (district 13) area.
This study did not attempt to assess causes of foodborne illness due to the absence of
causal relationship criteria, but rather researched contributing risk factors measured in an
inspection system that attempts to prevent foodborne illness.
Miami Dade inspection data from January 2014 through December 2016 was
analyzed to determine the risk factor level in establishment. Annual inspections are
required of all stores with permits for preparing and serving food, but only routine
inspections during this period were included in the analysis. Special inspections
performed in response to customer complaints or to follow-up on deficiencies noted in
semiannual inspections were not included. In the proposed study, some strategies were
employed to measure the independent variable, the dependent variable, and the covariate
(demographic) variables. These are outlined below.

63
Independent Variable
Percent poverty (social vulnerability) and facility/entity types are the independent
variables in this study. The U.S. Census Bureau 's American Community Survey (ACS)
is a continuing statistical study that offers 1-year and 5-year data on U.S. demographic,
social, housing, and economic characteristics. American Community Survey 2010-2014
data were processed at the census tract level to create the social vulnerability data. The
social vulnerability was compiled at census tract boundary level. This dataset includes
select data on the percent of population, b) housing units’ estimate, c) households
estimate, d) persons below poverty estimate, e) persons aged 65 and older estimate, f)
persons aged 17 and younger estimate, g) percentage of civilian noninstitutionalized
population with a disability estimate, h) single parent household with children under 18
estimate, e) minority (all persons except white, non-Hispanic) estimate, g) persons (age
5+) who speak English "less than well" estimate, K) mobile homes estimate, l)
households with no vehicle available estimate, and m) persons in institutionalized group
quarters estimate.
Data on retail food store outlets were from the inspectors’ reports which provide
information on the location of food entity by type (supermarkets, grocery, and
convenience stores). In this database, the establishment location by address was provided,
as well as the food entity category and a description of the inspection reason (routine and
customer complaint). Florida Department of Agriculture database classified each food
entity per the categories described by the North American Industry Classification System
(NAICS). Categories for food store outlets are defined as follows (NAICS, 2002):

64
Super-Market: A store that allows individuals to purchase an array of foods that
may contain five or more registers, 15,000 or greater total square footage,
including display, preparation, and storage areas.
Grocery stores: A store like supermarkets in which they offer consumers by
contain four or fewer checking out registers, and they are less than 15,000 total
square footage, including display, preparation, and storage areas.
Convenience stores: A store that offers a limited array of groceries or fuel for
motor vehicles; such stores will likely offer coffee and other beverages to
consumers.
Convenience Stores with limited food service: A store that offers consumers
prepared foods, individually portioned. These stores mainly offer snack foods and
other processes foods, such as hotdogs. No retail food processing occurs on site.
Convenience Stores with significant food service: A store that prepares food on
site but also sales limited groceries.
Minor Food Outlet: A store that mainly functions as a grocery store but likely
offer food service to consumers on a minor scale than convenience stores.
Convenience stores: “this industry comprises establishments known as
convenience stores or food marts (except those with fuel pumps) primarily
engaged in retailing a limited line of goods that generally includes milk, bread,
sodas, and snacks”.

65
Supermarkets, grocery, convenience stores, health market, retail bakery, minor
outlet, shopping center kiosk, flea market, mobile vendor, and specialty store that were in
the identified census tracts for this study were randomly selected for sampling in each
different rate of poverty and social vulnerability. Food service establishments such as
restaurants, take-out restaurants and fast foods were excluded from this study.
If food store outlets are incorrectly classified as supermarkets, grocery,
convenience stores, health market, retail bakery, minor outlet, shopping center kiosk, flea
market, mobile vendor, and specialty stores. My best judgment was used to exclude food
stores which categories were not correct for our sampling purposes. This exclusion was
done by carefully revising each inspector record. If the food store was an incorrect
category for study purposes, that food store will excluded from my sampling list and the
next random generated store will revise.
Dependent Variables
The dependent variables in this study are inspection rating fail and risk factors
violations in retail food entities. A failing rating means foodborne illness risk factors
violations that were found, which could contribute directly to a foodborne illness or
injury. This method of measuring was result in ordinal-level variables. Foodborne illness
risk factors are defined as:
• Food from Unsafe Sources
• Improper Holding/Time and Temperature
• Inadequate Cooking

66
• Poor Personal Hygiene
• Contaminated Equipment/Prevention of Contamination
Covariate Variables
In addition to the above independent and dependent variables, secondary
independent or moderator variables were considered. Data available from the U.S.
Census Bureau (U.S. Census Bureau, 2016) was used to identify census tracts of
categories that fit our definition of the different population demographics. The categories
were as follows: a) population estimate, b) housing units’ estimate, c) households
estimate, d) persons below poverty estimate, e) persons aged 65 and older estimate, f)
persons aged 17 and younger estimate, g) percentage of civilian noninstitutionalized
population with a disability estimate, h) single parent household with children under 18
estimate, e) minority (all persons except white, non-Hispanic) estimate, g) persons (age
5+) who speak English "less than well" estimate, K) mobile homes estimate, l)
households with no vehicle available estimate, and m) persons in institutionalized group
quarters estimate.
Methodology
Target population and method
This study was quantitatively analyzed foodborne risk factors data, census-
derived economic, socioeconomic, and demographic data within Florida district 13
between 2010 and 2014. Records from Department of Agriculture Food Safety was used
to answer the research question. The sample were included routine inspection from retail

67
entity located in district 13. Florida is composed of 13 districts (See Figure A1). Only
routine inspection results from district 13 entities were included in the study. On any
given day, an entity may have fewer or more violation collected than noted in their most
recent inspection. The study population was included foodborne risk factor findings and
poverty level in District 13, Florida.
Another possibility is that these populations are receiving food that is less safe at
the level of the retail entities or foodservice facilities. Records of local retail store
inspections by Florida Department of Agriculture were used to analyze retail food service
and food safety risks. Local retails were either being independent store or had a sister
retail within the state of Florida only. The entity types of interest were as follows:
grocery, supermarket, convenience, health market, retail bakery, minor outlet, shopping
center kiosk, flea market, mobile vendor, and specialty store. Geographic information
systems (GIS) was be used to map retail food listings, from database, and foodborne
number of foodborne risk factors over poverty level in district 13.
Sampling of Risk factors assessment and routine food products for Laboratory
analysis
The Florida Department of Agriculture approach to food safety involves
investigating problematic areas and focusing on reducing violations in a team effort
between state organizations, federal organizations, and the foodservice provider. In trying
to ensure that food served in foodservice establishments is safe, the State of Florida
mandates that all foodservice operations establishments are inspected. According to

68
Florida Department of Business and Professional Regulation (DBPR) State of Florida
conducted 118,136 public food service and lodging establishment inspections (DBPR,
n.d). Regulated establishments include supermarkets and grocery stores, convenience
stores, coffee shops, bakeries, retail meat markets, seafood markets, juice and smoothie
bars, bottled water plants, ice and water vending machines, all food processing plants,
food warehouses, food salvage stores, and certain mobile food units selling only
prepackaged foods or non-potentially hazardous food items.
Risk factors assessment
Risk factors are food preparation practices and employee behaviors most
commonly reported to the Centers for Disease Control and Prevention (CDC) as
contributing factors in foodborne illness outbreaks. The Centers for Disease Control and
Prevention (CDC) Surveillance identified five broad categories of risk factors, food from
unsafe sources, inadequate cooking, improper holding temperature, contaminated
equipment, and poor personal hygiene.
The food establishment assessment program in Florida was conducted by a
“Marking Instruction” report, which was created to help in deciding these items in
compliance with the Food Code when conducting retail reviews. The Marking Instruction
enlightening were based on the 2009 FDA Food Code as a show to create the food
security rules and to be reliable with national food regulatory policy. Items were required
a compliance status appraisal for each observation. Each observation contains the Food

69
Inspection Management System (FIMS) citation, citation description, an appropriate
reference, and additional notes.
For each observation item on the inspection report form in the risk factors section,
the inspector should indicate one of the following for compliance status:
IN means that the item is in compliance
OUT means that the item is not in compliance
N/O means that the item applies to the operation, but was not observed during the
inspection
N/A means that the item is not applicable for the facility.
On the off chance that N/A is not recorded as an alternative for an item, this
regularly implies that this thing must be assessed as IN or OUT of compliance amid the
review. In any case, this assessment organize was planned for food substances that get
ready foods or handle open foods. Since our specialist will utilize this arrange for all
retail food entities, when a retail food entity serves or offers as it were pre-packaged or
non-potentially dangerous food (non time/temperature control for safety (TCS) food,
there may be occasions when there is no alternative N/A. In those cases, the food entity
would be IN compliance since they would not be OUT of compliance. When these
circumstances are experienced, check the thing as IN (e.g. a retail food entity that does
not prepare foods, all foods are prepackaged and there are not food employees- Employee
Health Policy would not be required).

70
If an item is checked OUT, select the most fitting citation portrayal, and give
subtle elements to depict each violation on the review report. Regularly, compliance
status is decided because of direct observation. In any case, there are a few occurrences
where a design of non-compliance may be vital to stamp as OUT. These special cases are
included in the marking instructions. Also, thought ought to be given to reality of a
perception with respect to prevention of foodborne illness.
For item checked OUT, advance shows the status of the infringement by marking
an X in the comparing box for Corrected On-Site (COS) during the review and /or Repeat
Violation. Marking COS shows that all violations cited beneath that item number have
been corrected and verified sometime before completing the assessment. For example,
item #7 Handwashing sink is checked out of compliance since the food entity does not
have soap and paper towels at the handwashing sink. The individual in charge mostly
amends the issue by putting soap at the sink, but does not supplant the paper towels or
give any other compelling implies for drying hands. The corrective action taken for the
soap is not checked for Item #7 since the quotation beneath that item was not corrected.
Making R demonstrates that the same violation beneath an item number was cited in the
final review report. Utilizing the same situation, on the ensuring review in case the
arrangement of soap and paper towels is not an infringement, but employees are not
washing hands the adjust sink (which is moreover cited beneath item #7 Handwashing
sink), R would not be marked since this is an unused quotation beneath Item #7, which
was not cited on the assessment report.

71
The strategies for inspections stretch open communication between the inspector
and operator. To be a successful communicator, inspector is anticipated to inquire
questions relative to the stream of food through the food establishment, preparation, and
cooking procedures, as well as employee wellbeing and typical ordinary operation of
facility. Reactions to questions give the inspector a superior thought of the controlled and
uncontrolled Risk Factors found in the facility and permits for way better budgeting of
time assets while conducting the review. By evaluating Risk Factors that are suspected of
being uncontrolled at times other than during the review, time can be superior went
through legitimate intercession techniques.
The inspector is anticipated to transfer lacks in the operation to the PERSON IN
CHARGE so that on site and long-term correction can be started.
During this addressing, articulations made by the Individual IN Charge or food
workers can regularly be utilized to bolster or increase direct observations and, in a few
cases, can be utilized as the sole basis for deciding compliance with provisions of the
Food code (Table A1).
Food Code Interventions: Risk Factors:
Demonstration of knowledge Unsafe food sources
Hands as a vehicle of
contamination
Poor personal hygiene
Employee health Contaminated equipment
Time temperature
relationships
Inadequate cooking
Consumer advisory Improper holding
temperatures

72
After each visit to a food entity, inspectors are required to complete an inspection
report where the report will be designated either as Pass, Fail, or Non-Rated (Figure A2).
If it is an unpermitted Food Entity an Ancillary visit will be conducted. Then all
applicable documents to the inspection visit must be attached to the Visit Details screen.
For the current study, all retail food establishments in Miami Dade County were
analyzed for fail status and number of foodborne illness risk factor violation sand then
were broken down into type of establishment (Supermarket, convenient, and grocery
stores) as well as by location or region in the state. The foodborne illness risk factors are
of focus in this investigation, as these are based on the hazardous food safety risk factors
identified by the United States Food and Drug Administration (FDA). Critical food safety
violations are those items which are more likely to directly contribute to food
contamination or illness. Some examples of these include food from unsafe Sources,
inadequate cooking, improper holding temperature, contaminated equipment, and poor
personal hygiene (U.S. Food and Drug Administration, 2009).
To determine sample size and the strength of significance among the
variables studied, a power analysis was conducted using G Power 3. Some of the
conventional standards reported in the literature for sample size estimation and statistical
power analysis are a mean effect size of .30, an alpha level of .05, and a power of .80
(Lipsey &Wilson, 1993). The power of 80% will help in ensure that Type I and Type II
errors are balanced. Nevertheless, due to the large sample size used for the study (over
24,265reports), the input parameters chosen for the “a priori” power analysis were set to
73
an effect size of .1, an alpha level of .05, a power of .95, and 10 degrees of freedom
according to a two-way table for chi-square distribution being the equation for degrees of
freedom (r-1) * (c-1) (Gertsman, 2008; Faul, Erdfelder, Lang, & Buchner, 2007)
Calculations for these parameters suggested 2,439 reports as an adequate sample size to
detect any significant difference, if one truly does exist.
Instrumentation and Operationalization of Constructs
For the current study, all retail food establishments in Miami Dade County were
analyzed for the number of inspection and number of risk factor violation. Then the retail
food establishments were broken down into grocery, supermarket, and convenient stores
as well as by location or region in the County. The risk factors identified in the
interpretation list of food service violations, as identified on the FDACS website, are
considered critical violations. These include such areas as facilities maintaining proper
product temperature, thermometers being provided and conspicuously placed, and
potentially hazardous food being properly thawed. In addition, risk factors that are in the
process of being determined as risk factors include food from unsafe sources, inadequate
cooking, improper holding temperature, contaminated equipment, and poor personal
hygiene.
Entity names, locations, and inspection results were obtained from the database,
compiled by the Florida Department of Agriculture and Consumer Services. This
database contains aggregated data that are automatically updated from the online website
of the Florida Department of Agriculture and Consumer Services, which conducts all

74
restaurant safety inspections in Florida. The Florida Department of Agriculture uses a
modified inspection protocol based on FDA recommendations, and it aims to conduct
routine inspections of all restaurants within the city limits once per year.
Florida food establishment inspection data reported from January 2014 through
December 2016 collected. These data included details on inspections (date, time,
purpose, type, inspector name), restaurants (name, license number, location, name of
person in charge), and violations (number and type of violations). The database includes
tabulated reports of 2 types of violations: foodborne illness risk factors and good retail
practices. Foodborne illness risk factor violations are practices or procedures that,
scientists say, play a direct role in transmitting germs, and they include food kept at
improper temperatures and failure to properly clean equipment used to prepare food.
Good retail practice violations, which are less critical violations, are deficiencies in
practices or procedures that, research suggests, can prevent the conditions that lead to
contamination but do not cause illness directly, such as dirty floors or improper garbage
storage.
Data set was filtered out in several ways. Routine annual inspections were only
included, and inspections that were compliance checks, re-inspections, environmental
assessments, or responses to complaints were excluded. We limited the type of facilities
to retail food establishment; thus, we excluded daycare facilities, schools, residential
facilities, and caterers. Some variables (e.g., name of the inspector, person in charge of

75
the restaurant) were also excluded because they were not pertinent or were difficult to
analyze quantitatively.
US Census American Community Survey block group data were accessed to
collect social vulnerability information related to the location of each entity in the study.
The inspection database included latitude and longitude coordinates for each facility,
used to locate the facility on the US Census maps of Miami Dade County. In the US
Census, block groups are contiguous areas of land that are divisions of a census tract and
typically contain 600 to 3000 residents (US Census, n.d). Block groups are the smallest
geographical unit with census socio-demographic data available and were considered
most representative of the area surrounding each facility. By merging the facility
geographic data with the census block group data, facility neighborhood data was
obtained on the variables of interest, including total population count, persons aged 65
and older of residents, proportion of college-educated residents, single parent household
income, minority (all persons except white, non-Hispanic), and persons below poverty.
Statistical analysis
To properly analyze the data, several statistical tests were undertaken using the
statistical program SPSS 2.1. Continuous variables were summarized using means and
standard deviations (SDs), and facility types were compared using t-tests. Categorical
variables were summarized using frequencies and percentages. The number of violations
(total by type) were analyzed and reported for each establishment inspection conducted
during the study period. Because multiple inspections could occur in a single

76
establishment or in a single geographic block group, we adjusted for multiple instances of
the same establishment and block group.
Linear regression was used to determine the relationships between the
frequencies of inspection rating fail at each facility type during the 2-year period and the
number of inspection violations found at each facility, stratified by establishment type.
The model was adjusted for block group sociodemographic characteristics, including
population estimate, b) housing units’ estimate, c) households estimate, d) persons below
poverty estimate, e) persons aged 65 and older estimate, f) persons aged 17 and younger
estimate, g) percentage of civilian noninstitutionalized population with a disability
estimate, h) single parent household with children under 18 estimate, e) minority (all
persons except white, non-Hispanic) estimate, g) persons (age 5+) who speak English
"less than well" estimate, K) mobile homes estimate, l) households with no vehicle
available estimate, and m) persons in institutionalized group quarters estimate. The
frequencies of inspection rating fail category were coded as a factor variable to assess the
relationship between inspection rate frequency and number of violations per inspection.
Logistic regression was used to assess the relationships inspection failures and
entity types, adjusted for all block group sociodemographic characteristics. These
relationships among all entities assessed; then, entities relationship results were compared
with sociodemographic characteristics relationship results. The nested model was used to
adjust for random effects of multiple inspection outcomes within the same individual
entity and within the same block group.

77
Reliability and Validity
Validity refers to the extent how well a procedure measures what it is intended to
measure, whereas Reliability refers to a condition where a measurement process yields
consistent scores (given an unchanged measured phenomenon) over repeat
measurements. Because the data collected by the health inspectors, not me, it was not
feasible to directly measure the reliability and validity of the data used in the study. The
agencies administer surveys that are sampled routinely for regulating the commercial
food supply for compliance with state and federal regulations and minimizing the risk of
foodborne illness in food products. Therefore, one can automatically generalize that
reliability is based upon what the health inspector documents on the food inspection
report form. In the Bureau of Food Inspection, all inspectors go through standardization.
In standardization, the food inspector must (a) complete and pass an examination that is
accredited by the Conference for Food Protection and (b) demonstrate knowledge and
understanding of Florida Department of Agriculture Statues Chapter 500, food-borne
illness risk factors, public health interventions, HACCP principles, and communication
skills necessary to conduct food service inspections.
Conclusion
The purpose of Chapter 3 was to discuss the research design, methodology, and
procedures used to collect, tabulate, and analyze the research data. This chapter addressed
the methodology employed in conducting the research project, including materials,
collection of samples, statistical analysis, reliability, and validity. A quantitative research

78
design was used to examine to identify the predictors of food-borne illness and food
safety risks from food service establishments available to populations of different income
levels and different racial compositions in Miami Dade County. The following chapter
provides the results of the analysis.

79
Chapter 4: Results
Purpose of the Study
This cross-sectional quantitative study was conducted to identify the predictors of
food-borne illness and food safety risks from food entity establishments available to
populations of different income levels and different racial compositions in Miami Dade
County, Florida. In the study, I compared the poverty rates and the foodborne illness risk
violation in food entity establishments in Miami Dade County. Miami Dade County has a
population of 2,712,945, which makes it the most populous county in Florida and the
seventh-most populous county in the United States (United States Census Bureau, 2011).
Miami Date County holds approximately 4,000 retail food establishments located in the
county’s unincorporated areas as well as 21 cities without a local health department
(United States Census Bureau, 2011). Retail food facilities have been monitored by the
Florida Department of Agriculture food safety inspection in accordance with the
recommendations of the United States Food and Drug Administration (FDA) Food Code.
The determination of foodborne illness risk violation was based on routine inspections. In
this chapter, I explain the findings and the results.
Data Collection Source
Figure A2 is a similar setting form that the inspectors used to record the data. The
form contains information including details on inspections (date, time, purpose, type,
inspector name), food entity (name, number, location, type, the name of owner), and
violations (number and type of violations). The risk factor variables were marked as IN

80
compliance, where the process was observed and found to meet the standards; OUT of
compliance, where it was observed and found to not meet the standard; Not Observed
(NO), where the process occurs in the facility but the inspector was unable to verify if it
met standards; and Not Applicable (NA) if it is a process that the facility does not
perform. The risk factor variable is a proportion of the number of times that the factor
was observed in compliance (IN/IN+OUT). The non risk factor variables are counts of
the frequency that a violation was debited per inspection.
Selection of Food Establishment Entity Type
Data on entity food store outlets were obtained from the FDACS food safety
database. This study was limited only to those entity types with the violation risk factors
grocery
supermarket
convenience store limited food service/ convenience store significant
food service and/or packaged ice
health food store w/food service
retail bakery/retail bakery w/food service
bakery outlet store, minor outlet with perishables/minor outlet
w/limited food service/minor outlet w/significant food service and/or
packaged ice
minor outlet/prepackaged/no PHF (Potential Hazardous Food)
minor outlet

81
shopping center kiosk
flea market kiosk
mobile vendor
Thus, I excluded daycare facilities, schools, residential facilities, and caterers. I
included only routine annual inspections by Miami Dade County from January 2015 to
December 2016 and excluded inspections that were compliance checks, re-inspections, or
consumer complaints. Data available online also provided two types of violations:
foodborne-illness risk factors and good retail practices, but this study was limited only to
foodborne-illness risk factors. Foodborne-illness risk factor violations are practices or
procedures that play a direct role in transmitting germs, and they include food kept at
improper temperatures and failure to properly clean equipment used to prepare food (Duan
et. al, 2011). Good retail practice violations, which are less critical violations, are
deficiencies in practices or procedures that, researchers have suggested, can prevent the
conditions that lead to contamination but do not cause illness directly, such as dirty floors
or improper garbage storage (Duan et. al, 2011).
Geographic Information System (GIS) software was used to locate FDACS food
establishments with census tract boundaries. All the mapped FDACS Food Safety
Facilities in Miami Dade County that were inspected within the geographic location were
taken from FDACS database. I identified them with the 2016 census tract that they fell
into based on their geographic location (grocery, supermarket, convenience store limited
food service/convenience store significant food service and/or packaged ice, health food
store w/food service, retail bakery/retail bakery w/food service, bakery outlet store,

82
minor outlet with perishables/minor outlet w/limited food service/minor outlet
w/significant food service and/or packaged ice, minor outlet/prepackaged/no PHF/ minor
outlet, shopping center kiosk, flea market kiosk, mobile vendor, and others).
Data Sources – U.S. Census Bureau American Community Survey (ACS)
After mapping entity locations, I then used the American Community Survey,
which provided demographic information to the census block level that was used to
create sociodemographic index indicator variables. The level of social deprivation and
socio economic status has been previously used to classify neighborhoods. A study has
identified minority groups to be at an increased risk for foodborne illness (Darcey, 2010).
It can also be assumed that if a population has a lower rate of auto ownership, they would
be limited to the food establishments in their neighborhood. Lastly, residents who are
employed in food-handling occupations would have a greater knowledge of acceptable
practices and would hold restaurants that they visited to those standards.
Research Questions and Hypotheses
The research questions were as follows:
1. What are the associations between the frequencies of inspection failing rating and
the poverty level of the area when controlling for food facility type, race/ethnicity,
age, gender, and income level?
2. Is there a relationship between the number of risk violations (food from unsafe
sources, inadequate cooking, improper hot/cold holding temperatures,

83
contaminated equipment, and poor personal hygiene) and the poverty level of the
area when controlling for food facility type, race/ethnicity, age, and gender?
3. Is there a relationship between food entity type (grocery, supermarket,
convenience store limited food service/convenience store significant food service
and/or packaged ice, health food store w/food service, retail bakery/retail bakery
w/food service, bakery outlet store, minor outlet with perishables/minor outlet
w/limited food service/minor outlet w/significant food service and/or packaged
ice, minor outlet/prepackaged/no PHF/ minor outlet, shopping center kiosk, flea
market kiosk, mobile vendor, and others) and the number of food risk factor
violations cited when controlling for poverty level, race/ethnicity, age, and
gender?
4. Does the food establishment operation type (grocery, supermarket, convenience
store limited food service/convenience store significant food service and/or
packaged ice, health food store w/food service, retail bakery/retail bakery w/food
service, bakery outlet store, minor outlet with perishables/minor outlet w/limited
food service/minor outlet w/significant food service and/or packaged ice, minor
outlet/prepackaged/no PHF/ minor outlet, shopping center kiosk, flea market
kiosk, mobile vendor, and others) have an impact on the number of inspection
failing rate when controlling for poverty level, race/ethnicity, age, and gender?
The hypotheses that were created from these questions are as follows:

84
H01: There is no association between the frequency of inspection failing rate and
the poverty level of the area when controlling for food facility type, race/ethnicity, age,
and gender.
HA1: There is an association between the frequency of inspection rating fail and
the poverty level of the area when controlling for food facility type, race/ethnicity, age,
and gender.
H02: The number of food risk factor violations (food from unsafe sources,
inadequate cooking, improper hot/cold holding temperatures, contaminated equipment,
and poor personal hygiene) is not associated with the poverty level of the area when
controlling for food facility type, race/ethnicity, age, and gender.
HA2: The number of food risk factor violations (food from unsafe sources,
inadequate cooking, improper hot/cold holding temperatures, contaminated equipment,
and poor personal hygiene) is associated with the poverty level of the area when
controlling for food facility type, race/ethnicity, age, and gender.
H03: There is no association between the food entity type and the number of food
risk factor violations when controlling for poverty level, race/ethnicity, age, and gender.
HA3: There is association between the food entity type and the number of food
risk factor violations cited when controlling for poverty level, race/ethnicity, age, and
gender.
H04: There is no association between the food entity operation type (supermarket,
grocery, convenience store limited food service (FS), convenience store significant food
service (FS) and/or packaged ice, health food store with food service, retail bakery, retail

85
bakery with food service, bakery outlet store, minor outlet with perishables, minor outlet
with Limited food service, minor outlet with significant food service and/or packaged ice,
minor outlet/prepackaged/no PHF(Potential Hazardous Food) and number of inspection
failures when controlling for poverty level, race/ethnicity, age, and gender.
HA4: There is an association between the food entity operation type (supermarket,
grocery, convenience store limited food service (FS), convenience store significant food
service (FS) and/or packaged ice, health food store with food service, retail bakery, retail
bakery with food service, bakery outlet store, minor outlet with perishables, minor outlet
with Limited food service, minor outlet with significant food service and/or packaged ice,
minor outlet/prepackaged/no PHF(Potential Hazardous Food) and the number of
inspection failures when controlling for when controlling for poverty level, race/ethnicity,
age, and gender.
The dependent variables for this study were the inspection fail/pass rating and risk
factor violations in retail food outlets, determined by the food safety inspection data. The
independent variables were food establishment types, percent poverty, and the covariates,
which are race/ethnicity, age, and household types. This analysis included facility type
accounted for in Miami Date County, Florida. The facility type variables were coded as
a) supermarket, b) grocery, c) convenience store limited FS, d) convenience store
significant FS and/or packaged ice, e) health food store w/FS, g) retail bakery, h) retail
bakery w/FS, e) bakery outlet store, g) minor outlet with perishables, K) minor outlet
w/limited food service, l) minor outlet w/significant food service and/or packaged ice, m)
minor outlet/prepackaged/no PHF, n) minor outlet, flea market kiosk, o) mobile vendor,

86
and others. The food risk factor violations in establishment food outlets were coded as
food from 1) unsafe sources, 2) inadequate cooking, 3) improper hot/cold holding
temperatures, 4) contaminated equipment, and 5) poor personal hygiene violations.
Although food contamination does not have a specific demographic, the demographic
variables were a) population estimate, b) housing units’ estimate, c) households estimate,
d) persons below poverty estimate, e) persons aged 65 and older estimate, f) persons aged
17 and younger estimate, g) percentage of civilian noninstitutionalized population with a
disability estimate, h) single parent household with children under 18 estimate, e)
minority (all persons except white, non-Hispanic) estimate, g) persons (age 5+) who
speak English "less than well" estimate, K) mobile homes estimate, l) households with no
vehicle available estimate, and m) persons in institutionalized group quarters estimate.
The results of the data analysis are described in detail and are reported in terms of
the main research questions. This chapter provides tables of the data analysis results,
including summary statistics of descriptive, frequency, ANOVA, regression, and Chi-
square tests. These results show the relationship between each independent variable and
the dependent variable. The association between food-borne illness and food safety risks
from food entity establishments available to populations of different demographic are
reported. The multiple logistic regressions are presented and discussed, and the
conclusion is a summary of the findings as they relate to the research questions.
To answer the research questions and test the independence of the variables, the
analysis of each independent variable within each risk category was followed.

87
Research Question 1
The first research question addressed the associations between the frequencies of
failing an inspection failing rating and the demographic level of the area. The hypothesis
predicted that there is no association between the frequency of inspection fail rating and
the demographic level of the area. The alternative hypothesis predicted that there is
association between the frequency of inspection fail rating and the demographic level of
the area. To test this hypothesis, I conducted a chi-square test of independence and
logistic regression analysis.
Research Question 2
The second research question addressed a relationship between the number of risk
violations (food from unsafe sources, inadequate cooking, improper hot/cold holding
temperatures, contaminated equipment, and poor personal hygiene) and the demographic
level of the area. The hypothesis predicted that the number of risk violations (food from
unsafe sources, inadequate cooking, improper hot/cold holding temperatures,
contaminated equipment, and poor personal hygiene) is not associated with the
demographic level of the area. The alternative hypothesis predicted that the number of
risk violations (food from unsafe sources, inadequate cooking, improper hot/cold holding
temperatures, contaminated equipment, and poor personal hygiene) is associated with the
demographic level of the area. For this null hypothesis, a one-way ANOVA and a linear
regression analysis were performed with the number of risk factors cited during

88
establishment inspections as the dependent variable and the percentage demographic
level of the area as the independent variable.
Research Question 3
The third research question of this study addressed a relationship between food
entity types and the number of food violations cited. The hypothesis predicted that there
is no association between the food entity type and the number of food violations cited.
The alternative hypothesis predicted that there is association between the food
establishment type and the number of food risk factor violations cited. A one-way
ANOVA and linear regression analysis was performed to compare the association
between the food entity type and the number of food violations cited.
Research Question 4
The fourth research question addressed the impact on the number of failed
inspections and the food entity operation types. The hypothesis predicted that there is no
association between the food establishment operation types and number of inspection
failures. The alternative hypothesis predicted there is association between the food entity
operation types and number of inspection failures. To test the null hypothesis, a chi-
square test of independence and logistic regression analysis were performed to compare
association between the food entity operation types and number of inspection failures.
Descriptive Statistics of Violations
Table 2 presents the descriptive statistic for food inspection violations in the
sample of 3435 food entities. The analysis included the dependent variable of all 3435

89
food entities violation rate. The results were as follows: mean (2.32), standard deviation
(1.23), skewness (-0.128), kurtosis (-0.667), minimum (0.000) and maximum (5.38). The
histogram in figure 2 shows that the bell curve distribution of the data is good fit.
Table 2
Descriptive Statistics: Dependent Variable
(Number of risk Violations)
N Valid 3435
Missing 1
Mean 2.32
Std. Error of Mean 0.02
Std. Deviation 1.23
Skewness -0.128
Std. Error of
Skewness
0.042
Kurtosis -0.667
Std. Error of
Kurtosis
0.084
Minimum 0.00
Maximum 5.38
Figure 2. Histogram chart: dependent variable (number of risk violation).

90
Table 3 shows the frequency for the other dependent variable, pass and fail rate.
Food establishments (N = 2858, 83.2%) passed inspection. However, passing was by no
means guaranteed (N = 577, 16.8 %).
Table 3
Frequency of Pass/Fail Rating
Frequency Percent Valid Percent Cumulative Percent
Valid Pass 2858 83.2 83.2 83.2
Fail 577 16.8 16.8 100.0
Total 3435 100.0 100.0
Missing System 1 .0
Total 3436 100.0
Table 4 presents a total of 3435 cases in the food entity category and the
frequency of the number of cases in the food entity type in the sample. The independent
variables in this table includes supermarket (N=271, 7.9%), grocery (N=229, 6.7%),
convenience store limited FS (N=662, 19.3%), convenience store significant FS and/or
packaged ice (N = 519, 15.1%), health food store w/FS (N= 83, 2.4%), retail bakery (N
=232 , 6.8), retail bakery w/FS (N= 99, 2.9%), bakery outlet store (N= 32, 0.9%), minor
outlet with perishables (N= 407, 11.8%), minor outlet w/limited food service (N =61,
1.8%), minor outlet w/Significant food service and/or packaged ice(N=31, 0.9%), minor
outlet/prepackaged/no PHF(N= 316, 9.2%), minor outlet (N=107, 3.1%), flea market
kiosk (N=137, 4.0%), mobile vendor (N=40, 1.2%), other (N=59, 1.7%).

91
Table 5 presents the mean table for both the dependent variable and independent
variables. The dependent variable in this table includes number of violations (N = 3435)
and the percentage for each demographic variable (N = 2562). The categories with higher
means as follows minority (all persons except white, non-Hispanic) estimate (4638.73),
housing units’ estimate (1970.82), households estimate (1704.33), persons (age 5+) who
speak English "less than well" estimate (1212.92), persons below poverty estimate
(1211.63), persons aged 17 and younger estimate (1113.15), persons aged 65 and older
estimate (826.67), percentage of civilian non-institutionalized population with a disability
Table 4
Frequency Table: Independent Variables Food Entity Types
Food entity types Frequency Percent
Valid
Percent
Cumulative
Percent
supermarket 271 7.9 7.9 12.3
grocery 229 6.7 6.7 18.9
convenience store limited FS 662 19.3 19.3 38.2
convenience store significant FS and/or
Packaged Ice
519 15.1 15.1 53.3
health food store w/FS 83 2.4 2.4 55.7
retail bakery 232 6.8 6.8 62.5
retail bakery w/FS 99 2.9 2.9 65.4
bakery outlet store 32 0.9 0.9 66.3
minor outlet with perishables 407 11.8 11.8 78.1
minor outlet w/limited food service 61 1.8 1.8 79.9
minor outlet w/significant food service
and/or packaged
31 0.9 0.9 80.8
minor outlet/prepackaged/no PHF 316 9.2 9.2 90.0
minor Outlet 107 3.1 3.1 93.1
flea market kiosk 137 4.0 4.0 97.1
mobile vendor 40 1.2 1.2 98.3
others 59 1.7 1.7 100.0
Total 3436 100.0 100.0

92
estimate (589.91), civilian (age 16+) unemployed estimate (323.73), households with no
vehicle available estimate (218.07), single parent household with children under 18
estimate (187.47), persons in institutionalized group quarters estimate (78.27), mobile
homes estimate (51.09).
Table 5
Mean Block Group Socio-demographic Characteristics Associated with 3435 Routine Risk
Violation Inspection
Measure
N Minimum Maximum Mean Std.
Deviation
Statistic Statistic Statistic Statistic Std
Error Statistic
number of violation 3435 1 218 20.1 0.4 25.6
population estimate 2562 0 15425 5371.3 40.3 2038
housing units’ estimate 2562 0 6340 1970.8 15.1 766.4
households estimate 2562 0 4733 1704.3 12.3 624.7
persons below poverty
estimate 2562 0 4562 1211.6 16.7 847.3
civilian (age 16+)
unemployed estimate 2562 0 941 323.7 3.7 186.9
persons aged 65 and
older estimate 2562 0 2514 826.7 8.9 452.1
persons aged 17 and
younger estimate 2562 0 4422 1113.2 11.7 590.5
percentage of civilian
non-institutionalized
population with a
disability estimate
2562 0 1648 598.9 6.5 329.6
single parent household
with children under 18
estimate
2562 0 954 187.5 2.4 123.9
minority (all persons
except white, non-
Hispanic) estimate
2562 0 13990 4638.7 40.6 2052.5
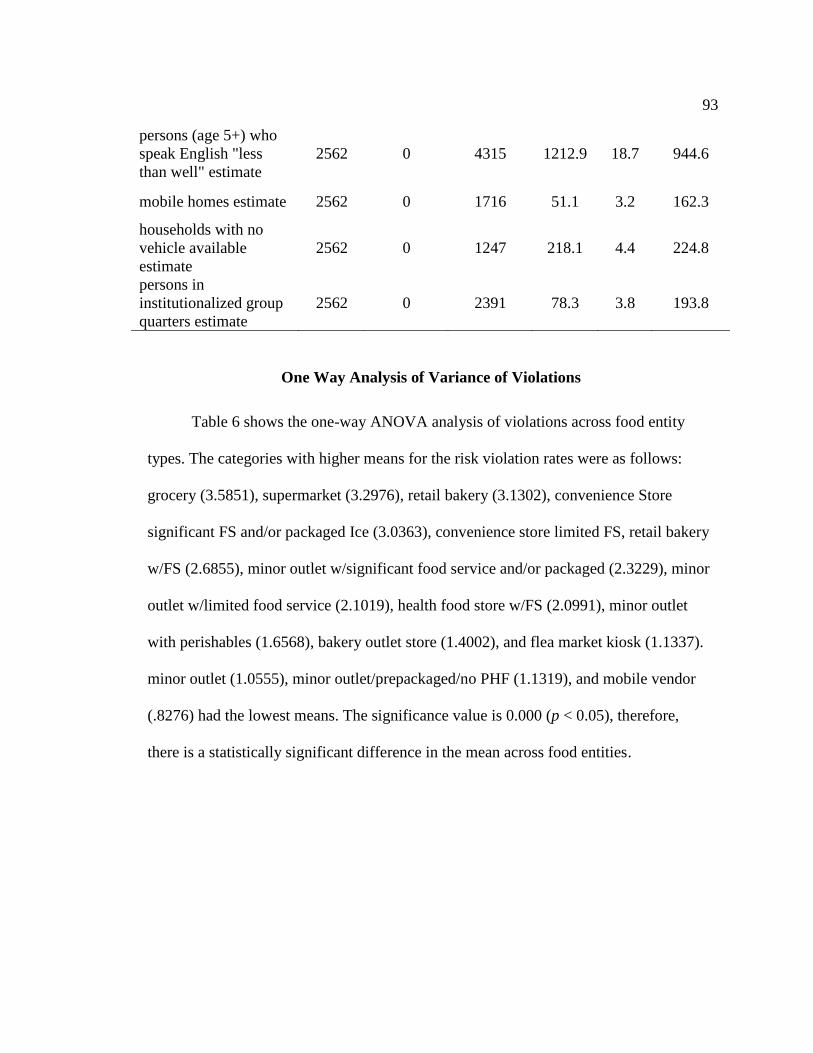
93
persons (age 5+) who
speak English "less
than well" estimate
2562 0 4315 1212.9 18.7 944.6
mobile homes estimate 2562 0 1716 51.1 3.2 162.3
households with no
vehicle available
estimate
2562 0 1247 218.1 4.4 224.8
persons in
institutionalized group
quarters estimate
2562 0 2391 78.3 3.8 193.8
One Way Analysis of Variance of Violations
Table 6 shows the one-way ANOVA analysis of violations across food entity
types. The categories with higher means for the risk violation rates were as follows:
grocery (3.5851), supermarket (3.2976), retail bakery (3.1302), convenience Store
significant FS and/or packaged Ice (3.0363), convenience store limited FS, retail bakery
w/FS (2.6855), minor outlet w/significant food service and/or packaged (2.3229), minor
outlet w/limited food service (2.1019), health food store w/FS (2.0991), minor outlet
with perishables (1.6568), bakery outlet store (1.4002), and flea market kiosk (1.1337).
minor outlet (1.0555), minor outlet/prepackaged/no PHF (1.1319), and mobile vendor
(.8276) had the lowest means. The significance value is 0.000 (p < 0.05), therefore,
there is a statistically significant difference in the mean across food entities.

94
Table 6
One-Way ANOVA of Violations: Independent Variables, Entity Types (p < 0.001)
entity types N Mean
Std.
Deviation
Std.
Error
95%
Confidence
Interval for
Mean
Minimum Maximum
Lower
Bound
Upper
Bound
supermarket 271 3.30 0.99 0.06 3.18 3.42 .00 5.35
grocery 229 3.59 0.88 0.06 3.47 3.70 .69 5.38
convenience store
limited FS
662 2.69 0.78 0.03 2.63 2.74 .00 4.80
convenience store
significant FS and/or
packaged ice
519 3.04 0.76 0.03 2.97 3.10 .00 5.28
health food Store
w/FS
83 2.10 0.90 0.10 1.90 2.30 .00 4.51
retail bakery 232 3.13 1.12 0.07 2.99 3.28 .00 5.26
retail bakery w/FS 99 2.58 1.12 0.11 2.36 2.81 .00 4.53
bakery outlet store 32 1.40 0.88 0.16 1.08 1.72 .00 3.74
minor outlet with
perishables
407 1.66 0.82 0.04 1.58 1.74 .00 3.95
minor outlet
w/Limited FS
61 2.10 1.05 0.13 1.83 2.37 .00 4.38
minor outlet
w/significant FS
and/or Packaged
31 2.32 1.06 0.19 1.93 2.71 .00 4.43
minor
outlet/prepackaged/no
PHF
316 1.13 0.76 0.04 1.05 1.22 .00 3.09
minor outlet 107 1.06 0.72 0.07 0.92 1.19 .00 2.71
flea market kiosk 137 1.13 0.92 0.08 0.98 1.29 .00 3.33
mobile vendor 40 0.83 0.72 0.11 0.60 1.06 .00 2.48
others 59 1.48 0.90 0.12 1.24 1.71 .00 3.83
Total 3285 2.40 1.20 0.02 2.36 2.44 .00 5.38

95
Regression Analysis of Violations
Table 7 demonstrates multiple linear regression model where the assumptions
have been not violated. This analysis was conducted to show the relationship between the
variables. This table provides an adjusted R² of .519 with the R² = .525, which means that
the linear regression explains only 52.5% of the variance in the dependent viable (natural
log violations) can explained by the independent variables (food entity type and social
vulnerability). The R value represents the simple correlation, and it is 0.725, which
indicates a moderate degree of correlation as approaching to 1. The correlation
coefficient, R, is positive; therefore, we can conclude that violation is positively
correlated food entity type and social vulnerability. Thus the relationship is weak because
R is positive and is closer to 1. The Durbin-Watson d =1.820 which is between the two
critical values of 1.5 < d < 2.5; therefore, it is assumed that there is no linear
autocorrelation in this multiple linear regression model. Based on the linear regression
below, the overall model was significant (p < 0.05). The F-test is highly significant (p =
0.000, which is less than 0.05), thus I can assume that the model explains a significant
amount of the variance in risk violation rate.
Table 7 shows the multiple linear regression estimates including the intercept and
the significance levels. All variables were forced into the multiple linear regression
model. Among those social vulnerability variable, the single parent households were
significant (B = 0.001, p = 0.022). Most of the food entities are significant predictors of
risk violations, except for bakery outlet store (B = 1.325, p = 0.116), minor

96
outlet/prepackaged/no PHF (B = 0.303, p = 0.62). Among all the significant predictor
food entities, grocery (b = 2.877, p < 0.001) have more violations than the other category
of food entities. Minor outlet with perishables (b = 0.797, p < 0.001) have the least
violations. We can also see that supermarket (Beta = 0.623), grocery (Beta = 0.602),
convenience store limited FS (Beta = 0.637), convenience store significant FS and/or
packaged ice (Beta = 0.700), and retail bakery (Beta = 0.545) have a higher impact than
the other entity types by comparing the standardized coefficients, the closer the
coefficient is to 0, the weaker the effect of that independent variable.
Table 7
Linear Regression Analysis of Risk Factor Violations (adjusted R-square = 0.519,
P<0.001)
Measure
Unstandardized
Coefficients
Standardized
Coefficients
t Sig.
95.0%
Confidence
Interval for B
B
Std.
Error Beta
Lower
Bound
Upper
Bound
1 (Constant) .853 .162 5.278 .000 .536 1.169
population estimate -3.278E-5 .000 -.056 -.471 .638 .000 .000
housing units’ estimate -3.558E-5 .000 -.023 -.462 .644 .000 .000
households estimate .000 .000 -.078 -.974 .330 .000 .000
persons below poverty
estimate
5.968E-5 .000 .042 1.125 .261 .000 .000
civilian (age 16+)
unemployed estimate
.000 .000 .040 1.700 .089 .000 .001
persons aged 65 and
older estimate
.000 .000 .064 1.957 .050 .000 .000
persons aged 17 and
younger estimate
.000 .000 -.058 -1.026 .305 .000 .000

97
percentage of civilian
noninstitutionalized
population with a
disability estimate
6.433E-5 .000 .018 .494 .621 .000 .000
single parent household
with children under 18
estimate
.001 .000 .070 2.286 .022 .000 .001
minority (all persons
except white, non-
Hispanic) estimate
4.744E-5 .000 .082 1.293 .196 .000 .000
persons (age 5+) who
speak english "less than
well" estimate
-1.910E-5 .000 -.015 -.525 .600 .000 .000
mobile homes estimate .000 .000 .021 1.374 .169 .000 .000
households with no
vehicle available
estimate
.000 .000 -.040 -1.423 .155 -.001 .000
persons in
institutionalized group
quarters estimate
.000 .000 -.031 -1.894 .058 .000 .000
supermarket 2.465 .163 .623 15.166 .000 2.146 2.784
grocery 2.877 .167 .602 17.248 .000 2.550 3.204
convenience Store
Limited FS
1.917 .158 .637 12.097 .000 1.607 2.228
convenience Store
Significant FS and/or
packaged ice
2.266 .159 .700 14.218 .000 1.954 2.579
health Food Store w/FS 1.555 .188 .201 8.273 .000 1.186 1.923
retail bakery 2.548 .166 .545 15.333 .000 2.222 2.874
retail bakery w/FS 1.905 .181 .279 10.547 .000 1.551 2.259
bakery outlet store 1.325 .842 .022 1.574 .116 -.325 2.976
minor outlet with
perishables
.797 .160 .234 4.979 .000 .483 1.111
minor outlet w/limited
food service
1.215 .190 .152 6.392 .000 .842 1.588

98
minor outlet
w/significant FS and/or
Packaged
1.423 .219 .126 6.495 .000 .994 1.853
minor
outlet/prepackaged/no
PHF
.303 .162 .078 1.864 .062 -.016 .621
minor outlet .181 .176 .029 1.028 .304 -.165 .527
flea market kiosk .705 .256 .049 2.756 .006 .203 1.206
mobile vendor .914 .205 .094 4.458 .000 .512 1.315
Cross-tabulation Analysis of Pass/Fail Rating
A crosstab analysis was performed to ascertain the inspection rate outcome on
food establishment types. Based on the information in the table 8, it is easy to see that
there is some relationship between the variables of interest in this case. Note that by
looking at the percentages across the columns (categories of the dependent variable); I
can see that there are differences in inspection rate outcome by food entity type. Of the
food entity types, convenience store significant FS and/or packaged ice (22.2 %) has the
highest percentage fail rate within inspection rate outcome, and bakery outlet store
(0.3%) and mobile vendor (0.0%) have the lowest percentage fail rate within inspection
rate outcome. Minor outlet w/significant food service and/or packaged ice (1.0 %) has the
lowest pass rate within inspection rate outcome, and convenience store limited FS (21.2
%) has the highest pass rate within inspection rate outcome.
Table 8
Percentage of Food Establishment Type and Fail/Pass Crosstab
______________________________________________________________________
Food entity types
Inspection Rate
Outcome
Total Pass Fail

99
Supermarket
Count 187 84 271
% within food entity type 69.0% 31.0% 100.0%
% within Inspection Rate
Outcome
6.9% 14.6% 8.2%
% of Total 5.7% 2.6% 8.2%
Grocery
Count 122 107 229
% within food entity type 53.3% 46.7% 100.0%
% within Inspection Rate
Outcome
4.5% 18.6% 7.0%
% of Total 3.7% 3.3% 7.0%
convenience store
limited FS
Count 573 89 662
% within food entity type 86.6% 13.4% 100.0%
% within Inspection Rate
Outcome
21.2% 15.5% 20.2%
% of Total 17.4% 2.7% 20.2%
convenience store
significant FS and/or
packaged ice
Count 391 128 519
% within food entity type 75.3% 24.7% 100.0%
% within Inspection Rate
Outcome
14.4% 22.2% 15.8%
% of Total 11.9% 3.9% 15.8%
health food store w/FS
Count 79 4 83
% within food entity type 95.2% 4.8% 100.0%
% within Inspection Rate
Outcome
2.9% 0.7% 2.5%
% of Total 2.4% 0.1% 2.5%
retail bakery w/FS
Count 153 79 232
% within food entity type 65.9% 34.1% 100.0%
% within Inspection Rate
Outcome
5.6% 13.7% 7.1%
% of Total 4.7% 2.4% 7.1%
retail bakery
Count 87 12 99
% within food entity type 87.9% 12.1% 100.0%
% within Inspection Rate
Outcome
3.2% 2.1% 3.0%
% of Total 2.6% 0.4% 3.0%
Count 30 2 32

100
bakery outlet store
% within food entity type 93.8% 6.3% 100.0%
% within Inspection Rate
Outcome
1.1% 0.3% 1.0%
% of Total
0.9% 0.1% 1.0%
minor outlet with
perishables
Count 375 32 407
% within food entity type 92.1% 7.9% 100.0%
% within Inspection Rate
Outcome
13.8% 5.6% 12.4%
% of Total 11.4% 1.0% 12.4%
minor outlet w/limited
FS
Count 57 4 61
% within food entity type 93.4% 6.6% 100.0%
% within Inspection Rate
Outcome
2.1% 0.7% 1.9%
% of Total 1.7% 0.1% 1.9%
minor outlet
w/significant FS and/or
packaged ice
Count 27 4 31
% within food entity type 87.1% 12.9% 100.0%
% within Inspection Rate
Outcome
1.0% 0.7% 0.9%
% of Total 0.8% 0.1% 0.9%
minor
outlet/prepackaged/no
PHF
Count 295 21 316
% within food entity type 93.4% 6.6% 100.0%
% within Inspection Rate
Outcome
10.9% 3.6% 9.6%
% of Total 9.0% 0.6% 9.6%
minor outlet
Count 102 5 107
% within food entity type 95.3% 4.7% 100.0%
% within Inspection Rate
Outcome
3.8% 0.9% 3.3%
% of Total 3.1% 0.2% 3.3%
flea market kiosk
Count 134 3 137
% within food entity type 97.8% 2.2% 100.0%
% within Inspection Rate
Outcome
4.9% 0.5% 4.2%
% of Total 4.1% 0.1% 4.2%
Count 40 0 40

101
mobile vendor
% within food entity type 100.0
%
0.0% 100.0%
% within Inspection Rate
Outcome
1.5% 0.0% 1.2%
% of Total 1.2% 0.0% 1.2%
others
Count 57 2 59
% within food entity type 96.6% 3.4% 100.0%
% within Inspection Rate
Outcome
2.1% 0.3% 1.8%
% of Total 1.7% 0.1% 1.8%
Total
Count 2709 576 3285
% within food entity type 82.5% 17.5% 100.0%
% within Inspection Rate
Outcome
100.0
%
100.0
%
100.0%
% of Total 82.5% 17.5% 100.0%
Chi-square is a test of statistical independence, which means if two variables are
unrelated then they are independent of one another. In Table 9, the result shows that zero
cell have an expected count less than 5, and the minimum expected count is 25.85. It also
shows that the probability of the chi-square test statistic (chi-square = 48.33) is p = 0.000,
less than the alpha level of significance of 0.05, which means that there is a 0%
probability that any deviation from expected results is due to chance only. Pearson Chi-
Square result shows that χ² (15) = 361.688, p = 0.000 (p < 0.05). This tells us that there is
a statistically significant association between food entity types and inspection rate
outcome. Phi and Cramer's V are both tests of the strength of association. Results of these
tests show that the strength of association between the variables is moderate (Phi and
Cramer’s V = 0.332, p < 0.001).
Table 9
Food Establishment Type and Fail/Pass Rate

102
Value Df
Asymptotic Significance
(2-sided)
Pearson Chi-Square 361.688a 15 0.000
Likelihood Ratio 359.220 15 0.000
Linear-by-Linear Association 23.378 1 0.000
N of Valid Cases 3285
a. 0 cells (0.0%) have expected count less than 5. The minimum expected count is
5.44.
Value Approximate Significance
Nominal by Nominal Phi .332 0.000
Cramer's V .332 0.000
N of Valid Cases 3285
Binary Logistic Regression of Pass/Fail Inspection
Binary logistic regression was used to estimate the probability of a pass/fail
result occurring. Table 10 contains the Cox & Snell R Square and Nagelkerke R
Square values, which are both methods of calculating the explained variation. Both are
low, at 0.104 and 0.171. The overall -2 Log Likelihood for the model was 2690.949,
which increased significantly, showing a poor fit of the model.
Table 10
Logistic Regression Model Summary for Dependent Variable (Pass/Fail Rate)
Step
-2 Log
likelihood
Cox & Snell
R Square Nagelkerke R Square
2690.949 0.104 0.171
This table 11 provides important information about the binary logistic
regression results. Overall percentage correct 82.5% value was predicted which means it
did not improve the model. The base probability of simply guessing all cases were passes
would have been correct 83 percent of the time.

103
Table 11
Logistic Regression Classification for Dependent Variable (Pass/Fail Rate)
Independent Variable (Food entity types)
Observed
Predicted
Rate outcome
Percentage Correct
Pass Fail
Step 1 Rate
outcome
Pass 2709 0 100.0
Fail 576 0 .0
Overall
Percentage
82.5
__________________________________________________________________
Table 12 showed shows the contribution of each independent variables to the
model. The result of this analysis presents an adjusted odds ratio, sig, and Exp (B) for
each independent variable. The following categories were significantly different from the
reference category (other food entities): supermarket (B = 2.043, p = 0.000), grocery (B =
2.946, p = 0.000), convenience store limited FS (B = 1.828, p = 0.013), and retail bakery
w/FS (B = 2.347, p = 0.002) .The following variables were not significant: convenience
Store Significant FS and/or packaged ice (B = 0.284, p = 0.751), health food store w/FS
(B = 0.888, p = 0.232), retail bakery (B = 1.214, p = 0.13) , bakery outlet store (B =
18.596, p = 1.0) , minor outlet with perishables (B = 0.226, p = 0.766), minor outlet
w/limited food service (B = -0.392, p = 0.702) , minor outlet w/significant food service
and/or packaged ice (B = 1.061, p = 0.244) , minor outlet/prepackaged/no PHF(B =
0.314, p = 0.683), minor outlet (B = 0.308, p = 0.73) , flea market Kiosk (B = 0.015, p =
0.991), and mobile vendor (B = -18.492, p = 0.998).

104
The adjusted odds of pass fail rate were also significantly for civilian (age 16+)
unemployed estimate (B = 0.001, p = 0.008), minority (all persons except white, non-
Hispanic) estimate (B = .000, p = 0.014), and mobile homes estimate (B = 0.01, p =
0.014). Based on the logistic regression model, I can conclude that the overall logistic
regression model was not a meaningful improvement over the pre-analysis classification
table (percent correctly classified 0.83 vs 0.82).
Table 12
Logistic Regression Analysis of Fail Rate Independent Variable (Food Entity Types, and
Demographic Area)
Measures B S.E. Wald df Sig Exp(B)
population estimate -0.001 0 6.605 1 0.01 0.999
housing units’ estimate 0 0 3.117 1 0.077 1
households estimate 0 0 0.203 1 0.652 1
persons below poverty estimate 0 0 0.422 1 0.516 1
civilian (age 16+) unemployed
estimate 0.001 0 7.132 1 0.008 1.001
persons aged 65 and older estimate 0 0 0.007 1 0.935 1
persons aged 17 and younger
estimate 0 0 0.789 1 0.374 1
percentage of civilian
noninstitutionalized population with
a disability estimate
0 0 1.346 1 0.246 1
single parent household with
children under 18 estimate 0 0.001 0.01 1 0.92 1
Minority (all persons except white,
non-Hispanic) estimate 0 0 6.048 1 0.014 1
persons (age 5+) who speak English
"less than well" estimate 0 0 0.471 1 0.492 1
mobile homes estimate 0.001 0 6.069 1 0.014 1.001
households with no vehicle available
estimate -0.001 0.001 2.761 1 0.097 0.999
persons in institutionalized group
quarters estimate 0 0 0.465 1 0.496 1
supermarket 2.043 0.743 7.556 1 0.006 7.712
grocery 2.946 0.748 15.523 1 0 19.038

105
convenience Store Limited FS 1.828 0.739 6.112 1 0.013 6.22
convenience Store Significant FS
and/or packaged ice 0.284 0.896 0.1 1 0.751 1.328
health food store w/FS 0.888 0.743 1.428 1 0.232 2.43
retail bakery w/FS 2.347 0.749 9.825 1 0.002 10.452
retail bakery 1.214 0.802 2.293 1 0.13 3.368
bakery outlet store -18.596 40193 0 1 1 0
minor outlet with perishables 0.226 0.76 0.089 1 0.766 1.254
minor outlet w/limited FS -0.392 1.027 0.146 1 0.702 0.675
minor outlet w/significant FS and/or
packaged ice 1.061 0.911 1.356 1 0.244 2.888
minor outlet/prepackaged/no PHF 0.314 0.769 0.167 1 0.683 1.369
minor outlet -0.308 0.894 0.119 1 0.73 0.735
flea market kiosk 0.015 1.274 0 1 0.991 1.015
mobile vendor -18.492 7390.04 0 1 0.998 0
constant -2.863 0.753 14.446 1 0 0.057
Summary of Findings
Results for each of the alternate hypotheses are shown below.
Ha1: There is an association between the frequency of inspection rating failure
and the poverty level of the area when controlling for food facility type, 2 years’ period,
race/ethnicity, age, and gender.
This hypothesis was tested using multiple logistic regression analysis. However,
the logistic regression model results were disregarded because the overall logistic
regression model was not a meaningful improvement over the pre-analysis classification
table (percent correctly classified 0.83 vs 0.82). Therefore, I cannot reject the null
hypothesis.
Ha2: The number of risk violations (employee health, preventing contamination by
hands, approve source, protection from contamination, potentially hazardous food

106
time/temperature, and chemical) is associated with the poverty level of the area when
controlling for food facility type, 2 years’ period, race/ethnicity, age, and gender.
This hypothesis was tested using multiple linear regression analysis in which
demographic variables and food entity types were controlled. The only significant
demographic variable was the number of single-parent households was significant (B =
.001, p = 0.022). The poverty rate was not significant. Therefore, the null cannot be
rejected.
Ha3: There is an association between the food entity types (supermarkets, grocery,
convenience stores, meat market, minor outlet, and specialty stores) and the number of
food violations cited when controlling for poverty level, 2 years’ period, race/ethnicity,
age, and gender.
Multiple linear regression analysis of the log of the number of violations was used
to test this hypothesis. Results indicated that most of the food entities types are
significant predictors of risk violations.
Ha4: There is an association between the food entity operation type
(supermarkets, grocery, convenience stores, meat market, minor outlet, and specialty
stores) and the number of inspection failures when controlling for when controlling for
poverty level, year, race/ethnicity, 2 years’ period, and gender.
A cross-tabulation table and multiple logistic regression analysis were used to test
this hypothesis. The chi-square from the cross-tabulation revealed a significant
association between food entity types and failing and inspection. (p < 0.005). However,
the multiple logistic regression analysis performed poorly. Therefore, the significant

107
association between food entity type and failure is not adjusted for demographic
variables.
In the next chapter, I will present the interpretation of findings, implications for
social change, recommendations for action, and further study.

108
Chapter 5: Discussion, Conclusions, and Recommendations
Introduction
Due to more knowledgeable consumers and increased government legislation
related to food safety, the overall incidences of foodborne illness outbreaks in the United
States have decreased. Despite this fact, the CDC reported that there are still more than
48 million people in the United States who get sick and 3,000 who die each year from
foodborne illness (CDC, 2017).
Potential outbreaks of foodborne illness can likely relate to public consumed
contaminated products that have entered the food establishment at some point.
Hospitalization rates reflect the seriousness of foodborne disease outbreaks; for example,
88% of patients with Listeria infections required hospitalization, compared with 36% for
Yersinia, 37% for E. coli O157:H7, and 22% for Salmonella (Morton, 2002). One of the
objectives of the FDACS is to protect and to reduce the number of foodborne illness
cases by investigating the problematic areas and focusing on reducing violations in a
team effort between state organizations, federal organizations, and the establishment
providers (FDACS, n.d).
The purpose of this study was to conduct cross-sectional retrospective analysis of
the food inspection data. I used a secondary design to analyze numerous variables by
collecting statistical data to generate information about the safety food violation. The
purpose of this research was to ascertain the relationship between the number of risk
violations, food entity types, the frequency of inspection rating failure, and the poverty

109
level of the area. Also, the purpose was to determine the correlation between the number
of risk violations for each entity type and the region. The target population in this study
was accessed through the FDACS database, which contained 3,436 risk violations from
the year 2014 to 2016.
Interpretation of the Findings
During the 2-year study period, 3,435 food entity violations were inspected.
Multiple logistic regression was not a meaningful improvement over the pre-analysis
classification table; therefore, conclusions in Chapter 4 were based on a linear regression
model and the cross-tabulation table tests. The results showed normal distribution of the
number of violation among food entity types. A linear regression model of association
presented a relationship between food entity types and risk violations. The research
question addressed whether the number of food violations varies depending on the food
entity types (grocery, supermarket, convenience store limited FS/convenience store
significant FS and/or packaged ice, health food store w/FS, retail bakery/retail bakery
w/FS, bakery outlet store, minor outlet with perishables/minor outlet w/limited food
service/minor outlet w/significant food service and/or packaged ice, minor
outlet/prepackaged/no PHF/ minor outlet, shopping center kiosk, flea market kiosk,
mobile vendor, and others) after adjusting for differences in covariates. Overall, my
prediction was that the number of food violations would be significantly different for
food entity types. As predicted, multiple linear regression analysis indicated that most of
the food entity types were significant predictors of risk violations, with grocery store (b =
2.877; p < 0.001) having a higher increase in violations than the other categories of food
110
entities and convenience store significant FS and/or packaged ice (22.2 %) having the
highest percentage fail rate within inspection rate outcome. Additionally, the only
significant demographic variable was the number of single-parent households. The chi-
square from the cross-tabulation indicated that food entity types had a significantly higher
risk of failing inspection. However, the significant association between food entity type
and failure was not adjusted for demographic variables.
Comparing Findings to Prior Research
I assessed the critical health code violations to fill in the knowledge gap of
whether there was a link between risk for food illness and the socioeconomic level of an
area. I expected this study to identify food illness risk food entity type and different
demographic characteristics. These characteristics included population estimate, housing
units estimate, households estimate, persons below poverty estimate, civilian (age 16+)
unemployed estimate, persons aged 65 and older estimate, persons aged 17 and younger
estimate, percentage of civilian non institutionalized population with a disability estimate,
single parent household with children under 18 estimate, minority (all persons except
White, non-Hispanic) estimate, persons (age 5+) who speak English "less than well"
estimate, mobile homes estimate, households with no vehicle available estimate, and
persons in institutionalized group quarters estimate.
Based on the analysis, the results in this study were different from that of a prior
study by Darcey (2011), who demonstrated a significant interaction between poverty and
the distribution of food markets, indicating that rates of all grocery stores, including
corner markets, were highest in high poverty areas. Darcey indicated that rates of critical

111
health violation (CHV) across poverty groups were significantly greater in the lowest
poverty (highest income) group at 0.93 (0.04) compared to other groups. The author
suggested the need to investigate different sources of data for food access research to
confirm differential access to food for different populations (Darcey, 2011). In this study,
I used a different population with a different data set to examine those variables, finding
that poverty rate was not significant to reject the null hypothesis (the number of risk
violations is associated with the poverty level of the area).
Contrary to the above-stated finding, results confirmed an association of increased
access to chain food markets for low poverty areas and increased access to corner
markets/groceries for high poverty (Darcey, 2011). The results from this present study
revealed that grocery stores had more violations than the other types of entity. This study
is important because it identified whether entity type could be associated with food
violation risk.
Limitations of the Study
Limitations of the current study are that the data collection was not primary data
and only involved data from 2 years (2015 and 2016) and did not compare the results
with another county. Many other factors, such as employees’ training and knowledge
about their job, could contribute to violation outcomes, which could be a major limitation
of that study. Including other factors could help improve the future model to further
explore food safety violations. Also, poverty rate helps distinguish areas with different
poverty levels, but the rate does not account for the actual population counts. The future
model should consider the counts of potential customers who could be both commuters or

112
nearby residents to better prioritize inspections. Another limitation of the study is that
there were also missing data, which may have impacted the results.
Recommendation for Action
The costs associated with foodborne illness are substantial in terms of morbidity,
mortality, and economic cost of health. According to the USDA, foodborne illness costs
the United States economy between $10 to $83 billion United States dollars (USD) per
year (McLinden et. al, 2014). The 10 states with the highest costs per case are Florida,
Connecticut, Pennsylvania, South Carolina, the District of Columbia, Mississippi, New
York, Massachusetts, and New Jersey (Walsh, 2011). The CDC (2016) estimated that
approximately 76 million new cases of food-related illness, resulting in 5,000 deaths and
325,000 hospitalizations, occur in the United States each year.
To reduce the rates of morbidity, mortality, and economic spending, policymakers
and stakeholders should target food entity types. Because food entity types are at higher
risk for developing food violation, there is a need for operational assessment programs
which will help in identifying and focusing on violations directly related to food safety.
The operational assessment programs would review and measure performance based on
regulatory requirements and industry best practices and standards, which will provide a
complete picture of the state of operations.
Future researchers should investigate in more detail the issues of food safety risks
associated with training, conformity, and following validation of certification to find out
if these things could be factors that contribute to critical food safety violation. In addition,

113
researchers could also look at inspector bias and lack of training to determine what role
these factors play and if they make a difference in the number of food entity violations.
Social Change Implications
The purpose of this study was to investigate the number of food safety violations
that frequently occurred in different types of food entities and the different demographic
characteristics of the areas in which they occurred. Some researchers suggested that
“small corner markets face unique challenges which may affect the quality and
potential safety of perishable food” (Quilan, 2015).
Based on wide-ranging data from various sources, a significant part of this study
is to draw attention to additional development of frameworks for food safety. Food
violation causes foodborne illnesses commonly to occur in five categories: poor personal
hygiene, contaminated equipment, failure to purchase and receive food from sage
sources, improper holding temperature, and inadequate cooking (Medeiros et al., 2001).
The results of the current study indicated that most food entity types, not the poverty
level of the area, were significant predictors of risk violations. Therefore, the identified
risk violations may allow various food entities to implement education and training
programs, as well as hiring an infection preventionist to reduce the risk of foodborne
illness. My results supported a need to better educate the public about the condition of the
food entity type and the violation types, which can lead to social change and have an
impact on people’s day-to-day experiences.

114
Conclusion
Food safety and related foodborne illnesses are major public health challenge,
which causes an estimated 48 million illnesses and 3,000 deaths each year in the United
States (CDC, 2016). The food safety inspection program ensured that all facilities
processed and served food in sanitary standards; however, the lack of consistency in the
food establishment delivery challenged this goal. Brown et al. (2013) showed that many
food service workers do not engage or follow food safety standard (Brown et al., 2013).
This study used secondary data from the FDACS inspection database to investigate the
predictors of food-borne illness and food safety risks from food entity establishments
available to populations of different income levels and different racial compositions in
Miami Dade County. The results from this study supported that food entity types are high
predictors of food-borne illness risks (food safety violation risks), with grocery store
being the highest. However, different neighborhood socio demographic characteristics
were not predictive factors for food safety compliance. These results were congruent with
the results presented by Darcey (2011) because the different population with a different
data set may be influenced, and therefore people willing to perform or not perform
adequate food safety practices may be hindered.
While the results presented here did not provide conclusive evidence that there are
greater food safety risks at the retail level for any community, there is evidence to fill in a
significant knowledge gap of risk factors causing the violation in food entity types.
Hopefully, future research will shed more light using more detailed and descriptive

115
primary data to generate conclusions on the violation and various entity type as a unit of
analysis.

116
References
Bermudez-Millan A., Perez-Escamilla R., Damio G., Gonzalez A., & Segura-Perez S.
(2004). Food safety knowledge, attitudes, and behaviors among Puerto Rican
caretakers living in Hartford, Connecticut. Journal of Food Protection, 67, 512–
516. https://doi.org/10.4315/0362-028X-67.3.512.
Benowitz, N.L., Blum, A., Braithwaite, R.L., & Castro, F.G., (1998). Tobacco use among
U.S. racial/ethnic minority groups - African Americans, American Indians and
Alaska Natives, Asian Americans and Pacific Islanders, and Hispanics: a report of
the Surgeon General. Centers for Disease Control and Prevention, National
Center for Chronic Disease Prevention and Health Promotion, Office on Smoking
and Health. 47(RR-18),1-16.
Centers for Disease Control and Prevention. (2016). Burden of Foodborne Illness:
Findings. Retrieved from http://www.cdc.gov/foodborneburden/2011-foodborne-
estimates.html.
Centers for Disease Control and Prevention (2017). Foodborne Germs and Illnesses.
Retrieved from https://www.cdc.gov/foodsafety/foodborne-germs.html
Cheng, L. H., Crim, S. M., Cole, C. R., Shane, A. L., Henao, O. L., & Mahon, B. E.
(2013). Epidemiology of Infant Salmonellosis in the United States, 1996–2008: A
Foodborne Diseases Active Surveillance Network Study. Journal of the Pediatric
Infectious Disease https://doi.org/10.1093/jpids/pit020.
Crim, S. M., Iwamoto, M., Huang, J. Y., Griffin, P. M., Gilliss, D., Cronquist, A. B., &

117
Henao, O. L. (2013). Incidence and trends of infection with pathogens transmitted
commonly through food - foodborne diseases active surveillance network, 10 U.S.
sites, 1996-2012. Morbidity Mortal Weekly Rep, 62(15), 283–7.
Darcey, V.L. (2011). GIS mapping of retail food access to assess risks of (chronic and
acute) illness in populations of different socioeconomic status. Drexel
University, Google Scholar. Retrieved from http://hdl.handle.net/1860/3231
Darcey, V. L., & Quinlan, J. J. (2011). Use of geographic information systems
technology to track critical health code violations in retail facilities available to
populations of different socioeconomic status and demographics. Journal of Food
Protection, 24(9), 1524–1530. https://doi.org/10.4315/0362-028X.JFP-11-101
Duan, J., Zhao, J., & Daeschel, M. (2011). Ensuring Food Safety in Specialty Foods
Production. Retrieved from https://catalog.extension.oregonstate.edu/em9036
Dharod J.M., Perez-Escamilla R., Paciello S., Venkitanarayanan K., Bermudez-Millan
A., & Damio G. (2007). Critical control points for home prepared “chicken and
salad” in Puerto Rican households. Food Protection Trends,27: 544–552
Florida Department of Agriculture and Consumer Services (FDACS) (2016a) Food
Establishment Inspections. Retrieved from
http://www.freshfromflorida.com/Business-Services/Food-Establishment-
Inspections
Florida Department of Agriculture and Consumer Services (FDACS) (2016b) Inspector
Reference Files. Retrieved from

118
https://freshfromflorida.sharepoint.com/fs/foodinspection/fieldinspection/SitePage
s/Home.aspx#ChecklistsRetail
Florida Department of Business and Professional Regulation (2008a). Industry Bulletin
for Florida’s Food Service Industry (Bare Hand Contact and Ready-to-eat Foods).
Retrieved
from http://www.myfloridalicense.com/dbpr/hr/information/documents/2008-
01BareHandContactRTE.pdf
Department of Business and Professional Regulation (DBPR) (n.d). Division of Hotels
and Restaurants 2015-2016 Annual Report. Retrieved from
http://www.myfloridalicense.com/dbpr/hr/reports/annualreports/documents/ar201
5_16.pdf
Florida Department of Business and Professional Regulation. (2002b). Guide to
Preventing Contamination from Hands. Retrieved
from http://www.myfloridalicense.com/dbpr/HR/information/documents/5030_09
0.pdf
Gillespie, I.A., Mook, P., Little, C.L., Grant, K.A., & Mclaughlin, J. (2010). Human
Listeriosis in England, 2001–2007: Association with neighborhood deprivation.
Eurosurveillance,15(27), 7-16. https://doi.org/10.2807/ese.15.27.19609-en
Gould, L. H., Mungai, E. A., Johnson, S. D., Richardson, L. C., Williams, I. T., Griffin,
P. M., & Hall, A. J. (2013). Surveillance for foodborne disease outbreaks —
United States, 2009–2010. Morbidity and Mortality Weekly Report, 62(03), 41–
119
47.
Hardnett F.P., Hoekstra R.M., Kennedy M., Charles L., & Angulo F.J. (2004).
Epidemiologic issues in study design and data analysis related to foodnet
activities. Clinic Infectious Disease, 38, S121–S126. doi: 10.1086/381602.
Henley S.C., Stein S.E., & Quinlan J.J. (2012) Identification of unique food handling
practices that could represent food safety risks for minority consumers. Journal
Food Protection,75, 2050–2054. doi: 10.4315/0362-028X.JFP-12-146
Hilmers, A., Hilmers, D.C., & Dave, J. (2012). Neighborhood disparities in access to
healthy foods and their effects on environmental justice. American Journal Public
Health, 102, 1644–1654. doi:10.2105/AJPH.2012.300865.
Johnson, E.A. (2003). Food Safety: Contaminants and Toxins.CAB International,
Cabridge, MA
Koro, M. E., Anandan, S., & Quinlan, J. J. (2010). Microbial quality of food available to
populations of differing socioeconomic status. American. Journal Prevention
Medecine, 38, 478–481. doi: 10.1016/j.amepre.2010.01.017.
Kwon, J.; Roberts, K.R.; Shanklin, C.W.; Liu, P.; & Yen, W.S.F. (2010) Food safety
training needs assessment for independent ethnic restaurants: Review of health
inspection data in Kansas. Food Protection Trends, 30, 412–421.
Kwon J., Wilson A.N.S., Bednar C., & Kennon L. (2008). Food safety knowledge and
behaviors of women, infant, and children (WIC) program participants in the
United States. Journal of Food Protection. 71,1651–1658.

120
Lee, H. K., Abdul Halim, H., Thong, K. L., & Chai, L. C. (2017). Assessment of food
safety knowledge, attitude, self-reported practices, and microbiological hand
hygiene of food handlers. International Journal of Environmental Research and
Public Health, 14(1), 55. http://doi.org/10.3390/ijerph14010055
Leong, D., Alvarez-Ordóñez, A., & Jordan, K. (2014). Monitoring occurrence and
persistence of Listeria monocytogenes in foods and food processing environments
in the Republic of Ireland. Frontiers Microbiology, 5,436.
https://doi.org/10.3389/fmicb.2014.00436
McLinden, T., Sargeant, J. M., Thomas, M. K., Papadopoulos, A., & Fazil, A. (2014).
Component costs of foodborne illness: a scoping review. BMC Public Health, 14,
509. http://doi.org/10.1186/1471-2458-14-509
Medeiros, L.C, Hillers, V.N., Kendall, P.A., & Mason, A (2001). Food safety education:
what should we be teaching to consumers? Journal of Nutrition Education, 33 (2),
108–113. https://doi.org/10.1016/S1499-4046(06)60174-7
Meer R.R. & Misner S.L. (2000). Food safety knowledge and behavior of expanded food
and nutrition education program participants in Arizona. Journal of Food
Protection, 63, 1725–1731. DOI: 10.4315/0362-028X-63.12.1725
Merrill, R. M. (2013). Introduction to Epidemiology (6th ed.). Jones & Bartlett Learning,
Burlington, MA
Moore, L., Diez Roux, A. (2006) Associations of neighborhood characteristics with
location and type of food stores. American Journal of Public Health, 96, 325–

121
331.Doi:10.2105/AJPH.2004.058040
Morton, N. S. (2002). Human Diseases Caused by Foodborne Pathogens of Animal
Origin. Clinical Infectious Diseases. 34 (3), S111–
S122, https://doi.org/10.1086/340248
National Research Council (US) Committee on the Review of Food and Drug
Administration's Role in Ensuring Safe Food (2010). Enhancing Food Safety: The
Role of the Food and Drug Administration. Washington (DC): National
Academies Press (US); Available from:
https://www.ncbi.nlm.nih.gov/books/NBK220385/
Nelson, K.E. & Williams C. F. (2007). Infectious Disease Epidemiology: Theory and
Practice, 2nd Edition. Jones and Bartlett Publishers. Boston, Massachusetts
Newman, K. L., Leon, J. S., Rebolledo P. A., & Scallan, E. (2015). The impact
of socioeconomic status on foodborne illness in high income countries: A
systematic review. Epidemiology Infection, 143(12), 2473–2485.
https://doi.org/10.1017/S0950268814003847
Nyenje, M. E., Odjadjare, C. E., Tanih, N. F., Green, E., & Ndip, R. N. (2012).
Foodborne pathogens recovered from ready-to-eat foods from roadside cafeterias
and retail outlets in Alice, Eastern Cape Province, South Africa: Public Health
Implications. International Journal of Environmental Research Public Health, 9,
2608–2619. https://doi.org/10.3390/ijerph9082608
Omemu, A., Obadina, O. A., Taiwo, G., & Obuotor, T. M. (2014). Microbiological

122
assessment and prevalence of food borne pathogens in Street Vended Wara -
Nigerian White Cheese, American Journal of Food and Nutrition, 2(4), 59–62.
https://doi.org/10.12691/ajfn-2-4-2
Painter, J. A., Hoekstra, R. M., Ayers, T., Tauxe, R. V., Braden, C. R., Angulo, F. J., &
Griffin, P. M. (2013). Attribution of foodborne illnesses, hospitalizations, and
deaths to food commodities by using outbreak data, United States, 1998–
2008. Centers for Disease Control and Prevention, 19(3).
https://doi.org/http://dx.doi.org/10.3201/eid1903.111866
Petran, R. L., White, B.W., & Hedberg, C. W. (2012). Health department inspection
criteria more likely to be associated with outbreak restaurants in Minnesota.
Journal of Food Protection. 75 (11), 2007–2015. doi:10.4315/0362-028X.JFP-12-
148 1912-2090
Quinlan, J. J. (2013). Foodborne Illness Incidence Rates and Food Safety Risks for
Populations of Low Socioeconomic Status and Minority Race/Ethnicity: A
Review of the Literature. International Journal of Environmental Research Public
Health, 10(8), 3634–3652. https://doi.org/10.3390/ijerph10083634
Rosenberg Goldstein, R. E., Cruz-Cano, R., Jiang, C., Palmer, A., Blythe, D., Ryan, P., &
Sapkota, A. R. (2016). Association between community socioeconomic factors,
animal feeding operations, and campylobacteriosis incidence rates: Foodborne
Diseases Active Surveillance Network (FoodNet), 2004–2010. BMC Infectious
Diseases, 16, 354. http://doi.org/10.1186/s12879-016-1686-9

123
Russo, E. (2012). Disparities in foodborne illness in Harris County, Texas, 2005–2010.
The University of Texas School of Public Health, (via ProQuest).
http://digitalcommons.library.tmc.edu/dissertations/AAI1516393
Segarra, M.,Wilkins, M.,Stell, D., & Quinlan, J. (2016). The relationship between
socioeconomic status and critical violations in food establishments. International
Association for Food Protection. P2(4)
https://iafp.confex.com/iafp/2016/webprogram/Paper12579.html
Silbergeld, E. K., Frisancho, J. A., Gittelsohn, J., Steeves, E. T., & Blum, M. F. (2013).
Food Safety and food access: A Pilot Study. Journal of Food Research, 2(2).
108–119. DOI: http://dx.doi.org/10.5539/jfr.v2n2p108
Signs, R.J.; Darcey, V.L., Carney, T.A., Evans, A.A., & Quinlan, J.J. (2011). Retail food
safety risks for populations of different races, ethnicities, and income levels.
Journal Food Protection, 74, 1717–1723. doi:10.4315/0362-028X.JFP-11-059
Sinha, N. (2007). Handbook of Food Products Manufacturing, 2 Volume Set. John Wiley
& Sons. Hoboken, New Jersey
Syne, S.-M., Ramsubhag, A., & Adesiyun, A. A. (2013). Microbiological hazard analysis
of ready-to-eat meats processed at a food plant in Trinidad, West Indies. Infection
Ecology & Epidemiology, 3, 10.3402/iee.v3i0.20450.
http://doi.org/10.3402/iee.v3i0.20450
Thomas, L. M., Cruze, A., Zhang, G., &Edhelen, R. (2013).Shigellosis Trends in Miami-
Dade County. Epidemiology, Disease Control & Immunization Services, 13(5).

124
Retrieved from http://miamidade.floridahealth.gov/programs-and-
services/infectious-disease-services/disease-control/_documents/epi-may-
2012.pdf
Trepka M.J., Murunga V., Cherry S., Huffman F.G., & Dixon Z. (2006). Food safety
beliefs and barriers to safe food handling among WIC program clients, Miami,
Florida. Journal of Nutrition Education and Behavior; 38:371–377. doi:
10.1016/j.jneb.2006.05.022
United States Census Bureau (2011). "State & County QuickFacts". Archived from the
original on July 14, 2011. Retrieved December 6, 2017.
US Census (n.d.). Block Groups.
https://www.census.gov/geo/reference/webatlas/blockgroups.html
U.S. Department of Agriculture, Economic Research Service (USDA) (2009). Access to
Affordable and Nutritious Food: Measuring and Understanding Food Desets and
Their Consequences. Available online:
http://www.ers.usda.gov/media/242675/ap036_1.pdf
U.S. Department of Agriculture, Economic Research Service (USDA) (2012).
Characteristics and Influential Factors of Food Deserts. Available online:
http://www.ers.usda.gov/publications/err-economic-research-
report/err140.aspx#.UdDb99jNnsI
Varga, C., Pearl, D. L., McEwen, S. A., Sargeant, J. M., Pollari, F., & Guerin, M. T.
(2013). Evaluating area-level spatial clustering of Salmonella Enteritidis

125
infections and their socioeconomic determinants in the greater Toronto area,
Ontario, Canada (2007 – 2009): a retrospective population-based ecological
study. BMC Public Health, 13(1078). https://doi.org/10.1186/1471-2458-13-1078
Varga, C., Varga, S., Pearl, L. D., McEwen, A. S., Sargeant, M. J., Pollari, F., & Guerin,
J. M. (2013). Evaluating area-level spatial clustering of Salmonella Enteritidis
infections and their socioeconomic determinants in the greater Toronto area,
Ontario, Canada (2007 – 2009): a retrospective population-based ecological
study. BMC Public Health, 13(1047). doi: 10.1186/1471-2458-13-1078
Walsh, B. (2011). Putting a Price Tag on Food Unsafely. Retrieved from
http://www.time.com/time/health/article/0,8599,1969259,00.html#ixzz1evXQjpn
Wenrich T., Cason K., Lv N., Kassab C. (2003). Food safety knowledge and practices of
low income adults in Pennsylvania. Food Protection Trends, 23(4), 326–335.
https://eurekamag.com/research/003/775/003775116.php
Weinstein, J. (1991). The clean restaurant II: Employee hygiene. Restaurants and
Institutions, 101, 138-139. https://www.ncbi.nlm.nih.gov/pubmed/10111297
Whitney, B. M., Mainero, C., Humes, E., Hurd, S., Niccolai, L., & Hadler, J. L. (2015).
Socioeconomic Status and Foodborne Pathogens in Connecticut, USA, 2000–
2011. Emerging Infectious Diseases, 21(9), 1617–1624.
https://doi.org/10.3201/eid2109.150277
Zenk, S., Schulz, A., Israel, B., James, S., Bao, S., & Wilson, M. (2005). Neighborhood
racial composition, neighborhood poverty, and the spatial accessibility of

126
supermarkets in metropolitan Detroit. American Journal Public Health, 95, 660–
667.DOI:10.2105/AJPH.2004.042150

127
Figure A1: Food Safety Inspection Districts
Source: FDACS (n.d). Inspector Reference Files. Retrieved from
https://freshfromflorida.sharepoint.com/fs/foodinspection/fieldinspection/SitePages/Hom
e.aspx#ChecklistsRetail

128
Table A1: Most Common Violations and Information Collected on Food Safety Inspections Statewide
FOOD SAFETY INSPECTION REPORT Chapter 500, Florida Statutes
Food Entity Number:
Food Entity Name:
Date of Visit:
Food Entity Address:
Food Entity Mailing Address:
Food Entity Type/Description:
Food Entity Owner:
INSPECTION SUMMARY
PERMIT APPLICATION INFORMATION
COMPLIANCE KEY IN = In Compliance OUT = Not In Compliance N/O = Not Observed N/A = Not Applicable
FOODBORNE ILLNESS RISK FACTORS AND PUBLIC HEALTH INTERVENTIONS Violation Number
Compliance Status violation Description
1 Supervision: Person in Charge present, demonstrates knowledge, and
2 Employee Health: Management, food employee and conditional employee; knowledge, responsibilities, and reporting
3 Employee Health: Proper use of restriction and exclusion

129
4 Good Hygienic Practices: Proper eating, tasting, drinking, or tobacco use 5 Good Hygienic Practices: No discharge from eyes, nose, and mouth 6 Preventing Contamination by Hands: Hands clean and properly washed
7 Preventing Contamination by Hands: No bare hand contact with ready-to-eat foods or approved alternate method properly followed
8 Preventing Contamination by Hands: Adequate handwashing sinks, properly supplied and accessible 9 Approved Source: Food obtained from approved source
10 Approved Source: Food received at proper temperature 11 Approved Source: Food in good condition, safe and unadulterated 12 Approved Source: Required records available: shellstock tags, parasite destruction 13 Protection from Contamination: Food separated and protected 14 Protection from Contamination: Food-contact surfaces: cleaned and sanitized
15 Protection from Contamination: Proper disposition of returned, previously served, reconditioned, and unsafe food
16 Potentially Hazardous Food Time/Temperature: Proper cooking time and temperature 17 Potentially Hazardous Food Time/Temperature: Proper reheating procedures for hot holding 18 Potentially Hazardous Food Time/Temperature: Proper cooling time and temperatures 19 Potentially Hazardous Food Time/Temperature: Proper hot holding temperatures 20 Potentially Hazardous Food Time/Temperature: Proper cold holding temperatures 21 Potentially Hazardous Food Time/Temperature: Proper date marking and disposition
22 Potentially Hazardous Food Time/Temperature: Time as a public health control: procedures and records
23 Consumer Advisory: Consumer advisory provided for raw or undercooked foods 24 Highly Susceptible Populations: Pasteurized Foods, Prohibited Re-service, and Prohibited Foods* 25 Chemical: Food additives: approved and properly used 26 Chemical: Toxic substances properly identified, stored, and used
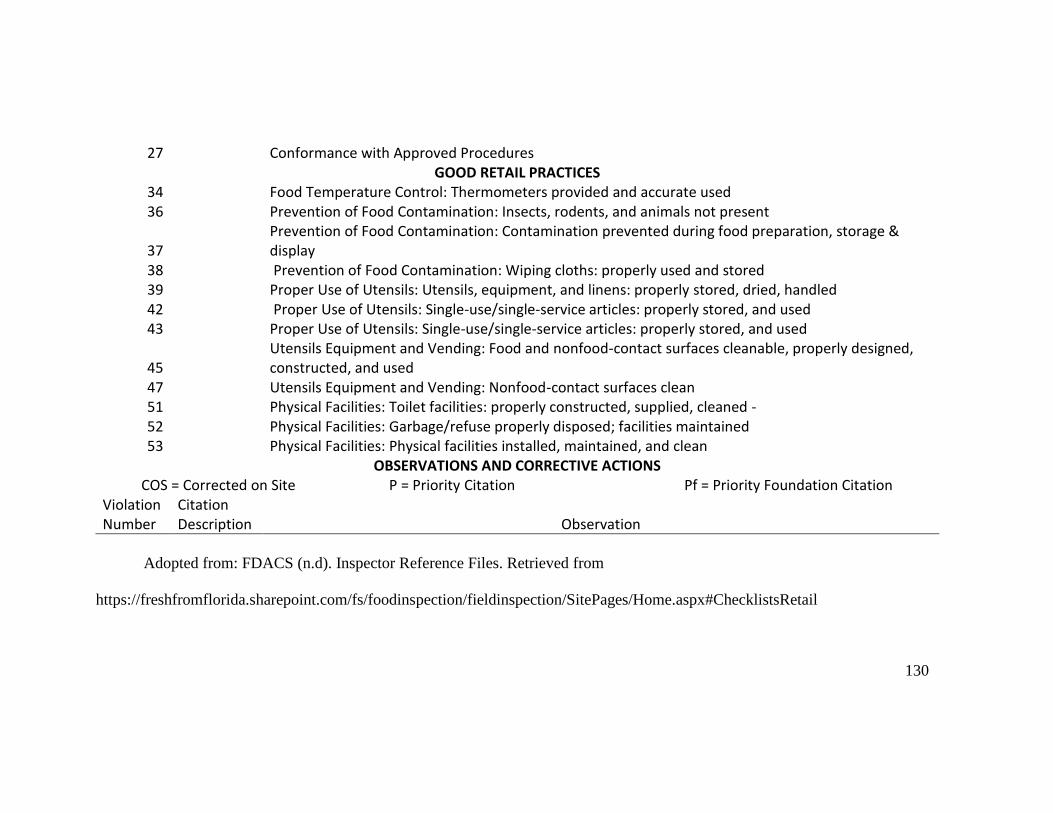
130
27 Conformance with Approved Procedures GOOD RETAIL PRACTICES
34 Food Temperature Control: Thermometers provided and accurate used 36 Prevention of Food Contamination: Insects, rodents, and animals not present
37 Prevention of Food Contamination: Contamination prevented during food preparation, storage & display
38 Prevention of Food Contamination: Wiping cloths: properly used and stored 39 Proper Use of Utensils: Utensils, equipment, and linens: properly stored, dried, handled 42 Proper Use of Utensils: Single-use/single-service articles: properly stored, and used 43 Proper Use of Utensils: Single-use/single-service articles: properly stored, and used
45 Utensils Equipment and Vending: Food and nonfood-contact surfaces cleanable, properly designed, constructed, and used
47 Utensils Equipment and Vending: Nonfood-contact surfaces clean 51 Physical Facilities: Toilet facilities: properly constructed, supplied, cleaned - 52 Physical Facilities: Garbage/refuse properly disposed; facilities maintained 53 Physical Facilities: Physical facilities installed, maintained, and clean
OBSERVATIONS AND CORRECTIVE ACTIONS COS = Corrected on Site P = Priority Citation Pf = Priority Foundation Citation
Violation Number
Citation Description Observation
Adopted from: FDACS (n.d). Inspector Reference Files. Retrieved from
https://freshfromflorida.sharepoint.com/fs/foodinspection/fieldinspection/SitePages/Home.aspx#ChecklistsRetail

131
Figure A2: Food Establishment Inspection Report

132
Source: FDACS (n.d). Inspector Reference Files. Retrieved from
https://freshfromflorida.sharepoint.com/fs/foodinspection/fieldinspection/SitePages/Hom
e.aspx#ChecklistsRetail


