
University of Massachusetts AmherstScholarWorks@UMass Amherst
Emeritus Faculty Author Gallery
1961
Population Statistics and Associated Data in LaosJoel HalpernUniversity of Massachusetts - Amherst, [email protected]
Follow this and additional works at: https://scholarworks.umass.edu/emeritus_sw
Part of the Anthropology Commons
This is brought to you for free and open access by ScholarWorks@UMass Amherst. It has been accepted for inclusion in Emeritus Faculty AuthorGallery by an authorized administrator of ScholarWorks@UMass Amherst. For more information, please contact [email protected].
Halpern, Joel, "Population Statistics and Associated Data in Laos" (1961). Laos Project Paper No.3. 66.Retrieved from https://scholarworks.umass.edu/emeritus_sw/66

law Project. Paper Vo . 3
(larch 1961 )
FOPUIATIO
AGSOCIATZO DATA
[These papers are issued for the scholarlycomwnity in the hope that they may elicitco=anto vhich c. ay be incorporated in aanboacpant reviaed version, !
T-JOE1
A, DP1',.. .-, L.r,6 1
D Sr---, '-
. . a .
a
e
%A l E. :
1 .1, :ss .

Fep educed by
.
DUOPAGE PROCESS
in th e
U .S . of Americ a
Micro Photo DivisionBell & Howell Confpan y
Cleveland 12, Ohi o
I]P 'f 4208

LIST C;t ' +HISS
Table Number EaES1
2
3
4
5
6
7
8
8.
9
10
11
Maximum and Minimum Monthly Temperatures in Laos (Degrees Centigrade)
Rainfall in Taos-1958 (in millimeters )
}cater L:ve1a of the Z:eIon
River for 1953 (in meters )
Population Denoitiea of Loco and Poicbborin !franc, Coed
Population Denaitiea in Southeast Asia and Other World !yeas, Ca
erred
Population Density of Laos, 1942, 1947, 1958
Population of lace by Provinces
1911 - 1959
Population of Laos by Provinces and Districts, 1956-1960
Test Ca
orison of Sines of Leo Villazoe in Taseeng Mang noun, EhongEuong Eoun, Lx-mg Prahaag Province, 1958 and 195 5
Population of loos - 1900-1959
Percentage Increases of the Population of Los for Selected Tears
Rates of Annual Population Growth by World Regions (1920-1956) andloos, Coopare ll
1
2
2
3
3
5
6-7
7
8
8
9
13A Rates of Population Growth
1954 ;56 (Eased on Estimates of TotalPopulation) 9
12 Rates of Population Growth, 1954-56 (Per cent) 9
13 Growth in Average Population per Village
1911 - 1959 10
14 Village Size and Population Concentration - Three Provinces Coapared 10
15 Population of Laos by Provinces - Average per Village, 1953-1955 11
16 E whn '.]-Linguistic Groups of Laos (Iafont) 12
17 Ethnic Grout
of Laos (Historical Sources) 13
18 Thai Peoples of Northern Laos (Iwata) 14
18A ApproxFate Ages of Villages in the Vang Vieng Area and Theirlocal Origin (Vientiane Province) 14
19 ReinaoLl s Classification of
Groups in Laos, 1901 15
20 Ethnic Groups and Their Distribution by Elevation (District ofNang Vieng) 16
21 Cultural Characteristics of Six Ethnic Groups of Northern Laos 16
27A Certain Identifying Characteristics of Selected Ethnic Groups i nNorthern Laos 17
22 Ethnic Composition of Los, 1954-1955, by Percentage of EthnicGroups in Each Province 18
23 Ethnic Composition of the Population of Laos, 1911-1955 19

LESTOP TOLES
(Continued)
Table Number Liz24 Ethnic Composition of the Population of laos in 1921 and 1955,
Compered, by Percentage of Ethnic Groups in Each Province 20
25 Population of Xieng 1 os'eng Province by Ethnic Groups, 1953 20
26 Ethnic Composition of the Population of Liong Prabang Province, 1954 21
27 Population of Eoua-Phan (Sam L'eua)-19361 2 1
28 Population of Saraveue, 1938 ' 22
29 Ethnic Composition of Chore :ease and Saravaee in 1952 22
30 Percentage Ethnic Composition of the Population of conga Sa andPak Lay Distoicto of Sayaboury Province (1960) 23
31 Ethnic Composition of Prong Saly, 1930 24
32 Partial List of Tribes in the Province of Haut-t'ekong (Nam 'ha) i n1938 and Proportionate Composition in Two Provincial District sin 1953 2 5
3 3
34
(lumber of Houses, Population and Average Household Size, Compared, inLao, iihmu and Heo Villages in Ia ang Prabang District, 1957
Site and Population Composition of Selected Villages in Northern
26
35
Luang Prabang Province, .195 9
Plumber and Percentage of Lao, Lao Tong, I'wo, and Other Villages inLuang Pro-bang Province, by Districts - 1957
27
27
36
37
3 6J
Number of houses, Population and Average Household Size in Selectedlsaeet Villages in 1eang Pre-bang and Nam Tha Provinces ; 493 7
Size of Plain and Hountain Villages, Compared, Provinces ofProng Saly and Eam Tha, 1 959
Average Village Size in Northern Laos by Selected Arena and
2 8
28
Ethnic Groups- 1950-, 1958 29-31
39 Agricultural and Hon Agricultural Bouseholda in Nam Tha andThong Sing Towns, Dam Tha Province, 1959 3 1
40 Age Structure of Lao, Khmu, Moo and Yao Villages in Laeng Praban gDistrict, 1957
41 A;e Distribution of Selected Peoples in Laos, 1943 32
42 Age Groups, by Villages, Huong Vientiane - 1959 3 3
43 Age Distribution, Selected Lao and Thni Villages Compared :Bang Chan and tau Deeng, Thailand ; Han Pia lino and Six Othe rLao Villages in the District of Vientiane, laos 34
43A Chinese Population of Xieng Khouang Province by Aga and Sex, 195 9
Distribution of the Population by Age and Sex, Ban Pha Mao,
34
Vientiane, 1957 351

i•~
LIST OF TABLES
(Continued )
Table Number
5
Age Structure of the Population of Laos and Other Nations, b yPercentage Distributions, Compared
35
s ki
Crude Birth Rates, Taos end Other World Areas, Compared, 1954-56.
4+7
Crude Death and Infant Mortality Rates, Laos & Other World Areas ,Compared, 195+-56
36
48
E cpectancy of Life at Birth for Both Sexes, Laos and Other Worl dAreas, Compared, 1955
3 7
49
Population Estimates for District Centers, 1958
38-39
50
Population Estimates for Selected Towns Compared, 1901-1958
40
51
Gro•rth of the Population of Selected Towns end Provinces ,Compared, 1943 - 1959
I+ 0
52
Estimated Population in Urban Areas, Around 1950, Laos and Othe rWorld Areas, Compared (Localities of 20,000 or More Inhabitants)
40
53
Family Size and the Nu -vber of GeneraUons in Three Lao Village s(Veng Vieng District), 1957
4 1
5 t►
Household Size of Black Tai Villages, Nam The District an dProvince, 1958
4 1
55
Household Size in the Lao Village of Ban Pha $bao, Vientian eProvince, 1957
55A
Household Size in the Yao Village of iCaisou Near• Yang Vieng ,Vientiane Province, 1957
42
56
Household Size in Vientiane Town, 1959
57
Household Size in Vientiane Town and Vientiane Province, Compared
1 3
58
Ethnic Composition of the Population of Selected Provincial Capital sin Laos, 1943 and 1959 Coro red
percoi
=
u- ; alt! L'_Unmli ` ie s i] Provinces, [--~ 3
P opor ti uii u_ ' E; :c:' aiatier a 1: „ in _ . ._ F'oreiLle ?olae1 _,- ;.eeP rovik eee, 195 3
z . .~
Ac
:. sider-t in .Lena, , Provinces, •- 195 1
Pe_ee" „;c Lie :ituti,n cf C:n-eee_ __. Ind-chine in 193 !r
63
:lee of He=apen_s e. .µ 'Ass
_e :i.~ .u T] .:1r ''e-.Ir+ti :.:. to ..= 'Peta l
el lewne' .ee la 1 ::3
Glen pc e_e : and N•-- .._eect nee-land , 1957
_1e - _! ic of) VJeti'_U 1, 1958
:'epueo .io-
Antenn : .. ::us _;,Son (ivortli Went Vietttau), 1958
+ :
42 .
o
a• =

'
LIST C2' %131rfi '
(Continued)
Table Dunbar Pam
68 Chinese Population 3nsrc:a ns in fistoric Pbrupsctien (2 - 1957) 50
69 rational ~33eority Croups is China, 1955 5070 Minority
oplca in Couthuost China, 1956
- 51
71 Distribution of the Ti Peoples, 1923 51
71A Distribution of Yi in Sip cans Pon t
in 1935 5 1
72 Ethnic f norities in Yunuin F eLatci to Those in Leon, 1938 52
73 Ethnic Crowe of Yunrln in 1945 52
7k Population of I :inority Pooples in Yunnan and till of China Classifie dby Linguistic Croups, 1953 53-55
75 Tai Dialect Croups (rang-Kuei Li) 56
76 Zhuong (Chuang) - Tai Ian cages in the Chinese People's Republic .5 7
Bibliography 5£ :'J
------------- -
J_ntroductory Rote
From the demographic point of view Taos is one of the most
poorly known countries in the world . The available information
summarized in the following pages is incomplete and often contra-
dictory. Poor and scattered as it is, however, the reader searching
for a basic orientation to the complex structure of the populatio n
of Iaoa will find this information provides a useful introduction .
It is the compiler's hope that better inforeation will become
available when the present confused political situation is resolved .

r . xI2•':ri An L'F.fl IP? J I:o: SLY '!' TMLTURES IH £AOB(Degrees Centigrade)
TA3 1
Station Jan Fob I'.
r ARr 1. Jul Aua Se . Oct Nov Dec Annua
Yu RngPrAbanga
1 :'2.z . 39 .2 39.1 41 .0 44 .8 44 .o 40.0 39.0 39.8 38 .o 38 .6 36.3 33.o 44 . 80 .9 8.0 9 .8 14.0 17 .0 14 .0 19 .2 14 .0 10 .8 12 .9 6.0 4.3 0 . 8
Vien -tianeb
Kxx . 34 .9 36 .6 39 .8 39,2 38 .9 35 .6 34 .3 36.6 35 .2 34.2 34 .4 33 .4 39 .8[Iin . 3 .9 7 .6 12. .1 17 .1 20 .8 21.1 21.2 21 .1 21 .2 12.9 10.3 5 .0 3 .9
Mak-bekc
1•N.x . 35 .6 37.9 39 .1 40.1 39.3 36 .3 34 .6 35 .4 36 .5 35 .6 35.2 36.0 40 . 1Ifin. 3 .5 7 .7 10 .3 1 3 .7 20 .2 20.9 21.2 21 .2 17.6 11.5 9.9 5 .8 3 .5
Savan -n khe Edin . 38.5 39 .0 42.0 41.5 40.5 36 .4 35 .1 35 .5 35 .2 36 .2 35 .3 36 .0 42 . 0flit . . 5 .8 9 .0 10 .5 15 .0 20 .0 22 .0 19,6 21,0 18 .2 12,0 8 .5 5 .7 5 . 7
Pakz a er:.?x . 36 .8 37 .9 38 .0 39 .4 38 .5 34 .8 34 .1 34 .4 34 .5 35 .0 34.2 35 .0 39 . 4Ma . 8.2 13.2 12.6 19.8 21,8 21 .5 21.4 21 .5 19 .8 16 .7 14 .0 9 .0 8.2
Source : Le C1imat de L'Indochine et les Typhons dela t"•erdeChine, by E . Bruzonand P. Carlon ,
ala .ng Prabnng measurements over period of 27 years .
bVientiane measurements over period of 9 years .
01-babe': measurements over period of 10 years .
a.:aennakhet measurements over period of 11 years .
ePakse measures' over period of 8 years .
-1--

33
i
TABIR 2
RA'I. ALL IN 1.O-1958(in milli :tera)
I;easur -ingi'oint
Jean Feb Mar A r r
Jun Tut
A.u -
Dan Oct rov
Dec
Total TotalRain-fall
DaysRain
PRODays ofrain
6Painfal„_ 129 .5
25 .9
316 .9
7
851 .9
50 .322
15
1 1230 .1_23. o.o 125,4
1 08"3.0
1
-2 14_63
85
Xfl)MOM=Days ofrain
1Rainfall
9 .12
9.4- 3
5.5
_ .8-
6
3-
44 .0 720.09
414 .0-- 1227 .8
89
Days ofrain
2Rainfall 35 .2
4606
32e
318 .1
10
23100,8 246.2
15
23
1616_ .1
1340 243 .44
7.91
jaa
-11 17i;1
104
Si~Y~a7t~ti`~'l'Days ofrain -
-Rainfall
-2
6.92
1 .97
180,05
1436 :7 2. 1 .9 .0
23
13
21262 .4
3_ ? • 7_244.687E0 DATA
111 nATAP.u~s,5lsDays o frain - - -
.
7
13
18 11
22 6
- 7 7Rainfall_
- - 40 .8 I59 .a 300 0 5 100 .0 31404 33 .E
-
-
9l 9
Source : Bulletin Statistique du Laos, tiinistere dea Finances do 1`Economie Nationaleet du Plan, 1958 .
NOTEOne millimeter equals 0,03937 inches; for rapid calculation, one inc. equals
Measur -ingPoint
25 millimeters . 74.u w,x a [i,14,
Ldyr eIC333
e0~u-+
TAIBLE 3
3
DecAnnualMeanJan Feb Z;ar
l :A'iex LEVELS OF T R-'E:OP :G RIVER FOR 1958
NovApr Ma
(in meters)
OctJun Jul Aug
Sep
WANGP1 Ali=
max .
4 .63 4.714 .82
3 .793 .58
3 .543 .12
3. 1 73 .12
6.273 .47
12 .146 .45
11 .61
9 .89
9 .53
9 .329.498 .3L
8,324 .96
4 .95
4 .546.164 .54Min . 4 .14
VIEaPLANT
1 .651 .44
1.43
1 .271 .701 .25
2 .901 .75
3.752.68
8,00
3.85
8 .90
8.807 .50
5 .105 .503.80
3 .701 .65
1,550 .85
4 .462.72
max .Min .
1 .841 .55
T'000:17x0 .750,29
0.540 .00
0 .420 .
0,49
0 80 .450.00
5 .140.05
9.46
--3 ° 34
9 .46
9,34
7 .60__ 7 0 34
6.80
1, O
3 .90
1 .701 .70
e7 2„ O4.022.02
Max .Z~!in .
SUM-NP.KDET
1,"ex .Min .
0 .610,18
0 .320 .06
0 .700 .014-
0,700 .01
C . 1 . 80 .10
3.820.10
8 .0 02.1
• •
b► .l0
8 .206 .
6 .0'
-
5 .5 52 ° 28
2.11Ooh
. . _
0 .82
3 .69
r0 .12
1 .69
Max . 2 .34 1 .75 1,33 1 .02 1 .13 2.96 8.92 8 .96 11.888 9.00 4 .05 2.44
4 .77Min . I . 1 .4 1 .0 0 ° 70 0.6 1.1 2.80 6e 8
v0 4 .13 2 .43 .58l . ___2_
Source : Bulletin Statistique duLaos, Itinistere des Finances de L°Economie rational eet du Plan, 1958 .
DOTE: One mater equals 39 .37 inches, or approximately 1 .1 yard, .

4
=13 4
FOP L& ION DES" SITIES ClP IAOS AND 1~IGr~t}t ILv A S~ CO T'AR.ED
FOFUTATIONAREA er uare mile er s re ki ter
4.7
1 .82.9
1. 17
2 .7
13 57.4 3 .6
17 .4 6 .715 .9 6 .5
12.8 5 .1
6
12,5 •
7 .3
180
Laos 1JQ1aBorthSouth
Laos 155 1 5
Laos 19570
33
Laos 1959 19
Nc ko :a_ Valley in Laosalou;, !Mai bordcrL
Laos 19430NorthSouthCentral
Laos 194-7c
d
Lauet Tribe in Clam Tha Provincein northern Iaosn
Northoast ?hail.sndi
VillaL;o near Ba .i kokJ
32 0
6 .8
94
2 .5
38
12' .
a !•,e__uacil 1901092Pietrantani 13572225 (Vientiane, Khommcuanc and Savannakhet Province s
coostitute Central Laos ).:says, on a popµlation or 1,169,000
'1 Statistical Yearbook of the United Nations 1957°25 (population given a s1,450,000 )
e rased on Pamphlet "About Laos " issued by Lao Embassy in Washington 1957(I•apulai:ion riven as 3,000,000)
La_ioot 1955=111loi- ui Relations Area Files, T.; os Monograph 1955^ 112
I' IzikcuitZ 1951 3 8- i od'r~e 1957 :12
p 1553 .2'+
TABLE5
POPULATION DENSITIES El S0[TELAYST ASIA MID O1'E WORLD AREAS, COMPARED
AREA
POPULATIONper square mile
_ per square kilometer
Asian TropicsAfrican TropicsAmerican TropicsIndiaBurr`1'h _i It ndIndochina
Source : United nations Demographic Yeariuook for 1954, Nei' York.
-3--
1972522
3267799
122
791 08 .8
13030 .839,64-8 .8
1

TA33I1 6
PoPUTATIDn n i'SII'Y OP ILOS, 1942, 1947, 1958
Area in 000
Inhabi-
Popula-
Tnbnbi-
Popula-
Tnhabi-.
Square
t_ts per
tion in
tents per
tion in
tents perProvince Kilometers I : .i,1943 COO1911.7_1_71, i9 _~ 0C- 1563_ i ~2 , 195Sb
Champassac C
26.4
5 .4
170
6.4
230
8,7area 29,800
Khammousne
26 .4
4 .9
104
3 .9
140
5 . 3
Nam Tha
12 .9
2 .6
46
3 .6
65
5 .0
Sam Ideua
16 .3
4 .0
78
Awe? q'
95
5 .8
Luang Prabang
37 .2
3 .7
142
3. 8
210
5 .6area 55,600
Phong Saly
15 .8
2 .4
30
► 1' 9
85
5 .1*
Saravene
21 .6
9 .9
120
5 .5
160
7 .4area 13,000
Savannakhet
21 .7
8 .5
194
8 .9
270
12 .4
Sayaboury
18 .4
79
4 .3
140
7 .6
Xiang Khouang
19 .5
4 .4
84
4 .3
130
6 .7
Vientiane
20 .6
6 .1
122
5 .9
215
10 . 4
TOTALS
236 .8
( 5 .2 )
1,169
average4 .9 ;.rs
average Econditional
i~'] yq
7 3average
Source : Annuaire Statistique de 1'Indochine 1947-1948 p .19 .
aPietrantoni 1957 p .226-228.
bAverage estimates of the Lao Statistical Bureau .
cTncludes present Province of Attopeu in 1943 and 1947 omitted in 1958 .
Note : Nam Tha is also known as Haut - Mekong or Houa IOzong and Sam Plena is often referre dto as Sous Phans, while Khammouane is sometimes spelled Cammon .
- 4 -
7

TABLE7
POPULATION OF LAOS EY PROVINCES
1911 - 1959
1931
19 6 1943 19L6 19 .47 1951 19 5
_34 .000
'5,000
17 .000
30, CCD 30,000 1 > 22['U
SQ,(2r 038,000
57,000
66,000
83,000
78,000
63,300 65,000
31,000
31,000
3,4, 00 0 _
311, 060
46,000
50,300
46,809-
L :r-, Prrhnno 1 70 9 2?_
0d 1.: s 000a 197;000d 202 .000d 1a 0_„gOO 31.2 ..000 173,00 136,P2 1Sayoboury
Ono section in Luang Prebeng Province end
75,000
79,000
71,400 98,516 cnq er in h ii .c -Vd .enti.rn© 27 .,23 .6 68 00 :.,9,3 f r~
17 .6 0CC
126000
0+01L• .., 0
1o. ,. 40 ;] .151&O ;186,2,S9.12-: o:' _ne 60 .3/i,,, ___-, 0„000 86,002 105:000 13 21 2_,000 12J O00 101,000 111g,520 108 .603Sava :nneh-het 21111 80,000 11.5 Q.)0 164000 186,000 , 193 .000 3 .~', C}C 0 203, 760 214, °uSri -ri°ne 12 .413 69 .000 87, 000 9J,,000 127 .000 151, 000 120 .000 163,700 7.25, 957Crpaccac
67,683
105,000 120, 000 (
(
(
(
(
122,078
Province
111.1
1921
P1 on1 Salt
26, TO
(Hoti ?. Phan ]Sam Neu=
4,1 .31
44,000
ricer TheLTi^'At U ehon')
15,585
29,000
1hr^o7
51,000
6Q)O
61.000 , ,3C
8 rrn
83, 0 00
01,,000
8 '300
93160 9
(Pekoe)
0158,000 (157,000 (167,000 (170,000 {193,00 0
Attonou
TOTA L
Sources : /nnn'J.rc Stat.,2tt.nno daI' Inr3ochinel, 1930-1931, p . 53 ; 1936-1937, p ..21 ;1943-1946, p . 27; 1947-1948, p .19 .
Lao 1.iniatry of the Inicrior, 1955 figures.$o1]atin de7. 20ff_ce Colonip3. 1911 No . 62, Fevrier 1913, p. 48.Service de 1t Statistique du Laos 1958.Annu^%rc Stntistigr.e du L'cio, Recueit de Statistiques 1913-1922, Geuvernemen t
General de 1°Inrlochine .Direction revs Affeirea Economiquea, 1927, Service de le 3te.tistirue General (Hanoi) 1927 .Plnn de Devel 'pant Econaminue et Socis7 ., Royoune nu Lt:oe, Mars 1959, p . 8 ."La Population du Loos en 1943 dens son t :ilieu Geo rbobique" R211.•z Soc .
EtudesInr ochinoises, XXX.II No . 3 pp 226-228 . (Erie Pietraut)ni )
No-
-~ ;
P•-,
~ ,~
13
3(4,943 52 .000
480,830
819,000
18,S'YeeoY'r :00 1,418,004 1,152,000 1,189,000 1,169,000 1,309,400 1,291,951
,955b 1957 ]. q5$b 1959
50 .000 94,255 70-100,00065,000 90,500 80-110,000
55,720 51,647 65-100, 000 50,300
86,7250 105.212 130-170,000193,165 2_05, 7L 9 210-280.000 246,216.298,786 108,848 140-180,000 125,627°
187 ; 815 176468. 150'n -750', OOO J 97 . 2111 .971 111,302 120-160,000 155 .519221 5041 251,168 2 70,1. 33.1000153,11. .3 1 1. 7, 259 160-200 .000 1.28 .058114,950 163,344 170-220,000 18'5, 5860
1 _g 1
8 60]w
q
1,320,402 1,575,450
1,655,000-2,210,000
°Sources ?Ministry of the InteriorbSo°irce : Lao Bureau of Stctist#cs0107,594 in 1956d Includes Sayebourye1958 census1'253079 in 1956g48,461 in 1956
'I

r• TABLE 8
POP€ lATION 07 ii 0z Br Pa OVEiC AND DISTRICTSa .
SAPAVANE 1Muong Saxavane 29a 29,77I-:uong Kongsedon 35,199 35,276Iuong Lao Ngam 21,304 21,128Muong Kale= - 9,417 7927Muong Oka-vane 7,561 7,826Mang Ta Oy 10,815 11,96 5?long Tha Tang 5,165 .5,2o6
. Kong Ianan 82Y 7 66 066o
Total M,0 1-- 3j,-6-6°5147,259 (1957 )
CFPMP.'LSSAC 1960 D5.2Muong Chacpassac 35790 1.9,1 9 5I•`_uorg Pakoong 7,415 2,047Muong Phiafayy 17,216 9,714 8Muong MOuLalamok 12,229 4 ,370tuong Pakse 49,601 35,032I•uong Ichong 31,968 24,086Muong Phon Thong 20,492
aa~l 185, .1.
3 ,o- J'4: ?7
163,34-4 (1957 )
MAN G PRARANG 1252 ?9_a 1955Luang Prabang Prefecture 7,596 7,596iSuon ; Luang Pre:bang, except Prefecture 18,331 20 , 235 15,505Muong Inang Prabang, -Kong Pak Cu 13,797 11,891 8,488
Muong Hounh 17,867 16,323 (10,540) 7fuong Eounh, Kong Pak Bang 5,661 6,891+ 5,1 1 + 3Muong Pak Tha 16,965 10,01,9 9,596Muong Xay 26,027 28,753 20,58 1
6,597 6,316 b.
bMuong Xay, Kong Ha MaKong Da No, Dane I_luong - Deng 13,637
33,639 26,1471+NgoyHuongICI-
7g Pak Song 18,67943,909 27,488Kuong Sassy 15,722 12,192 11,762idunug Xieng Ngeun 18,159 14,9014 113,716'r uung Xiang Ngeun, Kong Muong Nan 8 419 7,938
Total 21
386 205,749 6 135
b
j TrOPEU 1 19 5Muong Sekong 1;762 13,522Huang Cao 13,735 11 i 519Muong Love 8,041 8,038
6,092Kong KasengISong Salang 1,973 1,379Kong Senam IIoi
Total3, 8
78;461 3 Sa 31649,
8998 (1957 )
IG1='aYUA 3 .960 ,19Muong ThaRhek 53,587 x++,04 5Muong Hin Boun 21,133 19,428I?uongKham Keuth 31,206 13,538t-uong I•"ahax_ay 44,974 31,722Dane Phone Tian 4,619 3 .?38
97 ]Total 155,519131,302 (1957 )
SAVAF2J1KL.L1 196o 1Iluong Rhan . .aoury 614,886 66,260Muong Ph3nn 15,049 13,486Muong Song Khone 48,964 36,630Muong Atsarhanthong 37,559 32,839Muong Tacey,.nne 43,218 24,6461) rKuoug ChamT.hcne _11,121 ,3431 -
:
Total 253,379 213,292

r
20, 28
20,00043,641
43,00014,193
13,42422,939'
20,494 6,29
_ 1218Total
107,6
zO3 s105,212 (1957 )
x7:G tiHOLALGLuang RheumNacre !'eoMeng Pekthong PasoMeng Mot
VMATIATIEiiuon(§ VientianeD;uon„ Bori k-n hiIuoOi ThourakbomHuang Phone Hangi uou Van; ViengI'_u-ng Sanakhsa
1922118 ,90620,33019,93113,42017,9147 .555
Total
1918,056c
SAfd'OURY
Z 0I:=ag Sayaboury
31, 3Huang Hoar, Sa
37,565?along Keno Thao
27,691:4u rg Pak lay
2$ 28' .Total
125,62
--------------------------------------------------------------------------------------
Source : Royal Lao Government census .
retorts for PI_ong Saly, Sap 7 eua or Nam 'Tha .p into, plete .cIiiaayees with estimates given in other tables due to lack of standardization .
overamc at estimates give 44,781 for NuongHong Sa and 135,552 for theprevi_:ce as a ++hole .
_k te : A l' ha'w . ;r sue of teeir basic figures are based on counts undertaken i n1c,' ;;:;, with t__e exception of Attopeu and Saravane all of the figure sae7r :se__G a net increase . It is poseible that some accounting erro r's involved in hose estimates . The general underestimation of tribal;ao 1at.ors apparently still continues in these figures . The tremendousccnce__tratioa in Vientiane District (I.uong Vientiane) is particularlyautstending and is most probably a recent development . An example of
sly questionable statistics is given in the figures cited in Table 8A ,beior :
- T'~BLE 8A
¶T2i CO_,1PAEIS0ii OF SIZES OF L.1 0 VILI GES IN TABS :'G i t50 IiOGN, MUO13Gt•_GOI ;G HOM1, 1JTh13 F :f^ t G Fi 0VI UCE, 1958 AND 1955
Population
_Houses1958 1222 1958 1222
2.uaa Laar_g 407 639 69 100B3 ?C ung 407 349 78 70:aa Fenn 167 162 35 30„- g,1;; 230 x-06 414 70„4n :Igatb 117 122 23 18
air Qi, 257 248 46 37Ta i au. Ben„ 487 343 82 79
176,168 {1957 )
108,8148 (1957 )

TABI 2
POPULATION OF LAOS - 1900-1959a
TEAR -POPULATIOLN
YEAR POPULATION TEAR
POPULATION
1900 400,000
1920 813,900 1931
942,60 01910 548,000
1921 813,400 1932
974,9001912 649,600
1922 825,000 1933
989,10 01913 702,200
1923 832,000 1934
991,60 01914 701,200
1924 837,900 1935
950,7001915 -703,500
1925 840,c00 1936
1,003,8001916 749,400
1926 86+,600 1937
1,031,1001917 796,100
1927 679,700 1935
1,023,3001918 799,200
1923 86,700 1939
1 ,074,4 001919 812,200
1929 693,100 1940
1,078,0001930 896,700
1941 984,900 plum area ce1Ced to Thailand
114,000 total
1,098,9001942 n
1,012,800
"
"
118,000 1,130,80 01943 1,159,000H
X
w
TM1,038,500 120,500
194db 1,189,0001947 1,169,0001951 1 ,309,4001955 1,291,95 11955 d 1,320,4021957 1,575,4501958 1 ,655, 000 - 2,210,000e1960 1,900,000f
Source : Pieti ntoni 1953 p .26, and the Lao Government
a'c'he area of Laos was estimated at 225,000 square kilometers in 1912 and 231,00 0in 1959 .
Nee Table liE Population of Laos by Provinces 1911-1959 and footnotes inthat chart for sources .
C Saurce : Lao Ministry of the Interior .dSource : Ian Bureau of Statistics .eThese figures represent the maximum and minimum estimates according to th e
Lao Bureau of Statistics .fAccording to B . Fall based on Lao government sources including electora l
census and alloying for a 1 .5% annual increase .
TAME 10
F&HL'EiT'LGE IEi A.S OF TIt POFULATIC;T OF MOO FOR SEI ' = YEARS
YEAR POPULATION IECRFASE mRcEta, fl CREASE
1917 796,1001927 .
879,700 83,6001937 1,031,100 151,400 14 .71947 1,169, 000 137,900 13,ar .6 ,1957 1,575,450 406,450- a
$Sources : See Table 9 .

TABLE 11
RATES OF AI WL POPULATION GROWTH BY WORD] REGIONS (1920-1956) Arm 1A03, =PARED
Lam 1222132
1221A2
1940-50
1.11.31.62.20. 31.42.15 {1940-51)
1950---195 6
1.61.52. 32 . 50.81 .72.03 (1951-57 )
World
1 . 1EOP.YE
1 . 1•South%O3t Asia
0 .9Latin America
1 .8Europe
0 .8. North America
1 .4L'l0S 1.02
0.82.02
Source : Economic Bulletin for Asia e.ud the Far It Vol . X Nod 1959, p .11 .
------------------------------------------------------------------------------ -
s .P3IE 11A
RANE3 OF Pc FGLI TXC 10ro:rx
1954-56
. (Based on Estimates of Total Population )
Burma 1.6
Thailand 1 .9Cambodia 3.6
Viet-Dam 1 . 1China (T hinland) 2.2
France 0 .8India 1.3
['ni tcd States 1 .7IA0$
3 . 2
Source : ECAP Bulletnt . = Vol .- N, No . 1, p . 11 .
------------------------------------------------------------------------------ -
TABLE 12
RATES OF POPULATION GROUTS, 1954-56(Per cent )
Country
Based onestimatesof totalponulat ion
Exces sof birthrate overdeath rate
ECAFE region
Burma 1.6 1 . 5Cam:. lia 3 .6 2.4China :
Mainland 2.2 2 .0Taiwan 3 .5 3 .5
India 1.3 1.2-1 . 3Indonesia 1.8 1 .9Japan 1.1 1 . 1Laos 3 .2 1 . 8Philippines 1 .9 2 . 8Thailand 1.9 2 .4Viet-ram 1 .1 2 . 1
Economically developed countries
France 0 .8 0.6United States 1 .7 1.6
Source :
ECL'. 7? Bulletin, Vol. X, T?o . 1, p .11 .
_qY

TB! 13
GROWTH =AVERAGE POPULATION PER VILICGE 1911 - 1959
YEAR # VILL ;RS RO L&L POPUTATIO0AFB
PER VII I .GB
1911 6,315 639,E 1011918 6,631 739,000 *13 II/1921 7,948 800,000 10/1943 8,888 987,000 // /1959* 10,053 1,526,500 152
Sources : Pietrontoni 1957 :240 and Lao Govern nt statistics .
*Conservative population estimate .
----------------------------------------------------------------------------------
TA LB 14,
VILLAOR SIZI AID POPULATION CONGER .TIOI - THREE PROVINCES COMPARED
VIJ TIAN$
Popula -tion inthous:..nda
ATTOPU FIEND LEOUAEG
Popula -tion in
000
VillagePopula -tion
No . of Popula-tion in
No. ofVil-
lades
No. ofVil-
lagerV11-
lager o 000_
-100 341 44.1 21.2
16 .4 187 56 .9 12 .6 26,0 799
67 .8 49 .4 46 .80.5-. 1
100-199 222 23.7 32.9
25 .5 83 11 .3 23.3 332
28 .2 43 .8 41 . 5
200-299 103 13 .9 26 .6
20 .7 25 -2v'? 6 .o 12 .1 37
3 .1 8.7 8 . 23 G
300-399 52 6 .7 17 .9
13 .9 12 7-,6 Li 8.5 8 2.7 2 . 5
409-499 22 2 .8 9.7
7 .5 8 3 .6 7 .4 1 \ 0 .4 0 .4
500-599 10 1.3 5 .4
4 .2 5 2 .8 5 .8 C . 8
600-699 4 2.6 0.7 1.4 1 / 0 .6
700-799 5 .2\ 2 \ 1 .4 2 . 9
800-899 4 .5 3.3/u.8 2 4 .3 1 .6 3 . 3
900 plus 4 4.2 4 7 4 .6 9. 3
TC AL
AverageVillage
774 100 .0 129 .0
220/BO1
329 100 .0 48 .7 100 .0 1178 100 .0 '.05 .7 100 .0
Size
Source :
166 90
Lao Bureau of Statistics, 1959 .
Note : Vientiane is estimated to be 99$ Lao ; Attopeu 70$ Ala; Xieng Khoueng
°o and Yao .

TL II 1 5
Province
?Oloueng)
Number o fDistricts":uonl) _
POPUTATIO
Th
er ofCantonsTas^enr?
OF 140Sa
Ember ofVillagesfan
Number ofInhebitauts
AveragePopulationPer Villageb
Savansalthet 8 104 1,100 221,504 201c
Vientiane 5 71 785 187,815 p. 3 y c
Saravane 8 63 994 153,448 154
I:zang Prebang 12 4d 1,958 131,165 67
Chompassae 7 45 541 114,950 212
Khamiiouaaze 4 53 887 111,971 126c
5ayaboury 3 26 523 98,786 1890
Xieng Khouang 8 58 940 86,828 92
Sam Pdeua 6 40 873 65,000 74
Nam Tha 5 26 583 55,720 96
Phong Saly 6 31 616 50,000 81
Attopeu b 293 _18,2e.321 1 1678 595 10,097 1,320,402 131
s'Ail data is from Lao government sources from 1953-55, except for Phong Saly andSam I;eua Provinces, where estimates based on earlier figures are used, sincethese areas were under Pathet-Xao control during this period .
b includes major towns (e .g . Vientiane) as well as villages .
cProviaces in which 80% or more of the population is Ian or Tai o

T1TIE16
Jal`L[oO-Lfl GUI<STtC -GROUPS OF LAD B ‘
1. F.roto-Indochinese
(Dwell on mountain slopes between the Tai aged Mao)Ida nu (n.mu)b
' Seng" Bit" Fiat" E'houthengb"" St• Semis
• Eat'tang°' Tahoi
Tena Tone
LoveHalang
2. Eihme r
(Valley dwellers in southern Laos )
3. Thai
lac) ( :tell in valleys along streams )Tai (in mountain valleys )White `--i (Tai Kee )Black Tai (Tai Ism )Red Tai (Tai Deng )Tai tdeuaPhoutaiTai Lu
yango»enne
PhouenPhong
4. Iteo (Idiao) -. Yao ~ .emu Lantend
(These peoples dwell on the memetain tops - rarely below3,000 feet . L+§e the Tai they are div1eI into sub-groupsbearing the n a of the colors of their d iet n< five costumes . )
5. Sino7y4yten
Lola (Ma Ito also known as Akha )$aphoMulled (Eha Psi )Loseu (subdivided into Black and Red groups ale() ?known as Lahu )
aA partial listing based on P. B . Lafont - !! m.,s r !e_I3o€ ,Vientiane, 1959, p. 13 .
bConsirlered by Smalley% (1957, iF - to ba identical . He also feels thatElla I :ou is a false etymology and that the proper etpressian - oftenused by the Lie - ie Ma Ehmu o
c8~ 1ley suggests that the ;tea Sauei and NCouy maybe different names fo rthe same group .
dThe exact linguistic associations of these groups is not known but theyhave been strongly influenced by Chinese culture . The sub-groups ofthe Hoe apr°^x to have mutually intelligible dialects, The Stripedand Black Ilea seem to be similar linguistically while the White i ohave imrortent phonological and le:.ical dif evemeae but these evidentlydo not hinder tin u l intelligibility .
0,~

F:
norG-ma
Iao
Tribal Tai
iliac (I•;:o )
:sn (!ao)
Iola
Kha (L:oi)
'iABL 17
ts' iC =US* OP L
Pub-tangs
Tours (ILaotians onthe right bank ofthe 1.7274.1=g River )
Black Tai (Fr : Tai oiz;Lao: Tai Dam )
White Tai (F'r: Tai Blanc,Lao: Tai Ehao )
' Red Tai (Pr : Tai rouge ,Lo: Tai Deng )
Tai Deng
Tai I!euaTai ThongYouanne
White t!lao (Pau Nee )Black IIiao (Heu l :_o )Red Liao (Gong Mao )F1o:cry Iiiao (Boa Mao )
Ao-TchaineEhaoLantene s
Kho, Eouni, HoKa (Ba), Sing
Northern : Sang, Bit ,Moug tane t
Southern° Bo, So, ieu.9ouei, Xatt ng Nie,Kasseng, Baleng, Alak ,BO.laven, Love, Tahoi
Cooenta
P'aoutai (variouss_rellings) genera lnave in north-eastern Lao srefers to varioustribal Tai groups ,
Groups ssn usuallybe distinguishedby their cootv=s .
Groups saa usuallybe distinguishe dby their Costume .
Man means "bar-barians " inChinese and "savage "in Vietnamese
The general termfor "tadonesian"(Proto-Indocninese )tribal peoples .
Resented becaus eit Clans "savage . "Puteng ( "men ofthe uplands " ) alsoused.
Kan other group ssuch as those inprocess of assimi-lation to Thai culturee.g. Mai and Mu-quay .
his list contains only the major groups, identified by their mos tcommonly used nase6 .
Based on : Esbree, Finals Groans of ITorthorn Southeast Asia and CarteEthnolinguisticIUe (Service Geo apphigucde l'mnlor~iuc and Reinach ,le Taos .
I3

- Lao
TADIX18
TAI PP0PL5 NORTUERN LADS
Location
Along the Mekong and north from Luang Prdhangto Thong Sa1y along the ram On . Warthemetalong the Nam `"h, a (River) . Prom Vientiane alongthe Nam Egan, the Nan Song and ! cm Lit .
- Tai Dam
)(Black Tat) )
- Tai Deal(Red Tai)
PhanTai
- Tat I o(White Tai )
- Tai Thong
- Tat Pouan
Lu
Center in Son Ia, Nam Tha and near Val Vieng.
South of Sam Walla and southeast of Son Ia.
East of Sala 1'eua and northeast of Thong Saly .
Southwest of Sam Nam .
Muong Pollan on the Xiang !thouang Plateau .
Scattered in the north .
Source : K. Iwata, "Ethnic Groups in the Valleys of the Nam Song and E am Lit . "
note : Other Tad groups includee See Table 21 for a listingof oee i if serez:~es betweenthe Tribal Tai ! particularlyWhite and Black) and theThai - Lao to whom mast ofthe other groups arerelated .
Tai ieuaSpelling varies, e .g .
°Phou Tai sometimesappears as Phu Tai o rPuthaI .
"~ PaullDai
" 'pouan" Parana' gown" Sot Pan
-------------------------- -----
TABLE i ~
AFPROYIMATF AGES OF VIL J
S
iI T VA VI : G AREA AND T1 ZR IDCAL ORIGIN
Pillage Fro mNo. CrouR
Vi( 11e eSan Age 4?hfrh ~Jr3-ginst_e d
1 Thai Pouan Souang I002 Wat Keo 1003 Thin One 1004 Ba Tana 100 -5 Koksane 15 46 Ua Thai 15 47 Gam Pat 15 4
8 Nam Po 100 ) common9 Pak Po 100] o11g1n
10 Thai ineua endThai Pouan
Tha 'Thng 150
11 Pha Home 60 1 012 Swan 0i 6 1 013 Kha 50 1014 oumon~ lO 1 315 Thai Neua Ea Bola 100 -16 Na Irmo 50 1517 Ea Mang 90 -16 Phan Uok 29 1719 Thai Satin Solon Thai 7020 I'n Gne 10 1 921 Thai Dai Tong Iao 100 -22 Fhoua Ea 50 21
Source : X. Z .ta, ":3thnic ron.- in thm Valley of the ram Soa and the Nam

Lam
REnrtcR'S CLASSIFICATION OF I GROUPS lIf IAOB
I . IOa oP ?`orti'ern I oa 13p r Lao s
A. Pura Kha
Khouene fihao
Houosong
Bo
Kouan gKbouene Dam
Bit
Sapouan .
SakLemet
Pheng MI
Kaseng
Mouce uIslip
SA
Tiol
I{hnoulava
Siang Di
AlmKho
Gioi
QnxaJO oui
Rock Roi
FinnsKouangSakMouceu
-Khmou
B. Mixtures of Y.h LaotianThaiaLu, a.n!i Yowl
Ok
Soue
Phou ThongYoung
Sek
Phou Thuon gPhou Phay
Phong
Thou O kSo
Lao IIie
C. ILtxtures of KhaandBo. Mao and lao (J
Kha Ho
I4loOani
SidaHo Kia
I.L . Kha_of Southern Laos [LowerLaoo
A. Pure Kha
izjarai
Mane
Ceding
Khan TouAa Reno
Iia?ang Roam;
Bade
BanamsAlak
Salem;
Haban
BoTiom Poueun
Peim.ong
I` rlar
BahnarLove
Katong
Tha Hoi
RogowBrao
K.atang
Vehs
SekSouk
Hi4
SoSeng
Thou Khao
Bin
B. Mixture of Kha and Laotians
Boloven
Lao B1
- .Th ou O kOng
Lave Lao
Phou PhayFou Thong
Souks Khok
Phou ThuongPou Eathieng
Souk TiiaTouli
Note : Original spellings have been retained . In many rases theycontrast with modern ones e .g . I.amet for Iamet, IQmo forKao, and Iihmou for IQlmu .
Source : Beinach, Le Laos .

l
OBIS 20
S'I i1C GROUPS A i13 TTR D 'I0 ! $I =* 2103 (DISTRICT 0? VA KO VILF3 )
Elevation(in meters above
Group
_sea Iev~ 33 ^o=gin aao
-A.o u
200-300 21300-400 39 1400=500 2 4Soo-600 3600•-700 3 6700-800 1800-900 2 6;oo-1,000 3* 2 2 5
1,000-1,100 2 21 .100-1,200 5 31,200-1,300 1 4 31,300-1,400 7 Z1,400-1,500 5 1 11 .500-1,600 5 1L600-1,7001;700-1,800 1
66 36 4 36
Source K. Isiata, 'ethnic Groups in the Valleys of the ram Song and Nam . Like "
=A nuacr of Lao villages have moved up _nto the mountain to be next to theroad for trading purposes .
T .BLF21
CULTURAL CHARACTERISTICS OF SIX MIMIC CE0i.1PS OF VORTHI RN LAOS
P PresentS a SecondaryL s LimitedA L-Absent
BlackTai l,'~o Yao Khmu lamet
Irrigated rice cultivation P P L A L - ASlash-and-burn agriculture S S P P P POpium cultivation A A P P S AKnowledge of writing P P Sa sa A AVillage political organization S P p P S SExtra-village political organization P L L A AOrganized extra-village political
hierarchy P L Lb A A APatrilineal family structure A P P P A A
1 Buddhism P A A A L AClass groups within village L P S S L LClass groupings beyond village P P A A A A1ormally•ed0cated officials,
civil servants and technicians P S L L A ARepresented in politically
organized visits in Chines ePeople's Republic or DemocraticRepublic of Vietnam P P P A A
aTJse Chinese script -Have a representative in the Lao Parliament

TOTS211
=TAM ~IQ [UAR IrebIC=3 O .SBIECTEDS iIC CO IM ra.
I OS
Crete
Um:ens Dens st
Tot e
Lao
Sirs earcn -tyge ehirte E'nunlly of won=with gold or silver
ha:hoe, withwoven trio ; often of
v rnith end thatchmulti-colored cotton in roof; on stiltsvillages
]Cu
Indigo-dyad skirts with Often of plextkmulti-colored striped
construction andinnate; tsixa ied girls lerger than tholetrear pink turbans
of the Lao
Black `lei Teen derived from fitted Usually of woven(Tai Dam) black blouses and long
bamboo, on thesilk skirts of vomen;
ground in yio
geemarried troy=en wear
feehio_s; in ren Thaehigeon high on center
on otilts with plankof forehead
construction
Mho).
Simple striped cotton
D rboo houses inskirts nave-a by the Lao ; small village; inoften wear turbans
upland areas ; poorer- than those of the Lao
t:eo
Both sexes wear loose
large plank house sblack trousers and
built on ground ;silver neck-rings ; Tee)
interior subdivide dtoo women veer ctbroider- into really units ;ed a vne ; i__o Dam are
s: niual cereals nearbyidentified by sheet, fullbaths-printed linen skirtsand bleak leg wrappings;the L :o Tai (striped l o)have etripe of coloredcloth appliqued on sleeves
1 most caces therM are fewer differences in rcef t 2 dress.
Other Ccntints
Center of village is pagoda(Kt), uuually larceat nn.beet coa.structed build,;abbot of at has highaotp c tige; kinchip lcce'alystructured ; village h=-ten fleet among equele cult'
Paucehold raups tint=117;larLpr then those of Lao;La concentrated in valleyof ram Cu and in f t oza ;3 fang,vere reeeannts of a princelystate endet
Related to•White (I'iao) andnod (Deng) Tai, originallyruled by hereditary princos ;main center is Dien-bienPhu, new part of th ehighly structured xeligiouuexitem t= ith patrilineal cul tof ancestors
Trade forest products andgams to Lao ; practicetetooing and betel-thawingto a greater extent todaythan do the Dee ; animalsacrifice important ;aboriginal inhabitants ,animists
Headman has importantposition; ee ade:d familiespatriarchal a.+d patril-inea1 ;recent ieeigrants fromYunnan; noted for opiumcultivation, livestock;mountain-top villagesmoved every few decades
I7

Tl',B 322
a 110 C0 Z'03I I OF l C3, 1954-1955, BY 1E=MMUL3 07
~i:T`TIC 03 3 .1E1 INCH F 0YJICE
ridTotalProvince ?OeLL1ation
Lam Tha
46,609
Luan ; Prabaag
135,021
3ayzboury
98,516
Xieng T hour ng
93, 609
Vientiane
186,269
IQx truouane
108,60 3
Savannedthet
214,974
S: ravane
125,957
Chasaac
122,078
Aftopeu
43,315
Tong Sa3yo
50,000
San Ncuac 0,0_22
'Total
1,291,951
17,104 36 .54
26,793 57 .25
2,907
66,667 43.74
63,416 46 .35
6,718
65,339 67.69
8,167
8 .29
3,960
+,o9o 47.10
12,178 13 .01
37,341
133,978 98.77
317
0 .17
1 4 57452,90D.
99,785 91.88
8,818
8 .12
-
171,743 79,89
42,231!!9. e 'f
65,498 5,_ 0
60,459 48 . 0
117,769 96.47
4,309
3 .53
12,865 29 .70
30,450 70 .30
see Table 31 for 1930 figure s
see Table 27 for 1936 figure s
Lo 34
Yao
6 .21 16 0
4 .91 /n 0
4 .02 ! o
39.69 /0 D
1 .06 /O a
/00
/O D
/0 0
Source : Unpublished records of Eiinistry of the Interior of the Govern .:nt ofTaos, Vientiane .
anaelusive of Chinese, Vietnam se and Lropeans .b7 ci ea Fix, Tai Dam and other tribal Tai groups ; does not include Thai .cData incomplete since most of tha area was under Pathet-3ao control during
this period .d otal, excluding Thong Saly and Sam rem Provinces . .
Note : Compared to Tables 26 and 30 for approximately the same period andTables 27-32 for earlier years, the lao-Tai figure appearsexaggerated and the Kha figure underestimated, for example, i nLuang Frabang the Lo-Tai figure is greater in this table by 8%,and in Sayaboury by 12%.
!8Lr .

TOLE 23 '
ETHNIC CO,0POSI T ION OF THE POPULATION OF LAO S1911-1955
Kingdom of LuangPr~aam3a All of Laos
Groyp 191.1
. Yom_ JD21
% 19 ;1
% 193 6 7. /2
5 !
191..2. 19550
% .
Lao 276,801 45 429,000r
52 485,000 50 565,000 56 168,050 1 34.8 441,450 43 .6 856,000-865,000 77-74
Tai "124,238 19 122,000 15 113,000 12 100,000 10 108,490 22 .4 175,170 17..9
(Lao-Tai )
tha 195,996 32 221,000 27 268,000 28 247,000 24 141,400 29 .2 300,138 29 .6 210,000-258,000r 19-22
Moo-Us 15,205 2 25,000 3 39,000 4 47,000 5 47,240 9.8 49,240 4.9 52,300.52,900 44
Vietnamese 4,109 .7 9,000 19,000 2 27,000 2.7 15,400 3 .2 39,470 3.9 8,000g
Chine 446 3,000 .3 2,41,.0 .5 6,100 .6 32,350g
European 2262 353 1,000 .1 560 .1 900 .1 8,000$1630 Sc
Caml.oaiiaa 1,270 1,300 2, 00 0
anitP :tea 6 200 500g
Total =- 98.7 C19-- ;0 97 964,000 96 .,4 '•O ,00 3 . 97 .7 483,580 100 .0 1,012,468 100.0 1,291,951-1,320,402 100L/ $, 6'62,653 Y.?s . ~C !
r-•ta -G d
oiob
00thax EuropeansPraincipally Luang Prabang Province and part of Sayaboury
Exclt":,ec Prong Sely and Sam Noua ; present calculations based onprojoatioa of available estl.mn•aa
9 ha underestimated dcepita aacluc~ecl provinces which contain few La og1959 estimatce ; 41,121 non-Lao Asians yore ro imterei in Laos in 1959bincl'u7es French military base at Sono ;end American community {500) in
Vientiane (1959)
Sources: Lao Ministry of the Interior, Annuaire Statists ue u Laosand sources listed in Table 7 .

u.B1.3 aRTZNIC CO:0ITIdll 07 1L.t
07 1103 IN 1921 AND, 1955, C0 PAREDBY P .c NP._:'v'; 02' t'ifIC GROUPS IN EACH PROVINCE
Province
Lao'$ +Tel
Kha
t'eo-Yrso
Chinese
-roldier_am Tha
' 21 23 + 6
a Y
I+7
6
6
$ ?
'55
37
57
6
/0 G'Luang Prabang
'21 50 + 2 u 52
42
4
9 2
'55
49
46
5
I D 0
Sayaboury
'21b'55
88
8
4
10 0
Xiang rthouang
'21 57 t 18c= 75
20
q,5-'55
47
13
40
10 0
Vientiane
'21 70 + 22 = 92
1
2
16-'55
99
.2
1
1 ~ a
Xlaammounne
'21 80 + 200,100
I D 0
'55
92
8
i0 0
Savannakhet
'21 48 + 31 =79
19
ti e'55
8o
20
MO
Saravane
'21 38
27c = 65
33
1 8'55
52
48
1 b bChampassac
'21
89
8'55
96
4
1 O U
Attopeu
'21
10
81
X1 9
'55
30
70
tb7
Phong Saly
'21 25d F-
4 - 29
50
3
12
1 '1 ?'55
Sam Neua
'21
75
18
6
y q'55
Source : AnnuaireStatistineue duLaos, I, 39 and Lao Bureau of Statistics .
&Includes Tai-Lu also see Note for Table 22 .bLncluded in Luang Prabang figure s
c lncludes some K1a groups
din 1930 it was estimate that 8t6 of y thg'apulation_was_Iao_ table 3 ]
TABLE 25
POPULATION 07 XIE G 1 UANG 10VU CC BY 3TMUIC GROUP S1953*
Group
-Number
Percent
Mao
37,347
48Lao
29,566
38Laotheng [She}
8,146
11Tai Dam +
1,555
2Tai Neua
859
1
Total
77,483
100
4:sample includes 77,483 in 940 villages, out of a recorde dpopulation of 86,728 .
Source : Lao Ministry of the Interior .

TOPE 26
ETENIC C L 4I IC i 07 THE POPCIATIOI1 07 IB C FRLIBAt PROVINCE, 195 4
hnic Orou Number Ethnic Group Tuber
Emu 67 : 844 Eha Lokc 427
Trio 49,681 Tao
. .338
two 7,069 TTThi Dawa 281
Iai$ 4,1'53 Yang (Karen) 206
Tai Henna 2,962 ih
(Atha) 180
Phou-Taia 1,426 VietnW. ese 154
Phouaneb 1,041 tenten 84
laaetc 631 Phou-Xangc 23
Idouanea 588 Conbodian 7
Chinese 468 Indian 3
Percent
Total
Lao
36%
49,681
Total of all groupsLao -Tai
41%
59,391
137,86 6Khmu
40
67,1311-4~ihmu + Tha
50$
68,925
aribal Tai groupsbLao speaking group with Vietnamese influence scl01a group
c
r Ministry of the Interior .----------------------------- ------------------------------------------ -
TABLE 27
POFi7IATIOP OF EOM-P
(a M N uA)-1936
Groin
Number
Tai News
21 ,905
lTai Deng
12,996
)Tai Dam
3,001Other Tai
840gha
10,234F.:eo
7,438Chinese
152Vietnamese
455Europeans
1 0
TaiKhaMa oOther
,742
Total 57,031
Percent
Total
67 .9
38,742
17 .9
10,234
13 .0
7,438
1 .2 617
100
57, 031
Source : Tu1letin c's3 , .s?i s d~aL~o~ poi, 1937 . A l

T BL 28
POPITIATI01 OF SRAv=, 1938
Dumber
Kha-Souei 10 ,935tam-F -Eang 10,533Nha-T:;'hoi 7,091Il-A1ak 6,307Kha-Dghe 6,oiiSha-Ioven 5,90k€Oza-i entou 2,022Hha-Ine 1,152Kha-Pe ho 9044h$-iaouak 242
Kha-Chun 109I
E°n3K ng 60Kha-Sadang 40Lao 41,194Pou T[h]ai 1,56 7Vietnamese 206Cambodians 6Chinese 57French ._..- ._9
95,19 9
Percent Total No .
Kha -557-16-4 . Y 52,160Lao 43 .3 41,194Tai 1.6 1,567Others r._ • 3 rya 0. `7 g
100 95,199
Source : Bulletin des A.rnis du Taos, Hanoi, 1938 .
------------------------------------------------------------------ -
. Tt0.i tE 29
JZLB UC COMPOSITION 07 a3% PA °AC AID °.rAiiAVLHE in 1952*
Total Population 305,000
Total Laotheng (Kha) 210,000
love (Jirru)( "mixed with Lao")
35,000
Nate : Table 22 gives95,218 Iha for the samearea and 196,132 Lao-Tai ,while by inference thistable gives 95,0 00 Lao-Tai .Attopeu is assumed to beincluded .
Alack 23,000
Nhiaeun 18,000
1Chasseng 15,000
Hhamane 10,000
Tahoi 40 , 000
Sauey 35,000
Ser3ang, Brace, Sauey of I=.seac 20-25,000
Source : French Cover==t estimates .the r pellin„s follov tbs.: ol,iry 21 caurcea.- Pp - r

E C T G E hty iiC CO:MSI`II0I a T113 PONIIA.TION OF
E ak% M A . = LEI DIST3IC3 Cl' MOM! E 0VI 03 {1950)
Popalation
Total (1960 )1' lay
MInwv Ea
of Bang Sa
for theGrow)
Per,cca .
PorF;ent
_11950)
Percent
Province
rerceut
Imo
4n
25 )
Iu
-
10 )
20r599
46
102,551
?Kr 77
Tai.
2
- ))
Ilium (Yuan?)
10
25 )(Fnou Tai )
Fai*
18
6)
7,139
5-)
Ififfiu
20
20)
24,182
54
7,908
6
I'ea
6
12)
10,419
8)
no
4
2)
4,436
V 3
Total
100
100
44,781
100
1139,, '5 3
Sources : French government statistics and official Lao government figures asquoted in The Challenge of Laos, August 1960, p . 3 .
wZroto Indochinese group in process of assimilation to La or Lao culture .
rotes The total population estimate as not appear to be unduly high bu tthe figures for individual tribal groups are much higher than presen tLao government estimates . The 1950 estimates appear to show a'greate rproportion of tribal peoples than is indicated by the 1960 figures .
1 3
-23 -

T BIE 31
bilii IC CO 1 S1TIOI1 OF PHOIiG SAL!, 193 0
Group I!ea Women Children TotalPhu-Noia 3,8oo 3,600 2,600 10,000
Fha-Khmu 2,000 2,200 1,800 6,004Kha-Phaia 450 550 500 1,500
Kha -Bit 100 110 90 300
Kha-Sang S5 -.7_2 70 200
Total IO;a peoples 6,405 6 ,535 5,060
-
18,000
Ira 1,000 1,100 900 3,000
750 900 850 2,500Tai-DamTai-Kao
250 280 270 800
Tai Neva 60 75 65 200
Yang (raren) 50 80 70
Thob 70
Total Thai peoples 2,180 2,435 2 ,155 6,770
Yao 300 300 400 1,000
Mao 222 140 130 400
Mao-Yao Total 430 440 530 1,400
Aklaa (Kim Ko) 800 1,100 900 2,8oO
]3c -A11o 700 850 950 2,500
Vietnaueseb 36o 100 40 500
Chinese 25 30 45 100
Europeans 29 1 30
Percentage DistributionThai peoples 21(Iasi) 8Elsa groups 5 61'.. eo -Yao 4Other tribal groups 17Others 2
Total population
32,100c
Cu:•rce : I_onotranhIe du V e Territoirelilitaire, Hanoi, 1930, p . 138 .
°According to P . B . Wont, Aparcui sur le Laos, Vientiane (1959 : 13) the K haPiwi and.Phu-Noi are identical and belong to the Sino-Tibetan linguisti ccoup together with the Akha . The classification here follows the origina lsource and is also based on bree, Ethnic Groups In NorthernSoutheas tAsia (1950 : 104) .
L.)Te ho are mainly infantry . The Vietnamese are mainly officials, soldiers, r erc?:ants and their families .
cAccording to the source these figures are underestimated, the total populatio nbeing closer to 40,000 inhabitants with a density of 2 .5 per square
ca dskilometer .
- 24 -

y".sI
32
TART= L ELT C2 11 tt
:::VIM £/ E nT-€ ':3 (MA TDA) 13 1938A'.
kZOR:aTIC=n13 c'~: ;31TIC3 38 TUD E:.w . . &121CU 13 1953
Tribes§
SelectedTribes in
Tha
SelectedTribes inID .t2i Sai % is
b.
larkTr.7 ... Tarn '' O~' R° Eietxlct District , 1923
Jazat 3,806 r.amet 10
Was (Thou Theng) 1,778 pho-u alms
Mien 2,915
Can 703
Kha nay 61 !ha nvy 2
Eha Deans 112 Ma Pis
Ida Bit 58 Eba Fait 2
Eba 3i&i 31 1 a 0k 3
-Oth:• Ma 3,605 Other ftha 3
26tal : 13,069 49% 10 2 9
Akha. (iiaa Ito) 3,3+23 ha XUho 5 ttha Tino 3
ha IiEA (Lohu) 423 &ui 4 Kid 4
Total : 37
6 1'%__~ 9 7
Hesse 24 Pbssu 7
L oszu Dam 529
!. ossu Deng 1,120
YanZ (wren) 2
Nis 108 IThuan 5 Sam Tao 2Liman 6Dais 1 . 5
Tai Nsua (Phou Tai) 688 Pal fcua 5 s"a, i teua 6
Tai Dam 1,271 Tai Dam 25
Yuan 3,003 Ebuen 5 301uan 14
Elazig 122In 10
Lao 6
Total : 6,865 26% ~+6 54 . 5
Iles 271 I"eo 3 1'wa 6
Yao 2,129 Tao 12 Yeo 4. y
Ianten 574 lasnten 12
Total : 7974 11% 27 10
Sources : F^__-t
, * _ . ° its o __- m ^b ,lnc.C =i.iu3 by K. G. X J owita,p. 21, cu d
ga rr ' ;nt statistics . ,22 7S'

w 1
L 11T.) VII -3
7'"" .i.v L<:3 f..°J DIM=1957
ISO
12N:srtlbr,r oz
1-5 4 5 .3 2 206-15 11 17 .2 148 6'4 .0 7 70
16-e5 1o 15 .6 20 25 .7 1 1026-50 29 45 .3 3 4.0 - -51-75 5 7.8 - - - -
76-100 9 14 . 1103.0 75 103.0 10 100 . 0
z•ouul :tiom of V1112 3
20 and under 3 4.0 1 1 021-30 4 5.3 5 5031-50 4 6 .2 22 29 .3 2 2 051-100 10 15 .6 37 49 .3 2 20
101-2G0 23 43.7 9 12.0201-400 15 23 .4
10 .9401 and over99.j 75 99 .9 10 100.0
dvera'3 I;tT._'ller of P°srbero in Eoucahold
3 .0 .. and um der 2 2.7 1 105 .3 4 403 .1-3.5 _
3 .6-4.0 5 7.8 8 10 .7 2 204 .1-4 .5 13 20 .3 17 22.7 2 204.6-5 .o 33 51.6 22 29.3 1 1 05.1-5 .5 8 /2.5 13 17 .3 - -5.6-6 .0 3 4.7 7 9.36.1-6 .5 2 3 .1 2 2
io .o 75 100 .0 10 100.0
Source: Lao :21niictry of the Interior
2u-
-

Eup-170r of Fo*r,^~
E.L'03
Iaea
1-5 4 2.o6-15 49 24.3
16-25 66 32.726-50 62 30.751-75 16 7.9
76-100 3 1.5over 100 2 1.0
3 .0 awl uxr7.or 4 P .O 6 6 .5 4o 7 .83.1-3 .5 6 3,o 5 5 .4 36 7 .03,6-4,0 21 10 .4 10 10.8 54 10.54 .1-4 .5 41 20 .3 3 3.2 65 12.64 .6-5 .o 45 22 .3 14 15 .1 77 15, 05 .1-5 .5 4o 19 .8 8 8.6 71 13 . 85 .6-6 .o 15 7 .4 8 8.6 62 12 . 06 .1-6,5 15 7 .4 11 11.8 41 8,06 .6-7 .0 6 3.0 13 14.o 35 6 . 87 .1-7 .5 4 2.o 7 7.5 19 3 .77 .6-8 .0 1 0.5 6 6.5 2 o .48,0 or over 4 2,0 2 2,2 13 2 . 5
202 100.1 93 100.2 515 100 .1
Sozrceo lao dlinistry of the InteriorDistricts of Pais Sting, Pak Cu, 10?ong neoy, Th.k Bong
''
32
ADD Fir:<L' 0 02 110, . M0 T0=P, €", e7D 0b c V WG1B10 LE 0 LZ0 „:a FZ0VIC: 3, Iit DI r Caa - 1957
District Lao Lao Ten $+.mo t`crsIizanR 10 . a l o . I'a . i ►otal
Fad Prabar*g 64 43 75 50 10 7 - 149I,Tgoi 72 31 139 60 20 9 - - 231
Ou 41 30 86 64 7 5 1 1 135r0's Song 137 36 2'42 64 - - - - 379Uoua 22 17 96 74 11 9 129i`ak Bong 8 9 72 82 8 9 - - 88PaI: Tha 17 10 128 77 9 5 13 8 167Yams Egcun 73 37 123 63 196Kassy 48 k6 57 54 105vane 32 41 4o 51 6 8 - 78S.M. 78 40 115 60 193raw 38 43 .a
Total 630 33 1,224 63 71 3 14 .7 1,939ai33nl, amub.-Encinitas Yao'Tribal Tai groups
di f- 27 -
.
- 1959*
1'~o
i v T (Ma)Co .
Eon„Lnifn 037111rh.2.
20 or rL3~r
1
21-30
5
31-50
21
51-100
62
101-200
81271202
201-400401 or over
202 103 e 1
93 1003. 0
0 . 52 . 5
10 . 430 .740 .113 .42 . 5
100 .1
9
9.756
60. 220
21.57
7 . 51
1 . 1-
-
512143 821
3
9 3
5 .4 20 3 .912.9 18 3 . 515.1 78 15 .L40.9 222 43 . 122.6 142 27 .63.2 33 6 .4
2 0.44100.1 515 100 .0
18 3 . 5234 45 .4159 30 .996 18.68 1 .6
515 100 .0
(lumber o% Dr:brrs in Eou,eho14

TADIE36
NI!'3I R OF HOUS, POPIJIATICaAITD AVERAGE HOUSEHOLD SIZEIN SET T ] 11'ti ~T VILLAGES IN FIl' LG FRABAT G AND 1'v1?1 TBA FROVI?`1CE 3
1937
Number of HowesT.v#11
No .Prabl
Ed'Nam Tha
No.
%
1-5 2 3 .4 7 15 .96-15 36 61.o 22 50 . 0
16-25 16 27.1 11 25 . 026-5o 5 8.5 4 9 . 151-7576-loo
59 100 .0 100 .0
Po'culatian e
Vill e
20 and under 3 5 .1 5 11 . 421-30 12 20 .3 3 6 . 831-50 18 30.5 7 15 . 951-100 23 39.0 23 52 . 3
101-200 3 5 .1 6 13 .6201-400401 and over
59 zoo.o +r4 100 .0
Average Nun. r of Membersin Household
3 .0 and under 9 15 . 33 .1-3 .5 14 23 .7 5 11 .43 .6-4 .0 12 20.3 13 29 . 54 .1-4 - 5 15 25 .4 5 11 .44 .6-5 .0 8 13 .6 9 20 . 55 .1 -5 .5 1 2 . 35 .6-6 .0 4 9 . 16 .1-6 . 56 .6-7 .o
1 /.73 4 9 . 1
Total 59 100 .0 100 .01Source : Izikawitz : 1951, 39-40 .
TAB1F
SIZE OF PlAlld AND MOUNTAIN VILLAGES„ C0 .flARED,PROVINCES OF FHONG MUMS NAM THA
Plain and Mountain
Plain
Mountain
Tas- Vil-I4uon' send la;e Pop .
Phcrng 2 . 1y ProvinceThong Saly
13 191 26,368Cu I eua
6 118 10,292Boun Tay
7
4 9
4 ,903Muong Khoua.
8 268 22330Total 311 n6 63,953
Iam Tha ProvinceIdam Tha
4
75 13,005
source : FAO reports on Phone Saly and Nam
'Includes Iu, H8, Tai Dam, Tai .Neuab includes Thou I'oi, Yao, Mao, Kha Pal. ,c Il>cludes Lao, Lu Tai DamdIr,~ 1 . := s Ianten, Mao, Kha i'Lo, Khmu
I t
Av.
Av .
Av .Size
.
Size
.
Sizeof Vil-2 Vil-
of Vil- : Vil-
of Vil -lage lace Pop . lage lage Pop . lage
138▪
58
6,461
111
133 19,90787
2 35
4,304
123
83
5,992100
16
1,681
105
33
3,22284
72
9,806
136 : 126 12,584102
131 22,248a 123
445 41,705b
• 26 7,779 c 299173 49 5,226d 107
15 07 29864
Tha, by B . H . Duclos, 1959 .
Kha Bit, Kha-I:o, Khmu
- 28 -

TABLE38
AVERAGE VIL AGE SIZE IN GOT H IAOS BY SELECTEDAREAS AND B't aUtC GROUPS
(Xiang Khouang Province, Meo, 1955 )
Muong orIionp~ Tassen
No . ofV111a^?s Population
AverageVil1arre Size
7512483528 3657 3
1,3621,4881,1721,1022,681
8511,758
181214213 21 324
Phou-IChePha PeungThou LlouatPa KhaHeua IJhouamePhac LeungIinaug San g
Muong Pek
Muong Cba Tham ThaoMueng-Pha
Na Van gPha Xay
Phou Xek-Ngok
131 83 13 212
1,2601,8483,3011,642
892
961021065 17 4
Kong Thou Dou Phou-Pha 18 1,647 91Tha-Chek 14 1,055 7 5Nam-ba 14 1,128 80Thou Sanh 14 1,521 108
Kong Song Het Phac-Roux 20 1,602 80Keng-Khomay 19 1,810 9 5Pha-Vene .31 1,837 5 9Phou-Sabout 10 1,000 10 0
Kong Muong Moc Phcu-Soung 20 2,600 130Nam-Xao 18 1,500 83Muong-Ngat 9 950 105Tham-Tat 11 1,340 121
Total
438
37,347
Aver. 85
{Luang Prabang Province, Meo and Yao, 1950 )
Muong Sai
Muong Sai 29 557 19Muong Nga 4 149 37Muong la 8 292 36Muong Bang 5 304 60Moung ifamo 16 342 21Moung Hai
Total 69 2,023 Aver. 5S Q 7
(Xiang Khouang Province, Lao, 1955)
,
13 732 56Muong Pek ThayKhoung 20 1,128 56Ang 9 709 79Soui 14 1,384 99Xiang Det 6 478 80
- 29 -

TABLE38
AVM".v^3 VILLWE SIZE IN I;ORiImN LAOS BT SELECTEDAREAS= ETHNIC OEOUPS
(Continued)
- Muong or
No. of AverageKong
TassenK
Villzt)e Population Vi1Ja^3 Size
Muong Kham
Muong ISham 14 1,811 129ifiam Thy 10 712 71Huong I?eua 13 1,166 90Buong Tay 10 1,127 113Hat Ram 17 1,812 107Hat Bok 21 1,705 81
The 5 718 144Elmo 6 497 83
Chang Ou 9 550 61:heung Xam 16 1,311 82Boun Thine 28 1,374 42
Total 211 .17,214 Aver .
82
(Luang Prabang Province, Lao, 1957 )
Muong Luang Prehanng Phakham 8 1,470 184Ban Phanom 4 766 192Pa Luang 4 359 90Sru
halok 11 1,927 175Pak Lung 10 1,926 193Muong Khay 14 3,512 25 1Xieng Men 14 2,356 168
Total 65 12,316 Aver . 189
Muong Sai (1950)
Muong Sai 14 2,837 203Muong Nga 4 517 12 9Muong La 6 745 124Muong Bang 22 2,305 10 5Muong Nam) 6 422 . 70Muong IIin 744 149
Total 57 7,570 Aver . 133
(Xieng Khouang Province, laoteng, 1955)
3 553 184Muong Pek ThaySoui 9 382 4 2Phac Pang Pang 6 237 39Na Mouane 3 106 35
Nam Ko 5 140 28Xieng Det 13 691 5 311am Neua 4 80 20I:ham Tay 6 308 5 1Jiang Neua 3 189 63Hat Nam 7 63 9Hat Bok 2 26 1 3Iona Savanh 5 286 57Boun Thine 15 907 60meting Xam 9 518 57Bok ithia 16 851 5 3
Lane 13 836 64Khang 10 618 62
Total 129 6,791 53
3 0_30 -
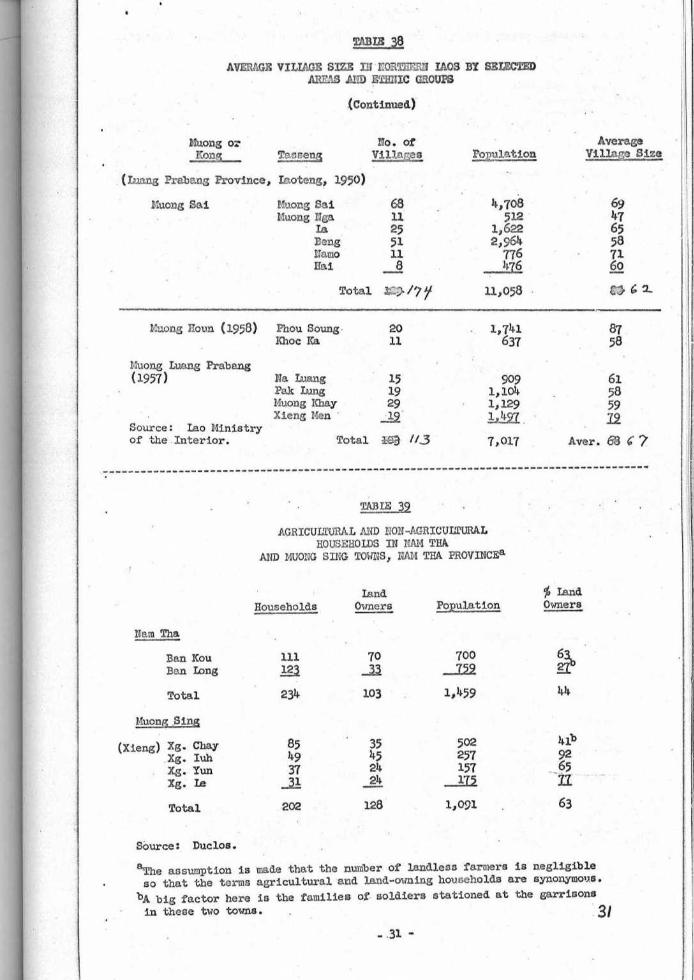
T" BIE 38
AVERAGE VILI :nn 5i 1U t0R ..&I-.2 lAOS BY S3L,ECIM.HLA S Al',D EMI= CHOWS
P• uor:7g orFong
(Continued)
No . ofTassen
Vila ; a mlationAverage
Village Size
l i1noteng, 1950 )(Luang Prabang Province ,
Mang Sai 1!aortg Sa iMuong toga
LaDengNamoHai
681 1255 11 18
I,708512
1,6222,964
776gl
69".76 558716o
Total K)-/7y 11,058 6 2-
1 ong noun (1958) 3?hou Soung
20 1,711 87Khoc Ka
11 637 58
riuong L,ian,g Prabang(1957) Na Luang
15 909 61Pak Lung
19 1,104
_ 58P•iuong Kbay
29 1 , 129 59Xieng Men is 32Source :
Lao Ministryof the Interior . Total 113 7, 0 17 Aver . 68 C 7
-------------------------------------------------------------------------------------- -
LE32
AGRICULTURAL AND EON-AGETCULTUPAL
HOUSEHOLDS IN
TEAAND MUONG SING TOWNS, NAM TEA P OVINCV`
Land
% LandHouseholds
Owners
Populption
Owners
Nam Tha
Ban Kau
111
70
700
63bBan Tong
1233 759
23
Total
234
103
1 , 459
4 4
(xieng) Xg- Choy
85
35
502
4ibXg. luh
-9
45
257
92Xg. Yun
37
24
157
6 5Xg . le
31
24
75
fl
Total
202
128
1,091
6 3
Source : tuclos .
aThe assumption is made that the nusmber of Landless farmers is negligibl eso that the texas agricultural and land-owning households are synonymous .
bA big factor here is the families of soldiers stationed at the garrison sin these two towns .
31
- - 3 1 -

ACE STRUCTURE OF L4.4, AID"U, 11TA .A D YAO VILYAirE MN LUAEG FR OA1 G DISTRICT, 1957
LAO
Age ld ' F % T
: Six Tao Villagesof Vientiane (1959 )
District%
: Age ` r
0-17 2602 44 .5 2646 43 .2 5248 43 .8
: 0-19 48 .8
18-50 2351 40 .2 2734 44 .6 5085 42 .5
: 20-49 38 .0
51 / 892 ?5 _3 751. 17 .2 164 13 .7 50 / 13 .1
Total 5845 100.0 6131 100 .0 11,973 100.0
Vale 48.8a FemaleTotal
51 . 2100 . 0
KEMU
1-17 716 43 .1 771 44.6 1487 43 . 9
18-5o 851 51 .2 875 50.6 1726 50 . 9
5o / 54 5 .7 82 4 .7 176 5 . 2
Total 1661 100 .0 1728 99.9 3389 100 . 0
Male 49 . 0Aramaic 51 . 0Total 100 . 0
. ME0 AND YAO
43 .0 69 38.3 143 40 .6 Note :
Khmu, Cleo and Yao1-17 74
19-50 91 52 .9 103 57 .2 194 55 .1statistics tend to heless accurate than thos e
50 / 7 4 .1 8 4 .4 15 , 4 .3for the Lao .
Total 172 100 .0 180 99 .9 352 100, 0
% Male
-
48 .9
Female •
51 . 1Total
100 .0Source : Lao Government statistics .
-----------------------------------------------------------------------------------
TtOLE41
AGE DISTRIBUTION UP SELECTED PEOPLES IN LAOS
LAO
EMU
120-YAO(Luang
(Luang
(Luang
All of
Prabang
L}r ,bong
Ps zibangLaos
District)
District)
District)Age Group _-19?3 i7.__
1
1957 .,
1-17
45 .1
43 .8
43 .9
40 .618-50
41 .1
42 .5
50 .9
55 . 150 /
13 .8
13 .7
j.2 4 . 3
100 .0
100 .0
100 .0
100 .0
KEIAbPLJO[P
Savan-T,AI
nakhetSavanna-Me t_ ?~37
Age
50 .3
42.5
0-15
40 .5
49 .3 16-5o
9.22
8.2 5 0ivu .0
100 .0
:
1938
Source : Pietrantoni : 1943, p . 30 and Lao government statistics .
'824 villages of 8,896 individuals south of Savannakhet town .b7 I{ha Tassengs in Tchepone District ; 5,084 individuals .
-32 -
3~.

T57; LE 42
AGE GROUPS, BY VILLAGES, MUONG VIENTIANE - 195 9(Leo)
Art, 03.0UP BAN T:TAKA8 BAN NONG PYA I BAN DON MAYXAI I BAN DON NOON BAN =DA TOTAL
0-1 0 7 8 36 14 i
19 842 1 . 2 1o 15 11 !
10 49.3 9 2 31 7 II 704 3 5 4 20 . 8 4 44
B21.e'
0-1 -
13 6 .2 16 8.2 2 18 .6 102 1.6 .1 4Q--__1 .6 .65 5 6 4 11 ? 12 456 5 3 7 14 6 437 6 8 0 15 6 6 418 5 4 9 10 6 109 6 3 2 7
131755111:'551(5-9) 27 1.^ 9 21, 3.2 .L 22 12 8 60 . 7 °32. . 8 2og 13„910-14 23 11.0 28 14 .4 19 11 .o 71 11.4 32
13 .3 39 12.5 212
12.1-2,25t5l(0-14) 63 3,q,25 68 352 73 233 37-5 ,0!
i 4o .4 667 38-115-19 23 11.o 23 11 .6 18 10,4 54 8.7
It 46126
14.7 188
10 .72024 19 9.0 15 7.7 17 9 .9 53 8.5
22
14 4.5 140
8 .025-29 28 13.4 9.3 52 8.4 15
6 .2 23 7.4 146
8.3SC-34 18 8.6 114
87.2 16
59
.
.38
35 5 .6 1 4
5 .8 13 6.355559 10 . 4 .8 11 5.7 9 5 .2 53 8.5 .18
7 .5 14 4.5 11(5) 6.640544 6 2.9 7 3 .6 ,
8 4.7 23 3 .7 5
2 .1 13 62
3.545-49 10 4.8 9 4.6 7 4.1 32 5 .2 14
5 .8 20 16."24 92
5 .350-54 7 3.3 5 2 .6 2 1.2 21 3 .4 10
4 .2 13 5 .8 63
3 .61tot51 (15554) 121 3.0•x. 52 . ; 87 50 .6 323 52 , o 172
50 6 61 51 .6 6
52 . 355-59 8 3.8 6 3 .1 8 4.7
223 .5 3
1 .2 18 5.8 65
3 .760-64 6 2.9 11 2 1 .2 22 6
22
.
.14 5 1.6 3 .0
65-69 7 3.3 25I
.
.o7
2 2 1432
.
. 35
5 1 31
1.870-74 2 1.0 4 2 .1 0 5 .8 1
.5 1 .3 .775 A over 2' 1.0 1 .5 0 2 .3 0 o 5
.3Srb-ttal 2 12 o 2 65 7.0 .5 1.5
6 .2 25 8.0
TOTAL 209 99.9 194 IMP .
172 100.0 621 99 .9 241
100.0 312 100.1 1749
99 .9
Source : Bureau Muong, Vienticne .
alai These villages ere located outside the immediate area of Vientiane to .They are southwest of Vona Viong between the Luang Prabang road and th eMckongRiver.

TABLE 4 3
AGE DISTRIBUTION, SELECTED LAO ADD THAI VILLAGES COMPARED :BAVG CHAR A7D KU DA .-u, THAILAND ; EX% PHA ISAO A ED SIX OTHER
lAO VILLAGES Li T 2E DISTRICT OP VIERTIANE, LAO S
}Age GroupIn Years
Ku Daeng Bang Chan
Total . Percent
Ban Pea KhaoVillages in
Muong Vientiane
Total Percent Total Percent Total Percent
0 - 4 123 14 .6 163 10 76 19 247 14 . 15 - 9 Go 7 .1 209 13 51 12 .7 208 11 . 910 - 14sub-total
78I
9. 331 .0
2E579
la35
38i65
~ Sa 212-af
12 . 1313 . 1
I 15 - 19 91 10.8 193 12 35 8.7 188 10 . 720 - 24 liI 13 .2 17o 11 34 8.5 140 8 .o25 - 29 73 8 .7 115 7 44 11 .0 146 8 . 31 1 30 ° 34 57 6 .8 96 6 21 5 .x.7. 110 6. 335 - 39 31 3 .7 95 6 17 4 .0 1 115 6 .64o - 44 39 4 .6 82 5 18 4 .6 .7 62 3 .545 - 49 6o 7 .1 78 5 19 4.5 92 5 . 350 - 54 41 4 .9 5 9 4 17 4 .0 ,1 63 3 .6sub-total 503 59.0 55 2o5 507D g1~T 52 . 3
55 - 59 28 3-3 50 3 20 5 65 3 . 760 - 64 214
3 .222
2 l0 2.5 52 3 . 065 - 69 1 .7 1 1 .3 31 1 . 870 - 74 6 0.9 16 1 0 0 13 . 775 - 79 / 3 0 .4 16 2 1 -3sub-total 77 93 1T+ . 9 32 8.1 166 9.5
total 842 1.00.1 1608 10t 402 100 . 3 1,749 99.9
Sources : Kingsbill : 431, Sharp: 27, Ayabe : 90, and the Lao government .
Note : Bang Chan is located near Bangkok, Ku Daeng in the vicinity of Chier .g Mai andBan Pica Khao is near Vientiane . The six Lao villages from the District ofVientiane are located north of Vientiane town between the Luang Prabang Roa dand the Mekong River .
TABLE 43A
CHfl SE POPULATION OF XIET'G K OUANG PROVINC EBY AGE AM SEX
1959
Xieng Khouang Thong Savanh
Lac Hong
lac Bouat
Muong Kam
Age Group
H F Total H F Total H F Total U F Total M F Total
over 60 yrs 13 15 28
1 3
4
5
9
14
-- ' 1
1
8 1
920-60 yrs 198 160 358 57 57
114 68 73 141
31 16
47 48 36
8 4under 20
195 168 363 63 36
99 70 56 126
35 23
58 46 35
81
Totals
406 343
121 96
143 138
66 4o
102 72749
217
281
106
17 4
Grand Total No . % No .
over 60
56
3 .7
Grand Total ,20-60
744
48 .7
Male
838 54. 9under 20
727
47 .6Grand Total ,Female
689 45. 1
1527 100.0
Total
1527 100. 0
Source : Chinese community records .
-34 -

Tnnc 44
DISTRIBUTION OF T$3 POFUTATI03 73T AGE AND SEXBAN PEA 31!AO, VIE TIA
ASe Groups Pules Females Totalof Total
Pozilation
0- 36 40 76 195-9 26 25 51 12 .710-14 22 16 s:.-Y37 9.515-19 15 20 35 8 . 720-24 8 26 34* 8 . 525-29 24 20 44 X310.130-34 12 9 2135-39 11 6
74o-44 6 12 18 4 . 545-49 6 13 19~rM 75 0-54 13 4 17 1,-4 1'1 . '155-59 14 6 20 5 .060-64 7 3 10 2. 565-69 1 0 1 . 370-74 0 0 075 and over 1 0 1 . 3
Totals 202 200 402 100 .0
Source : Ayabe, p . 90.
---------------------------------------------------------------------------------- -
TAB12 4 5
AGE STRUCTURE OF TEE POPULATION OF LAOS AND OTHER N&TIONS ,BY M;.:HC1ka`TP.GE DISTRIBUTIONS, CO!•i[AEE D
'Country YearAllAges
Under15 15-59
60 andover
Burma 1951 100 37 .4 57 .5 5 . 1!.ninland China 1953 100 35 .9 59 .7 4 .4India 1951 100 37 .4 56 .9 5 .7Japan 1956 100 32.8 59.0 8 .2Iaosa 1943 100 38 .8 54 .3 6 .910 Lao Villegesb 1959 100 38.1 56.0 5 .9Ban Flea Ilhao C 1957 100 40.7 55 .2 4 . 1Philippines 1956 100 44 .1 51.3 4 .6Thailand 19 47 100 42 . 3 53 .5 4 . 2Ycxico 1950 100 41.7 52.7 5 . 6France 1956 100 24 .4 58.7 16 . 9United States 1957 100 30.4 56.9 12.7
Source: Economic Bulletin for Asia and the Far Laster Vol . X, No . 1, p . 12.
aPietrantoni : 1953, 37.bYientiane District Office (Bureau Nuong) .CAyabe : 1958, 90 .
As
- 35 -

TABLE46
CRUDE BIRTH RA S A tACS AND MLR WORLD ARMS, COMMIES, 1954-56
Country
Estimated orP.oo onably AccurateRegistered Rate s
ECAFE region
BurmaCambodiaChina : Mainland
TaiwanIndiaIndonesiaJapanLaosPhilippinesThailandViet Nam
4447374540-434319 .2464 947I+3
Latin America
Mexico
46 . 5
Economically developed countries
France
18 .6United States
24 .8
Source : Economic Bulletin for Asia and the Far Fast, Vol . X, No. 1, p . 6.Note : Sources of data in Tables 46-48 unknown, prcbably based on estimates .
TABLE4 7
CRUDE DEATH AND INFANT MORTALITY RATES, LOS & OTHER WORLD AIMS, COMPARED, 195+-56
Estimated or ReasonablyAccurate_Repistered Rate s
CountryCrude Death
RateInfant Mortality
Rate
ECAFE region
Burma 29 221Cambodia 23 179China :
Mainland 17 ---Taiwan 10 78
India 27-31 200Indonesia 2# 192Japan 8 .0 x+1 . 7Taos 28 221Philippines 21 166Thailand 23 179Viet-Tam 22
Latin America
Mexico 13.0 125
Economically developed countrie s
France 12.2 38.5United States 9.3 26 .3
Source : Economic Bulletin for Ap ia and the Far East, Vol . X, No. 1, p . 6 . 3 G-36 -

I1 8
.
I: ECTiMCY OF LIFE AT BIRTH FOR BCUI 2=3,
IlOS A= Ci _ .:^R WORLD AREAS, CC:I A , 1955
Country
Life E:pactancy in Years
E R .reaian
Burma
around
3 4
Cambodia
. around Qaround
5 5
around
3 5
around
39
around
66
Laos
around
34
Philippines
around
44
Thailand
around
4o
Economically developed countrie s
France
around
68
United States
around
71
Source : Economic Bulletin for Asia and the Far East, Vol . X, No . 1, p . 6 0
China: Taiwan
India
Indonesia
Japan
-37 -

TABLE49
POPULATION ESTIMATES FOR DISTRICT CEcS, 1958
District CenterPopulation Estimate in .000Minimum
M ximum
r A! G FR' ]3AA"{3
210
280.
Luang Pr .hang*
7
15aIt-tong Hgo1
1
2 . 5P:uon<g Sai
1
3Pak Tha
1 .5
2. 5Z•`uong noun
1 .5
2. 5tau Eat
1
1 .5i-tuong iaosy
1 1 .5Total
100
23,5005t or Population in District Centers
6 .7
10 . 2
=IA=
Total%
180
250Vientiane*
45
80bPaksane
2
3Phone Hang
1 .5
2 . 5Sar_akhaxa
1 .5
2 . 5Ban Keun
1 .5
2 . 5Vang Vieng
1 1 . 552,500
90,500
.29 .2
36 .2
2_Avt .
T
Total%
UL .M-.. =ABE
Total%
270
35 0Savaunakhet*
7
10nag Kok
1 .5
2 . 5Dong Hen
1 .5
2Song Done
1 .5
2 .5Lahanam
2
3Tchepone
1 1 . 5
1 i oo
21,5005.4
6 . 1
120
16oThakhek*
4
7Hinboun
1 .5
2Mahaxay
1 .5
2 . 5Nhommarath 1 1 . 5
8,000
13,0006.7
8 . 1
C1L EPASSA C
Total
170
220Pakse*
6
10Ch^mpassac
3
4Saphay
2 .5
3 .5Muong Khong
1 .5
2Pak.aong
1
1 . 5
T o00
21,0008.2
9 . 5
1ATIDPEU
6o
90Attopeu*
2 .5
39i
4 .2
3 .3
3a

POPUI TI0N E IMIT3 FOR DISTRICT =MS, 195 8(Continued)
. rPzovine District CenterPo p ulation Estimate in .000Minimum
Maximum
sAfiAvAus.r . 160 200Saravane* 2 2 . 5Thateng 1 1 . 5FOaongsedone 1 .5 2. 5
Total ,+5 g7YEp% 2.8 3. 3
. EAYABOU'a
Total%
Sayaboury*Paklay
14o
1802
31 .5
2 . 5
3,500
5,5002 .5
3 .1
ILA_l T.A
65
10 0Elam ThaI
1 .5
3EToueI Sat
1
2F-uo2]g Sing
1
23,540
7,000 .5 .4
7
Total%
XIEIM KEOt?!42 G.
Total
130
170Xiang K#orretg*
3
4an Dane
1 .5
2
i~500
6,0003.5 3 .5
PHOI:G SAID' 70 100Pha]ag salt'# 2 3Soon Meua 2 3Outay 1 .5 2
Total 5, 500 g-,-&T7 .9
8
SAM REM
Total%
Sam ]Ieua *?ucng Faun
80
110
2 .5
3 . 5
1 .5
2 . 010000 5,500
5 5
Total for all of Taos in 000
1,655
2,210
row
Total Populatio nin District Centers
128,500
7 .8
. High
213,000
9.6
8A 1958 census placed the population of Iasang Prahong town at 7,596 .bA 1959 census of Vientiane town lists 68,206 .
.Mote : The only district centers which can be considered urban are those whichare piovinctal capitals (*) . The population of all the others is largely 3qagricultural .
-39 -
E

TABLE50
i
FO UTATI0I ES=L'..TES )'Bid SELEUZED T OWES, =MUM(1901 - 1958 )
Town 19010 1936b 19+3b ?fie
Luang Prabang 5,900 5,400 1 ,950 11,000'Xiang Khouang 150 1,400 2,100 3,500Vientiane 2,700 15,800 23,200 68,oooSavannashet 300 4,500 5,500 8 ,500Saravane 65o - 2,350Attapen 900 2Pakse 3,400 7,300 8,000Thakhek 3,400 8,100 5,500
a?,einach :
1901, pp . 200-217 .bxietrantoni :
1957, p. 230.clot) governn nb statistics .
-------------------------------------------------------------------------------- -
Ta~I3
G 50W 1 OF TEE POPIJIAT]0U OF SEIEL U TOt7Ea Pil D PEOVI CES, COa TARED, 1943 - 195 9
Xiang Khouang 2,100 85,000 3,500 150,000 66 .7Vientiane 23,200 1226,000 68,000 215,000 193 . 1Savannnkhut 505 0 0 186,000 8,500 310,000 54 .5
Source : Pietrantoni, 1957, and Dan government statistics .
--------------------------------------------------------------------------------------- -
TABLE 5 2
ESTIMATED POPULATION IN URBAN AREAS, AROUND 1950, LADS AND OTHERWORLD AP. AS, C(OLARED
(IACALITIES OP 20,000 OR EORE INHABITANTS )
county
PercentaGe of Population in Urban Area s
Asia (ECr
region )World Tota lAfricaNorth Americ aEuropeBurmaIaos (1959) *VietnamPhilippinesIndiaThailand.Nepal
Source: ECA'E Bulletin, p. 18.
-3ased on maximum estimate for city of Vientiane, the only 'turban"area in Taos .
In reality Laos is the least urban country inall of Asia since Nepal has 10 cities of over 5,000 populatio nand Laos only 5 according to m ax imum population estimates .If minimum estimates are taken Laos can be considered 3% urban .
//b
_ 4 o -
Town
Province
Town
Province
Tama
Province
191+3 Estimated1959
Percent Increase
76 .570 . 666.7
1

e
.
TA3IE5a
PP2ITLT SIZE Ate] T$"n Tr''U%-BM OF [ . t'IT" 101'3 IN 'Xk thtS IAO VILU.G(v r r G vi G DISTHICT )
"aerations Bo . of Family f'.etsbera Total1 2 3 4 5 6 7 8
Ban Rho
.
I
2 2II 1 5 2 1 7 5 1 22
III 1 125
an NA. Tana
ITI 2 3 1 1 7
ITT 1 1 110
Ban Sot= Mai
4I 4TI 7 1 1 9
IIT 1 2 3
Source: K. Nate., "Ethnic Groups in the Valley of the Nam Song and Nam Lik . "
--------------------------------------------------------------------------------- -
TABLE 5 4
HOUSEHOLD SIZE OF BLACK .I`P_I VILLAGES ,I'2A I A DISTRICT AID PROVIECE, 1958
Village Household Tnhabitants
AverageHousehol dSize
Tasseng Tong OnTong Om 47 307 6 . 5flan Phae 24 167 7 . 0Pa Hong 26 201 7 .7Tong Di 41 295 7 .2Pa Pouak 30 165 5 . 5Ban Palane 17 163 9 . 6Tong Chay Tay 20 138 f9 G •Tong Chay Eieua 62 438 7 . 1ran Chang 30 215 7 . 2Nam Ugem 90 596 6 . 2Tong R ng 31 101 3 . 3Houa Koua 29 156
Total 447 2,9 h22
Tasseng Ban PoungBan Pa.ssak 34 238 7Ban Poung 99 617 6 .2Ban Na Noy 12 71 5 .9Ban Na Lau 13 _ _ 83 6 .4
Total 14 1,009 ~. +
Village destroyed by fire in 1958.
-41 -
Source :
Duclos

TABLE 55
ROU3=0ID STLE IS THE LAO VILLAGE OP BAN PHA MO, YIDS FROM=
i uii• of iY:Bbers in Household
Total 1 2 _3 k 5 6 7 8 9
1
10
13
21 . . .
--.- 18
6
1
1
88
Percent
1 .1 11.4 14.8 23.9 19 .3 20 .5 6.8 1.1 1 .1
100 . 0
Source : Ays:be {1959 : Table 4f .-------------------------------------------------------------------------------------------- -
'EaFliaLW3 0T0 z7a 13 T; `,{-0 VZI M3 OF
3cAI, OU =IIn 'FMM V :'3, VT .:iTIAI MOVIE=
=%whor of I :a hars in Eoeir hold
Total : 1: :3:4:5 ' 6 F_~~ : 8
9 : 10 : to
: ~ 3 :1# :15 :16 :17 :18
No, ofcases 0 q:2 : 2
5 3 2 l: 3 : I : q : 2
1 : 0 : q: 0: 1 : 27
Percent
q: 0
:7 .4 :7.4 :1?1•.8:2.5 :11. .1.7 .4 :3.7 x: 3.7 : 0 :7 .4+ :3.7 : 0 : 0 e 0 :3 .7 :
99 .0
Source : Iwata, 1959.
------------------------------------------------------------------------------------------- -
HOUSEHOLD SIZE IN E'd3TIANP TOWN
Number of Persons
Number
of
Total Number o fPer Household Gases Persons in Each Cateyom
16
1
1 612
1
1 211
3
3 3zo
2
2 09
5
458
22
1767
24
1686
27
1625
-
TOTAL
100
707
Average Household Size - 7 .07
Source : Lao Statistical Bureau Cost of Living Survey Sample .
Dumber ofcases

x{luWr io7A SIZE III
TONS ! 3 i12E~r 3 F OMCE, cQ P.1RED
C. 1959 J
• actions of
of
# of
Averag.a House-Vientiane Town
Souses
Households
Popu'la 1oat
hold Size
si',hay 832 976 4,863 5 . 7
Sit'n - Neua 1,642 2,045 io,8i° 5 . 3
4'at =Thanh 3r Z..
a 5,5k9
- 29,687 . 5 .4-That i%hao 2,25g 11,63 5 . 2Eoag lane 1,315 1;622 1,924 4 . 9That Luang 6 -1 647 3,28+ 5 . 1
Total 9,669 13,097 68,206 .5 . 2
Sample Villages inVientiane Distric t
Ban Nnkae a 43 209 4 . 9
Nang Py a 44 194 4 . 4
Don ?•:akkai 27 172 6 . 4
Don Noon 128 . 621 4 . 9
)(lends 42 241 5 .7
Xoke 7[ai 61 312 5 . 1
Total 345 1,749 . 5 . 1
kha Ifhaa 88 x+02 4 .6
Source : Lao Bureau of Statistics .Note : There were 118,778 in Vientiane and its surrounding are a
[ an rural areas number of houses and number of households are virtually synonymous .
bBan Pha ihao data from Ayabe, 1959 .
Y 3

7Ani 8 5$
ETHNIC COEPOSXTXCN OF THE POPULATION OF SELECTED PROVINCIAL CAPITALS IN LAOS1943 AND 1959 =PARED
12,400
53
900
4
330
1 .5
23,200
: 68,000
23,200
15,000
22.1
1,400
28
480
10
70
1
4,950
s 11,000
2,683
1,800d
16.4_
6, 904
85
300
4
100
I
8,100
s
Sr 500
625
1,500
27. 2
4 0 000
77 450
8 ,0-
200
40-3 . G 5, 500
s
8,500
5,011
3,500
41.1
P .,..~.~a
1,000
JS 3 4,500
62
I, 700
23
100
1
7,300
8,000
13,135
7,500
93 .7(Ch:sapasaac)s
tt
_
Xiang Khouang 240 11 1 .500 72 _300 15 60 3 2,100 s 3.,L500 .521 1 .300 37.1
TOTAL
15,460 30
30,700
60
4,130
8
860
2
51,150
104,500
46,175 0
30,600 0
29.3s s
Somme : Piatrantonis 1957, 230, and the Lao Ministry of the Interior .
°Europeans, Indians, etc .
bineludee rural and urban Vientianese and Chinese and Indians who are not Lao citizens . A number of those who form part of the first twoethnic groups were born in Laos and so do not figure in this total .
°The figure for the Chinese probably includes some who work rn gardeners in surrounding rural arees .din 1954 another source gives 468 as the number of Chinese in Luang Prebang Province (Table 26) .°Official figures on the Chinese for 1953 (10,794) are given in Table 59 . Despite the recent grorth and possible underestimates in officia l
e- statistics it appears possible that the 1959 figures may be too high, since in 1953 there were 26,721 1foroignera e in Laos (Table 60) . Thenumber of native born Chinese is not known, but if the 19,454 increase of foreigners from 1953 to 1959 were almost all Chinese the 1959 Chines$population appears possible .
Town :Lao 'r Leo
Vientiane s 9,570 41 . 5_
Luang Prabung s 3,000 61t
a ^:c]irJs(,'he mouane)
=
800 10
Snvannakhet
$
s
850 16
_. ., s 194 1959
s
s
Eatimateu1
s
%
Estimated : Estimated Foreign
UrbanViet-
Viet-
w
Total s Total
Asia s
Chinesenamesa
urns
Chinese Chines
Other .
Other-
Pon
Poo .
n 1'ror b
P . •. . c
no


