
WELCOME!
Nipissing District Childrens Services Planning Table
Planning Day
Oct. 18, 2011
Presented by Dave Plumstead

THIS PRESENTATION:
1)Population Pyramids and Nipissing’s Boom, Bust & Echo
2) Why the fee subsidy pressure?

0
5
10
15
20
25
30
35
40
45
50
55
60
65
70
75
80
85
90+
0100200300400500600700800900 0 100 200 300 400 500 600 700 800 900
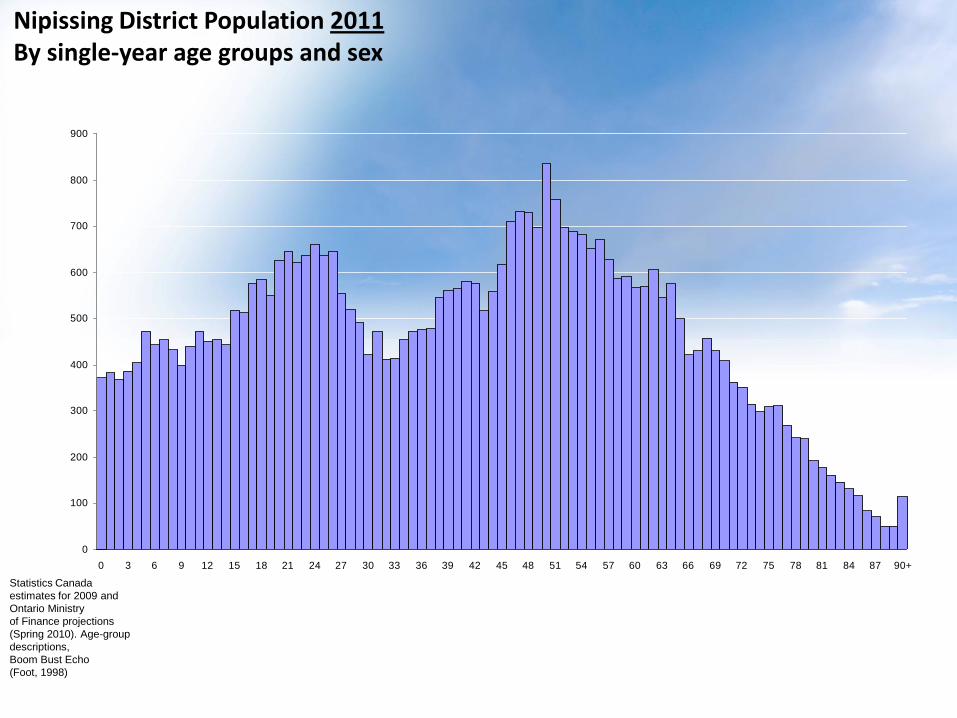
Nipissing District Population 2011 By single-year age groups and sex
# people
Statistics Canada
estimates for 2009 and
Ontario Ministry
of Finance projections
(Spring 2010). Age-group
descriptions,
Boom Bust Echo
(Foot, 1998)
Nipissing District Population 2011 By single-year age groups and sex
Statistics Canada
estimates for 2009 and
Ontario Ministry
of Finance projections
(Spring 2010). Age-group
descriptions,
Boom Bust Echo
(Foot, 1998)
0
100
200
300
400
500
600
700
800
900
0 3 6 9 12 15 18 21 24 27 30 33 36 39 42 45 48 51 54 57 60 63 66 69 72 75 78 81 84 87 90+
0
5
10
15
20
25
30
35
40
45
50
55
60
65
70
75
80
85
90+
0100200300400500600700800900 0 100 200 300 400 500 600 700 800 900
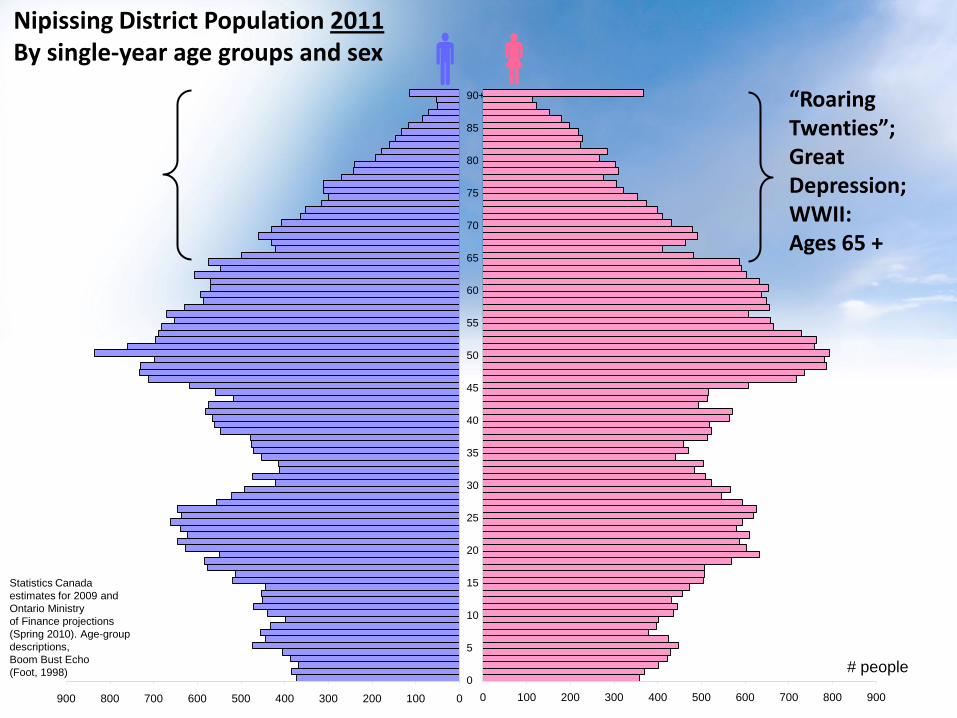
Nipissing District Population 2011 By single-year age groups and sex
“Roaring Twenties”; Great Depression; WWII: Ages 65 +
# people
Statistics Canada
estimates for 2009 and
Ontario Ministry
of Finance projections
(Spring 2010). Age-group
descriptions,
Boom Bust Echo
(Foot, 1998)

0
5
10
15
20
25
30
35
40
45
50
55
60
65
70
75
80
85
90+
0100200300400500600700800900 0 100 200 300 400 500 600 700 800 900
Nipissing District Population 2011 By single-year age groups and sex
Baby Boom: ages 45-64
“Roaring Twenties”; Great Depression; WWII: Ages 65 +
# people
Statistics Canada
estimates for 2009 and
Ontario Ministry
of Finance projections
(Spring 2010). Age-group
descriptions,
Boom Bust Echo
(Foot, 1998)
0
5
10
15
20
25
30
35
40
45
50
55
60
65
70
75
80
85
90+
0100200300400500600700800900 0 100 200 300 400 500 600 700 800 900
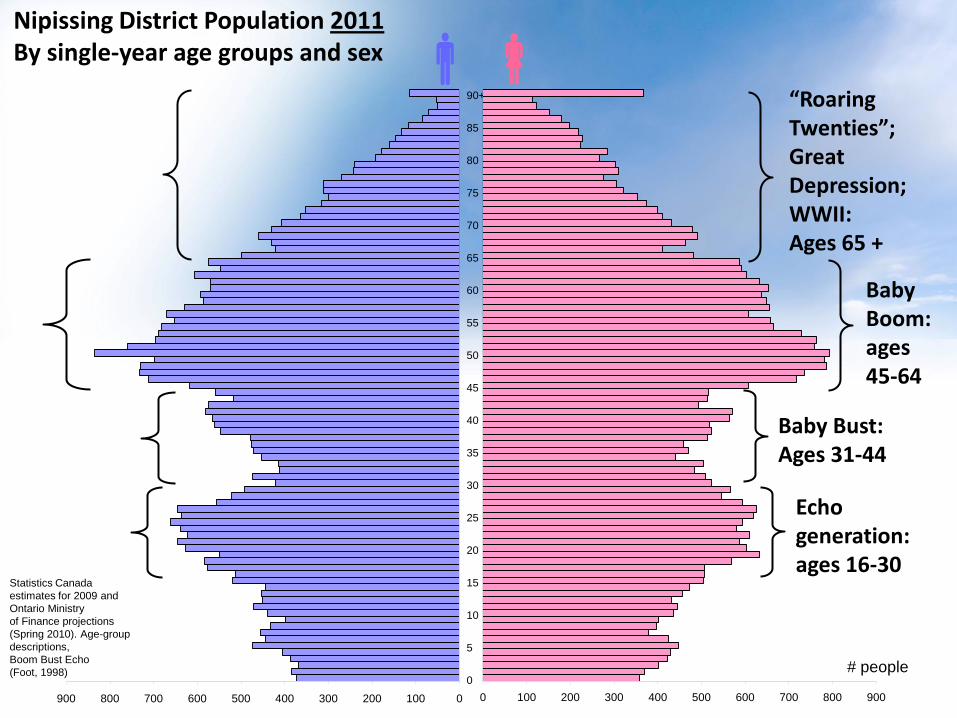
Nipissing District Population 2011 By single-year age groups and sex
Baby Boom: ages 45-64
Baby Bust: Ages 31-44
Echo generation: ages 16-30
“Roaring Twenties”; Great Depression; WWII: Ages 65 +
# people
Statistics Canada
estimates for 2009 and
Ontario Ministry
of Finance projections
(Spring 2010). Age-group
descriptions,
Boom Bust Echo
(Foot, 1998)
0
5
10
15
20
25
30
35
40
45
50
55
60
65
70
75
80
85
90+
0100200300400500600700800900 0 100 200 300 400 500 600 700 800 900
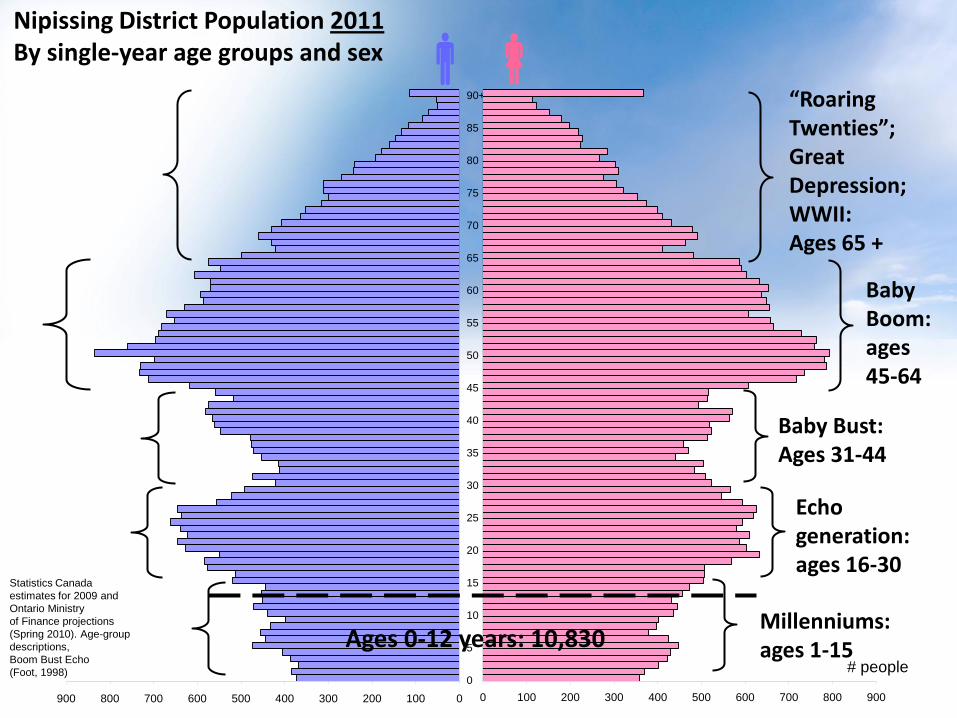
Nipissing District Population 2011 By single-year age groups and sex
Baby Boom: ages 45-64
Baby Bust: Ages 31-44
Echo generation: ages 16-30
Millenniums: ages 1-15
“Roaring Twenties”; Great Depression; WWII: Ages 65 +
# people
Statistics Canada
estimates for 2009 and
Ontario Ministry
of Finance projections
(Spring 2010). Age-group
descriptions,
Boom Bust Echo
(Foot, 1998)
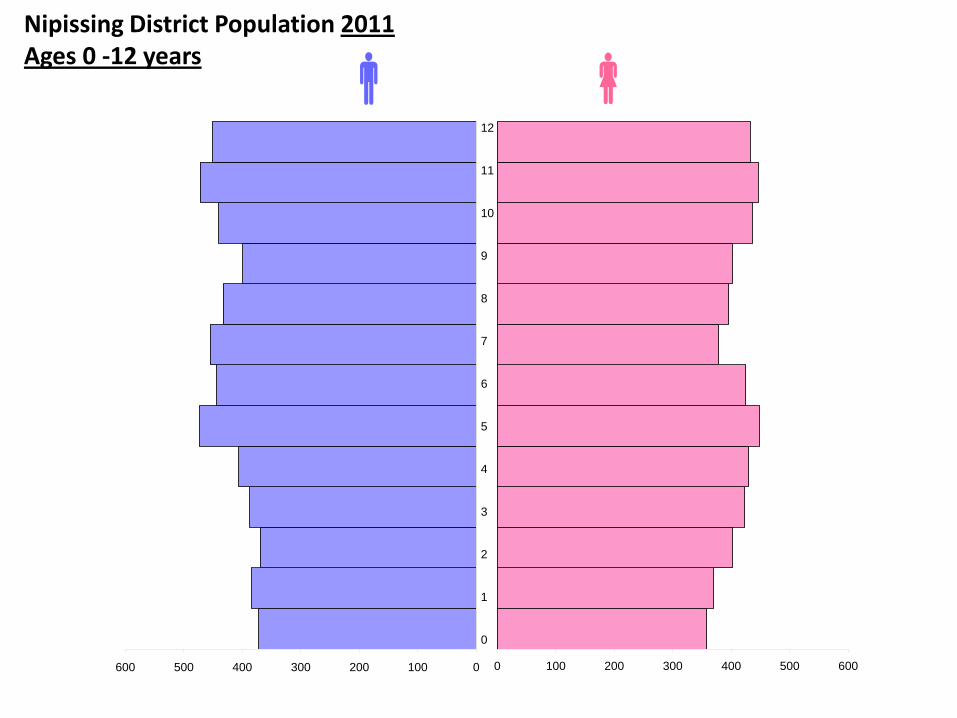
Ages 0-12 years: 10,830

0
5
10
15
20
25
30
35
40
45
50
55
60
65
70
75
80
85
90+
0100200300400500600700800900 0 100 200 300 400 500 600 700 800 900
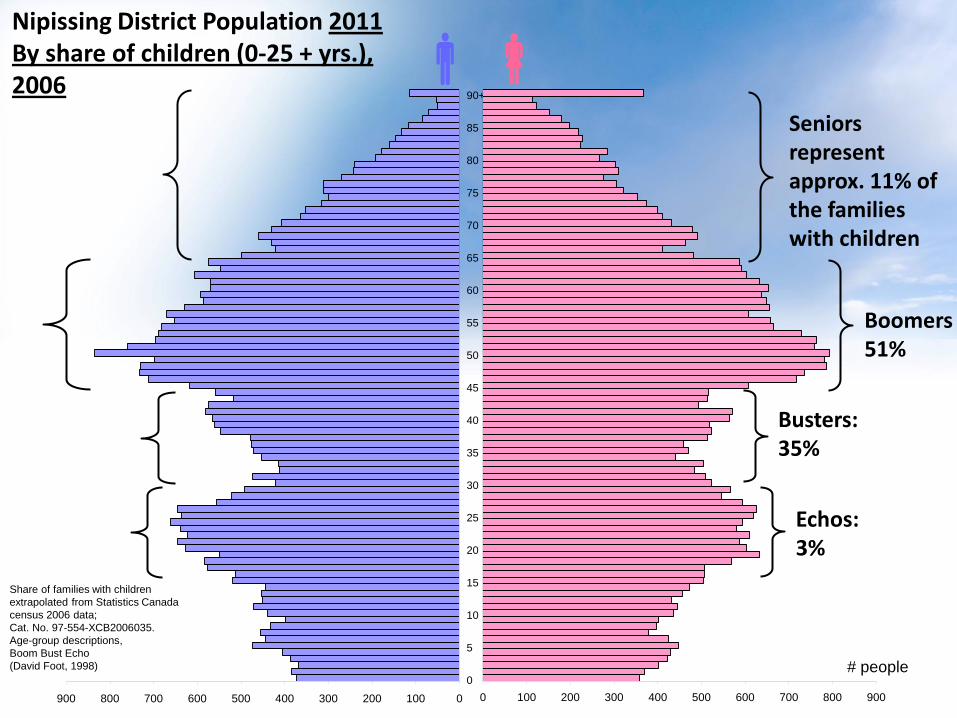
Boomers 51%
Seniors represent approx. 11% of the families with children
# people
Share of families with children
extrapolated from Statistics Canada
census 2006 data;
Cat. No. 97-554-XCB2006035.
Age-group descriptions,
Boom Bust Echo
(David Foot, 1998)
Nipissing District Population 2011 By share of children (0-25 + yrs.), 2006
0
5
10
15
20
25
30
35
40
45
50
55
60
65
70
75
80
85
90+
0100200300400500600700800900 0 100 200 300 400 500 600 700 800 900
Boomers 51%
Busters: 35%
Echos: 3%
Seniors represent approx. 11% of the families with children
# people
Share of families with children
extrapolated from Statistics Canada
census 2006 data;
Cat. No. 97-554-XCB2006035.
Age-group descriptions,
Boom Bust Echo
(David Foot, 1998)
Nipissing District Population 2011 By share of children (0-25 + yrs.), 2006
NDCSPT target children
and their parents
0
100
200
300
400
500
600
700
800
900
0
5
10
15
20
25
30
35
40
45
50
55
60
65
70
75
80
85
90+
2012 2013 2014 2015 2016 2017 2018 2019 2020 2021 2022 2023 2024
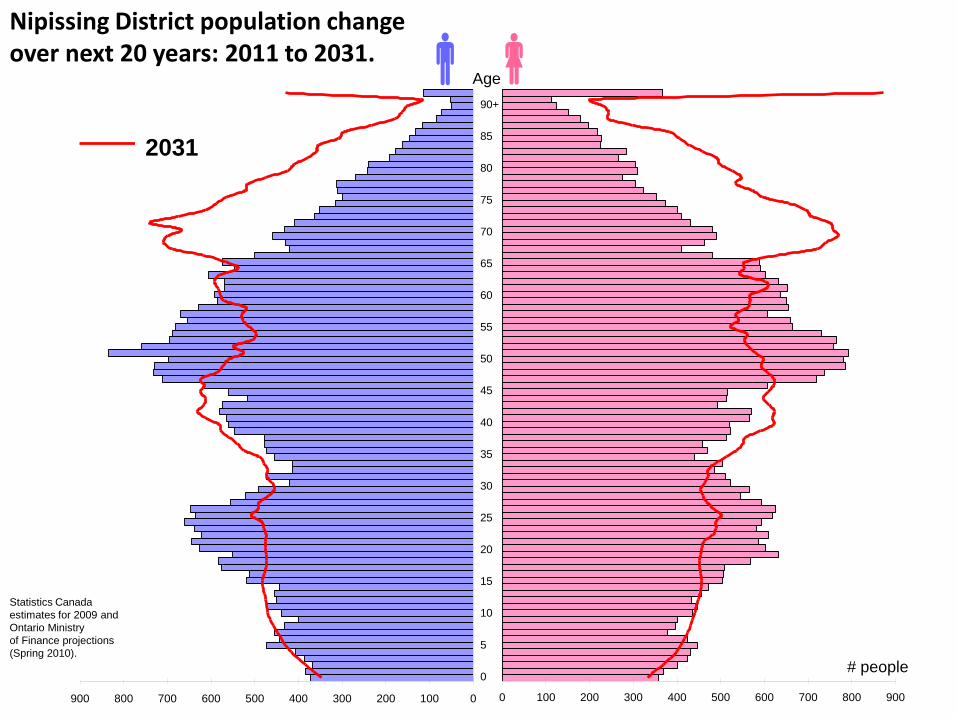
Nipissing District population change over next 20 years: 2011 to 2031.
2025 2026
# people
2027 2028 2029 2030
0100200300400500600700800900 0 100 200 300 400 500 600 700 800 900
2031
Age
# people
Statistics Canada
estimates for 2009 and
Ontario Ministry
of Finance projections
(Spring 2010).
0
100
200
300
400
500
600
700
800
900
0
5
10
15
20
25
30
35
40
45
50
55
60
65
70
75
80
85
90+
0100200300400500600700800900 0 100 200 300 400 500 600 700 800 900
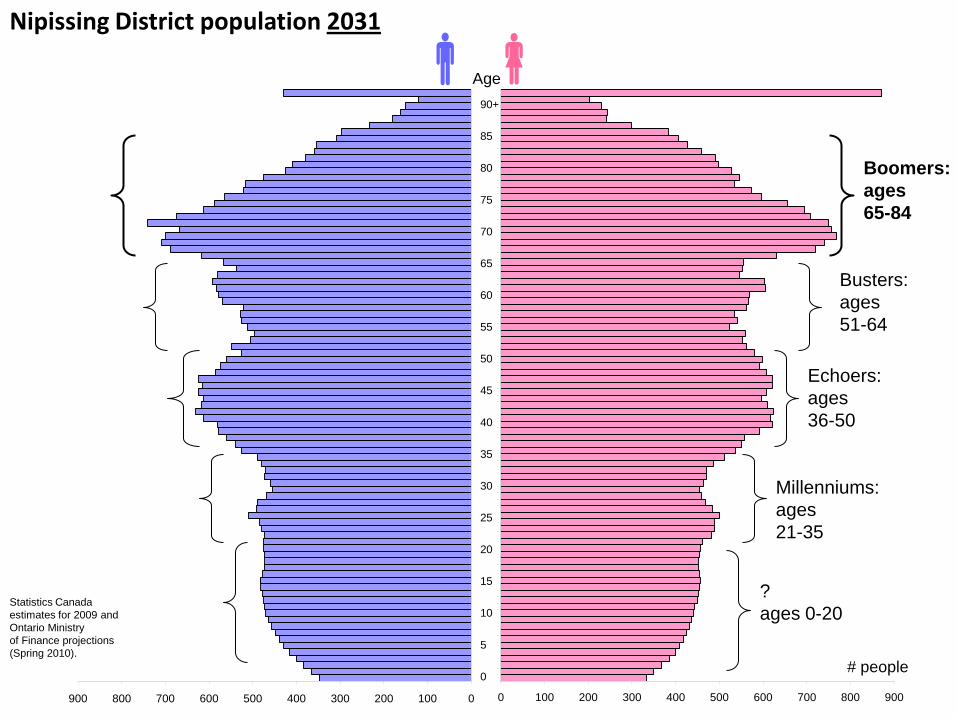
Nipissing District population 2031
Boomers:
ages
65-84
Busters:
ages
51-64
Echoers:
ages
36-50
Age
Millenniums:
ages
21-35
?
ages 0-20
# people
Statistics Canada
estimates for 2009 and
Ontario Ministry
of Finance projections
(Spring 2010).

0
100
200
300
400
500
600
700
800
900
0
5
10
15
20
25
30
35
40
45
50
55
60
65
70
75
80
85
90+
0100200300400500600700800900 0 100 200 300 400 500 600 700 800 900
Nipissing District population 2031
Boomers:
ages
65-84
Busters:
ages
51-64
Echoers:
ages
36-50
Age
Millenniums:
ages
21-35
?
ages 0-20
# people
Senior citizens 75%
Core workforce 8%
Youth 19%
Children = same Statistics Canada
estimates for 2009 and
Ontario Ministry
of Finance projections
(Spring 2010).
0
1
2
3
4
5
6
7
8
9
10
11
12
0100200300400500600 0 100 200 300 400 500 600
Nipissing District Population 2011 Ages 0 -12 years

0
1
2
3
4
5
6
7
8
9
10
11
12
2011 2012 2013 2014 2015 2016 2017 2018 2019 2020 2021
0100200300400500600 0 100 200 300 400 500 600
2022
Nipissing District population ages 0-12, 2011 -2022
0100200300400500 0 100 200 300 400 500
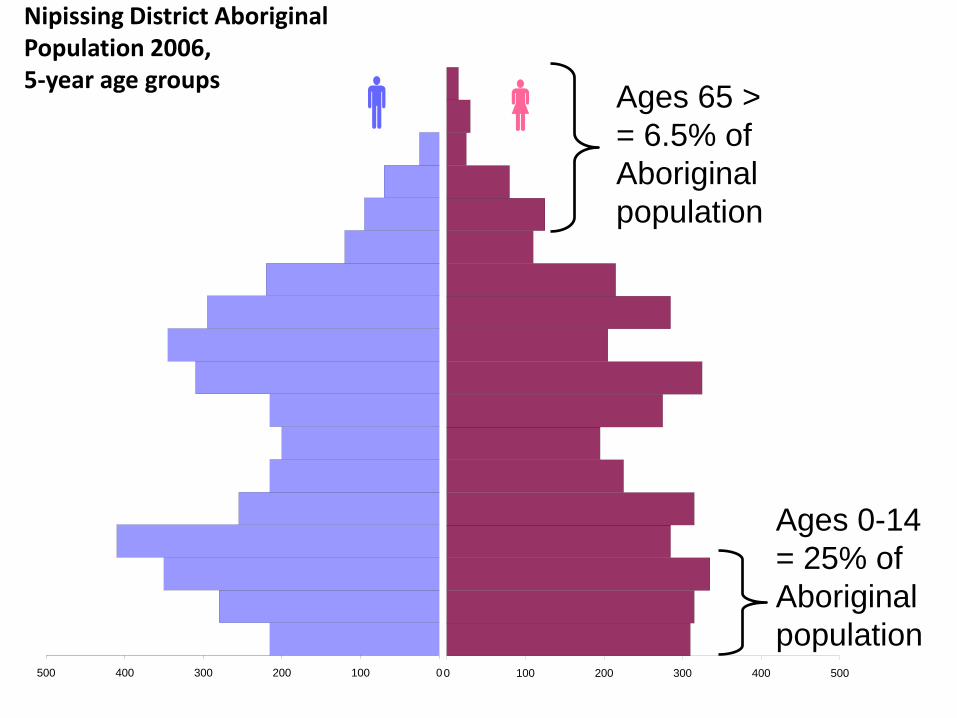
Nipissing District Aboriginal Population 2006, 5-year age groups
Ages 0-14
= 25% of
Aboriginal
population
Ages 65 >
= 6.5% of
Aboriginal
population
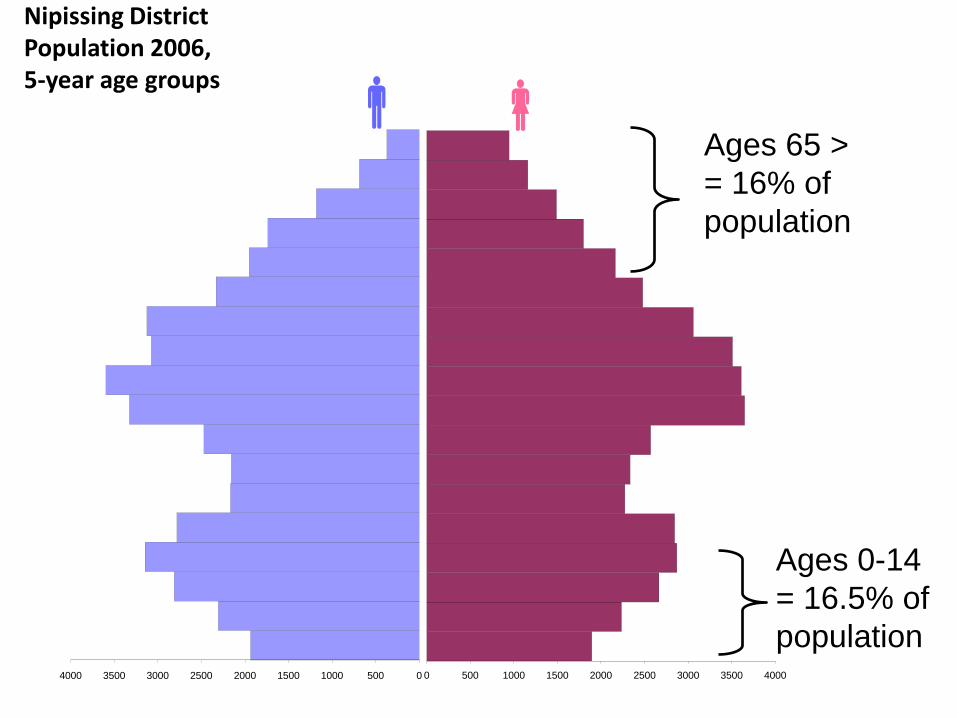
Nipissing District Population 2006, 5-year age groups
05001000150020002500300035004000 0 500 1000 1500 2000 2500 3000 3500 4000
Ages 0-14
= 16.5% of
population
Ages 65 >
= 16% of
population
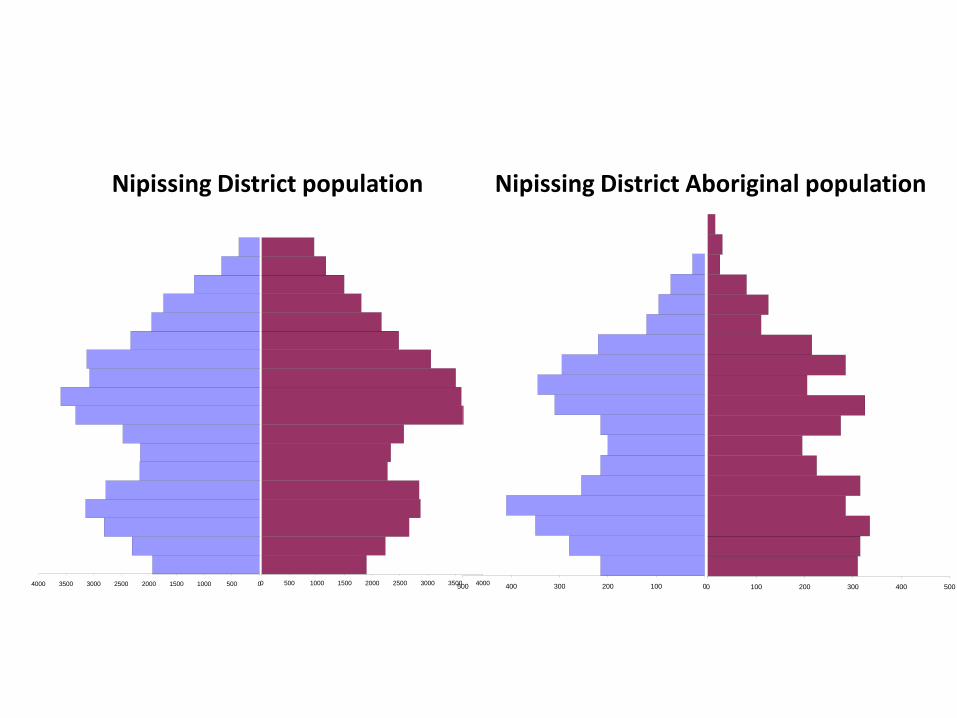
Nipissing District population
05001000150020002500300035004000 0 500 1000 1500 2000 2500 3000 3500 40000100200300400500 0 100 200 300 400 500
Nipissing District Aboriginal population

Questions?

NEXT PART OF PRESENTATION:
Co-presenter: Lynn Demore-Pitre
Why the fee subsidy pressure?
Q:
Let’s start by asking, what are the fee subsidy trends?

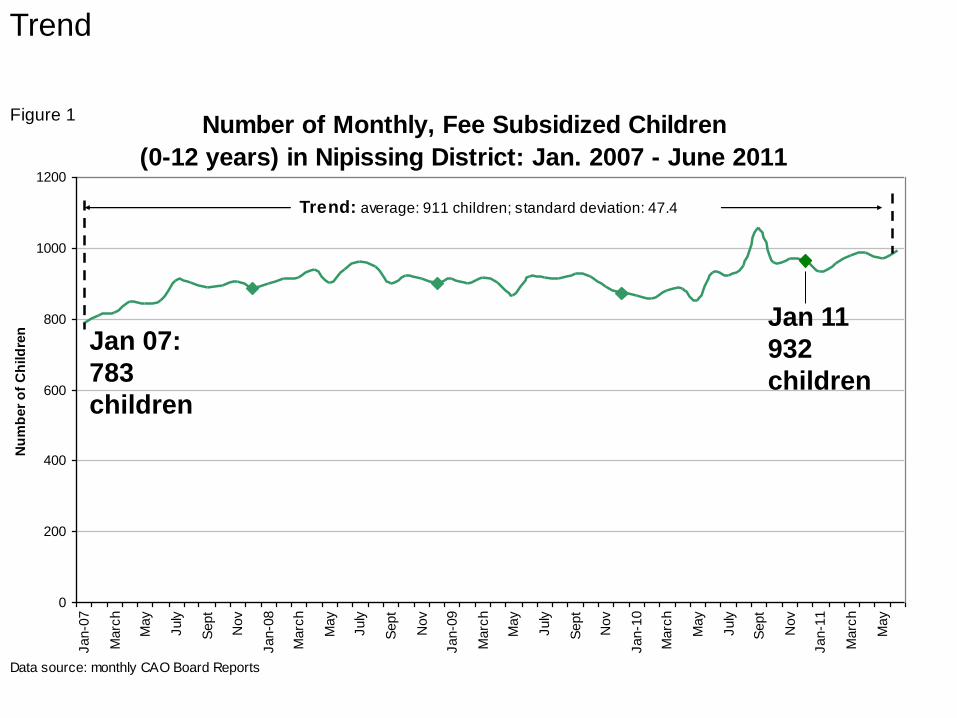
The long-term underlying movement (trend) in fee subsidy has been one of increase
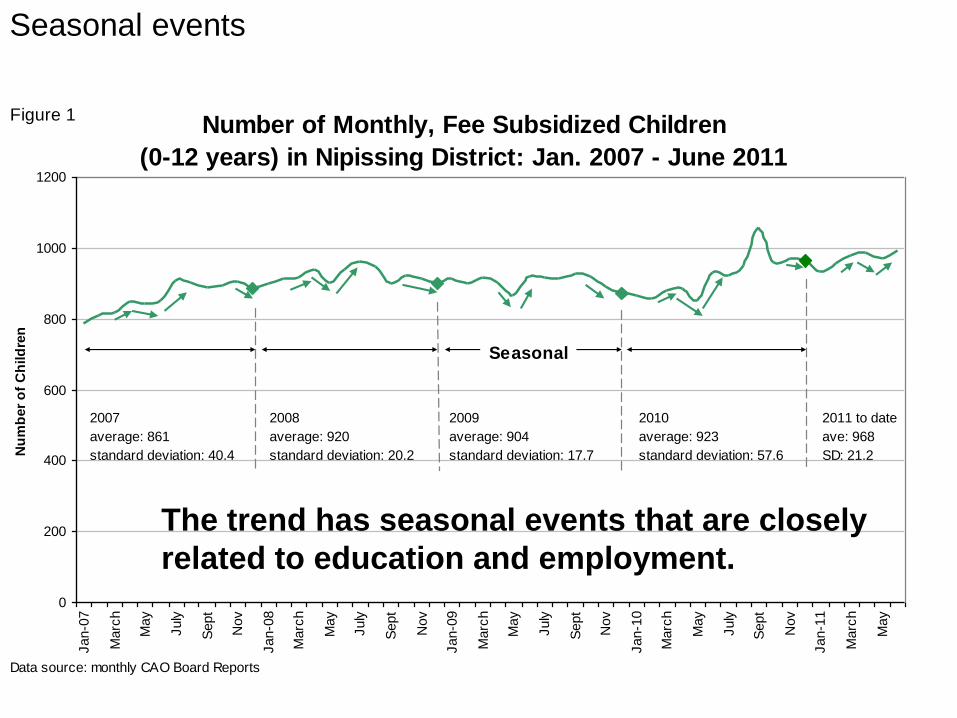
Within the fee subsidy trend there are seasonal events that are closely related to education and employment
There are also randomly occurring events such as government policy and program changes which have had an impact on the trend
A:
Number of Monthly, Fee Subsidized Children
(0-12 years) in Nipissing District: Jan. 2007 - June 2011
0
200
400
600
800
1000
1200
Jan-0
7
Marc
h
May
July
Sept
Nov
Jan-0
8
Marc
h
May
July
Sept
Nov
Jan-0
9
Marc
h
May
July
Sept
Nov
Jan-1
0
Marc
h
May
July
Sept
Nov
Jan-1
1
Marc
h
May
Nu
mb
er
of
Ch
ild
ren
Trend: average: 911 children; standard deviation: 47.4
Figure 1
Data source: monthly CAO Board Reports
Trend
Jan 07:
783
children
Jan 11
932
children

Number of Monthly, Fee Subsidized Children
(0-12 years) in Nipissing District: Jan. 2007 - June 2011
0
200
400
600
800
1000
1200
Jan-0
7
Marc
h
May
July
Sept
Nov
Jan-0
8
Marc
h
May
July
Sept
Nov
Jan-0
9
Marc
h
May
July
Sept
Nov
Jan-1
0
Marc
h
May
July
Sept
Nov
Jan-1
1
Marc
h
May
Nu
mb
er
of
Ch
ild
ren
Trend: average: 911 children; standard deviation: 47.4
Figure 1
Data source: monthly CAO Board Reports
The long-term underlying
movement (trend) in fee subsidy
has been one of increase,
although not in a linear fashion.
Trend
Jan 07:
783
children
Jan 11
932
children

Number of Monthly, Fee Subsidized Children
(0-12 years) in Nipissing District: Jan. 2007 - June 2011
0
200
400
600
800
1000
1200
Jan-0
7
Marc
h
May
July
Sept
Nov
Jan-0
8
Marc
h
May
July
Sept
Nov
Jan-0
9
Marc
h
May
July
Sept
Nov
Jan-1
0
Marc
h
May
July
Sept
Nov
Jan-1
1
Marc
h
May
Nu
mb
er
of
Ch
ild
ren
Seasonal
2007
average: 861
standard deviation: 40.4
2008
average: 920
standard deviation: 20.2
2009
average: 904
standard deviation: 17.7
2010
average: 923
standard deviation: 57.6
2011 to date
ave: 968
SD: 21.2
Figure 1
Data source: monthly CAO Board Reports
Seasonal events
The trend has seasonal events that are closely
related to education and employment.
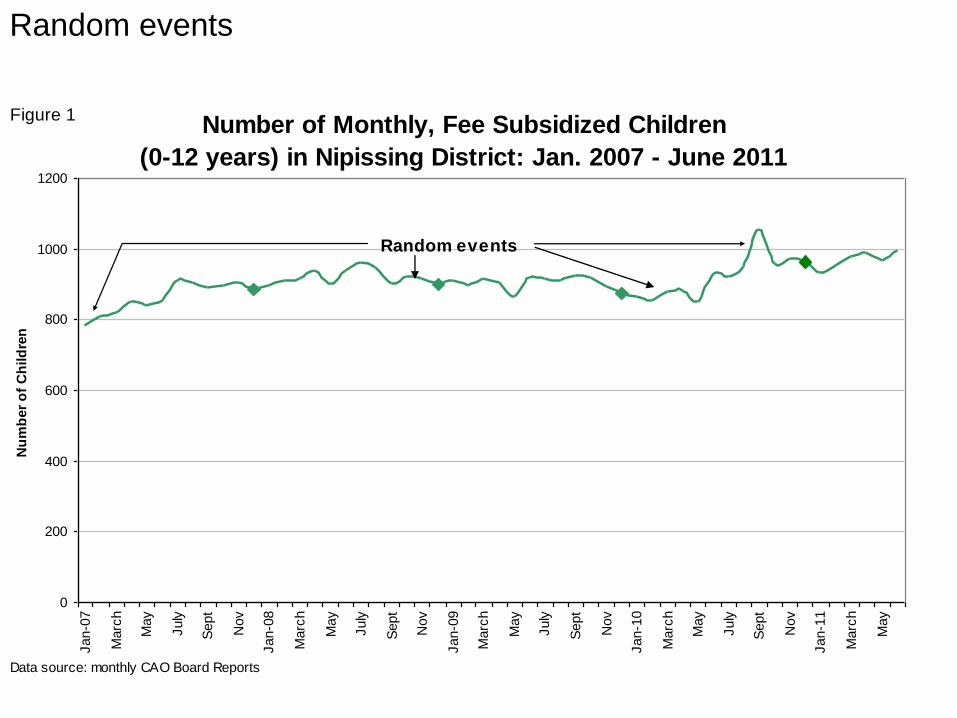
Random events
Number of Monthly, Fee Subsidized Children
(0-12 years) in Nipissing District: Jan. 2007 - June 2011
0
200
400
600
800
1000
1200
Jan-0
7
Marc
h
May
July
Sept
Nov
Jan-0
8
Marc
h
May
July
Sept
Nov
Jan-0
9
Marc
h
May
July
Sept
Nov
Jan-1
0
Marc
h
May
July
Sept
Nov
Jan-1
1
Marc
h
May
Nu
mb
er
of
Ch
ild
ren
Random events
Figure 1
Data source: monthly CAO Board Reports

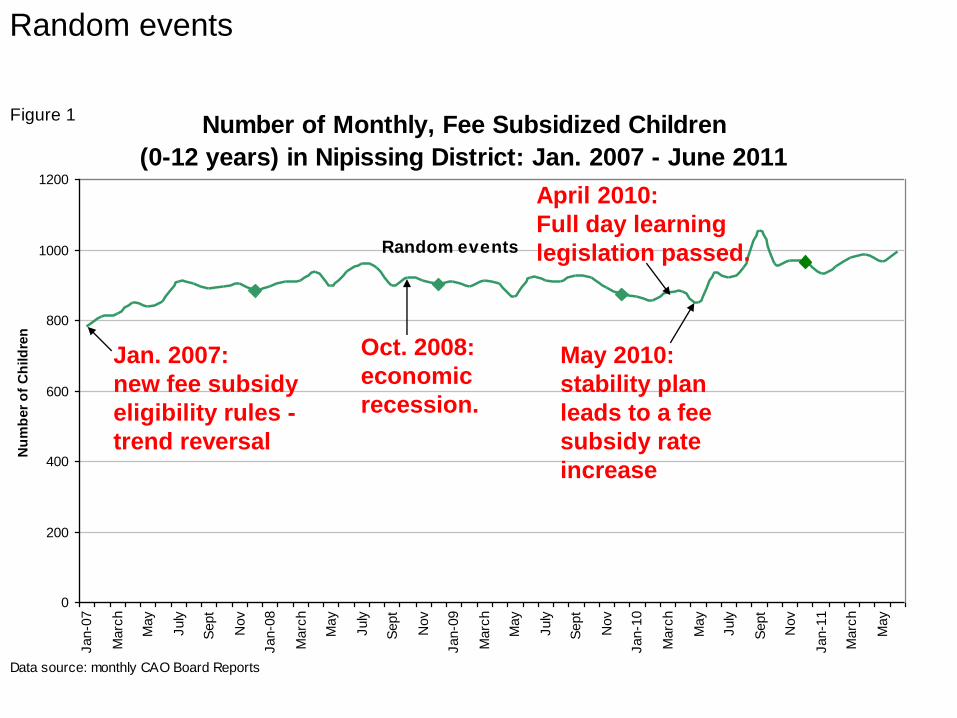
Random events
Number of Monthly, Fee Subsidized Children
(0-12 years) in Nipissing District: Jan. 2007 - June 2011
0
200
400
600
800
1000
1200
Jan-0
7
Marc
h
May
July
Sept
Nov
Jan-0
8
Marc
h
May
July
Sept
Nov
Jan-0
9
Marc
h
May
July
Sept
Nov
Jan-1
0
Marc
h
May
July
Sept
Nov
Jan-1
1
Marc
h
May
Nu
mb
er
of
Ch
ild
ren
Random events
Figure 1
Data source: monthly CAO Board Reports
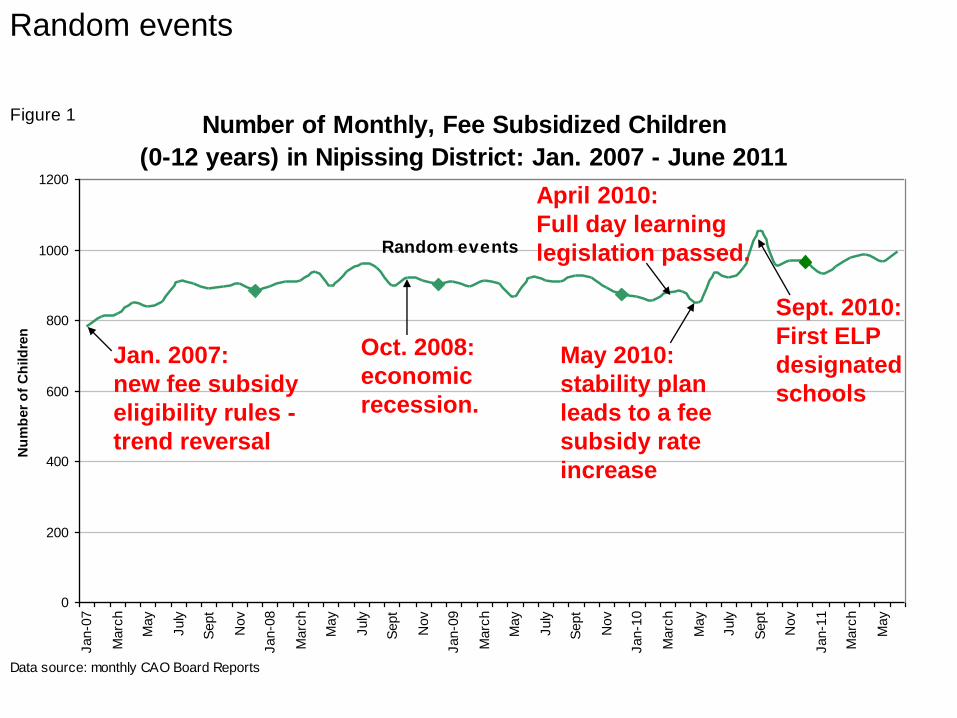
Jan. 2007:
new fee subsidy
eligibility rules -
trend reversal

Random events
Number of Monthly, Fee Subsidized Children
(0-12 years) in Nipissing District: Jan. 2007 - June 2011
0
200
400
600
800
1000
1200
Jan-0
7
Marc
h
May
July
Sept
Nov
Jan-0
8
Marc
h
May
July
Sept
Nov
Jan-0
9
Marc
h
May
July
Sept
Nov
Jan-1
0
Marc
h
May
July
Sept
Nov
Jan-1
1
Marc
h
May
Nu
mb
er
of
Ch
ild
ren
Random events
Figure 1
Data source: monthly CAO Board Reports
Jan. 2007:
new fee subsidy
eligibility rules -
trend reversal
Oct. 2008:
economic
recession.
Random events
Number of Monthly, Fee Subsidized Children
(0-12 years) in Nipissing District: Jan. 2007 - June 2011
0
200
400
600
800
1000
1200
Jan-0
7
Marc
h
May
July
Sept
Nov
Jan-0
8
Marc
h
May
July
Sept
Nov
Jan-0
9
Marc
h
May
July
Sept
Nov
Jan-1
0
Marc
h
May
July
Sept
Nov
Jan-1
1
Marc
h
May
Nu
mb
er
of
Ch
ild
ren
Random events
Figure 1
Data source: monthly CAO Board Reports
Jan. 2007:
new fee subsidy
eligibility rules -
trend reversal
Oct. 2008:
economic
recession.
April 2010:
Full day learning
legislation passed.
May 2010:
stability plan
leads to a fee
subsidy rate
increase
Random events
Number of Monthly, Fee Subsidized Children
(0-12 years) in Nipissing District: Jan. 2007 - June 2011
0
200
400
600
800
1000
1200
Jan-0
7
Marc
h
May
July
Sept
Nov
Jan-0
8
Marc
h
May
July
Sept
Nov
Jan-0
9
Marc
h
May
July
Sept
Nov
Jan-1
0
Marc
h
May
July
Sept
Nov
Jan-1
1
Marc
h
May
Nu
mb
er
of
Ch
ild
ren
Random events
Figure 1
Data source: monthly CAO Board Reports
Jan. 2007:
new fee subsidy
eligibility rules -
trend reversal
Oct. 2008:
economic
recession.
April 2010:
Full day learning
legislation passed.
Sept. 2010:
First ELP
designated
schools
May 2010:
stability plan
leads to a fee
subsidy rate
increase

Random events
Number of Monthly, Fee Subsidized Children
(0-12 years) in Nipissing District: Jan. 2007 - June 2011
0
200
400
600
800
1000
1200
Jan-0
7
Marc
h
May
July
Sept
Nov
Jan-0
8
Marc
h
May
July
Sept
Nov
Jan-0
9
Marc
h
May
July
Sept
Nov
Jan-1
0
Marc
h
May
July
Sept
Nov
Jan-1
1
Marc
h
May
Nu
mb
er
of
Ch
ild
ren
Random events
Figure 1
Data source: monthly CAO Board Reports
Jan. 2007:
new fee subsidy
eligibility rules -
trend reversal
Oct. 2008:
economic
recession.
April 2010:
Full day learning
legislation passed.
Sept. 2010:
First ELP
designated
schools
Randomly occurring events such as government policy and
program changes can also affect the trend, and the number
of subsidized children in Nipissing District.
May 2010:
stability plan
leads to a fee
subsidy rate
increase
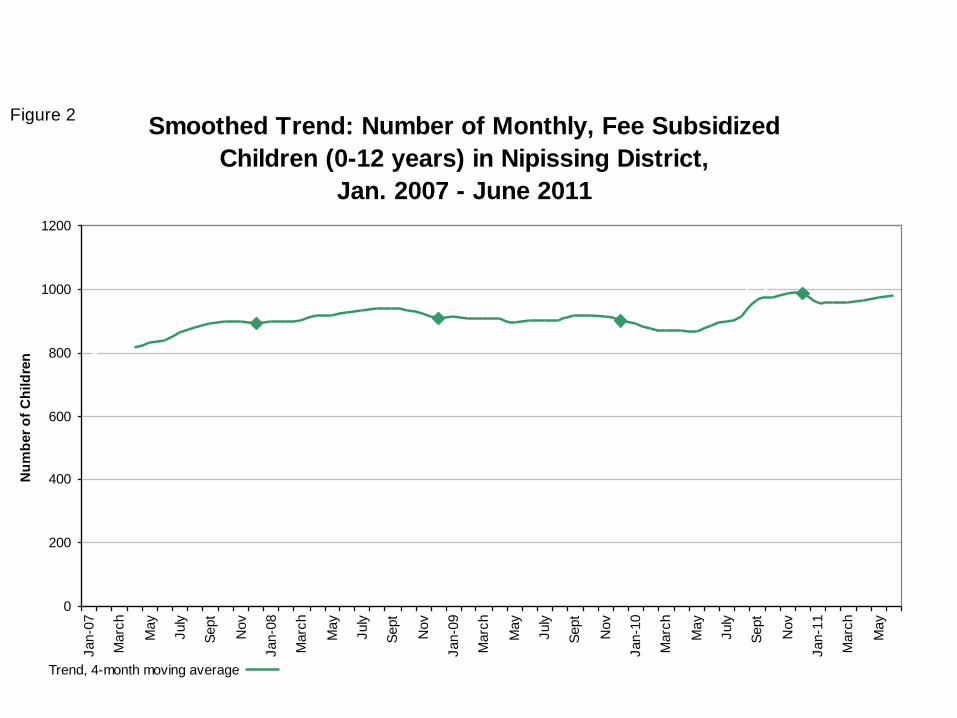
Smoothed Trend: Number of Monthly, Fee Subsidized
Children (0-12 years) in Nipissing District,
Jan. 2007 - June 2011
0
200
400
600
800
1000
1200
Jan-0
7
Marc
h
May
July
Sept
Nov
Jan-0
8
Marc
h
May
July
Sept
Nov
Jan-0
9
Marc
h
May
July
Sept
Nov
Jan-1
0
Marc
h
May
July
Sept
Nov
Jan-1
1
Marc
h
May
Nu
mb
er
of
Ch
ild
ren
Trend, 4-month moving average Series2
Figure 2
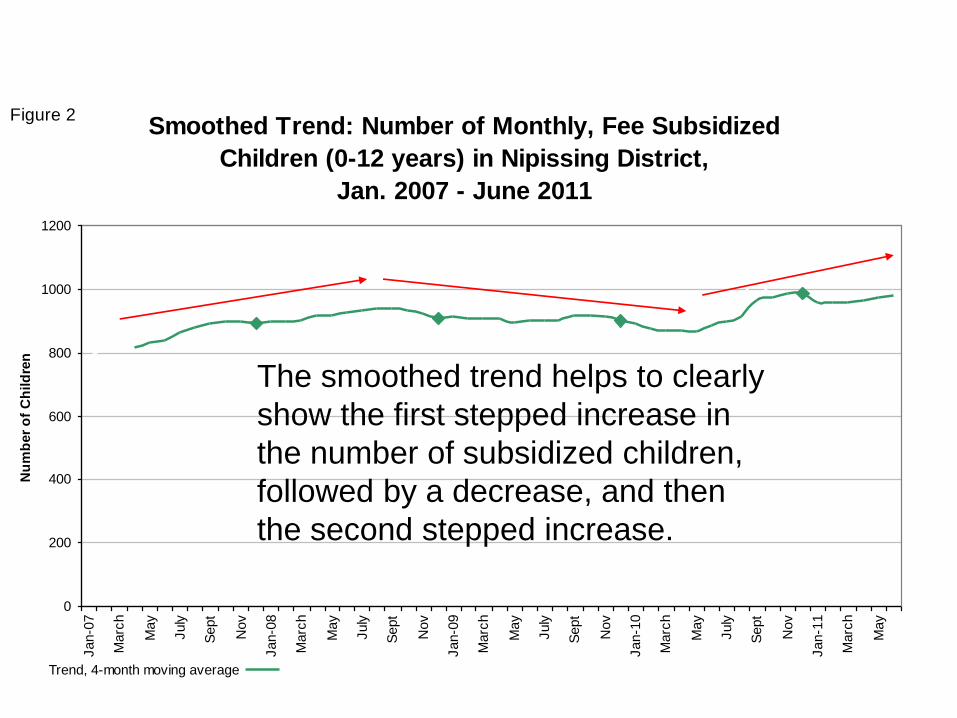
The smoothed trend helps to clearly
show the first stepped increase in
the number of subsidized children,
followed by a decrease, and then
the second stepped increase.
Q:
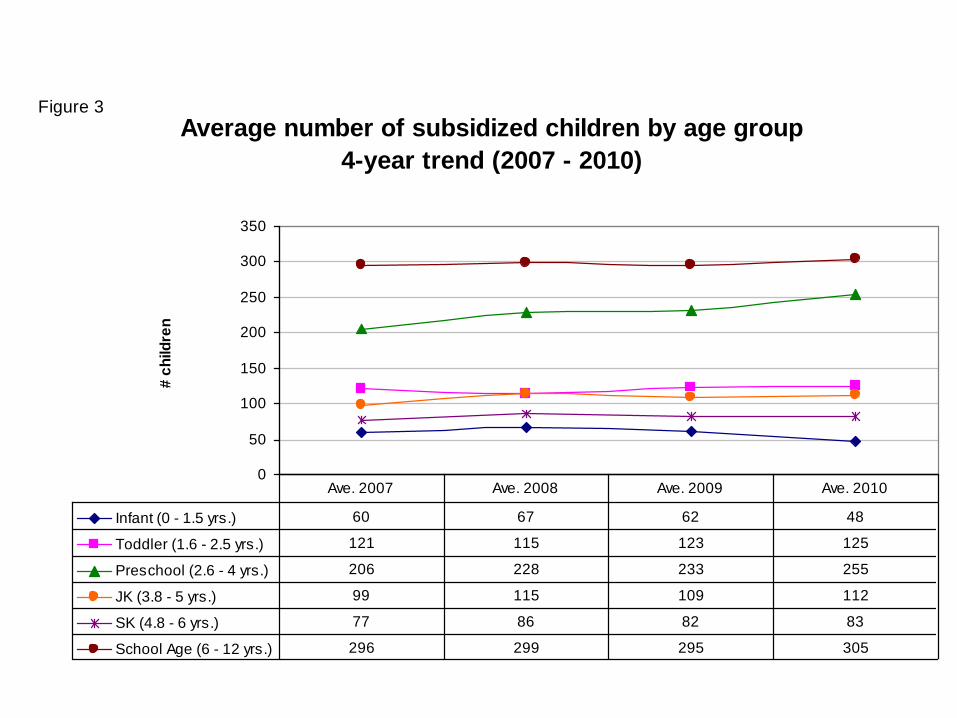
Is there a change in the age-groups of fee subsidized children?

The number of subsidized toddlers (1.6 – 2.5 years) and kindergarten children (ages 4 – 6 years) has remained relatively steady over time.
However, the number of fee subsidy infants (0 – 1.5 years) has recently started to decrease.
Preschoolers (2.5 – 4 years) and school age children (6 – 12 years) are trending upward.
A:
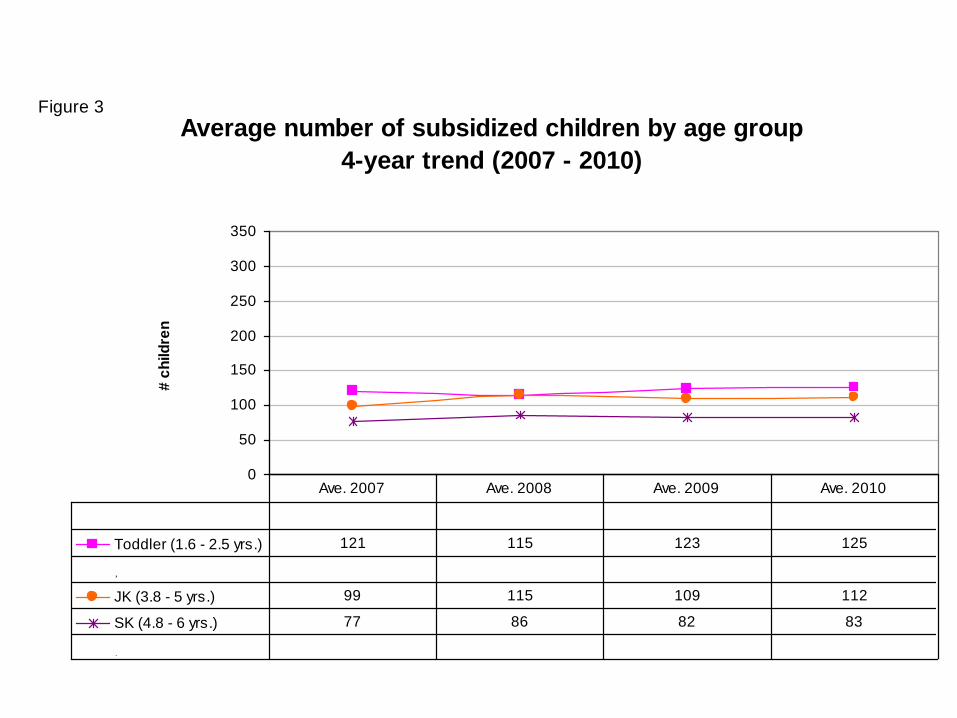
Average number of subsidized children by age group
4-year trend (2007 - 2010)
0
50
100
150
200
250
300
350
# c
hild
ren
, 60 67 62 48
Toddler (1.6 - 2.5 yrs.) 121 115 123 125
, 206 228 233 255
JK (3.8 - 5 yrs.) 99 115 109 112
SK (4.8 - 6 yrs.) 77 86 82 83
, 296 299 295 305
Ave. 2007 Ave. 2008 Ave. 2009 Ave. 2010
Figure 3
Average number of subsidized children by age group
4-year trend (2007 - 2010)
0
50
100
150
200
250
300
350
# c
hild
ren
Infant (0 - 1.5 yrs.) 60 67 62 48
Toddler (1.6 - 2.5 yrs.) 121 115 123 125
Preschool (2.6 - 4 yrs.) 206 228 233 255
JK (3.8 - 5 yrs.) 99 115 109 112
SK (4.8 - 6 yrs.) 77 86 82 83
School Age (6 - 12 yrs.) 296 299 295 305
Ave. 2007 Ave. 2008 Ave. 2009 Ave. 2010
Figure 3
Q:
What is the district’s current childcare capacity and structure?
How has this capacity changed?

As of June 30 2011, there are currently 1,923 centre-based licensed childcare spaces in Nipissing District (excludes private in-home childcare) At the same time last year there were 1,694 licensed childcare spaces (= 229 more spaces /12% increase)
A:
There are also 500 licensed private-home spaces currently available throughout the District and we continue to note an increase of families requiring this type of childcare
Five relatively large childcare service providers account for 79% of the district’s childcare capacity
A:
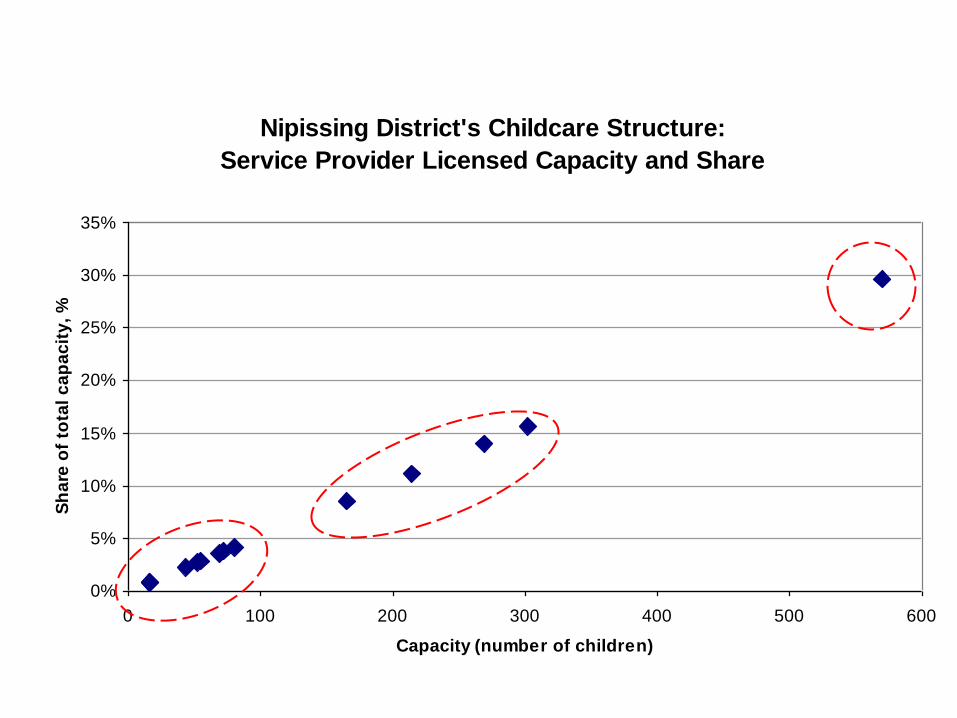
Nipissing District's Childcare Structure:
Service Provider Licensed Capacity and Share
0%
5%
10%
15%
20%
25%
30%
35%
0 100 200 300 400 500 600
Capacity (number of children)
Sh
are
of
tota
l c
ap
ac
ity
, %

Q:
What is causing the increase in the number of subsidized children in Nipissing District?
Is the increase across the childcare sector?
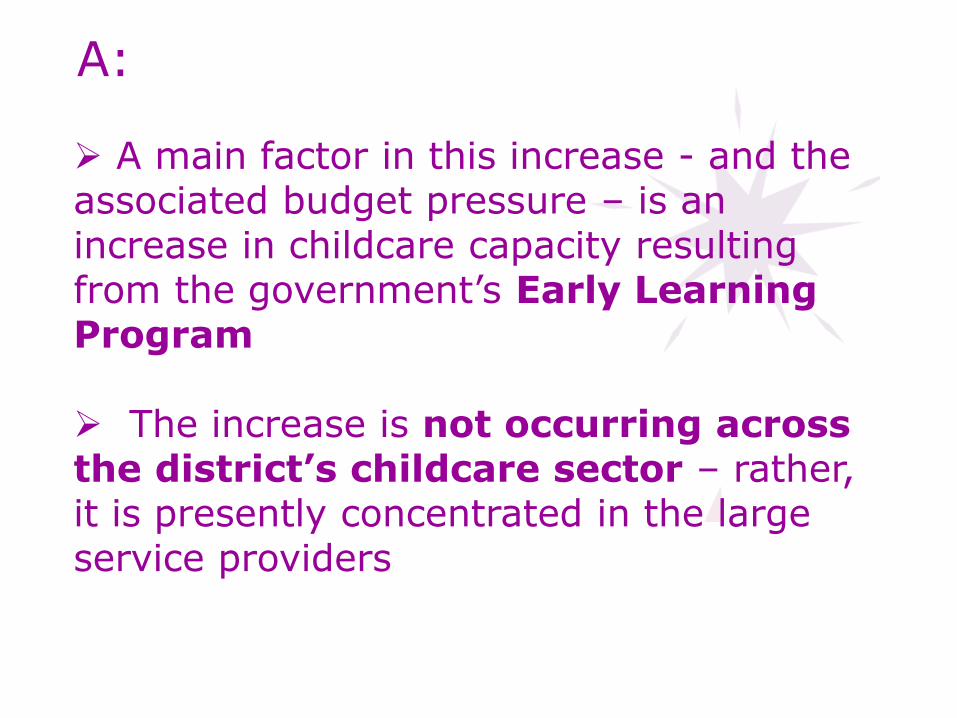
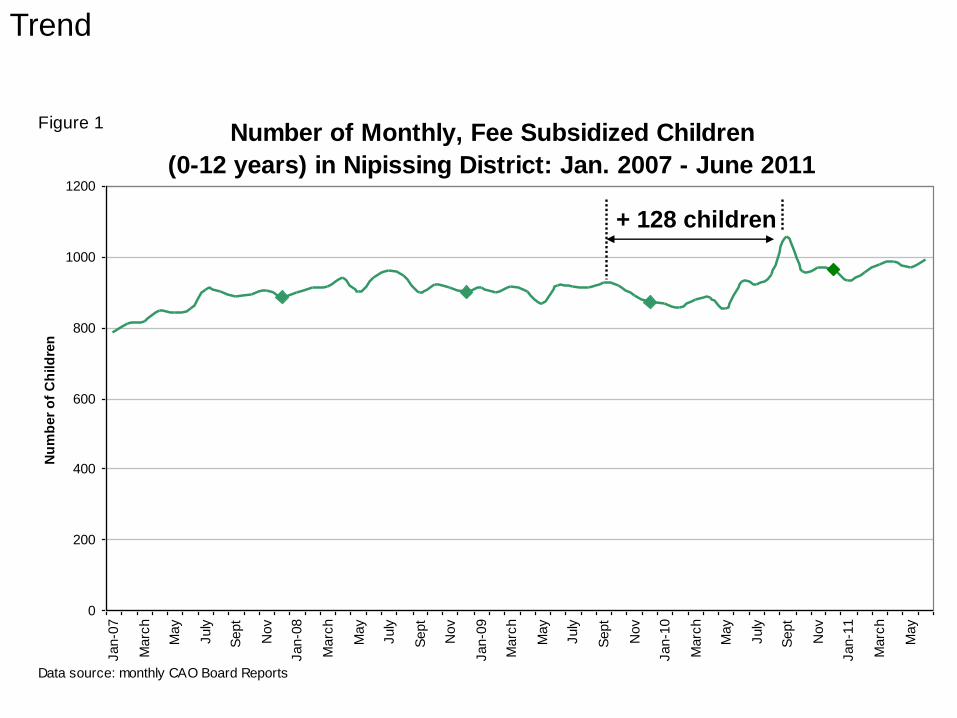
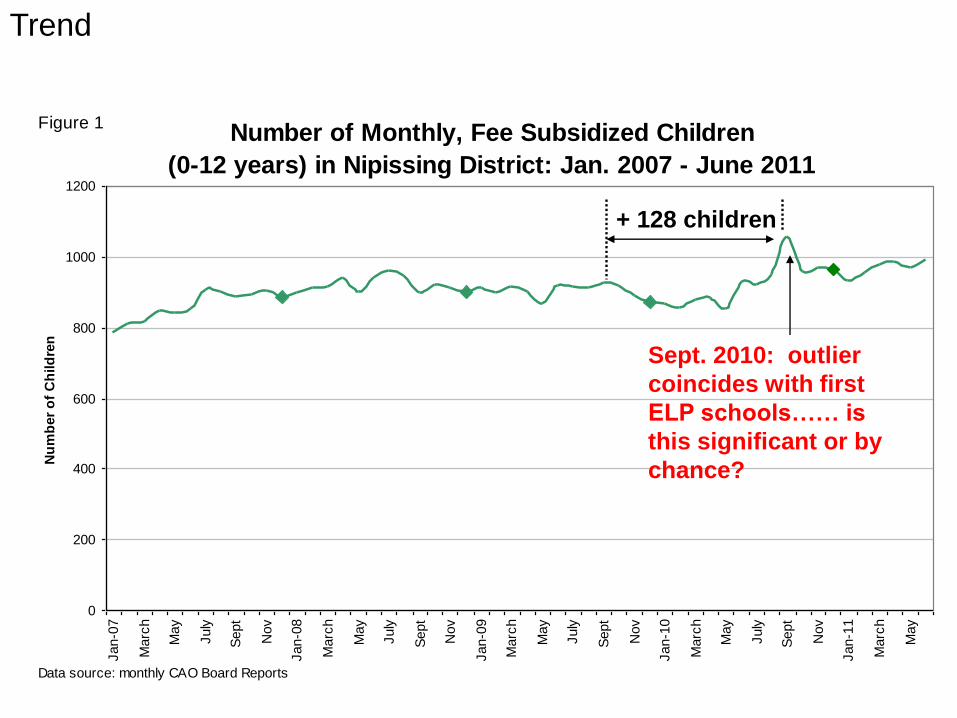
A main factor in this increase - and the associated budget pressure – is an increase in childcare capacity resulting from the government’s Early Learning Program The increase is not occurring across the district’s childcare sector – rather, it is presently concentrated in the large service providers
A:
Number of Monthly, Fee Subsidized Children
(0-12 years) in Nipissing District: Jan. 2007 - June 2011
0
200
400
600
800
1000
1200
Jan-0
7
Marc
h
May
July
Sept
Nov
Jan-0
8
Marc
h
May
July
Sept
Nov
Jan-0
9
Marc
h
May
July
Sept
Nov
Jan-1
0
Marc
h
May
July
Sept
Nov
Jan-1
1
Marc
h
May
Nu
mb
er
of
Ch
ild
ren
Figure 1
Data source: monthly CAO Board Reports
Trend
+ 128 children
Number of Monthly, Fee Subsidized Children
(0-12 years) in Nipissing District: Jan. 2007 - June 2011
0
200
400
600
800
1000
1200
Jan-0
7
Marc
h
May
July
Sept
Nov
Jan-0
8
Marc
h
May
July
Sept
Nov
Jan-0
9
Marc
h
May
July
Sept
Nov
Jan-1
0
Marc
h
May
July
Sept
Nov
Jan-1
1
Marc
h
May
Nu
mb
er
of
Ch
ild
ren
Figure 1
Data source: monthly CAO Board Reports
Trend
Sept. 2010: outlier
coincides with first
ELP schools…… is
this significant or by
chance?
+ 128 children

Nipissing District's Childcare Structure:
Service Provider Licensed Capacity and Share
0%
5%
10%
15%
20%
25%
30%
35%
0 100 200 300 400 500 600
Capacity (number of children)
Sh
are
of
tota
l c
ap
ac
ity
, %
229 space increase
is amongst the large
service providers.

Nipissing District's Childcare Structure:
Service Provider Licensed Capacity and Share
0%
5%
10%
15%
20%
25%
30%
35%
0 100 200 300 400 500 600
Capacity (number of children)
Sh
are
of
tota
l c
ap
ac
ity
, %
229 space increase
is amongst the large
service providers.
Many of these spaces are
in the ELP schools, and
the pre-school and
school- age groups

Questions?

Thank you !


