Download - Polytechnic and Basic Sciences School

1
University of Naples “Federico II”
Polytechnic and Basic Sciences School
Doctorate in Applied Biology
XXVIIth
Cycle
Bacillus subtilis spores as Mucosal Adjuvant
Coordinator PhD student Tutor
Ch.mo Prof. Ricca Ezio Dr. Bonavita Roberta Ch.mo Prof. Ricca Ezio
Supervisor
Dott. Rossi Mauro

2
Index page 2
Summary page 4
Chapter 1: Introduction page 8
Bacillus subtilis page 8
Celiac Disease page 18
References page 25
Chapter 2: Use of Bacillus subtilis spores to induce an intestinal immune
response
Introduction page 29
Materials and Methods page 32
Results page 38
Discussion and Conclusion page 49
References page 53
Chapter 3: Biochemical characterization of transamidated gliadin
Introduction page 56
Materials and Methods page 58
Results page 62
Discussion and Conclusion page 72
References page 75

3
Chapter 4: Characterization of immunomodulatory molecules and their
adsorption on Bacillus subtilis spores
Introduction page 77
Materials and Methods page 78
Results page 83
Discussion and Conclusion page 93
References page 95

4
Summary
Recently, researches attention has been focused on the development of mucosal
immunity strategies based on the use of probiotic spores as mucosal adjuvant. As
described in the introduction (Chapter 1) Bacillus subtilis spores are a good system
to surface display and vaccine delivery. An important advantage of a spore-based
display system is its high stability.
Spores can survive under adverse environmental conditions and are resistant to
proteolytic digestion. Therefore, they represent a good adjuvant to deliver antigens
into the gastrointestinal tract and they could be used to mucosal vaccine. Also the
mucosal vaccinology was used not only for responses toward pathogens but also for
down-regulating inflammatory conditions. Among these conditions, celiac disease
(CD) represents a very interesting model to test possible immunomodulatory
strategies. So the aim of my research has been the use of Bacillus subtilis spores as a
display system to development an immunomodulatory strategies for celiac disease. In
particular, in Chapter 2 I focused my attention on the adsorption reaction of Bacillus
subtilis spores and gliadin. I preliminarily explored the possibility of adsorbing
gliadin on Bacillus subtilis spores and then characterized the gliadin-specific T cell-
mediated response elicited by the spore-adsorbed gliadin in DQ8 mice (a transgenic
mouse model of gluten sensibility). A manuscript with the experiments described in
this part of the thesis is in press (Roberta Bonavita, Rachele Isticato, Francesco
Maurano, Ezio Ricca and Mauro Rossi, 2015. Mucosal immunity induced by gliadin-

5
presenting spores of Bacillus subtilis in HLA-DQ8-transgenic mice, Immunology
letters 2015, in press).
In the second part of my research I focused my attention on the development of
immunomodulatory strategy, based on the use of tolerogenic molecule to down
regulate the inflammatory response induced by gliadin. Therefore, firstly I did
biochemical analysis of soluble transamidated gliadin (spf), which is known to induce
a decrease of INFγ into spleen cells and intestinal biopsies. I decided to characterize
spf to identify similarity and differences with gliadin, in order to use transamidation
products as alternative therapeutic strategies for celiac patients. The experiments of
this biochemical characterization are described in the Chapter 3. Also, this part of
my work has been published in 2013 (Maria F. Mazzeo, Roberta Bonavita,
Francesco Maurano, Paolo Bergamo, Rosa A. Siciliano, Mauro Rossi, 2013.
Biochemical modifications of gliadins induced by microbial transglutaminase on
wheat flour. Biochimica et Biophysica Acta 1830:5166-74).
After this biochemical analysis I decided to use this modified gliadin to analyzed its
immune response into DQ8 mice. So in the Chapter 4 I put together experiments
aimed at understanding immune response induced by spf and I compared this
response with native gliadin. My experiments showed that spf is able to induce
phenotypic shift of gliadin specific immune response. In fact it induced a regulatory
response. This part of my research is the object of a publication that is still in
preparation.

6
Finally, I verified the capability of spores to adsorb spf and other
immunomodulatory molecules such as conjugated linoleic acid (CLA).

7
Chapter 1
Introduction

8
Bacillus subtilis
The life cycle of Bacillus subtilis
Bacillus subtilis is a gram-positive bacterium. It is an aerobe with a doubling time of
about 20 minutes when grown in rich medium at 37°C. During adverse environmental
conditions, when either a nitrogen or carbon source becomes deficient, the vegetative
cell initiates the process of sporulation. This process is characterized by an
asymmetric division that gives rise to a larger mother cell and a smaller forespore,
which matures into a spore (1, 2).
The bacterial spore is a dormant cell with high stability and it is able to survive in
adverse conditions, such as high temperatures, ph extremes, detergents, hydrolytic
enzymes and antibiotics (3). This dormant spore can survive for several years or until
nutrients are available in the environment. In this condition spores goes back
vegetative cell through the process of spore germination. The life cycle of Bacillus
subtilis is summarized into Figure 1.1.

9
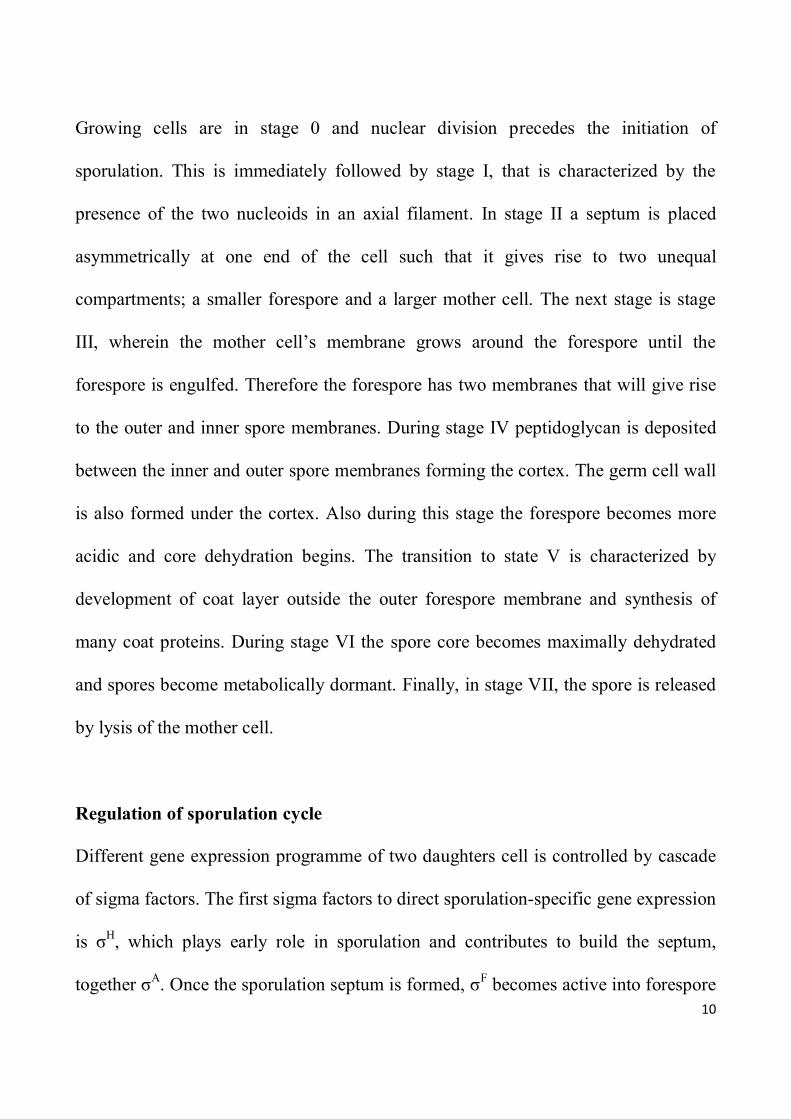
Figure 1.1: The sporulation cycle of Bacillus subtilis (Adapted from Errington J. Regulation of
endospore formation in Bacillus subtilis. Nat Rev Microbiol 2003; 1: 117-26).
Bacillus subtilis sporulation
When the nutrients are sufficient, Bacillus subtilis grows and divides into two
genetically identical cells. Sporulation process is divided into seven stages based on
morphological changes that give rise the two daughter cells different (Figure 1.1) (4).
This is possible because they follow two different gene expression programmes
controlled by four transcription factors.
10
Growing cells are in stage 0 and nuclear division precedes the initiation of
sporulation. This is immediately followed by stage I, that is characterized by the
presence of the two nucleoids in an axial filament. In stage II a septum is placed
asymmetrically at one end of the cell such that it gives rise to two unequal
compartments; a smaller forespore and a larger mother cell. The next stage is stage
III, wherein the mother cell’s membrane grows around the forespore until the
forespore is engulfed. Therefore the forespore has two membranes that will give rise
to the outer and inner spore membranes. During stage IV peptidoglycan is deposited
between the inner and outer spore membranes forming the cortex. The germ cell wall
is also formed under the cortex. Also during this stage the forespore becomes more
acidic and core dehydration begins. The transition to state V is characterized by
development of coat layer outside the outer forespore membrane and synthesis of
many coat proteins. During stage VI the spore core becomes maximally dehydrated
and spores become metabolically dormant. Finally, in stage VII, the spore is released
by lysis of the mother cell.
Regulation of sporulation cycle
Different gene expression programme of two daughters cell is controlled by cascade
of sigma factors. The first sigma factors to direct sporulation-specific gene expression
is σH, which plays early role in sporulation and contributes to build the septum,
together σA. Once the sporulation septum is formed, σ
F becomes active into forespore

11
compartment and actives transcription of genes involved in engulfment (5). When σF
is active in prespore, σE
becomes active into mother cell and the engulfment of
forespore compartment is finished. After that another factor, σG
becomes active into
forespore, probably thanks to the presence of a channel. At this point the cytoplasm
of the forespore dehydrates. Finally, last factor activated is σK, that it is required for
the final events of sporulation, in particular for the synthesis of coat. The mechanism
of regulation of gene expression into two cell compartments called criss-cross
regulation and was born in 1992 (6) (Figure 1.2).

12
Figure 1.2: (A) Morphological asymmetry. During sporulation surrounds the cells form an
asymmetric septum, which then surrounds the smaller cell. This process of engulfment is completed
by the loss of attachment between the forespore and the mother cell. (B) Genetic asymmetry.
These morphological changes are accompanied by activation of specific transcription factors in
each compartment (Adapted from Higgins D, Dworkin J. Recent progress in Bacillus subtilis
sporulation. FEMS Microbiol Rev 2012; 36: 131-48).
Spore structure
The bacterial spore consist in various layers: a core, surrounded by the inner
membrane, the cortex, the outer membrane, the coat and spore crust (Figure 1.3).
The core is the innermost part of the spore. It contains the spore cytoplasm with all
cellular components, such as cytoplasmic proteins, ribosomes and DNA. The water

13
content is 30–50 % of the core cytoplasm wet weight instead of the 70–88 % of the
vegetative cytoplasm.
This dehydratated state plays an important role in spore longevity, dormancy and
resistance. Other molecules that play an important role in spore resistance is
dipicolinic acid (DPA) and acid-soluble spore proteins (SASP) associated with spore
DNA. (7, 8, 9).
In coat formation the gene expression is regulated by coat proteins with
morphogenetic activity. These proteins are: SpoIVA, SpoVID, CotE and CotH.
SpoIVA is produced in the mother cell, under the control of σE and it is essential for
the synthesis of spore cortex and for the localization of SpoVID and CotE (10).
CotE is a 24 kDa produced in mother cell compartment and surrounds the engulfed
forespore (11). The inner coat proteins collect in the space between CotE and the
forespore surface, while the outer coat proteins assemble around the CotE layer. The
formation of the outercoat involves CotE together with CotH (12). Also CotE
interacts with many spore coat components (13).
CotH is a 42.8 kDa protein that has a morphogenetic role in the assembly of coat
components and in the development of lysozyme resistance of spore (12). In the
mother cell compartment CotH acts as a chaperone and also it is essential for
stabilization of CotG and CotC.
The spore core is surrounded by the inner membrane, which is the site where spore
germination receptors are located. Inner membrane is rounded by cortex. The cortex

14
is composed of peptidoglycan and it has a crucial importance for the maintenance of
spore core dehydration. The inner part of the cortex is called the germ cell wall or
primordial cell wall and it is also composed of peptidoglycan. The germ cell wall
becomes cell wall of the freshly germinated spore following spore germination.
Around the cortex there is the outer membrane. The outer membrane, deriving from
engulfment, has opposite polarity with respect to the inner membrane (Figure 1.3).
Figure 1.3: Structure of spore. An artistic representation of spore and its layers.
Use of Bacillus spores as a display system
Recent studies show a novel surface display system based on the use of bacterial
spores. There are many advantages in the use of spores, such as stability even after a

15
prolonged storage, resistance to lysozyme so they can cross gastrointestinal tract and
finally the possibility to display large multimeric protein because the protein are
produced in the mother cell and assembled around the forming spore without
transport through the membrane (14).
The spore-based display system requires the construction of a gene fusion between
gene coding for spore surface protein (carrier) and the heterologous DNA coding for
the protein to be displayed (Figure 1.4). With this process many heterologous protein
are expressed on the surface of spores and they are used for many application, such as
vaccine vehicles (15).
Two antigen were initially selected to bind spore coat protein: C-terminal fragment of
the tetanus toxin (TTFC) and B subunit of the heat labile toxin (LTB). The strategy to
obtain recombinant Bacillus subtilis spores expressing CotB-TTFC or CotB-LTB on
their surface was based on use of the cotB gene and its promoter for the construction
of translational fusions and chromosomal integration of the cotB-tetC and cotB-eltB
gene fusions into the coding sequence of gene amyE. Another coat protein that it is
used as a carrier is CotC (16).

16
Figure 1.4: Spore surface-display. A schematic image of spore display system. (Adapted from
Ricca E and Cutting SM: Emerging Applications of Bacterial Spores in Nanobiotechnology. J
Nanobiotechnology 2003; 1: 6)
Spore surface-display system based on non-recombinant approach
The major disadvantages of recombinant approach are the release of live recombinant
organisms into nature, raising concerns over the use and clearance of genetically
modified microorganisms. To overcome this obstacle, a non-recombinant approach to
use spores as a display system has been recently proposed. In the first study
suggesting that heterologous proteins can be adsorbed on the spore surface, the
mammalian NADPH-cytochrome P450 reductase (CPR), a diflavin-containing
enzyme, was over-expressed in sporulating Bacillus subtilis cells and released into
the culture medium after sporulation by autolysis of the mother cell and was found

17
associated to spore surface. So the protein was spontaneously bound to spore surface
(17). In this first study the authors did not observe the mechanism involved into
spontaneously adsorption. An essential characteristic of adsorption reaction is the pH
of the binding buffer. In fact we have been shown that when the pH of the buffer is
acid (pH 4) there is an increase of binding efficiency (18). Elettrostatic and
hydrophobic forces were suggested to drive the adsorption reaction.
Also recent studies shown that mutant spores with a strongly altered (cotH) or
completely lacking (cotE) outer coat adsorbed heterologous protein more efficiently
than wild-type (wt) spores do (19, 20). Interestingly, autoclaved spores were also
found to be effective in adsorbing heterologous proteins and stimulating an
immunological response towards an host antigen (21). So, the spores as antigen
vehicle by nasal or oral route, represent a promising tool in mucosal vaccinology.
Mucosal vaccinology could be instrumental not only to induce response toward
antigen but also to down-regulate an inflammatory condition. In this case celiac
disease represents an interesting model to test immunomodulatory strategies.

18
Celiac Disease
Celiac disease: definition and etiopathogenesis
Celiac disease is an immune-mediated enteropathy caused by ingestion of wheat
gluten and prolamins, generally developed in genetically susceptible individuals.
Approximately 90% of patients with celiac disease have HLA DQ2 which is
generally in tight linkage with the DR3 haplotype, and most of the remaining patients
(8% to 10%) have HLA DQ8 associated with the DR4 (22). Therefore, individuals
with celiac disease almost always have the DQ2 or DQ8 molecule: DQ2 is present in
approximately 30% of the general population and DQ8 is present in 40% of the
general population (23).
Celiac disease is a multifactorial disorder with genetic factor and environmental
factor: gluten. Gluten ingestion caused villus atrophy, hypertrophic crypts, and
infiltration of intraepithelial lymphocytes (IELs).
Gluten is a mixture of proteins: gliadins and glutenins. Gliadin is considered the toxic
component responsible of celiac damages into intestinal mucosa of celiac patients.

19
Biochemical characteristic of gliadin
The gliadin fraction has been grouped in three classes named “α,” “γ,” and “ω” based
on biochemical analysis that revealed a tight structural relationship among the various
constituents. The numerous components of gliadin can be classified according to their
primary structure into omega 5, omega 1,2, alpha- and gamma-type. Omega-types
have almost entirely repetitive amino acid sequences consisting of glutamine, proline
and phenylalanine. While alpha and gamma-type gliadins contain four and five
different domains, respectively. Unique for each alpha and gamma-type is domain I,
which consists mostly of repetitive sequences rich in glutamine, proline and aromatic
amino acids. In vitro testing of gliadin peptides revealed that domain I of alpha-type
gliadins is involved in activating celiac disease. The sequences -Pro-Ser-Gln-Gln-
and -Gln-Gln-Gln-Pro- were demonstrated to be common for toxic gliadin peptides
(24). Have been identified some of protein with “toxic” activity as listed in Table 1
(25).
Tab1 Toxic gliadin peptides

20
A binding motif for the HLA-DQ8 molecule has been described by using a
combination of computational sequencing data, in vitro binding assays (26, 27), and
x-ray crystallography (28). The motif consists of five anchor regions: P1 and P9
anchors require negative or polar residues; P4 with aliphatic/aromatic, neutral
residues; P6 with small aliphatic amino acids and any residue at P7 (Figure 1.5).
Figure 1.5: Binding motif of HLA-DQ. Schematic representation of binding motif of HLA-DQ
with pocket anchors crucial for gliadin binding (Adapted by Sollid LM. Coeliac disease: dissecting
a complex inflammatory disorder. Nat Rev Immunol, 2002, 2: 647-55).
The high content of glutamine makes gluten a good substrate for tissue
trasglutaminase (tTG) (29).
This enzyme is constitutively expressed into lamina propria and it converts glutamine
into the negatively charged glutamic acid, a process called deamidation. This process
has a key role into activation of immune response toward gliadin.

21
Innate and Adaptive immune response
Tissue transglutaminase plays critical role in the development of immune response
toward gluten. It deamidates gliadin in the lamina propria causing change of the some
glutamine residues into glutamic acid. Deamidated peptides bind with far greater
affinity to specific positively charged residues on the peptide-binding groove of
HLA-DQ2 or HLA-DQ8 major histocompatibility complex (MHC) class II
molecules. These peptides are then presented by HLA-DQ2 or HLA-DQ8 to activate
gliadin-specific CD4+T cells thereby activating an intestinal inflammatory response
(29).
This inflammatory disease is characterized by high production of IFN-γ and a
decrease of IL10. So the phenotype of adaptive immune response is Th1. CD4+T cells
stimulate cytotoxic T cells and fibroblasts to produce a particular matrix
metalloproteinase pattern which is responsible for degradation of both extracellular
matrix and basement membrane. Activated T cells also become able to trigger
enterocyte apoptosis by producing molecules like Fas ligand and granzyme, which
are responsible for cytotoxicity, leading to the characteristic mucosal lesions.
Stimulated CD4+T cells are also able to induce lymphocyte B differentiation into
plasma cells producing specific anti-gliadin and anti-tissue transglutaminase
antibodies (25).
Also gluten stimulates IL-15 production, which characterizes innate response. IL-15
causes an upregulation of stress protein by enterocytes that are recognized by the

22
natural killer receptors present on intraepithelial lymphocytes. Therefore in CD are
induced two effector immune responses: adaptive (a gluten specific CD4+Tcell
response) and innate (mediated by intraepitelial lymphocyte) summarized into Figure
1.6.
Figure 1.6: Schematic representation of immune response toward gluten (Adapted by
Ciccocioppo R, Di Sabatino A, Corazza GR. The immune recognition of gluten in coeliac disease.
Clin Exp Immunol 2005; 140: 408–16)
Therapeutical Strategies
The treatment for celiac disease is a gluten free diet. This involves elimination of the
grains containing gluten, wheat, rye and barley, as well as food products and

23
additives derived from them (30). Maintaining a gluten free diet improves the health
and quality of life, but there is low adherence to diet especially for adult patients.
There are numerous reasons why there is low adherence to the diet. They include
palatability, cost and availability, inadequate food labeling as well as social pressures
and quality-of-life issues (17).
Therefore many studies are focused to develop new therapeutical strategies
alternative to the gluten free diet.
Non dietary therapies have focused on three main areas: to decrease gluten exposure,
to modify intestinal permeability and to modulate immune activation.
Kapoerchan et al (31) have shown that gluten peptides can be modified at specific
positions with an amino acid substitution, without affecting their affinity for HLA-
DQ2, and that these constructs can compete with native gluten peptides and prohibit
recognition by HLADQ2-specific T-cells. These antagonist peptides might be a
therapeutic option to treat CD patients.
A major approach that has been explored is the enzymatic degradation of the large,
immunogenic gliadin peptides into small non toxic fragments. This can be performed
by prolyl endopeptidases (PEPs). These are proteases able to degrade the proline-rich
gluten peptides into smaller, less immunogenic fragments. This can be achieved by
bacterial, or fungal enzymes (29, 32). Alternatively, probiotics have been
demonstrated to degrade gluten and exert a protective effect on the damage exerted
by gluten on cell cultures (33).

24
Another therapeutic target is to prevent the migration of luminal gluten peptides
across the intestinal epithelium. Therefore a peptide that inhibits the action of zonulin
and the increase of intestinal permeability have been discovered (34).
Another potential target of drug therapy is modulation of the immune response to
gluten. This may be achieved by preventing gliadin deamidation through the
inhibition of tissue transglutaminase, by preventing HLA presentation through
blocking the HLA DQ2 or DQ8 molecules, or by modulating cytokine production.
There are many studies that showed modulation of cytokine production and they are
based on modification of wheat flour or immunomodulatory strategies to tolerize
toward gluten. Gianfrani et al 2007 (35) and Lombardi et al 2013 (36) showed that
the transamidation of wheat flour with microbial transglutaminase can be used to
block the T-cell-mediated gliadin activity.
Also Rossi et al (37) showed that intranasal administration of gliadin in mice
systematically immunized with gliadin induced an IFNγ decrease. This results
highlighted the potential usefulness of ag delivery by nasal route as useful vaccine
strategy.

25
References 1 Driks A. Overview: Development in bacteria: spore formation in Bacillus
subtilis. Cell Mol Life Sci 2002; 59: 389-91.
2 Piggot PJ, Hilbert DW. Sporulation of Bacillus subtilis. Curr Opin Microbiol 2004;
7: 579-86.
3 Nicholson WL, Munakata N, Horneck G, Melosh HJ and Setlow P. Resistance of
Bacillus endospores to extreme terrestrial and extraterrestrial environments.
Microbiol Mol Biol Rev 2000; 64: 548-72.
4 Stragier P, Losick R. Molecular genetics of sporulation in Bacillus subtilis. Annu
Rev Genet 1996; 30: 297-341.
5 Sun D, Stragier P, Setlow P. Identification of a new σ-factor involved in
compartmentalized gene expression during sporulation of Bacillus subtilis.
Genes Dev 1989; 3: 141-49.
6 Stragier P. Establishment of forespore-specific gene expression during sporulation
of Bacillus subtilis. In Cole JA, Mohan F, and Dow C editors. Procaryotic structure
and function. Society for General Microbiology, London, United Kingdom. 1992. p.
297-310.
7 Setlow P. Spores of Bacillus subtilis: their resistance to and killing by radiation,
heat and chemicals. J Appl Microbiol 2006; 101: 514-25.
8 Setlow P. I will survive: protecting and repairing spore DNA. J Bacteriol 1992;
174: 2737-41.
9 Setlow P. Mechanisms for the prevention of damage to DNA in spores of Bacillus
species. Annu Rev Microbiol 1995; 49: 29-54.
10 Driks A, Roels S, Beall B, Moran CP, Jr Losick R. Subcellular localization of
proteins involved in the assembly of the spore coat of Bacillus subtilis. Genes Dev
1994; 8: 234-44.
11 Zheng L, Losick R. Cascade regulation of spore coat gene expression in Bacillus
subtilis. J Mol Biol 1990; 212: 645-60.
12 Nacleiro G, Baccigalupi L, Zilhao R, De Felice M and Ricca E. Bacillus subtilis
spore coat assembly require cotH gene expression. J Bacteriol 1996; 178: 4375-80.
13 Kim H, Hahn M, Grabowski P, McPherson DC, Otte MM, Wang R, Ferguson CC,
Eichenberger P and Driks A. The Bacillus subtilis spore coat protein interaction
network. Mol Microbiol 2006; 59: 487-502.
14 Isticato R, Cangiano G, Tran HT, Ciabattini A, Medaglini D, Oggioni R. M, De
Felice M, Pozzi G and Ricca E. Surface display of recombinant proteins on Bacillus
subtilis Spores. J Bacteriol 2001; 183: 6294-01.
15 Ricca E, Cutting S: Emerging Applications of Bacterial Spores in
Nanobiotechnology. J Nanobiotechnology 2003; 1: 6
16 Mauriello EMF, Duc LH, Isticato R, Cangiano G, Hong HA, De Felice M, Ricca
E, Cutting SM. Display of Heterologous Antigens on the Bacillus subtilis Spore Coat
Using CotC as a Fusion Partner. Vaccine 2003; 22: 1177-88

26
17 Lee A. and Newman JM. Celiac diet: Its impact on quality of life. J Am Diet Assoc
2003; 103: 1533-35.
18 Huang JM, Hong HA, Van Tong H, Hoang TH, Brisson A, Cutting SM. Mucosal
delivery of antigens using adsorption to bacterial spores. Vaccine 2010; 28: 1021-30
19 Sirec T, Strazzulli A, Isticato R, De Felice M, Moracci M, Ricca E. Adsorption of
beta-galactosidase of Alicyclobacillus acidocaldarius on wild type and mutants spores
of Bacillus subtilis. Microb Cell Fact 2012; 11: 100.
20 Ricca E, Baccigalupi L, Cangiano G, De Felice M, Isticato R. Mucosal vaccine
delivery by non-recombinant spores of Bacillus subtilis. Microbial Cell Factories
2014; 13: 115.
21 Song M, Hong HA, Huang JM, Colenutt C, Khang DD, Nguyend TVA, ParK SM,
Shim BS, Song HH, Cheon IS, Jang JE, Choi JA, Choi YK, Stadler K and Cutting
SM. Killed Bacillus subtilis spores as a mucosal adjuvant for an H5N1 vaccine.
Vaccine 2012; 30: 3266-77.
22 Farre C, Humbert P, Vilar P, Aldequer X, Carnicer J, Carballo M, Gassul MA.
Serological markers and HLA-DQ2 haplotype among first-degree relatives of celiac
patients. Catalonian Coeliac Disease Study Group. Dig Dis Sci 1999; 44: 2344–49.
23 Sollid LM, Thorsby E. HLA susceptibility genes in celiac disease: genetic
mapping and role in pathogenesis. Gastroenterol 1993; 105: 910–22.
24 Wieser H, Modl A, Seilmeier W and Belitz HD. High-performance liquid
chromatography of gliadins from different wheat varieties: amino acid composition
and N-terminal amino acid sequence of components. Z Lebens Unters Forsch 1987;
185: 371–78.
25 Ciccocioppo R, Di Sabatino A and Corazza GR. The immune recognition of
gluten in coeliac disease. Clin Exp Immunol 2005; 140: 408–16.
26 Godkin AJ, Davenport MP, Willis A, Jewell DP and Hill AV. Use of complete
eluted peptide sequence data from HLA-DR and -DQ molecules to predict T cell
epitopes, and the influence of the nonbinding terminal regions of ligands in epitope
selection. J Immunol 1998; 161: 850–58.
27 Godkin A, Friede T, Davenport M, Stevanovic S, Willis A, Jewell D, Hill A, and
Rammensee HG. Use of eluted peptide sequence data to identify the binding
characteristics of peptides to the insulin-dependent diabetes susceptibility allele
HLA-DQ8 (DQ 3.2). Int Immunol 1997; 9: 905–11.
28 Lee KH, Wucherpfennig KW and Wiley DC. Structure of a human insulin
peptide-HLA-DQ8 complex and susceptibility to type 1 diabetes. Nat Immunol 2001;
2: 501–07.
29 Stepniak D and Koning F. Celiac Disease-Sandwiched between Innate and
Adaptive Immunity. Hum Immunol 2006; 67: 460-68.
30 Green PH and Jabri B. Coeliac disease. Lancet 2003; 362: 383-91.

27
31 Kapoerchan VV, Wiesner M, Overhand M, van der Marel GA, Koning F and
Overkleeft HS. Design of azidoproline containing gluten peptides to suppress CD4+T
cell responses associated with celiac disease. Bioorg Med Chem 2008; 16: 2053–62.
32 Piper JL, Gray GM and Khosla C. Effect of prolyl endopeptidase on digestive-
resistant gliadin peptides in vivo. J Pharmacol Exp Ther 2004; 311: 213-19
33 Lindfors K, Blomqvist T, Juuti-Uusitalo K, Stenman S, Venalainen J, Maki M,
Kaukinen K. Live probiotic Bifidobacterium lactis bacteria inhibit the toxic effects
induced by wheat gliadin in epithelial cell culture. Clin Exp Immunol 2008; 152: 552-
8.
34 Paterson BM, Lammers KM, Arrieta MC, Fasano A and Meddings JB. The safety,
tolerance, pharmacokinetic and pharmacodynamic effects of single doses of AT-1001
in coeliac disease subjects: a proof of concept study. Aliment Pharmacol Ther 2007;
26: 757-66.
35 Gianfrani C, Siciliano RA, Facchiano AM, Camarca A, Mazzeo MF, Costantini S,
Salvati VM, Maurano F, Mazzarella G, Iaquinto G, Bergamo P and Rossi M.
Transamidation of wheat flour inhibits the response to gliadin of intestinal T cells in
celiac disease. Gastroenterol 2007; 133: 780-89.
36 Lombardi E, Maurano F, Bergamo P, Bozzella G, Luongo D, Mazzarella G,
Rotondi Aufiero V, Iaquinto G, Rossi M. Selective inhibition of gliadin immune
reactivity by transamidation of wheat flour with microbial transglutaminase. J Leukoc
Biol 2013; 93: 479–88.
37 Rossi M, Maurano F, Caputo N, Auricchio S, Sette A, Capparelli R and Troncone
R. Intravenous or Intranasal Administration of Gliadin is Able to Down-Regulate the
Specific Immune Response in Mice. Scand J Immunol 1999; 50: 177-82.

28
Chapter 2
Use of Bacillus subtilis spores to induce an intestinal
immune response
“published on Immunology Letters 2015 in press”

29
Introduction
As described in the Chapter 1, probiotic bacterial strains represent very promising
new tool for active vaccination. They are used to vehicular antigen toward target cell,
but also for down-regulating adverse immune responses and tolerance induction. The
development of immunomodulatory strategy based on mucosal immunity generally
requires efficient antigen delivery and adjuvant systems.
Initially, the adjuvant system used ADP-ribosylating enterotoxins, LT and CT (1).
However, CT as well as LT are normally considered to be too toxic for human use.
Recently, attention has been focused on spores produced by Gram positive bacteria,
such as Clostridium or Bacillus genres (2). Specifically, Bacillus subtilis spores have
been engineered to display antigens (3, 4) as well active enzymes (6). Spore display
system has many advantages. An important advantage of a spore-based display
system is its high stability. In fact spores can survive under adverse environmental
conditions for a long period and are resistant to proteolytic digestion (6). Therefore,
they potentially represent a good adjuvant to deliver antigens into the gastrointestinal
tract and to induce a specific immune response (7).
A spore display system normally requires fusion between genes encoding for spore
coat protein, called carrier and a DNA coding for heterologous passenger protein.
This construct after transcription process is displayed on spore surface. Genetic
manipulation has many obstacle, therefore more recently, a non recombinant
approach has been developed. Non recombinant approach are based on the

30
spontaneously stable adsorption of an antigen or foreign protein on the spore surface.
There are many studies that show this adsorption reaction and have been shown that
mutant spores with a strongly altered (cotH) or completely lacking (cotE) outer coat
adsorbed heterologous protein more efficiently than wild-type (wt) spores (8, 9).
Interestingly, autoclaved spores were also found to be effective in adsorbing
heterologous proteins and stimulating an immunological response towards an host
antigen (10). So, it can be concluded that spores are a useful vaccine system.
Mucosal vaccinology could be instrumental not only for boosting responses towards
pathogens but also for preventing/down-regulating ongoing intestinal inflammatory
conditions. Among these conditions, celiac disease (CD) represents a very interesting
model to test possible immunomodulatory strategies, considering that the eliciting
antigen (wheat gliadin) and the immunopathogenic mechanisms are known.
CD is an immune-mediated enteropathy triggered by wheat gliadin in HLA-DQ2 or
HLA-DQ8-expressing individuals. This disease is characterised by activation of
intestinal gliadin-specific CD4+T cells with a Th1 phenotype, which appear to play a
major role in the induction of villus atrophy and increased intestinal permeability
(11). HLA-DQ8-transgenic mice have widely been used both to further dissect the
molecular mechanisms underlying CD pathogenesis and to develop possible
immunomodulatory strategies (12, 13, 14). So we preliminarily explored the
possibility of adsorbing gliadin on Bacillus subtilis spores and then characterised the

31
gliadin-specific T cell-mediated response elicited by the spore-adsorbed gliadin in
DQ8 mice.

32
Materials and Methods
Strains
The Bacillus subtilis strains used in this study were PY79 (wt) (7) and its isogenic
mutant derivatives ER220 (cotH-null mutant) (15) and DL76 (cotE-null mutant) (16).
Sporulation of Bacillus subtilis was induced by growth in Difco Sporulation Media
(SPM) at 37°C for 30 h with strong shaking. After incubation at 37°C, spores were
collected and centrifuged 10 min at 7000 g. Then, the pellet was resuspended in
distilled water. This washing step was repeated several times. Spores were separated
from vegetative cells by a renografin gradient purification step (17). Spore amount
was determined by plate counting of spore serial dilutions.
Antigen preparation
Gliadin was extracted from wheat flour by a modified Osborne protocol (18). Briefly
wheat flour was resuspended in 0.4 M NaCl and was centrifuged at 1000 rpm for 10
min. Then the pellet was washed for several times and gliadin was extracted in 70%
ethanol. The supernatant, which contained gliadin, was recovered and freeze-dried.
Protein content was measured by Bradford analysis (19). Gliadin stock solution was
prepared by suspending 10 mg gliadin in 50 mM acetic acid.

33
Binding assay
In total, 2x10⁹ spores were incubated with 125 μg native gliadin from the stock
solution in 200 μl of 50 mM sodium acetate, pH 4.0 (adsorption solution), for 1 h at
RT by continuous shaking (7). The spores were centrifuged at 13000 g for 10 min
and washed three times to remove unbound gliadin. The pellet (spore-adsorbed
gliadin) was used for in vitro and in vivo experiments. Gliadin adsorption was
evaluated by dot blot and Bradford analyses (19). The dot blot analysis was
performed as previously described (20). The membrane was probed with an in-house-
produced mouse polyclonal antibody against wheat gliadin (1:5000 dilution) and then
with biotinylated streptavidin peroxidase-conjugated anti-mouse IgGs (1:10000
dilution; Dako SpA, Milano, Italy).
Immunodetection was performed using ECL reagent (Amersham-GE Healthcare
Europe GmbH, Glattbrugg, Switzerland) and a ChemiDoc XRS system (Bio-Rad
Laboratories, Hercules, CA). For Bradford analysis, the amount of spore-adsorbed
gliadin was calculated as the difference in the protein content of the adsorption
solution before and after incubation.
Mice and immunization protocol
Transgenic mice expressing the HLA-DQ8 molecule were maintained under
pathogen-free conditions at our animal facility (Accreditation No. DM.161/99). The
animals were reared on a gluten-free diet for several generations and were used at the

34
age of 6-12 weeks. The experiments were approved by the National Institutional
Review Committee and performed in accordance with European regulations (EU
Directive 2010/63/EU). In tolerizetion experiments, mice were nasally administered
multiple doses of spore-adsorbed gliadin (days: -6, -5, -4, and -3; 1, 2, 3, and 4; and
8, 9, 10, and 11; 2x10⁹ 11 spores/dose). The control groups were mice instilled with
multiple doses of free gliadin (40 μg) dissolved in water or with water alone. On days
0, 7 and 14 the mice were injected intraperitoneally (i.p.) with gliadin emulsified with
FCA (day 0) or IFA (days 7 and 14). The mice were sacrificed on day 21. In
immunisation experiments, mice were nasally administered seven doses of spore-
adsorbed gliadin (2x10⁹ spores/dose) or an equivalent amount of free gliadin at
weekly intervals. The mice were sacrificed one week later to collect the spleens and
mesenteric lymph nodes (MLNs). Also in another immunization experiment mice
were intragastric immunized with spore-adsorbed gliadin (2x10⁹ spores/dose) one
dose a week for six weeks. The mice were sacrificed one week later to collect spleens
and MLNs.
Isolation of T cells and dendritic cells (DCs) from DQ8 mice
The spleens and MLNs were passed through a stainless-steel wire mesh and
subsequently through a 40 μm cell strainer (Falcon, BD Biosciences, Erembodegem,
Belgium) to separate the cells. The splenic suspension was further treated with Tris-
buffered ammonium chloride solution to remove erythrocytes. Then untouched

35
CD4+T cells from the splenic and MLN cells of immunised mice were separated
using a CD4+T Cell Isolation Kit (Miltenyi Biotec Srl, Calderara di Reno-BO, Italy).
Finally, CD4+T cell aliquots (5x10
5) were added to plates containing DCs. Immature
DCs (iDCs) were purified from the bone marrow of the femurs and tibiae of naïve
DQ8 mice according to a published protocol (21). Briefly femurs and tibiae of mice
were re-moved and purified from the surrounding muscle tissue. Then intact bones
were left in 70% ethanol for 2–5 min for disinfection and the marrow flushed with
PBS using a Syringe with a 0.45 mm diameter needle.
At day 0 cells were seeded at 5x10⁶ 100 mm dish in 10 ml complete RPMI-1640 with
20 ng/ml rmGM-CSF. Every two days half of the culture supernatant was collected,
centrifuged, and the cell pellet resuspended in 10 ml fresh medium containing 20
ng/ml rmGMCSF and given back into the original plate. From day 8 to 10 cells can
be used.
In vitro co-cultures
iDCs were placed in 48-well plates (2.5x10⁵ cells/well), incubated with gliadin alone
(100 μg/ml) or spore-adsorbed gliadin (DC:spore ratio: 1:30) for 18 h and finally
pulsed with LPS for 4 h to stimulate maturation of the DCs. After removal of the
spent medium, 5x10⁵ CD4
+T cells were added along with fresh medium, and the co-
cultures incubated for 72 h. Supernatants were collected and analysed for cytokine
secretion.

36
Western blotting
iDCs were incubated at 37°C for different times (0-18 h) with spore-adsorbed gliadin
(DC:spore ratio: 1:30) or free gliadin to analyse the antigen-processing kinetics. After
incubation, the iDCs were washed with phosphate buffer, recovered, centrifuged and
resuspended in Laemmli sample buffer and boiled for 5 min. Then equivalent protein
aliquots were fractioned by 12 % denaturating SDS-PAGE, after that blotted on
Immobilon PVDF membranes (Millipore, Billerica, MA, USA) and probed with
mouse anti-gliadin serum (1:5000 dilution). After washing, the membranes were
incubated with peroxidase-conjugated anti-mouse IgG antibodies (1:10000 dilution;
Dako SpA, Milano, Italy). Finally, immunodetection was performed using ECL
reagent and Hyperfilm (GE Healthcare Europe GmbH - Filiale Italiana, 20 Milan,
Italy).

37
Cytokine assay
Spleen and MLN cells isolated from immunised mice were cultured at 2.5x10⁶
cells/ml in 24-well plates in the presence or absence of gliadin (100 μg/ml) or an
equivalent amount of spore-adsorbed gliadin. After 72 h, supernatants were collected
and analysed for IFN-γ and IL-10 protein levels by ELISA using commercial kits.
Supernatants from co-cultures of DCs and CD4+T cells were similarly analysed.
Statistical analysis
Differences among the various experimental groups were determined by one-way
ANOVA, followed by the Turkey test (for the spore adsorption test and co-culture
experiments) or the Kruskal-Wallis non-parametric test and Dunn’s multiple
comparison test for post-test analysis (for the in vivo analyses). P < 0.05 was selected
to denote a significant difference.

38
Results
Adsorption of gliadin to Bacillus subtilis spores
A preliminary test was performed to identify the optimal binding buffer conditions to
adsorb gliadin on spore surface, taking into account the known hydrophobicity of this
protein. Previous study showed that soluble proteins were more efficiently adsorbed
on the surface of Bacillus subtilis spores in phosphate buffer at pH 4.0 than at pH 7.0
(7). We found that this condition were not suitable for gliadin, because there were
protein precipitation. So we demonstrated that wheat gliadin was efficiently
solubilised in 50 mM sodium acetate at pH 4 at a concentration of 625 μg/ml
(adsorption solution). For adsorption reaction we used wt spores, CotH and CotE
mutants spores at 2x10⁹ spores because our previous data indicated that an optimal
nasal dosage in mice is 2x10⁹ spores/20 μl (22). Therefore 2x10
9 wt or mutant spores
were incubated in 200 μl adsorption solution for 1 h.
To assess the amount of gliadin adsorbed on the spore surface, the adsorption mixture
was centrifuged to separate spore-adsorbed gliadin from free gliadin. Then the pellet
washed for several times to remove unbound gliadin. Finally two-fold serial dilutions
of the pelleted fractions were dot blotted and probed with anti-gliadin antibody.
The results showed that CotH, but not wt spores, bound gliadin (Figure 1). Gliadin
was also similarly adsorbed by CotE spores and CotH spores (data not shown).
Interestingly, autoclaved wt spores were more effective in adsorbing gliadin than
untreated wt spores, but still less efficient than autoclaved mutant spores. By

39
densitometric analysis of dot blots (no densitometric software), we estimated that
approximately 6, 10 and 24 ng gliadin/106 spores were adsorbed on autoclaved wt,
CotH and CotE spores, respectively. Only faint residual positivity was observed in
washes, suggesting the absence of substantial gliadin leakage. This was a qualitative
determination.
Figure 1: Dot blot analysis of gliadin adsorption by B. subtilis spores. Serial dilutions of
untreated or autoclaved wt and mutant (cotH and cotE) spores were analysed following the
adsorption reaction with gliadin.
To quantitatively asses spore-adsorbed gliadin, we determined the difference between
the initial gliadin content and the residual gliadin in the adsorption solution following

40
the incubation step by Bradford Test. The results reported in Table 1 confirmed the
better performance of autoclaved spores in terms of gliadin-binding activity.
Interestingly, the gliadin content was higher than the content estimated by dot blot
analysis for all spore types. Surprisingly, autoclaved wt spores showed the maximal
binding capacity (41.1 ± 9.7 % for 2x10⁹), followed by CotH (28.0 ± 1.4 %) and
CotE (25.0 ± 5.7 %) spores.
Table 1: Percentage of adsorbed gliadin on wild type (wt) and mutant spores
Together, these data suggest that gliadin molecules were not only bound on the
external surface, but probably it was incorporated into a network created by spores.

41
The absolute values of the amount of gliadin adsorbed by the different tested spores
are shown in Figure 2.
Based on these results, autoclaved wt spores were used to analyse the induction of an
immune response in DQ8-transgenic mice.
Figure 2: Quantitative analysis of conjugated gliadin. The amount of gliadin (μg) adsorbed on
2x10⁹ spores was calculated as the difference in the protein concentration of the adsorption solution
before and after incubation. Light grey columns, represented wt spores; dark grey columns, cotH
spores; black columns, cotE spores. The data represent the mean ± SD of three different
experiments. *, P < 0.05.

42
In vitro analysis of immune response to gliadin
To analyse immune response toward gliadin we firstly evaluated the influence of
spores on gliadin processing by antigen-presenting cells (APCs) in vitro. Spore-
adsorbed gliadin and an equivalent amount of free gliadin were incubated with bone
marrow-derived iDCs (DC:spore ratio: 1:30) from DQ8 mice for 1-18 h. Protein
samples were then analysed by Western blotting using anti-gliadin mouse serum as a
probe. Interestingly, uptake of spore-adsorbed gliadin occurred faster than for free
gliadin, in fact positive signals were observed after 1 and 2 h, respectively (Figure
3A). Also we observed that both signals disappeared after 4 h, suggesting similar
kinetics of processing.
Then in the next experiment we wanted to analyse interaction between DCs and T
cells. Therefore antigen-pulsed mature DCs (mDCs) were incubated with autologous
gliadin-specific CD4+T cells for 72 h. The results of this experiment shown that
gliadin-pulsed mDCs stimulated higher levels of IFN-γ in CD4+T cells than did
mDCs challenged with spore-adsorbed gliadin (Figure 3B). These data were expected
considering that, on the latter mDCs, a reduced number of DQ8 molecules could
present gliadin peptides, probably because of steric obstruction or masking of the
binding sites. Also we demonstrated that gliadin-pulsed mDCs were able to stimulate
CD4+T cells isolated from mice immunised with spore-adsorbed gliadin. Under the
various examined experimental conditions there were not significant levels of IL-10
(data not shown).

43
Figure 3: In vitro antigen processing of spore-adsorbed gliadin. A) Western blot analysis of
antigen uptake and processing. iDCs were incubated with spores alone (lane a), gliadin (lane b) or
spore adsorbed gliadin (lane c) at different times (from 0-18 h).
B) In vitro analysis of the gliadin-specific CD4+T cell-mediated response. mDCs (2x10
5 cells/well)
that were not pulsed (black columns) or that were pulsed with gliadin (white columns) or spore-
adsorbed gliadin (grey columns) were incubated with CD4+T cells (5x10
5 cells/well) isolated from
DQ8 mice parenterally immunised with gliadin or spore adsorbed gliadin. IFN-γ levels secreted in
the supernatant after 72 h of co-culture were detected by ELISA. The columns are the mean ± SD of
duplicate analyses. The results are representative of three different experiments. **, P < 0.001.

44
In vivo analysis of immune response induced by gliadin adsorbed spores
We previously reported that intranasal administration of gliadin in DQ8 mice was
able to down-regulate the antigen-specific systemic response (13). Therefore we
tested if intranasal administration of spore adsorbed gliadin similarly induced
tolerance in mice systemically immunised with native gliadin. So mice received free
gliadin or spore adsorbed gliadin before immunization. We observed that mice
nasally treated with gliadin showed a significant increase in antigen-specific IL-10
secretion at the systemic level, compatible with the activation of T regulatory cells
(Figure 4 panel C). In contrast, spore adsorbed gliadin failed to induce a similar
phenotypic change; in fact the IL-10 secretion decreased both at systemic level and in
the intestinal compartment (Figure 4 panel C and D). These results suggested that
adsorbed gliadin lost its intrinsic tolerogenic properties.
Another important result was the capability of spore to vehiculate gliadin into the
intestine by inducing an amplifying the IFN-γ production (Figure 4 panel B).

45
Figure 4: Effect of nasal administration of spore-adsorbed gliadin in immunised DQ8 mice. Analysis of cytokine pattern of spleen and MLN cells isolated from DQ8 mice i.n. treated with
spore adsorbed gliadin (triangles), gliadin (squares) or water (circles) and immunised i.p. with
wheat gliadin. The results represent one of three independent experiments, and the bars are the
median values. There were 5-6 mice in each group. *, P < 0.05.
Then we analysed whether spore-adsorbed gliadin was able to directly induce a T
cell-mediated mucosal response. Mice were nasally or intragastric immunised with
spore-adsorbed gliadin (2.0x10⁹ spores/dose) or were nasally immunized with free
gliadin (40.0 μg/dose). The animals were dosed once per week for 7 weeks and
sacrificed one week later, and their spleens and MLNs were analysed for gliadin-
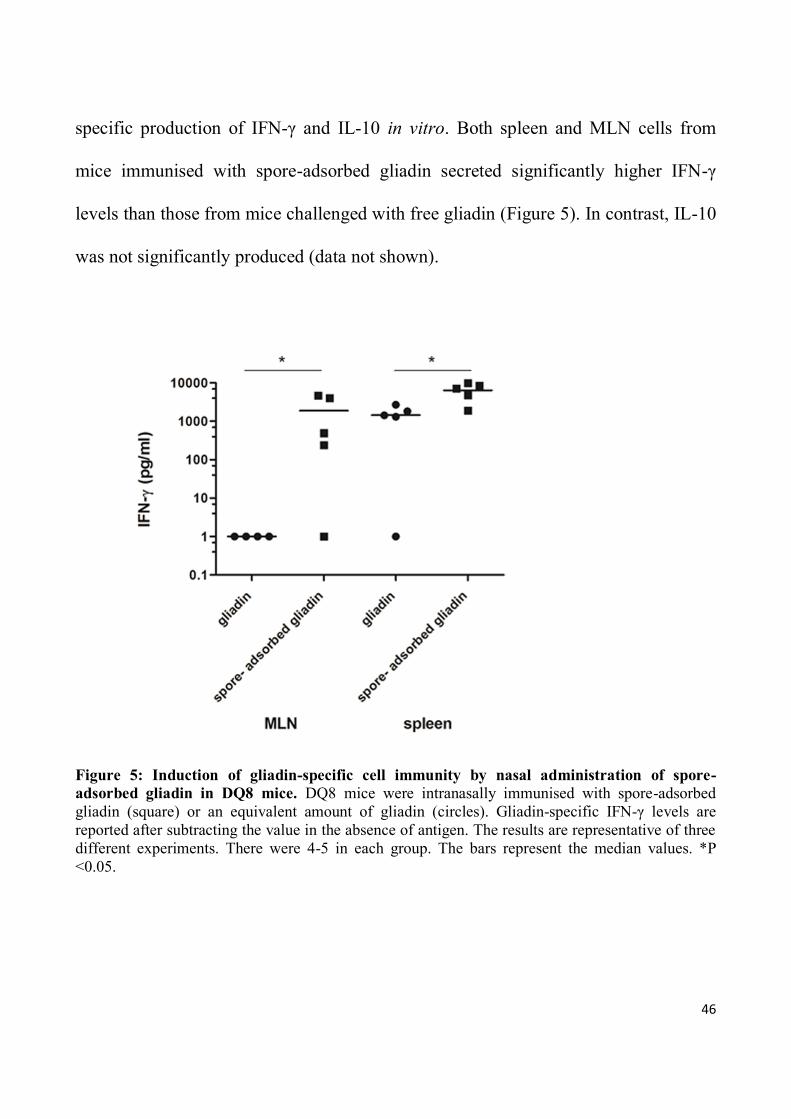
46
specific production of IFN-γ and IL-10 in vitro. Both spleen and MLN cells from
mice immunised with spore-adsorbed gliadin secreted significantly higher IFN-γ
levels than those from mice challenged with free gliadin (Figure 5). In contrast, IL-10
was not significantly produced (data not shown).
Figure 5: Induction of gliadin-specific cell immunity by nasal administration of spore-
adsorbed gliadin in DQ8 mice. DQ8 mice were intranasally immunised with spore-adsorbed
gliadin (square) or an equivalent amount of gliadin (circles). Gliadin-specific IFN-γ levels are
reported after subtracting the value in the absence of antigen. The results are representative of three
different experiments. There were 4-5 in each group. The bars represent the median values. *P
<0.05.

47
Furthermore, intragastrically administered gliadin adsorbed spores did not induce an
immune response (Figure 6). So the nasal route represents in our hand the optimal
way to immunize with antigen adsorbed spores.
intragastric immunization
adso
rbed
glia
din i.
g.MLN
adso
rbed
glia
din i.
g. SPLE
EN
0.01
0.1
1
10
100
1000
IFN
- (
pg
/ml)
Figure 6: Effect of intragastric administration of spore-adsorbed gliadin in DQ8 mice. DQ8
mice were intragastrically immunized with spore-adsorbed gliadin for six weeks, one dose a week.
Gliadin-specific IFN-γ levels are reported after subtracting the value in the absence of antigen.
We further analysed the response to gliadin in the intestinal CD4+T cell sub-
population. As shown in Figure 7, spore-adsorbed gliadin induced an increased
secretion of IFN-γ in CD4+T cells isolated from MLNs following in vitro stimulation
with gliadin. IL-10 was not induced in gliadin-specific CD4+T cells, indicating that

48
nasal administration of spore-adsorbed gliadin promoted a Th1-biased immune
response in the intestinal compartment of DQ8-transgenic mice.
Figure 7: Characterization of the intestinal gliadin-specific response induced by nasal
administration of spore-adsorbed gliadin in DQ8 mice. Mice were intranasally immunized.
CD4+T cells were isolated from MLNs by immunomagnetic sorting and analysed in vitro for
gliadin-specific IFN-γ (upper panel) and IL-10 secretions (bottom panel). The results are
representative of three different experiments. The columns represent the mean + SD of triplicate
cultures. **, P < 0.001.

49
Discussion and Conclusion
Our results showed that gliadin-pulsed DCs stimulated gliadin adsorbed spores
specific CD4+T cells to induce a Th1-biased antigen-specific intestinal response in
DQ8 mice.
An adaptive response to gliadin-derived peptides caused by activation of CD4+T
cells, occurs in the lamina propria of the small intestinal mucosa (23). These cells
also represent the main immunological target for tolerance strategies. The classical
protocol of oral tolerance with native antigen is not applicable in CD because local
administration of gliadin peptides could develop the risk of exacerbating the disease.
So in this part of the study we wanted to use nasal delivery of spore-adsorbed gliadin
for inducing an antigen specific intestinal response to verify the ability of Bacillus
subtilis spores to act as a mucosal adjuvant and antigen vehicle. Recently, a non-
recombinant approach has been proposed based on non-covalent antigen adsorption,
which involves electrostatic and hydrophobic forces that are not yet fully
characterised (9). Acidic pH and antigen solubility (8) appear to play major roles in
this mechanism. For these reasons, the use of hydrophobic antigenic molecules such
as wheat gliadin carries the risk of stochastic aggregation, with unpredictable
biological outcomes. So we tested the optimal binding buffer.
Moreover, to maximise the adsorbed gliadin molecules:spore ratio, we tested wt
Bacillus subtilis and two mutant strains to identify which spores showed the highest

50
binding efficiency for gliadin. CotH and CotE belong to a small subset of coat
proteins that play a regulatory role in the formation of the spore coat.
Dot blot experiments clearly indicated that surface binding of gliadin essentially
occurred when mutant spores were used. In addition to differences in coat
architecture, Bacillus subtilis wt spores are known to be negatively charged in water,
whereas both CotH and CotE mutant spores are not or are less charged (8, 24).
Whether structural and/or chemical peculiarities are involved in determining the
adsorption properties of spores remains to be fully addressed but an important result
was that binding efficiency increased following drastic physical treatment via
autoclaving. The treatment was particularly effective for wt spores. Furthermore,
gliadin adsorption occurred at an acidic pH, a condition in which the number of
negative surface charges is further reduced. Taken together, these data suggest a
prevalent role of the structural features of spores in determining the loading capacity
for gliadin.
Notably, comparison between dot blot and spectrophotometric protein analysis
clearly indicated that the amount of bound gliadin was higher than shown by dot blot
data. Therefore we suggest that most gliadin avoided from antibody recognition,
probably because it was incorporated inside structural niches of spores.
Another important result was the high stability of gliadin-spore interactions. Based on
the biochemical results, autoclaved wt spores were chosen for subsequent
immunological studies.

51
Next, we studied spore-adsorbed gliadin processing by DCs in vitro. We initially
analysed gliadin uptake in iDCs by Western blotting. Interestingly, we found that
spore-adsorbed gliadin was incorporated more rapidly than free gliadin was,
suggesting that antigen uptake occurred through different mechanisms. Whereas
endocytosis of free gliadin is receptor mediated, the spore-adsorbed gliadin
presumably was internalised by phagocytosis (25), but independently of the specific
routing, both antigens were degraded at same time. In fact, we observed that spore-
adsorbed gliadin and free gliadin were processed by DCs with similar kinetics.
Notably, by using mDCs as APCs, we found that gliadin-pulsed mDCs stimulated not
only gliadin-specific CD4+T cells but also CD4
+T cells isolated from mice
immunised with spore-adsorbed gliadin.
Together, the biochemical and immunological data indicated that gliadin bound to
spores was correctly processed and was able to induce a T cell-mediated response
with the same phenotype.
These results encouraged the study of the immunological properties of spore-bound
gliadin in vivo. We initially tested the potential of this antigen to modulate the
ongoing intestinal response to wheat gliadin. We used previously established protocol
of nasal administration (13) and we have shown that spore-adsorbed gliadin were
unable to induce down-regulation of immune response, but this antigen administered
in multiple doses activated a Th1- intestinal response towards gliadin.

52
In conclusion, we demonstrated that nasal delivery of a spore-adsorbed food protein
can induce an antigen-specific cell-mediated response. In particular, spore-adsorbed
gliadin was able to induce an intestinal CD4+T cell response. Further studies are
required to better characterise the phenotype of the induced response and, more
particularly, to develop an immunomodulatory strategy based on nasal delivery of a
spore-adsorbed protein with tolerogenic properties.

53
References 1 Lycke N, Tsuji T, Holmgren J. The adjuvant effect of Vibrio cholerae and
Escherichia coli heat-labile enterotoxins is linked to their ADP ribosyltransferase
activity. Eur J Immunol 1992; 22: 2277–81.
2 Kim JH, Roh C, Lee CW, Kyung D, Choi SK, Jung HC, Pan JG and Kim BG.
Bacterial surface display of GFP(uv) on Bacillus subtilis spores. J Microbiol
Biotechnol 2007; 17: 677–80.
3 Duc LH, Cutting SM. Bacterial spores as heat stable vaccine vehicles. Expert Opin
Biol Ther 2003; 3: 1263-70.
4 Mauriello EM, Duc LH, Isticato R, Cangiano G, Hong HA, De Felice M, Ricca E
and Cutting SM. Display of heterologous antigens on the Bacillus subtilis spore coat
using CotC as a fusion partner. Vaccine 2004; 22: 1177–87.
5 Kwon SJ, Jung HC, Pan JG. Transgalactosylation in a water-solvent biphasic
reaction system with beta-galactosidase displayed on the surfaces of Bacillus subtilis
spores. Appl Environ Microbiol 2007; 73: 2251–6.
6 Mc Kenney PT, Driks A, Eichemberger P. The Bacillus subtilis endospore:
assembly and functions of the multilayered coat. Nat Rev Microbiol 2013; 11: 33-44.
7 Huang JM, Hong HA, Van Tong H, Hoang TH, Brisson A, Cutting SM. Mucosal
delivery of antigens using adsorption to bacterial spores. Vaccine 2010; 28: 1021-30.
8 Sirec T, Strazzulli A, Isticato R, De Felice M, Moracci M, Ricca E. Adsorption of
beta galactosidase of Alicyclobacillus acidocaldarius on wild type and mutants spores
of Bacillus subtilis. Microb Cell Fact 2012; 11: 100.
9 Ricca E, Baccigalupi L, Cangiano G, De Felice M, Isticato R. Mucosal vaccine
delivery by non-recombinant spores of Bacillus subtilis. Microbial Cell Factories
2014, 13: 115.
10 Song M, Hong HA, Huang JM, Colenutt C, Khang DD, 1 Nguyend TVA, ParK
SM, Shim BS, Song HH, Cheon IS, Jang JE, Choi JA, Choi YK, Stadler K and
Cutting SM. Killed Bacillus subtilis spores as a mucosal adjuvant for an H5N1
vaccine. Vaccine 2012; 30: 3266-77.
11 Sollid LM. Coeliac disease: dissecting a complex inflammatory disorder. Nat Rev
Immunol 2002; 2: 647–55.
12 Black KE, Murray JA, David CS. HLA-DQ determines the response to exogenous
wheat proteins: a model of gluten sensitivity in transgenic knockout mice. J Immunol
2002; 169: 5595–5600.
13 Senger S, Luongo D, Maurano F, Mazzeo MF, Siciliano RA, David C, Troncone
R, Auricchio S and Rossi M. Intranasal administration of a recombinant α-gliadin
down-regulates the immune response to wheat gliadin in DQ8 transgenic mice.
Immunol Lett 2003; 88: 127-34.
14 Senger S, Maurano F, Mazzeo MF, Gaita M, Fierro O, David CS, Troncone R,
Auricchio S, Siciliano RA and Rossi M. Identification of immunodominant epitopes

54
of alpha-gliadin in HLA-DQ8 tg mice following oral immunisation. J Immunol 2005;
175: 8087-95.
15 Naclerio G, Baccigalupi L, Zilhao R, De Felice M, Ricca E. Bacillus subtilis spore
coat assembly requires cotH gene expression. J Bacteriol 1996; 178: 4375-80.
16 Zheng L, Donovan WP, Fitz-James PC, Losik R. Gene encoding a morphogenic
protein required in the assembly of the outer coat of the Bacillus subtilis endospore.
Genes Dev 1988; 2: 1047-54.
17 Nicholson WL, Setlow P. Sporulation, germination and outgrowth. In: Harwood
CR, Cutting SM, editors, Molecular biological methods for Bacillus. Chichester, UK:
John Wiley & Sons Ltd; 1990, p. 391-450.
18 Weegels PL, Hamer RJ, Schofield JD. RP-HPLC and capillary electrophoresis of
subunits from glutenin isolated by SDS and Osborne fraction. J Cereal Sci 1995; 22:
211-4.
19 Bradford MM. A rapid and sensitive method for the 1 quantitation of microgram
quantities of protein utilizing the principlexin of protein-dye binding. Anal Biochem
1976; 72: 248-54.
20 Hinc K, Isticato R, Dembek M, Karczewska J, Iwanicki A, Peszyńska-Sularz G, et
al. Expression and display of UreA of Helicobacter acinonychis on the surface of
Bacillus subtilis spores. Microb Cell Fact 2010; 9: 2.
21 Lutz MB, Kukutsch N, Ogilvie ALJ, Ro ßner S, Koch F, Romani N, Schuler G.
An advanced culture method for generating large quantities of highly pure dendritic
cells from mouse bone marrow. J Immunol Methods 1999; 223: 77–92.
22 Isticato R, Sirec T, Treppiccione L, Maurano F, De Felice M, Rossi M and Ricca
E. Non recombinant display of the B subunit of the heat labile toxin of Escherichia
coli on wild type and mutant spores of Bacillus subtilis. Microb Cell Fact 2013; 12:
98.
23 Nilsen EM, Jahnsen FL, Lundin KE, Johansen FE, Fausa O, Sollid LM, Jahnsen J,
Scott H, Brandtzaeg P. Gluten induces an intestinal cytokine response strongly
dominated by interferon gamma in patients with celiac disease. Gut 1998; 115: 551-
63.
24 Pesce G, Rusciano G, Sirec T, Isticato R, Sasso A, Ricca E. Surface charge and
hydrodynamic coefficient measurements of Bacillus subtilis spore by optical
tweezers. Colloids Surf B Biointerfaces 2014; 116: 568-75.
25 Yu LH, Cutting SM. The effect of anti-spore antibody responses on the use of
spores for vaccine delivery. Vaccine 2009; 27: 4576-84.

55
Chapter 3
Biochemical characterization of transamidated gliadin
“published on Biochimica et Biophysica Acta 2013, 1830: 5166-74”

56
Introduction
As described in Chapter 2 we demonstrated that nasal delivery of a spore-adsorbed
food protein can induce an antigen-specific cell-mediated response. Next, we planned
to bind a protein with immunomodulatory activity to spores. Firstly we focused our
attention on transamidated gliadin because it has been shown to cause a dramatic
down-regulation in IFNγ production in vitro in the intestinal T cells of CD patients
(1).
In the small intestine of CD patients, specific glutamine residues are converted to
glutamic acid by tissue transglutaminase (tTGase); this post-translational
modification plays a major role in intestinal T cell activation. Tissue transglutaminase
(TG2) modifies proteins and peptides by transamidation or deamidation of specific
glutamine residues. During transamidation reaction, an acyl residue, derived from the
γ-carboxamide group of a peptide-bound glutamine (acyl donor), is transferred to an
appropriate primary amine, most commonly the ε-amino group of lysine residues
(acyl acceptor). In the first step, the side chain of a glutamine residue forms a
thioester with the active site cysteine, and ammonia is released (acylation). In the
following transamidation step, the activated acyl group is transferred to the acyl
acceptor amine, forming an isopeptide bond (deacylation). Alternatively, hydrolysis
of the thioester bond leads to deamidation, converting the glutamine into a glutamic
acid residue (2). The transamidation, using food-grade microbial transglutaminase
(mTGase), masks glutamine residues of gliadin causing a down-regulation of immune

57
response and a positive changes in the phenotype of the antigen-specific immune
response in models of gluten sensitivity (3).
Interestingly, mTGase was shown to exhibit a similar site specificity as tTGase on
synthetic peptides, but lacked deamidase activity (1). Therefore in this study, we
examined the biochemical features of gluten following the two-step transamidation
reaction of wheat flour.
This enzymatic treatment was associated with a progressive production of new forms
of gliadins with higher molecular weights that became soluble in water. We
confirmed that transamidation reactions performed on wheat flour could successfully
prevent the formation of immunodominant gluten peptides. Furthermore, we
evidenced for the first time the ability of mTGase to inhibit the activity of the
celiacogenic p31–49 in Caco-2 cells.

58
Materials and Methods
Transamidation reaction of wheat flour
A commercial preparation of bread wheat flour was used. A total of 100 g of flour
was suspended in 8 volumes of 0.4 M NaCl and stirred for 10 min to extract
albumin/globulins. The flour suspension was then centrifuged at 1000 g for 10 min,
and the supernatant was discarded. The recovered pellet was exhaustively washed
with water to eliminate any residual soluble protein, suspended in 1 volume of water
containing 20 mM pharmaceutical grade lysine ethyl ester (K-C2H5; NutraBio.com,
Middlesex, NJ, USA) and 8 U/g flour mTGase (ACTIVA®WM, specific activity: 81-
135 U/g, Ajinomoto Foods Hamburg, Germany), and incubated for 2 hrs at 30°C.
The suspension was then centrifuged at 3000 g for 10 min, and the soluble protein
fraction (spf) was recovered in the supernatant. In the two-step process, the pellet was
suspended again in 1 volume of water containing a final concentration of 20 mM K-
C2H5 and fresh mTGase (8 U/g flour) and incubated for 3 hrs at 30°C. For the
control, the sample was prepared using the same protocol in the absence of mTGase.
Purification of protein fractions
Gliadin was extracted from wheat flour by a modified Osborne protocol (4). Briefly
wheat flour was resuspended in 0.4 M NaCl and was centrifuged at 1000 rpm for 10
min. Then the pellet was washed for several times and gliadin was extracted in 70%
ethanol. The supernatant, which contained gliadin, was recovered and freeze-dried.

59
Protein content was measured by Bradford analysis (5) and qualitatively analyzed by
8-16 % denaturing SDS-PAGE and Coomassie R-250 blue staining.
Gliadin stock solution was prepared by suspending 10 mg gliadin in 50 mM acetic
acid.
Peptide synthesis and transamidation reaction
Peptide p31–49 was synthesized by GeneCust Europe Laboratoire de Biotechnologie
du Luxembourg S.A (Dudelange, Luxembourg). Purity (N95%) was assessed by the
manufacturer by means of RP-HPLC and mass spectrometric analyses.
Transamidation reaction of the peptide was carried out in 25 mM ammonium
bicarbonate (pH 8.3) containing 20 mM K-C2H5 and 0.015 U/10 μg peptide mTGase
at 37 °C for 30 min.
Western blotting
Equivalent protein aliquots (50 μg) were fractionated by 15% denaturing SDS-PAGE,
blotted onto ImmobilonTM PVDF membranes (Millipore SpA, Vimodrone-MI, Italy)
and probed with in-house produced mouse anti-sera toward native gliadins (1:10,000
dilution), transamidated gliadins (K-gliadins; 1:10,000 dilution) or spf (1:10,000
dilution). After washing, the membranes were incubated with biotinylated
streptavidin-peroxidase-conjugated antibodies against mouse IgGs (Dako SpA,
Milano, Italy, 1:5,000 dilution). Finally, immunodetection was performed using

60
Hyperfilm and ECL reagents (Amersham-GE Healthcare Europe GmbH, Glattbrugg,
Switzerland).
Chymotryptic digestion of native gliadin, spf and transamidated gliadins
Enzymatic digestion was performed in 50 mM Tris-HCl (pH 8.5), at 37°C for 4 hrs
using an enzyme to substrate ratio of 1:50 w/w.
Cell culture and in vitro experiments
Caco-2 cells obtained from the American Type Culture Collection (ATCC,
Gaithersburg, MD, USA) were used for experiments between passages 16 and 35.
Cells were cultivated in DMEM (GIBCO—Life Technologies, Grand Island, NY,
USA) containing 10% FCS (GIBCO), 100 units/mL penicillin–streptomycin
(GIBCO) and 1 mM glutamine at 37 °C in a humidified 5% CO2 atmosphere. For the
experiments, the cells were seeded at a density of 30 × 104/cm
2 and used on the third
day post-confluence.

61
Analysis of tTGase transamidating activity
Caco-2 cells were incubated for 90 min with 0.5 μM EZ-Link Pentylamine-Biotin
(ThermoFisher Scientific, Erembodegem, Belgium) and treated for the last 60 min
with either native or transamidated peptide p31–49 (25–100 μg/mL). The positive
control was cells treated with 10 μM ionomycin (Sigma-Aldrich, St. Louis, MO,
USA). After incubation cells were lysed and protein aliquots (100 μg) were coated
into the wells of a 96-well plate. The wells were blocked with 10% bovine serum
albumin, then incubated with peroxidase-conjugated streptavidin (1:3000 dilution,
BioLegend, London, UK) in 5% bovine serum albumin. To reveal peroxidase
activity, 3,3′,5,5′-tetramethylbenzidine (Sigma-Aldrich) was added to each well and,
after stopping the reaction with H2SO4, absorbance was read at 450 nm. Data were
evaluated by one-way analysis of variance (ANOVA) and Tukey test post-hoc
analysis. P <0.05 was selected as the level denoting a statistically significant
difference. Proteins from cell lysates were also analysed to SDS-PAGE, blotted onto
Immobilon™ PVDF membranes, probed with peroxidase-conjugated streptavidin and
visualized by ECL reagents.
Analysis of tTGase protein expression
Caco-2 cells were incubated for 48 h with either native or transamidated peptide p31–
49 (25–100 μg/mL). Equivalent protein aliquots were fractionated by 12% SDS-
PAGE, blotted onto Immobilon™ PVDFmembranes (Millipore) and probed with

62
anti-tTGase monoclonal antibody (TG II, clone CUB7402, Lab Vision Corporation,
Fremont, CA, USA) followed by incubation with secondary anti-mouse antibodies
conjugated with peroxidase (Sigma-Aldrich). Finally, immunodetection was
performed using Hyperfilm and ECL reagents (Amersham). Blotted membranes were
subsequently stained with Coomassie blue R-250 as loading control.
Results
Different solubilization of gluten components following transamidation of wheat
flour
During the transamidation process the production of isopeptide bonds by catalytic
activity of mTGase dramatically decreased the gliadin content of wheat flour to 17.4
+ 0.7% (mean + SD; Table 1), in agreement with previous results (3). Interestingly,
glutenins were also partially recovered following transamidation treatment (47.4 +
2.5%, Table 1). The residual insoluble gliadins and glutenins were further reduced to
7.6 + 0.5% and 7.5 + 0.3%, respectively, after a second transamidation step (Figure
1A, upper panel). In particular, gliadin content essentially decreased to 40% during
the first enzyme step, whereas glutenins resulted more markedly reduced during the
second transamidation step. In line with these results, the water-soluble protein
fraction (spf) increased during the first enzyme step and peaked at the end of this step
(Figure 1A, lower panel). To identify molecular changes produced in the residual
alcohol-soluble fraction (gliadins) during the transamidation reaction, protein aliquots

63
were collected at different times of transamidation process and analyzed by SDS-
PAGE. An interesting result was distinct bands in the 29-45 kDa mw range, that
characterize native gliadins. This native gliadin decreased during the two-step
reaction, substituted by a protein with high molecular weight, in fact we observed a
transient appearance of new components having a MW>200 kDa (Figure 1B).

64
Figure 1: Biochemical and physical modifications of gliadins and glutenins after
transamidation. A, Upper panel, percentage of residual insoluble prolamins at different times of a
two-step transamidation reaction; lower panel, relative soluble protein fraction (spf) yield
expressed in mg protein/g flour; the dotted line identifies the two enzymatic steps. B, SDS-PAGE
analysis of proteins isolated from flour after removal of the albumin/globulin fraction and at
different times of a two-step enzymatic reaction. Molecular weights of protein markers are indicated
(kDa).

65
Immune cross-reactivity of different gliadin forms after flour transamidation
To analyze transamidation products and establish the relationship among gliadins, spf
and new hmw alcohol-soluble components, we produced mouse anti-sera toward spf
and transamidated insoluble gliadins (K-gliadins). Then we examined cross-reactivity
among different forms. Western blot analysis performed by probing protein samples
with an anti-native gliadin antiserum confirmed the loss of immune cross-reactivity in
K-gliadins and spf, in agreement with previous findings (4) (Figure 2A). On the
contrary, anti-K-gliadins antibodies identified epitopes in all examined samples.
These findings confirmed the presence of native gliadin-specific determinants in K-
gliadins. (Figure 2B). Adsorption of serum with native gliadins caused a strongly
reduced reactivity with native gliadin in all samples but, interestingly, pre-treated
serum still recognized high molecular weight (hmw) bands suggesting that this new
epitopes were generated following transamidation of gliadin with K-C2H5 (Figure
2C). Probing with anti-spf serum also showed cross-reactivity of spf with native
gliadins. Interestingly, this antiserum weakly cross-reacted with proteins in K-
gliadins of similar hmw (Figure 2D). Coomassie blue staining of electrophoresed
proteins confirmed that Western blot results were not due to differences in protein
content (Figure 2E).

66
Figure 2: Cross-reactivity of different transamidated form.
A-D Western Blot of different forms of transamidated gliadin, probing with anti-native gliadin A; B
anti K gliadin untreated serum; C anti K gliadin preadsorbed with native gliadin; D anti-spf. E
SDS-PAGE of different amount of native gliadin, spf and K-gliadin.

67
We found that this feature was not a technical artifact, as it was confirmed by using
two different preparations of immunogens and anti-sera (Figure 3A).
Next, we examined the kinetic of transamidation process by probing with anti-K-
gliadins antibodies. Results reported in Figure 3B showed the appearance of hmw
proteins after only 0.5 hrs of treatment. In agreement with data reported in Figure 1B,
positive staining of hmw bands in the alcohol-soluble fraction was short-lived and
there was a progressive reduction of cross-reacting proteins in the 45-29 kDa mw
range.

68
Figure 3: Cross-reactivity of transamidated gliadin forms. A, Western blot analysis of high
molecular weight (hmw) components in spf and K-gliadin fractions by comparing two different
preparations of anti-spf serum. B, Western blot analysis of proteins isolated from flour at different times of a two-step enzymatic reaction and probed with anti-K-gliadin antiserum.
Transamidation modified gliadin activity
Mass spectrometric analysis of native gliadin digest identified four known
celiacogenic peptides, α-gliadin p56–68 (6), α-glia-33-mer (7), peptide #19(8), and α-
gliadin p31–49, which contained peptide fragment p31-43 known to induce intestinal
damage into CD patients (9).

69
Analysis of transamidation reaction mixture by MALDI–TOF-MS clearly indicated
that celiacogenic peptide, p31–49 was modified by the addition of one K-C2H5
moiety and this modified form accounted for more than 90% (data not shown).
To specifically evaluate the biological effects of transamidation products we analyzed
α-gliadin p31–49, using a synthetic peptide p31–49.
It was previously shown that Ca2+
mobilization induced by gliadin peptide p31–43
activated the crosslinking function of intracellular tTGase in Caco-2 cells. Therefore,
we tested the ability of p31–49 to activate tTGase in this cell line and how this
activity was modified on transamidation. We used pentylamine-biotin as tTGase
substrate and quantify the intracellular transamidating activity in Caco-2 cells by a
microplate assay on cell homogenates obtained after incubation with different
amounts of p31–49. As previously reported for p31–43 (10), we found that tTGase
activity was higher in p31–49-treated cells than in cells exposed to pentylamine-
biotin alone (Figure 6A), in particular at a dose of 25 μg/mL. Interestingly, in cells
treated with transamidated p31–49 there was not increase of tTGase activity. Also
protein aliquots were fractionated by SDS-PAGE, blotted and probed with
peroxidase-conjugated streptavidin. Results showed a 78 kDa band, presumably
tTGase, that resulted stronger in samples incubated with native p31–49 than in those
treated with transamidated peptide at the doses of 25 and 50 μg/mL (Figure 6B).
Finally, we evaluated the effect of modified p31–49 on tTGase expression in Caco-2
cells. Western blot analysis of different amounts (1–10 μg) of lysates from cells

70
incubated with 25 μg/mL native/transamidated p31–49 indicated that there was not
differences in tTGase expression into examined samples (Figure 6C).

71
Figure 6: Biological activity of peptide p31–49 and its transamidated form in Caco-2 cells. A,
Quantification of tTGase activity from lysates of Caco-2 cells incubated with 25–100 μg/mL native
or transamidated p31–43 in the presence of pentylamine-biotin. Values are the means ± SD of at
least 3 independent experiments performed in duplicate;* P <0.05. B, tTGase activity of protein
fractions from Caco-2 cells incubated with 25 and 50 μg/mL peptide and analyzed following SDS-
PAGE and blotting by using peroxidase-streptavidin as probe and ECL detection (upper); post-
Coomassie staining of the blotted membrane (bottom), C, Western blot analysis of different protein
fractions from Caco-2 cells incubated with 25 μg/mL peptide using an anti-tTGase monoclonal
antibody as probe. K-p31–49: transamidated p31–49.

72
Discussion and Conclusion
In this part of the thesis we studied transamidation reaction and characterized
transamidated products to identify their immunological property. We showed that the
two-step transamidation reaction of wheat flour with lysine ethyl ester produced
water-soluble gluten and modified immunogenic and not immunogenic epitopes of
gliadins.
Gluten proteins are divided into two classes based on their solubility in alcohol–water
solutions: gliadins (soluble) and glutenins (insoluble).
In this study firstly we found that the solubility of both gliadins and glutenins was
drastically changed following mTGase treatment of wheat flour in the presence of K-
C2H5. Also during transamidation step there was different yields of solubilized
gliadins and glutenins.
More specifically, we found that in the first step of transamidation was produced the
soluble protein fraction (spf) which resulted mainly enriched in gliadins, indicating
that these prolamins represent a favorite substrate for mTGase.
We reported that hmw forms (>200 kDa) were transiently produced in the residual
insoluble gliadins during the enzymatic treatment. In parallel, we observed a decrease
of 29–45 kDa gliadins. The appearance of hmw forms was confirmed by Western
blot analysis and indicated the formation of neo-epitopes following transamidation in
both K-gliadins and spf.

73
Interestingly, these experiments also revealed traces of hmw spf forms in the alcohol-
soluble fraction, further indicating that they are mainly formed by gliadin monomers
and K-C2H5, though the contribution of glutenins cannot be completely excluded.
In this study we found that gliadin peptides containing immunogenic epitopes were
completely modified by the transamidation reaction. mTGase modified the same
glutamine residues that are involved into celiacogenic epitopes.
Taken together, biochemical and structural data pointed out the existence of a mixed
population of transamidated gliadins that included partially transamidated gliadins
showing the classical mw range; discrete hmw gliadins, fully transamidated, that
progressively acquired water-solubility. Interestingly, the transamidated forms were
characterized by a complete loss of immune cross-reactivity toward anti native
gliadin antibodies. So the transamidation of wheat flour in the presence of K-C2H5
causes effective epitope masking of gliadin.
To demonstrate that transamidation reaction mediated by mTGase modified gliadin
activity we used a syntetic celiacogenic peptides p31–49.
It is known that p31–43 induced interleukin (IL)-15 secretion in enterocytes which
caused the disappearance of the villi in CD. Subsequent studies showed that p31–43
altered the trafficking of vesicular compartments in the intestinal Caco-2 cell and
induced cell proliferation and crypts hyperplasia in CD (11). More recently, gliadin
peptide p31–43 was reported to induce tTGase activation in Caco-2 cells thought

74
Ca2+
release (10). This activation could contribute to the inflammatory response in
CD.
Our data indicated that p31–49, like p31–43, increased the intracellular specific
activity of tTGase in Caco-2 cells. Importantly, transamidated p31–49 was unable to
induce a similar activity, probably it was unable to evoke an increase of Ca2+
in the
cytosol.
In summary, the detoxification protocol of wheat flour based on the use of food-grade
mTGase and K-C2H5 largely produced fully transamidated water-soluble gliadins that
lost their bio-immune activity.

75
References
1 Gianfrani C, Siciliano RA, Facchiano AM, Camarca A, Mazzeo MF, Costantini S,
Salvati VM, Maurano F, Mazzarella G, Iaquinto G, Bergamo P and Rossi M.
Transamidation of wheat flour inhibits the response to gliadin of intestinal T cells in
celiac disease. Gastroenterol 2007; 133: 780–89.
2 Fleckenstein B, Qiao SW, Larsen MR, Jung G, Roepstorff P and Sollid LM.
Molecular characterization of covalent complexes between tissue trasglutaminase and
gliadin peptides. J Biol Chem 2004; 279: 17607-16.
3 Lombardi E, Maurano F, Bergamo P, Bozzella G, Luongo D, Mazzarella G,
Rotondi Aufiero V, Iaquinto G, Rossi M. Selective inhibition of gliadin immune
reactivity by transamidation of wheat flour with microbial transglutaminase. J Leukoc
Biol 2013; 93: 479–88.
4 Weegels PL, Hamer RJ, Schofield JD. RP-HPLC and capillary electrophoresis of
subunits from glutenin isolated by SDS and Osborne fractionation. J Cereal Sci 1995;
22: 211–24.
5 Bradford M. A rapid and sensitive method for the quantitation of microgram
quantities of protein utilizing the principle of protein-dye binding. Anal. Biochem
1976; 72: 248–54.
6 Arentz-Hansen H, Körner R, Arntzen MO, Quarsten H, Vader W, Kooy YM,
Lundin KE, Koning F, Roepstorff P, Sollid LM, McAdam SN. The intestinal T cell
response to alpha-gliadin in adult celiac disease is focused on a single deamidated
glutamine targeted by tissue transglutaminase. J Exp Med 2000; 191: 603–12.
7 Qiao SW, Bergseng E, Arntzen MØ, Xia J, Fleckenstein B, Khosla C, Sollid LM.
Antigen presentation to celiac lesion-derived T cells of a 33-mer gliadin peptide
naturally formed by gastrointestinal digestion. J Immunol 2004; 173: 1757–62.
8 Dørum S, Arntzen MØ, Qiao SW, Holm A, Koehler CJ, Thiede B, Sollid LM,
Fleckenstein B.The preferred substrates for transglutaminase 2 in a complex wheat
gluten digest are peptide fragments harboring celiac disease T-cell epitopes. PLoS
One 2010; 5: 14056.
9 Maiuri L, Ciacci C, Ricciardelli I, Vacca L, Raia V, Auricchio S, Picard J, Osman
M, Quaratino S, Londei M. Association between innate response to gliadin and
activation of pathogenic T cells in coeliac disease. Lancet 2003; 362: 30–37.
10 Caputo I, Secondo A, Lepretti M, Paolella G, Auricchio S, Barone MV, Esposito
C. Gliadin peptides induce tissue transglutaminase activation and ER-stress through
Ca2+
mobilization in Caco-2 cells. PLoS One 2012; 7: 45209.
11 Barone MV, Zanzi D, Maglio M, Nanayakkara M, Santagata S, Lania G Miele E,
Ribecco MT, Maurano F, Auricchio R, Gianfrani C, Ferrini S, Troncone R, Auricchio
S. Gliadin-mediated proliferation and innate immune activation in celiac disease are
due to alterations in vesicular trafficking. PLoS One 2011; 6: 17039.

76
Chapter 4
Characterization of immunomodulatory molecules and
their adsorption on Bacillus subtilis spores
“manuscript still in preparation”

77
Introduction
As described in the Chapter 1 only gluten free diet alleviates the symptoms of CD
and normalizes antibody levels and the intestinal mucosa (1). On the other hand, the
research of alternative therapeutic approaches is very active. In particular, we focused
our attention on possible immunomodulatory strategies based on the use of modified
gliadin by food-grade microbial transglutaminase (mTGase), which caused positive
change of immune response.
Recently, as described in Chapter 3 we characterized the products of a two-step
transamidation process and demonstrated that this enzymatic treatment prevents the
formation of immunodominant gluten peptides (2).
Therefore in this part of the study we wanted to immunologically characterize
modified gliadin to identify a specific components responsible of
immunomodulatory properties. Firstly, we characterized soluble transamidated
gliadin (spf) and used its to induce an immune response into DQ8 mice to verify the
phenotype of immune response. Then, we compared responses of native and modified
gliadin and concluded that spf induced a phenotypic shift of the immune response.
Another molecule with previously characterized beneficial property in celiac disease
was conjugated linoleic acid (CLA). In particular, it CLA caused a decrease of
gliadin toxicity and had a protective effect against oxidative stress induced by gliadin
(3).Therefore, in the second part of the study we adsorbed spf and CLA on spores
surface to evaluate the effectiveness of these tools as immunomodulatory strategies.

78
Materials and Methods
Gliadin preparation and transamidation reaction
Native and modified gliadin were extracted from wheat flour by a modified Osborne
protocol (4). In briefly, a total of 100 g of flour was suspended in 8 volumes of 0.4 M
NaCl and stirred for 10 min to extract albumin/globulins. The flour suspension was
then centrifuged at 1000 g for 10 min, and the supernatant was discarded. Then, the
pellet was washed several times to remove any residual soluble protein. To obtained
modified gliadin the pellet was suspended in a solution containing 20 mM
pharmaceutical grade lysine ethyl ester (K-C2H5; NutraBio.com, Middlesex, NJ,
USA) and 8 U/g flour mTGase (ACTIVA®WM, specific activity: 81-135 U/g,
Ajinomoto Foods Hamburg, Germany), and incubated for 2 hrs at 30°C. The
suspension was then centrifuged at 3,000 g for 10 min, and the soluble protein
fraction (spf) was recovered in the supernatant. Protein content was measured by
Bradford analysis (5).
Gliadin and Spf stock solution were prepared by suspending 10 mg protein in 50 mM
acetic acid.
Reverse Phase Cromatography (RP-HPLC)
The components of native gliadin and soluble transamidated gliadin were separated
by micro-RP-HPLC (column μRPC C2/C18 PC 3.2/3, SMART, Pharmacia). 2,5 mg
of native gliadin was suspended in 1 ml of 10% buffer B according Wieser et al 1994

79
(6) while 2,5 mg of soluble transamidated gliadin (spf) was suspended in 1ml buffer
A. The elution system were: (A) water with 0.1% trifluoric acid and (B) acetonitrile
(90% v/v), water (10%), 0.1% trifluoric acid. Elution was performed by a linear
gradient from 25 to 80% solvent B at a flow rate 100 μl/min and monitored at 280nm.
The eluates were collected in fractions that were dried in a Speed-Vac centrifuge
(Savant instruments, Inc. Farmingdale, NY, USA), lyophilized and stored at -20°C.
The amount of protein in each fraction was determined by Bradford Test (5). The spf
fractions were analysed by 12.5% SDS-PAGE (7).

80
Immunization Protocol
Transgenic mice expressing the HLA-DQ8 molecule were maintained in pathogen-
free conditions at our animal facility (Accreditation No. DM.161/99). DQ8 mice
maintained for several generations on a gluten free diet and used at the age of 6-12
wk. These experiments were approved by the National Institutional Review
Committee and performed in accordance with European regulations (EU Directive
2010/63/EU). In immunization experiments, mice were injected intraperitoneally
(i.p.) with gliadin or spf (100 μg) emulsified with FCA (day 0) or IFA (days 7 and
14). Mice were sacrificed on day 21 to collect spleens.
Isolation of T cells from spleen of DQ8 mice
Spleens were passed through a 40 μm cell strainer (Falcon, BD BIOSCIENCES,
Erembodegem, Belgium) to separate cells. The splenic suspension was further treated
with Tris-buffered ammonium chloride solution to remove erythrocytes. Then CD4+T
cells from spleens of immunized mice were separated by using the CD4+T Cell
Isolation Kit (Miltenyi Biotec Srl, Calderara di Reno-BO, Italy). Finally, CD4+T cells
aliquots (5x10⁵) were added to plates with mature dendritic cells (mDCs).

81
DCs and CD4+T cells co-cultures
Immature dendritic cells (iDCs) were purified by bone-marrow of femurs and tibiae
of naïve DQ8 mice according with a published protocol (8). On day 8 non-adherent
DCs were harvested by gentle pipetting and were placed in 48-well plates (2.5 x 10⁵
cells/well), incubated with gliadin or protein fractions of gliadin (28 μg/ml); spf or
protein fractions of spf (50 μg/ml) for 18 h and finally pulsed with LPS for 4 h to
stimulate maturation of DCs. After 5x10⁵
CD4+ T cells were added to mDCs and co-
cultures for 72 h. Supernatants were collected and analyzed for IFN-γ and IL-10
protein levels by ELISA using commercial kits.
Binding assay
In total, 2x10⁹ spores were incubated with 125 μg spf from the stock solution in 200
μl of 50 mM sodium acetate, pH 4.0 (adsorption solution), for 1 h at RT by
continuous shaking (9). The spores were centrifuged at 13000 g for 10 min and
washed three times to remove unbound spf. Also 2x10⁹ spores were incubated with
different concentration (90 μg; 47μg and 19 μg) of conjugated linoleic acid (CLA),
isomers’s mixture (Tonalin TG80; Cognis) in the same buffer used for spf. The
amount of CLA bound to spores was determined by measuring absorbance at 236 nm
(max absorbance value for CLA) (10).
Spf adsorption was evaluated by dot blot and Bradford analyses (5). The dot blot
analysis was performed as previously described (11). The membrane was probed with

82
an in-house-produced mouse polyclonal antibody against spf (1:5000 dilution) and
then with biotinylated streptavidin peroxidase-conjugated anti-mouse IgGs (1:10000
dilution; Dako SpA, Milano, Italy). Immunodetection was performed using ECL
reagent (Amersham-GE Healthcare Europe GmbH, Glattbrugg, Switzerland) and a
ChemiDoc XRS system (Bio-Rad Laboratories, Hercules, CA).
The amount of spf or CLA adsorbed spores was calculated as the difference in the
protein content or fatty acid content of the adsorption solution before and after
incubation.
Statistical analysis
To determine statistically significant differences among the various experimental
groups were used one-way ANOVA. P < 0.05 was selected to denote a significant
difference.

83
Results
Analysis of immune response induced by native gliadin and transamidated
gliadin (spf)
In the first experiment mDCs were pulsed with gliadin or spf and then were co-
cultured with gliadin or spf specific CD4+T cells. We observed that only gliadin-
pulsed mDCs, as previously described, induced production of IFN-γ in gliadin
CD4+T cells (Figure 1 panel A). Interestingly, we showed that spf specific CD4
+T
cells also recognized gliadin (Figure 1 panel C) but they induced an increase of
gliadin-specific IL-10 production. Also, spf specific CD4+T cells produced IL-10
when DCs was pulsed with spf (Figure 1 panel D).

84
Figure 1: In vitro analysis of the gliadin or spf-specific CD4+T cell mediated response. mDCs
(2x10⁵ cells/well) that were not pulsed (diamond) or that were pulsed with gliadin (square) or spf
(triangle) were incubated with CD4+T cells (5x10
5 cells/well) isolated from DQ8 mice parenterally
immunised with gliadin or spf.

85
Isolation of gliadin and spf fractions
The different components of gliadin and spf were separated by RP-HPLC. We
observed that in the elution profile of gliadin there were seven majority peaks that
were separately collected (Figure 2A). Interestingly, in the elution profile of spf there
were only three different majority peaks (Figure 2B) that were analysed by SDS-
PAGE. Electrophoresis analysis of spf fractions showed that the each fraction was
characterized by discrete protein bands with different migration rates (Figure 2B).
Figure 2: Reverse-Phase Chromatography. Purification of gliadin and spf by Reverse-Phase
Chromatography with SMART System. A) Gliadin chromatogram at 280 nm. B) Spf chromatogram
at 280 nm and SDS-PAGE of three protein fragments identified.

86
In vitro analysis of immune response to different gliadin fractions
In the next experiment we incubated iDCs with different fractions of gliadin and then
pulsed with LPS to induce their maturation (mDCs). mDCs were incubated with
autologous gliadin- or spf-specific CD4+T cells for 72 h. To evaluate the phenotype
of the induced immune response we assessed the secretion of IL-10 and IFN-γ in the
supernatant and expressed these values as IL-10/IFN-γ ratio. We observed that all
gliadin fractions stimulated higher production of IFN-γ and a lower production of IL-
10 in gliadin-specific CD4+T cells (Figure 3 left panel). Interestingly, we showed that
these fractions induced an increase of IL-10 production in spf-specific CD4+T cells,
as a higher IL-10/IFN-γ ratio was reported. In particular, we identified fractions 3 and
4 as components that significantly increased this ratio in comparison with the other
fractions and the same whole gliadin (Figure 3 right panel).

87
Figure 3: In vitro analysis of gliadin fraction immune response. mDCs (2x10⁵ cells/well) that
were pulsed with gliadin or its fractions were incubated with CD4+T cells (5x10
5 cells/well) isolated
from DQ8 mice parenterally immunised with gliadin or spf. We calculated IL10/IFN-γ to define
phenotypic of immune response. The results represent one of three independent experiments, and
the bars are the median values. There were 5-6 mice in each group. *, P < 0.05.
Next, mDCs pulsed with the different spf fractions were incubated with autologous
spf-specific CD4+T cells. We observed that IL-10 production in spf-specific CD4
+T
cell was mainly related to the components in fraction 3 of spf (Figure 4).

88
Figure 4: In vitro analysis of spf peptide fragments’s immune response. mDCs (2x10⁵
cells/well) that were pulsed with spf or its fractions were incubated with CD4+T cells (5x10
5
cells/well) isolated from DQ8 mice parenterally immunised with spf. The columns are the mean ±
SD of duplicate analyses.
Adsorption of spf on Bacillus subtilis spores
As previously described, gliadin was adsorbed to Bacillus subtilis spores in a 50 mM
sodium acetate pH 4. Accordingly, we used the same conditions to adsorb spf to
spores. We tested different strains of spores: autoclaved wt, autoclaved or not CotH
and autoclaved or not CotE. To verify binding efficiency we did a dot blot analysis
using two strains wt and CotH and we observed that mutant CotH bound spf with
major efficiency. Also in this case we observed that the adsorption was stable (Figure
5).

89
Figure 5: Dot Blot analysis of spf adsorbed spores. Serial dilutions of untreated wt and CotH
spores were analyzed following the adsorption reaction of spf’s different amount (10μg, 25μg and
50μg).
Then, to determine the amount of spf adsorbed spores we did Bradford test and we
showed that CotE, autoclaved or not, bound the highest amount of proteins (Figure
6).

90
Figure 6: Quantitative analysis of spf adsorbed spores. The amount of spf (μg) adsorbed on
2x10⁹ spores was calculated as the difference in the protein concentration of the adsorption solution
before and after incubation. The data represent the mean ± SD of three different experiments.

91
The exact amounts of spf adsorbed spores were reported in Table 1.
Table 1: Percentage of spf adsorbed on wt and mutant spores
Adsorption of CLA on Bacillus subtilis spores
As described previously, for adsorption reaction 2*109 spores were used in 50 mM
sodium acetate pH 4. The strain used for this reaction was mutant CotE and we tested
different concentration of CLA isomers’s mixture. We showed that CLA isomers
bound spores with high efficiency when the concentration of fatty acid in the
adsorption buffer decreases (Figure 7 left panel). In fact we observed about 100%
adsorption by incubating 19 μg of CLA isomers with spores (Figure 7 right panel).
Also, we demonstrated that the adsorption of CLA to spores was stable.

92
Figure 7: Quantitative analysis of CLA adsorbed spores. Percentage of adsorbed CLA (Left
panel) or μg CLA (right panel). The amount of CLA adsorbed on 2*109
spores was calculated as the
differences of fatty acid content between before and after incubation.
adsorbed CLA
adso
rptio
n so
lutio
n 0.05
%CLA
adso
rbed
CLA
(dil 1:
5)
adso
rbed
CLA
(dil 1:
10)
adso
rbed
CLA
(dil 1:
25)
was
h
0
50
100
150
ad
so
rb
ed
CL
A
(%
to
tal)
adsorbed CLA
adso
rptio
n so
lutio
n
adso
rbed
CLA
adso
rptio
n so
lutio
n
adso
rbed
CLA
adso
rptio
n so
lutio
n
adso
rbed
CLA
was
h
0
20
40
60
80
100
ad
so
rbed
CL
A (
g)
93
Discussion and Conclusion
In this study we shown that spf specific CD4+T cells were able to induce a
phenotypic shift of gliadin dependent immune response. In a previous study it has
been demonstrated that when spleen cells, isolated from immunized mice, were
challenged with spf there was a down-regulation of gliadin specific immune response
(12). So, we further characterized spf and used this protein to induce a regulatory
response into DQ8 mice.
Firstly we confirmed that in vitro challenge with spf induced a down regulation of the
gliadin specific CD4+T cells response. Interestingly, we demonstrated that spf
specific CD4+T cells recognized also native gliadin. So we confirmed that spf derived
from modification of native gliadin still harboring gliadin T cell epitopes. Also, we
showed that spf specific CD4+T cells induced an increase of IL-10 produced by
native gliadin. Another interesting data was the ability of spf specific CD4+T cells to
induce an IL-10 dependent immune response. Notably, the IL10/IFN-γ ratio
confirmed that spf induced a regulative response and we showed that fraction 3,
separated by reverse phase chromatography, gave a major contribution to this
production. So, we concluded that spf was an important molecule with a potential
immunomodulatory activity, able to down-regulate the inflammatory response.
Then, we analysed the immune response of seven different gliadin protein fractions
separated by reverse phase chromatography. We observed that all protein fractions
stimulated gliadin specific CD4+T cells to produce high level of IFN-γ but,

94
interestingly, when gliadin fraction- pulsed mDCs interacted with spf specific CD4+T
cells, there was an increase of IL-10 production. Also interestingly two fraction
significantly induced a phenotype shift toward a regulative response. So, we have
further confirmed the immunomodulatory ability of spf. Then, we adsorbed this
molecule to spores in the perspective to induce a regulative response into DQ8 mice.
We showed that spf stably bound spores and that strain CotE had a major binding
efficiency for spf. This strain has also been used to bind CLA, another
immunomodulatory molecule. We found that also this molecule was stably adsorbed
to spores.
We concluded that this system represent a promising tool to induce an
immunomodulatory response in inflammatory conditions.
Experiments are planned to use bacterial spores adsorbed with the characterized
molecules as mucosal adjuvants aimed at restoring the regulatory response toward
gliadin.

95
References 1 Green PH, Cellier C. Celiac disease. N Engl J Med 2007; 357: 1731-43
2 Mazzeo MF, Bonavita R, Maurano F, Bergamo P, Siciliano RA and Rossi M.
Biochemical modifications of gliadin induced by microbial trasglutaminase on wheat
flour. Bioch et Biophys Acta (BBA)-General Subjects 2013; 1830: 5166-74
3 Bergamo P, Gogliettino M, Palmieri G, Cocca E, Maurano F, Stefanile R,
Balestrieri M, Mazzarella G, David C and Rossi M. Conjugated linoleic acid protects
against gliadin-induced depletion of intestinal defenses. Mol Nutr Food Res 2011; 55:
248-56
4 Weegels PL, Hamer RJ, Schofield JD. RP-HPLC and capillary electrophoresis of
subunits from glutenin isolated by SDS and Osborne fraction. J Cereal Sci 1995; 22:
211-4.
5 Bradford MM. A rapid and sensitive method for the 1 quantitation of microgram
quantities of protein utilizing the principlexin of protein-dye binding. Anal Biochem
1976; 72: 248-54.
6 Wieser H, Seilmeier W and Belitz HD. Quantitative Determination of Gliadin
Subgroups from Different Wheat Cultivars. J Cereal Sci 1994; 19: 149-55
7 Laemmli UK. Cleavage of structural proteins during the assembly of the head of
bacteriophage T4. Nat 1970; 227: 680-5
8 Lutz MB, Kukutsch N, Ogilvie ALJ, Ro ßner S, Koch F, Romani N, Schuler G. An
advanced culture method for generating large quantities of highly pure dendritic cells
from mouse bone marrow. J Immunol Methods 1999; 223: 77–92.
9 Huang JM, Hong HA, Van Tong H, Hoang TH, Brisson A, Cutting SM. Mucosal
delivery of antigens using adsorption to bacterial spores. Vaccine 2010; 28: 1021-30.
10 Kappor R, Reaney M and Westcott ND. Conjugated linoleic acid oils.
BaileyIndustrial Oil and Fat Products. 6th ed; Canada 2005.
11 Hinc K, Isticato R, Dembek M, Karczewska J, Iwanicki A, Peszyńska-Sularz G,
De Felice M, Obuchowski M, Ricca E. Expression and display of UreA of
Helicobacter acinonychis on the surface of Bacillus subtilis spores. Microb Cell Fact
2010; 9: 2.
12 Lombardi E, Maurano F, Bergamo P, Bozzella G, Luongo D, Mazzarella G,
Rotondi Aufiero V, Iaquinto G, Rossi M. Selective inhibition of gliadin immune
reactivity by transamidation of wheat flour with microbial transglutaminase. J Leukoc
Biol 2013; 93: 479–88.


