The world’s leading sustainability consultancy
Policy Implementation in British Columbia, Canada
Leslie Bol (ERM)
IAIA Symposium November 14, 2017
The business of sustainability
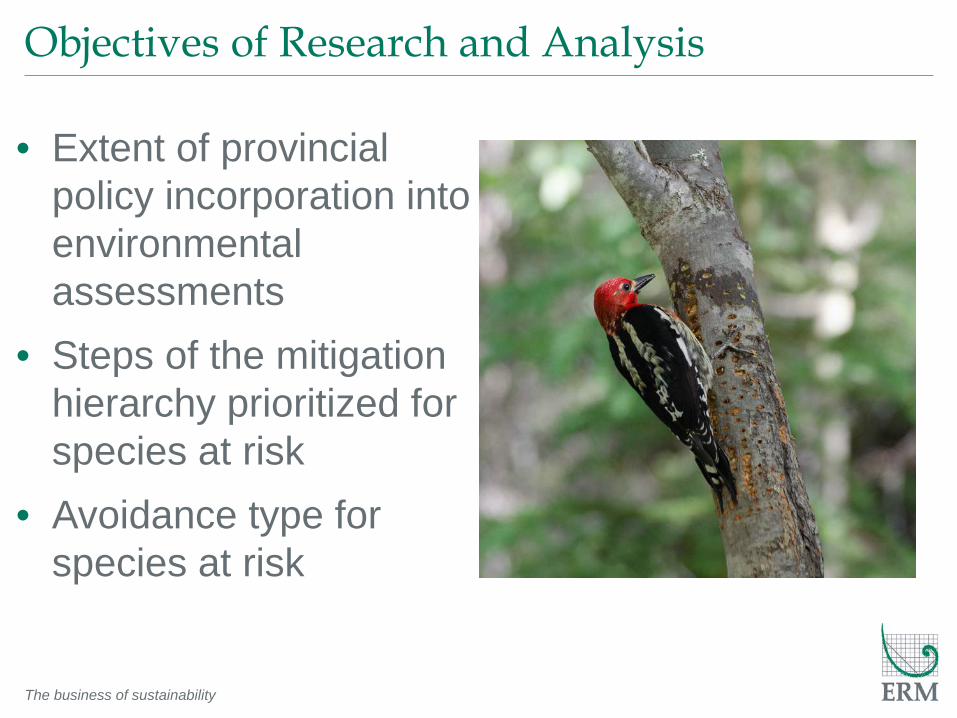
Objectives of Research and Analysis
• Extent of provincial policy incorporation into environmental assessments
• Steps of the mitigation hierarchy prioritized for species at risk
• Avoidance type for species at risk

The business of sustainability
Mitigation Hierarchy Location
Means Timing
Avoid
Minimize
Restore On-Site
Offset

The business of sustainability
Species at Risk in Canada
• Committee on the Status of Endangered Wildlife in Canada (COSEWIC)
• Species added to Schedule 1 of Species at Risk Act (SARA)
• Critical habitat identified for Threatened and Endangered species

The business of sustainability
Best Case Scenario Mitigation Hierarchy
0 20 40 60 80 100
Offsetting
On-Site Restoration
Minimization
Avoidance
Percent

The business of sustainability
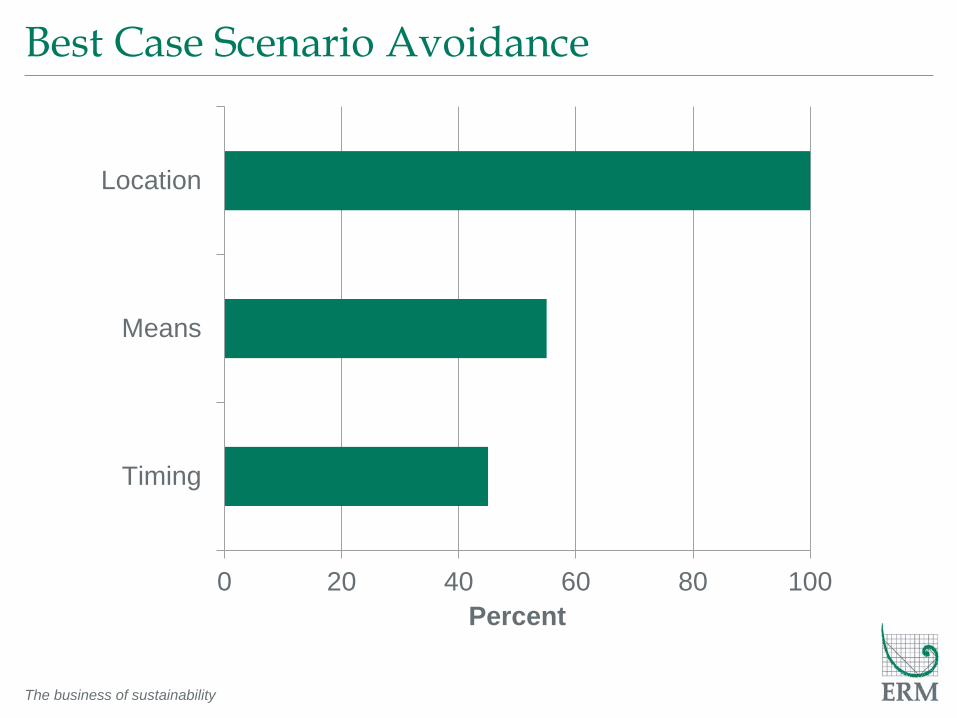
Best Case Scenario Avoidance
0 20 40 60 80 100
Timing
Means
Location
Percent

The business of sustainability
Methods – Policy Integration
• Reviewed publically available projects from BC Environmental Assessment Office (EAO)
• Determined percentage of EAO documents with policy citation
• Reviewed proponent documents for species at risk
• Determined percentage of proponent documents with policy citation

The business of sustainability
Methods – Adherence to Mitigation Hierarchy
• Did not further consider species without project interaction or residual effect
• Categorized mitigation according to hierarchy for: • Species specific mitigation (e.g. olive-sided
flycatcher) • Group specific mitigation (e.g. migratory birds) • Generic mitigation (e.g. restoration on-site through
reclamation)
• Determined percentage of application of each mitigation step
The business of sustainability
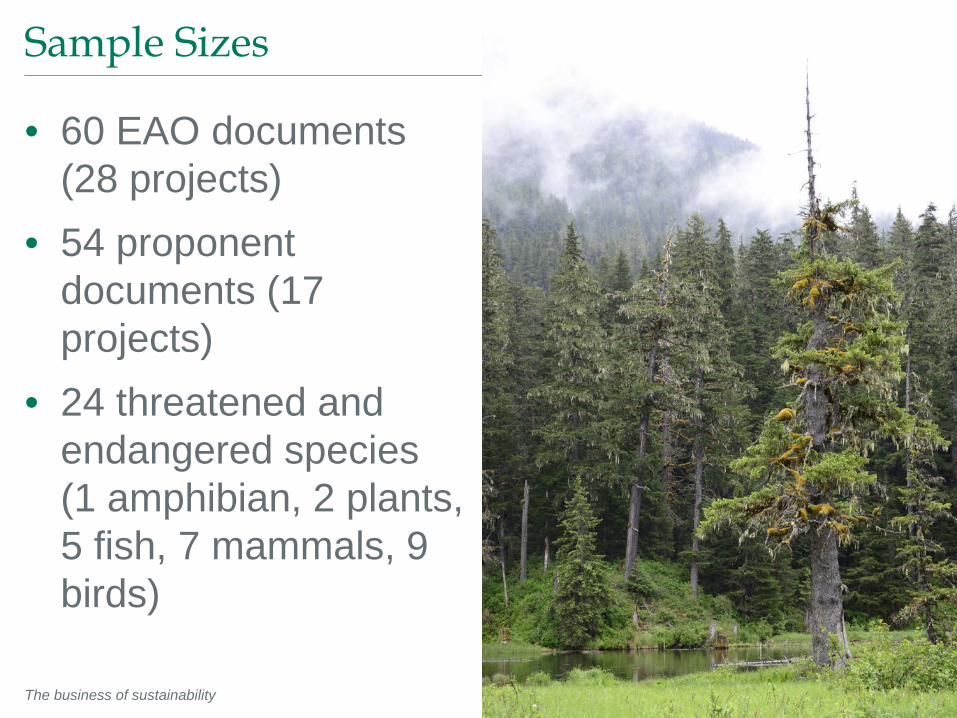
Sample Sizes
• 60 EAO documents (28 projects)
• 54 proponent documents (17 projects)
• 24 threatened and endangered species (1 amphibian, 2 plants, 5 fish, 7 mammals, 9 birds)

The business of sustainability
Percent of Documents with Policy Citation
37 35
42
33 33
41
0
57
33
100
0102030405060708090
100
Total 2014 2015 2016 2017
Perc
ent
EAO Documents (n = 60) Proponent Documents (n = 17)

The business of sustainability
Percent of EAO Documents with Citations
44 43
26
0
10
20
30
40
50
60
70
80
90
100
ApplicationInformation
Requirements (n=16)
Assessment Report(n=21)
Certificate Table ofConditions (n=23)
Perc
ent
EAO Document Type

The business of sustainability
Percent of Proponent Chapters with Citations
10
0
30
22
41
0
10
20
30
40
50
60
70
80
90
100
Vegetation(n=10)
Fish (n=7) Wildlife(n=37)
TotalChapters
(n=54)
OverallApplication
(n=17)
Perc
ent
Species at Risk Group

The business of sustainability
Best Case Scenario Mitigation Hierarchy
0 20 40 60 80 100
Offsetting
On-Site Restoration
Minimization
Avoidance
Percent

The business of sustainability
Adherence to Mitigation Hierarchy
0 20 40 60 80 100
OFFSETTING
RESTORATION ON-SITE
MINIMIZATION
AVOIDANCE
Percent Application of Mitigation per Species at Risk
Generic Species/Group Specific
The business of sustainability
Best Case Scenario Avoidance
0 20 40 60 80 100
Timing
Means
Location
Percent

The business of sustainability
Prevalence of Avoidance Types
0 20 40 60 80 100
TIMING
MEANS
DESIGN
LOCATION
Percent Application of Avoidance Mitigation per Species at Risk
Generic Species/Group Specific

The business of sustainability
Mitigation Hierarchy According to Group
0 20 40 60 80 100
Offsetting
On-site Restoration
Minimization
Avoidance
Percent Application of Mitigation
Raptors (n=5) Migratory Birds (n=20) Mammals (n=18) Fish (n=3)

The business of sustainability
Avoidance According to Group
0 20 40 60 80 100
Timing
Means
Location
Percent Application of Avoidance
Raptors (n=5) Migratory Birds (n=20) Mammals (n=18) Fish (n=3)

The business of sustainability
Mitigation Hierarchy According to Status
0 20 40 60 80 100
Offsetting
On-site Restoration
Minimization
Avoidance
Percent Application of Mitigation
Endangered (Schedule 1) Threatened (Schedule 1) Endangered (COSEWIC)

The business of sustainability
Avoidance According to Status
0 20 40 60 80 100
Timing
Means
Location
Percent Application of Avoidance
Endangered (Schedule 1) Threatened (Schedule 1) Endangered (COSEWIC)

The business of sustainability
Conclusions
• Policy incorporation <50%
• Minimization prioritized over avoidance
• Avoidance is primarily timing and not spatial
• Increasing expectation of spatial avoidance as priority would benefit species at risk


