
Planning for evacuation: insights from an efficient network design
model
Georgios Kalafatas, [email protected]
Srinivas Peeta1, [email protected]
School of Civil Engineering
Purdue University, USA
550 Stadium Mall Drive
West Lafayette, IN 47907-2051
Office: CIVL 4148
Phone: 765-494-2209
Fax: 765-496-7996
1. Corresponding author
Kalafatas and Peeta 2
Abstract: In the context of evacuation planning at a strategic level, an efficient model is
proposed to augment network capacity under a budget constraint so as to enhance operational
performance under a security threat. Contra-flow strategies and lane additions are considered for
capacity augmentation. The corresponding mathematical programming model is obtained
through a case-specific graph theoretic transformation of Daganzo’s cell transmission model
(CTM), exploiting problem characteristics to enhance computational efficiency. This paper
focuses on experiments and sensitivity analyses to provide insights: (i) on the computational
efficiency of the proposed model, and (ii) for strategies for evacuation planning and operations.
Sensitivity analyses are performed for a test network in terms of the budget for contra-flow
operations, the evacuee population size, and the amount and spatial distribution of origin-
destination (O-D) demand. The results suggest that there is a threshold budget beyond which
benefits, in terms of the network clearance time, are negligible. They also indicate that the
network clearance time varies linearly with uniformly distributed population size. Finally,
greater spatial uniformity of O-D demand reduces clearance times, suggesting that specifying
multiple destinations in the safety zone may lead to more efficient evacuation in many instances.
From a response standpoint, the study suggests that operational effectiveness requires pre-
determined contra-flow strategy plans with designated and well-trained personnel, rather than
just reacting to a security event in real-time.
CE Database Subject Headings: Evacuation, network design, traffic models, budget allocation,
spatial analysis
Kalafatas and Peeta 3
Introduction
Contemporary research in evacuation planning has modeled and proposed solutions for several
aspects of the evacuation problem (Sheffi et al. 1982, Southworth 1991, Wolshon 2001, Cova
and Johnson 2003, Tuydes and Ziliaskopoulos 2004, Kwon and Pit 2005, Sbayti and
Mahmassani 2006, Kalafatas and Peeta 2006). The studies have addressed the optimal routing
and allocation of contra-flow options for specific population sizes and spatial distributions of
origin-destination (O-D) demand. However, this problem is computationally burdensome (Li et
al. 2003, Tuydes and Ziliaskopoulos 2006) and has been proven to be NP-Hard (Johnson et al.
1978). Hence, a comprehensive sensitivity analysis is a challenging proposition because of the
computational requirements involved as well as the need for exact knowledge on all parameters
of each evacuation scenario. However, not all parameters of the evacuation scenario are readily
available a priori, at least currently. This suggests the need for extensive sensitivity analysis so
as to provide emergency response planners useful insights to develop response deployment
plans, which motivates the need for a computationally efficient formulation.
The study formulation derives from the authors’ previous work (Kalafatas and Peeta,
2006) based on the cell transmission model (Daganzo 1994, 1995). It differs in that a
mathematical transformation is proposed for extensive sensitivity analysis, as described later.
Kalafatas and Peeta (2006) proposed an exact formulation for the evacuation network design
problem (ENDP) to augment network capacity under a budget constraint so as to enhance
operational performance under a security threat. They considered contra-flow strategies and lane
additions as the network design options for capacity augmentation. However, the formulation is
computationally burdensome and cannot enable extensive sensitivity analysis at a strategic
planning level; strategic planning requires a significant number of experiments in order to
Kalafatas and Peeta 4
capture the uncertainty on the exact values of problem parameters (for instance, the size and the
spatial distribution of the population).
The experiments performed in the current study focus only on the contra-flow option for
capacity augmentation. Each contra-flow option is associated with budgetary costs and number
of trained personnel requirements. However, data on budget and personnel needs for contra-flow
options require a dedicated study on the part of the responsible transportation agency. Hence,
these data are difficult to obtain currently, though this may not be an issue in the future as
security/disaster preparedness plans become more commonplace. To circumvent this issue, the
budget and trained personnel constraints are substituted by an equivalent constraint on the
number of contra-flow options allowed: the number of reversed links (RL). Reversed links are
links in which at least one lane has its traffic flow direction reversed so as to enhance the
capacity of traffic flow in the opposite direction. Hence, the number of reversed links allowed is
used as a proxy for the budget and number of trained personnel required for the corresponding
contra-flow option.
Another characteristic of the model is the use of a static traffic signal control strategy,
whereby a single phase operates at an intersection for the entire evacuation period. Since
evacuation can lead to near-gridlock conditions, our strategy allows flow at any intersection on
only one of multiple conflicting right-of-ways. Hence, crossing flows are precluded when
determining the capacity enhancements to optimize operational performance. The actual flow
direction (for example, north-south or east-west) at each intersection is determined as part of the
optimization process. The resulting re-designed network is time-invariant, which on one hand it
indicates a straight forward planning/application proposal to planners, emergency officers and

Kalafatas and Peeta 5
practitioners, and on the other hand it is not capable of directly modeling time-depending link
capacities.
The paper is organized as follows. The mathematical transformation methodology of the
Kalafatas and Peeta (2006) formulation is summarized here in terms of the properties that allow
the efficient formulation for the ENDP as well as the associated mathematical program of the
formulation. Then, the experiment setup for the study experiments is described, including the
description of the test network, the selected scenario sets, and the computational resources used.
The first scenario set addresses the impact of the magnitude of the available budget resources on
evacuation response performance. The second set analyzes the effect of the evacuee population
size, which is also used as a proxy for problem size, to obtain insights on how the formulation
scales. The third set studies the impact of the quantity and the spatial distribution of the
evacuation O-D demand. Other scenario sets, not examined in the present study, like traffic
conditions at the time of evacuation or other combinations of the above scenarios, can attract the
interest of specialized evacuation planners. It is exactly this need that motivates the
computationally efficient formulation introduced in this paper; the need to evaluate and draw
insights from multiple potential situations in a timely manner. The paper concludes with a
summary of the key insights on evacuation planning obtained through the sensitivity analyses.
Methodology
The primary barriers to efficient sensitivity analysis in the evacuation planning problem context
are its time-dependent nature, complexity, and large size in terms of network topology and
population. Initially, the authors proposed an exact mixed-integer time-dependent formulation
(Kalafatas and Peeta 2006) based on the cell transmission model for the evacuation network
design problem. However, given the NP-Hard nature of the problem, the solutions for various

Kalafatas and Peeta 6
instances (scenarios) required computational times of the order of days before optimality was
achieved. This motivated the need to develop a more efficient formulation.
Traffic flow characteristics and the planning focus of the evacuation problem of interest
were used to develop a more efficient formulation. The key observation which led to the new
efficient formulation is that the maximum capacity is achieved at free-flow speed conditions in
the flow-density relationship of the cell transmission model (Fig. 1). While this is not necessarily
true as per the Highway Capacity Manual (Highway Capacity Manual 2000), it is a reasonable
and convenient assumption for planning applications due to their long-term focus. That is, the
planning stage of the evacuation problem is focused primarily on generating action plans that
allow the strengthening of the evacuation preparedness in the intermediate stage. For example, a
key planning objective could be the identification of network links where capacity should be
added strategically to enhance the expected evacuation-related performance under an actual
disaster. Hence, traffic need not be assigned at traffic densities greater than the traffic density
where maximum flow is achieved. This leads to better bounds for the variables representing
traffic density. Also, the modeling of backward propagating traffic waves becomes redundant
under low traffic densities. Under these conditions, a time-expanded network representation is
revealed (Fig. 2) that enables the more efficient formulation.
Extending the aforementioned notion, we assign traffic to intermediate cells up to the
minimum traffic density at which maximum flow is achieved. This is because we can still
achieve the optimal solution in a stricter solution space, since the traffic density variables have
stricter bounds and optimality depends on the maximum flow out of the network rather than the
maximum density of individual cells.

Kalafatas and Peeta 7
Hence, the following propositions aided the development of the more efficient
formulation:
Proposition 1. Backward propagating traffic waves are not meaningful at traffic densities of light
traffic conditions. Therefore, the constraints explicitly handling the backward propagating traffic
waves are redundant.
Proposition 2. The maximum occupancy (density) variable in our network design problem
becomes equivalent to the maximum flow variable. Hence, in the formulation, the maximum
occupancy variable and the associated equation can be eliminated.
Proposition 3. Flow in intermediate cells is constrained at free-flow speed only since congestion
does not contribute towards optimality. Physically speaking, evacuees will be allowed to exit the
source cells only if free-flow conditions are guaranteed along the entire route from the origin to
the destination cell. Interestingly, this can be interpreted as an extreme application of staged
evacuation at the level of the individual evacuee.
In summary, since the traffic network in the evacuation zone is expected to be highly
congested in an actual scenario, the planning focus is on enhancing capacity to maximize flow
out of the evacuation zone, and not on operational routing patterns. Hence, while these
propositions may, at times, seem to lack in routing realism vis-à-vis actual evacuation conditions,
they are part of the non-inferior frontier of the initial network design formulation. Thus, the
propositions are proposed not for the exact representation of the traffic realities of the evacuation
problem, but as an efficient mathematical programming transformation which enables the
development of a minimum cost flow routing sub-structure for the evacuation planning problem
(as illustrated by the modifications to the CTM cell representations in Fig. 2), thereby
significantly reducing the computational cost. It should be noted here that the insights from the

Kalafatas and Peeta 8
inner graph sub-structure of the evacuation problem represent the stimulus for an exact Graph
Theoretic version of the CTM (or GTCTM) proposed by Kalafatas and Peeta (2007).
The resulting formulation, labeled iENDP, is mathematically described hereafter.
Parameters
The parameters of the formulation are:
B The total available budget.
,C i C∈ The set of all cells.
RC The subset of source cells (origin cells).
SC The subset of destination cells.
,E j E∈ The set of cell connectors.
,M m M∈ The set of network design options.
,T t T∈ The set of discrete and constant time intervals.
0iQ The initial maximum number of vehicles that can flow into or out of cell i C∈ .
miQ The maximum number of vehicles that can flow into or out of cell
( )\ R Si C C C∈ ∪ , if network design option m M∈ is implemented.
jQ The maximum number of vehicles that can flow through cell connector j E∈ .
( )iΓ The set of the successor cells of cell i C∈ .
1( )i−Γ The set of the predecessor cells to cell i C∈ .
mc The cost of implementing design option m M∈ .
tid The demand (inflow) at source cell Ri C∈ in time interval t T∈ .
mia The binary indicator showing if the network design option m is associated with

Kalafatas and Peeta 9
the cell i C∈ .
jlβ The binary indicator showing if the flow in cell connector j E∈ can be restricted
by intersection l L∈ .
τ The constant discrete time interval’s length.
Variables
The variables of the formulation are:
iQ The maximum number of vehicles that can flow into or out of cell i C∈ .
jp The binary variable indicating whether the flow in cell connector j E∈ is
restricted by an intersection constraint.
tis The number of vehicles in an origin or destination cell ( )R Si C C∈ ∪ not
propagated to the next cell in time interval t T∈ .
tix The number of vehicles in cell i C∈ in time interval t T∈ .
tjy The number of vehicles moved by cell connector j E∈ in time interval t T∈ .
mz The binary decision variable indicating if the network design option m M∈ is
selected.
Formulation
The objective of the formulation (1) is to minimize the total time spent in the network.
minimize
\ S
ti
t T i C Cxτ
∈ ∈
⋅∑ ∑ (1)

Kalafatas and Peeta 10
subject to:
( )1
1t ti j
j i
x y−
−
∈Γ
= ∑ ( )\ ,R Si C C C t T∀ ∈ ∪ ∀ ∈ (2)
( )
t tj i
j iy x
∈Γ
=∑ ( )\ ,R Si C C C t T∀ ∈ ∪ ∀ ∈ (3)
( )1
1 1t t t ti i j i
j i
s d y x−
− −
∈Γ
+ + =∑ ( ),R Si C C t T∀ ∈ ∪ ∀ ∈ (4)
( )
t t ti j i
j ix y s
∈Γ
= +∑ ( ),R Si C C t T∀ ∈ ∪ ∀ ∈ (5)
R
T ti i
i C t T i Cx d
∈ ∈ ∈
=∑ ∑∑ (6)
ti ix Q≤ ( )\ ,R Si C C C t T∀ ∈ ∪ ∀ ∈ (7)
( ) 1mm i
m Mz a
∈
⋅ ≤∑
i C∀ ∈ (8)
( ) ( )01 m m mi i m i i m i
m M m MQ a z Q a z Q
∈ ∈
⎛ ⎞= − ⋅ ⋅ + ⋅ ⋅⎜ ⎟⎝ ⎠∑ ∑
( )\ ,R Si C C C t T∀ ∈ ∪ ∀ ∈ (9)
( )m mm M
z c B∈
⋅ ≤∑
(10)
tj j jy p Q≤ ⋅ ,j E t T∀ ∈ ∀ ∈ (11)
1jl jj E
pβ∈
⋅ ≤∑
l L∀ ∈ (12)
0tix ≥ ,i C t T∀ ∈ ∀ ∈ (13)
0tjy ≥ ,j E t T∀ ∈ ∀ ∈ (14)
0tis ≥ ( ),R Si C C t T∀ ∈ ∪ ∀ ∈ (15)

Kalafatas and Peeta 11
0iQ ≥ i C∀ ∈ (16)
{ }0,1jp ∈ j E∀ ∈ (17)
{ }0,1mz ∈ m M∀ ∈ (18)
The constraints are discussed here. Constraints (2) to (7) address the traffic flow
modeling to route evacuees. Constraints (8) to (12) model the network design options, and
constraints (13) to (18) represent the non-negativity and integrality constraints.
Constraints (2) and (3) are the mass conservation constraints between cell and cell
connectors for intermediate cells (all cells other than the source and destination cells). Each
equation corresponds to a conservation of flow equation at each of the two nodes of an
intermediate cell’s graph representation, as illustrated in Fig. 2. The number of vehicles tix in
cell i C∈ in time interval t T∈ equals the total cell inflow (constraint (2)) and the total cell
outflow (constraint (3)). They establish traffic movement at free-flow conditions for intermediate
cells; all vehicles are propagated to the next cells. Constraints (4), (5) and (6) are the mass
balance equations for origin and destination cells. The characteristic difference between the mass
balance constraints for intermediate ((2) and (3)) and origin and destination cells ((4) and (5)) is
the existence of congestion, as represented by the number of vehicles tis in cell R Si C C∈ ∪ in
time interval t T∈ ; holding of traffic is performed at origin cells till free-flow speed conditions
are guaranteed for the rest of the trip. Accordingly, equations (4) and (5) correspond to a
conservation of flow equation at each of the two nodes of an origin or destination cell’s graph
representation, as illustrated in Fig. 2. Constraint (6) represents conservation of demand; it
ensures consistency between demand generated at the origin cells and the evacuees exiting the

Kalafatas and Peeta 12
network at destination cells. It also holds even if all evacuees are not able to reach destination
cells by the last time interval T . Summarizing, constraints (2) to (6) are the mass balance
constraints of the minimum cost flow sub-structure. Constraint (7) is the maximum cell
occupancy constraint for intermediate cells, and at the same time denotes the maximum flow
propagated to downstream cells. These two statements hold simultaneously due to the
mathematical transformation previously described; traffic density is restricted to be less than or
equal to the minimum traffic density at which the maximum flow is achieved (Fig. 1, Point P2).
It is noted that the occupancy tix and congestion t
is variables for origin and destination cells do
not have a finite upper bound, as is typical in the CTM-related literature.
Constraint (8) restricts the selection of network design options to be at most one for each
cell, since a unique value for the maximum flow iQ must be assigned to every cell. If no
network design option is selected, a cell retains its initial maximum flow 0iQ . This can be seen in
constraint (9), where a cell’s maximum inflow/outflow iQ take values (right hand side) that
correspond either to its default value 0iQ (left component of the right hand side) or the maximum
flow miQ of the selected network design option mz . Constraint (10) is the budget constraint; the
total budgetary cost cannot exceed the total available budget. Constraint (11) reflects both the
cell connector’s individual flow capacity and the intersection flow restriction. Constraint (12)
allows at most one crossing flow to be realized at an intersection; it ensures a static traffic signal
control strategy where a single phase – green or red – is assigned for the whole planning period.

Kalafatas and Peeta 13
Finally, constraints (13) to (16) ensure that the routing variables tix , t
jy , tis and the
maximum cell inflow/outflow capacity variable iQ are real non-negative numbers. Constraints
(17) and (18) state that the network design variables jp and mz are binary.
Experimental Setup
The test network
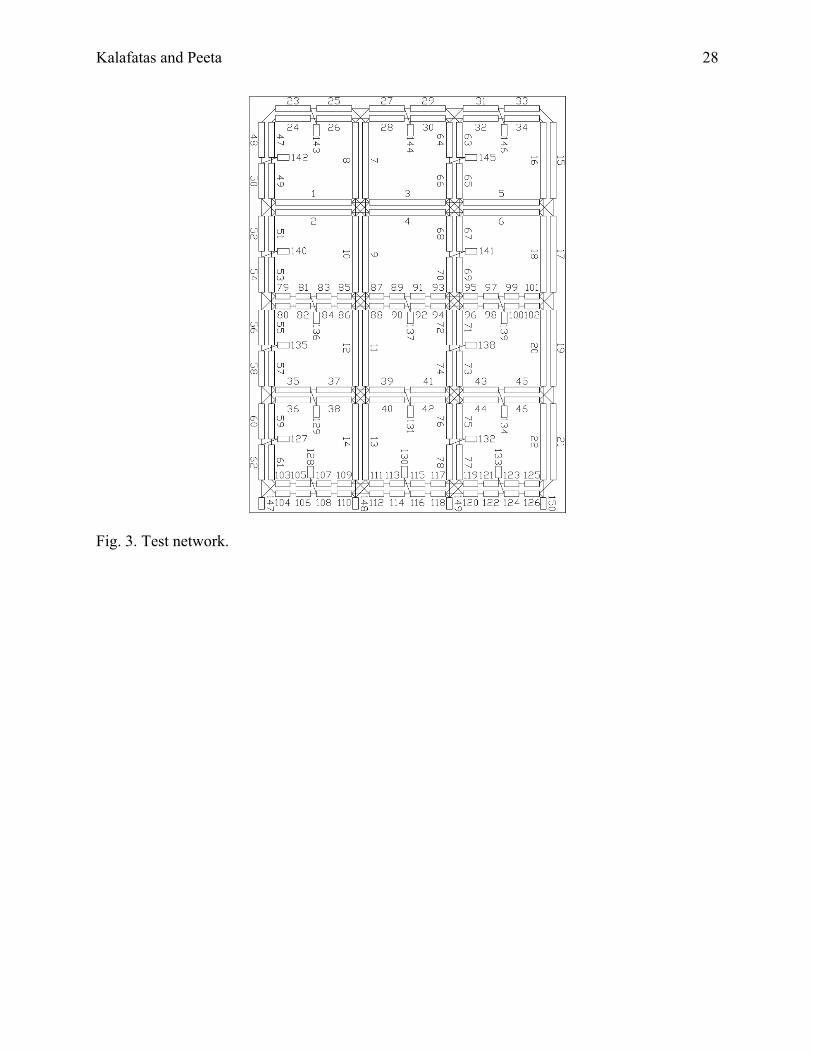
The test network for the study is illustrated in Figure 3 (Kalafatas and Peeta 2006). It consists of
a 3x4 grid network that replicates a dense urban environment with highways (long cells, 1-22),
arterials (medium cells, 24-78) and side streets (short cells, 79-126). From an evacuation
standpoint, the bottom of the network represents the boundary of the evacuation zone (and the
safety zone) to which evacuees are routed (short cells, 147-150) from the origin (source) cells
(short cells, 127-146). The 20 potential origin cells are attached to arterial and side street cell.
The number of evacuees assigned to each source cell depends on the assumed scenario. The cell
parameters for each scenario are shown in Tables 1 to 4 using terminology from the cell
transmission model.
The selected 3x4 grid network appears to be topologically small (neighborhood or small
district size) in comparison to potential evacuation zones (large districts, metropolitan area).
Nevertheless, when thousands of evacuees are assigned in the selected network, it adequately
models evacuation schemes of populated areas under threat, like stadiums, exhibition centers,
governmental buildings, and shopping centers, and proposes certain link capacity additions
which improve the operational performance of the evacuation operation. Also, the proposed
formulation models any topologically large evacuation area and again offers the advantage of
significantly reduced computational times, compared to existing formulations (Tuydes and
Ziliaskopoulos 2004, Kalafatas and Peeta 2006). It can even solve topologically large evacuation

Kalafatas and Peeta 14
areas with the spatio-temporal decomposition of the mass balance constraints, which is outside
the scope of this paper.
Design of experiments
There are three major scenario sets according to the three major parameters studied. They are: (i)
the number of reversed links, (ii) population size, and (iii) the spatial distribution of evacuation
O-D demand. The characteristic parameters of each scenario type are summarized in Table 3.
The first scenario set examines the effect of different levels of resource allocation for the
network design options. Only contra-flow operations are assumed as a network design option,
and the resource allocation is quantified by using the number of reversed links as a proxy. Hence,
reversed links ranging from 0 to 20 are examined for a uniform distribution of 5000 evacuees to
20 sources. It is expected that these experiments will provide insights on the “ideal” levels of
resource allocation for the decision-makers (or planners). The experiments also analyze the
computational time efficiencies.
The second scenario set examines the effect of the population size on the evacuation
performance for a constant number of reversed links, acquired after the analysis of the first
scenario set. The number of reversed links used is the one which leads to the most improvement
in network performance in the first scenario set. For this number of reversed links (eight),
population sizes of 500 to 5000 evacuees are assigned to 20 sources.
The third scenario set examines the effect of the spatial distribution of the transportation
demand for evacuation. 5000 evacuees are assigned to 1 source, 2 sources uniformly, and 20
sources uniformly and randomly, and routed to 1 destination, 2 destinations, and 4 destinations.
It seeks insights on the topological properties of the selected reversed links. Table 4 illustrates
the distribution of demand under the random demand distribution scenario.

Kalafatas and Peeta 15
The three scenarios are evaluated using the network clearance time (as in Fig. 4, 8 and
11), the evacuation rate (as in Fig. 5, 9 and 10), and the graphical view of the test network with
the selected reversed links (as in Fig. 6 and 12). Also, the computational time is analyzed in
Figure 7.
Computational resources
The computing environment consists of a Sun Ultra Enterprise server E6500 with 26 400-MHz
UltraSparc II processors under the multi-user Solaris 7 operating environment with 23 GB of
RAM, 131 GB of swap space, and 8 MB of cache. The GAMS modeling language and CPLEX’s
mixed integer solver were used.
Computational Results
Effect of resource allocation on evacuation performance for uniformly distributed population
The network clearance time is used to analyze the network performance under various resource
(number of reversed links) constraints, as illustrated in Figure 4. The initial network of 0
reversed links entails a clearance time of 22 minutes. The corresponding value for 20 reversed
links is 14 minutes, representing a 36% reduction in network clearance time. This implies that
using the contra-flow option in dense urban environments can lead to significant performance
enhancements under security-related mass evacuation scenarios. An important practical insight is
that most of the potential benefits through contra-flow operations are realized when 8 reversed
links are allocated, which results in a network clearance time of 16 minutes (Fig. 4). It illustrates
that there may be an optimal level of resource allocation beyond which additional benefits are
insignificant. This implies that decision-makers (traffic and/or emergency response operators)

Kalafatas and Peeta 16
can determine effective contra-flow strategies by identifying the best level of resource allocation
from a cost-benefit perspective.
The evacuation rate, illustrated in Figure 5, indirectly illustrates the sigmoid nature of the
cumulative network clearance time curve. The evacuation rate (rate of arrivals to the destination
cells), representing the tangent of the cumulative curve, initially increases. It reaches a maximum
rate, and then keeps decreasing. The various characteristics of the results can be explained by
tracking the time-dependent nature of traffic congestion. Initially, the clearance rate increases as
demand is being serviced below capacity, that is, the network is not congested to capacity. As
further demand is serviced, the network links reach their capacities and that is represented by the
region of the stabilized maximum evacuation rate. As time progresses, demand decreases leading
to reduced evacuation rates until all traffic is cleared from the evacuation zone.
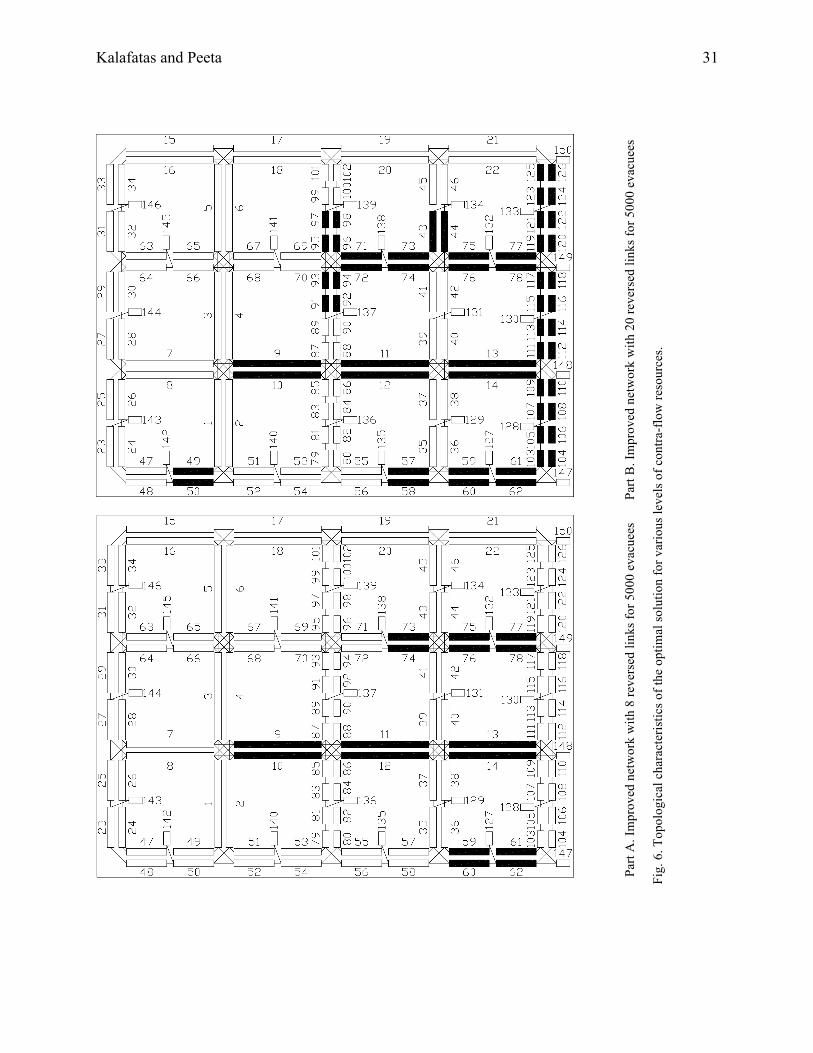
The network design options for 8 RL and 20 RL are illustrated graphically in Figures
6(A) and 6(B), respectively. The selected reversed links for contra-flow operations are indicated
with thick lines. There is a clear topological trend in terms of the formation of contra-flow
corridors with increased resources. The reversed links start forming close to the destination cells
of the test network and extend inwards to form corridors as the number of reversed links
increase. This is because of the directionality of the evacuation flows which makes the capacity
closer to the destinations critical in terms of enabling efficient evacuation rates. After the 8
reversed links case, a general tree structure is exhibited. It is important to note that most of the
improvement of the network clearance time is achieved at the level of 8 reversed links.
Figure 7 indicates the exponential increase in computational times when the number of
reversed links increases. The exponential increase of the computational time is attributed to the
exponentially greater solution space (larger branch and bound tree) generated by the increased
Kalafatas and Peeta 17
number of the feasible combinations of the network design binary variables. Hence, the insights
from the computational times also suggest that beyond some resource allocation levels, the
benefits are marginal.
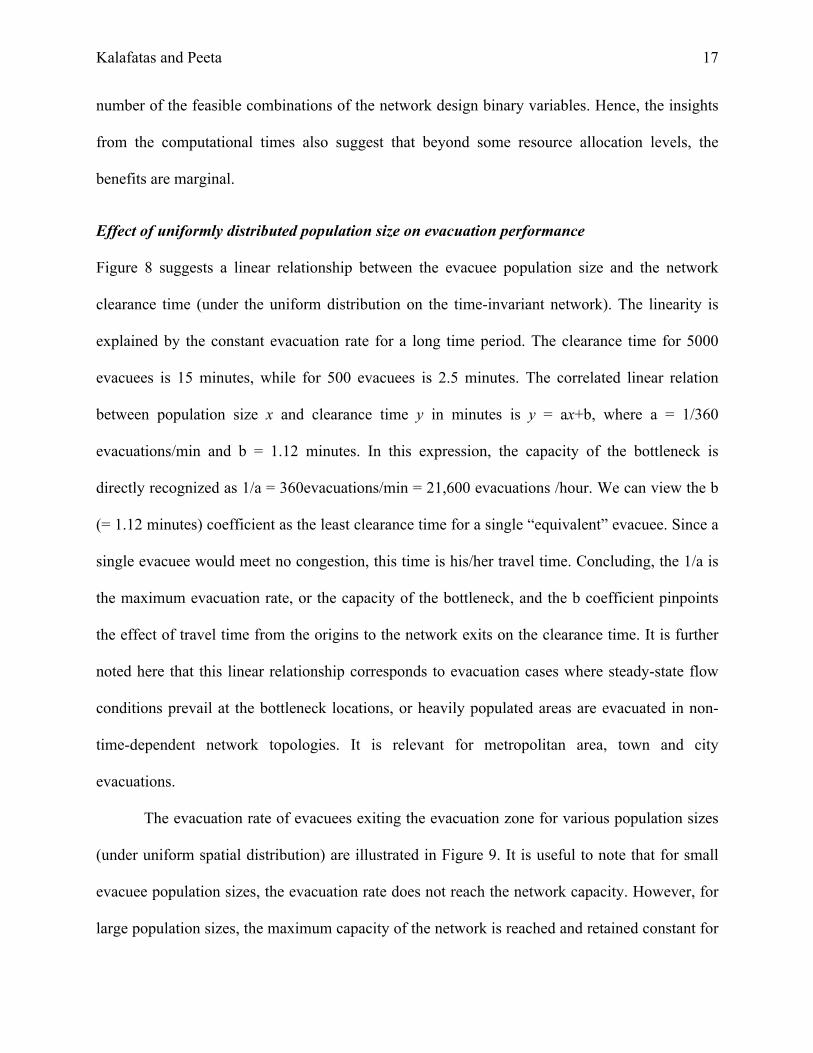
Effect of uniformly distributed population size on evacuation performance
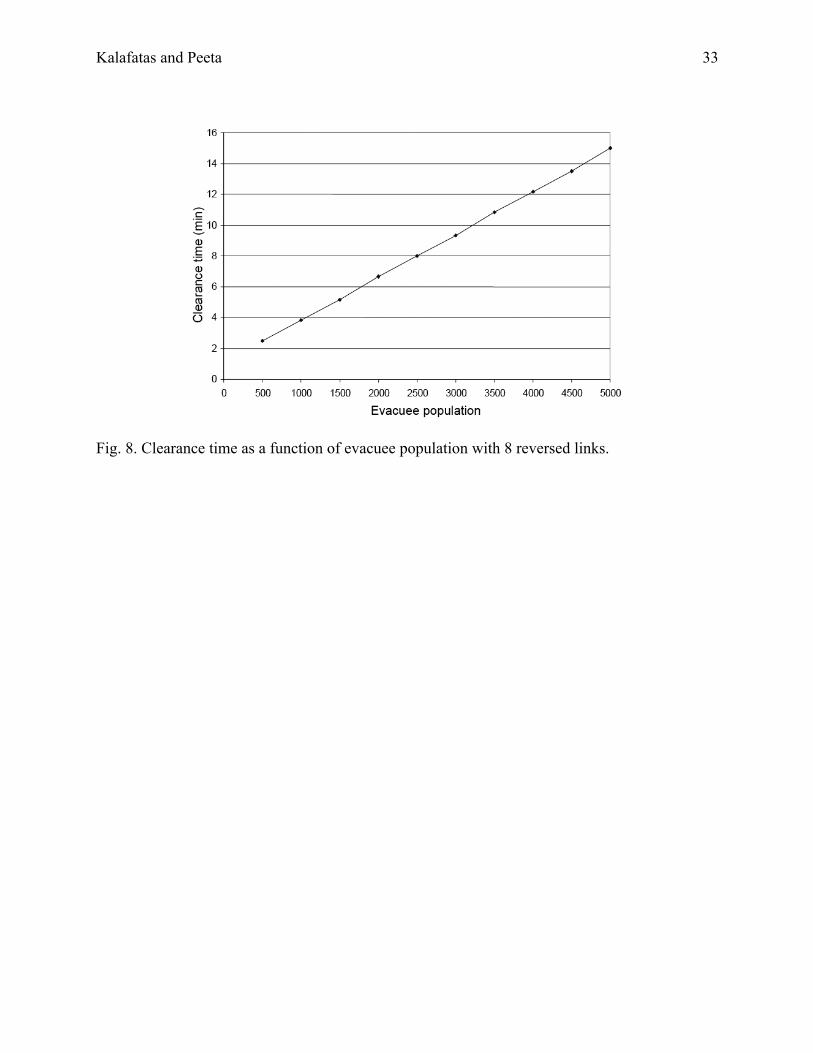
Figure 8 suggests a linear relationship between the evacuee population size and the network
clearance time (under the uniform distribution on the time-invariant network). The linearity is
explained by the constant evacuation rate for a long time period. The clearance time for 5000
evacuees is 15 minutes, while for 500 evacuees is 2.5 minutes. The correlated linear relation
between population size x and clearance time y in minutes is y = ax+b, where a = 1/360
evacuations/min and b = 1.12 minutes. In this expression, the capacity of the bottleneck is
directly recognized as 1/a = 360evacuations/min = 21,600 evacuations /hour. We can view the b
(= 1.12 minutes) coefficient as the least clearance time for a single “equivalent” evacuee. Since a
single evacuee would meet no congestion, this time is his/her travel time. Concluding, the 1/a is
the maximum evacuation rate, or the capacity of the bottleneck, and the b coefficient pinpoints
the effect of travel time from the origins to the network exits on the clearance time. It is further
noted here that this linear relationship corresponds to evacuation cases where steady-state flow
conditions prevail at the bottleneck locations, or heavily populated areas are evacuated in non-
time-dependent network topologies. It is relevant for metropolitan area, town and city
evacuations.
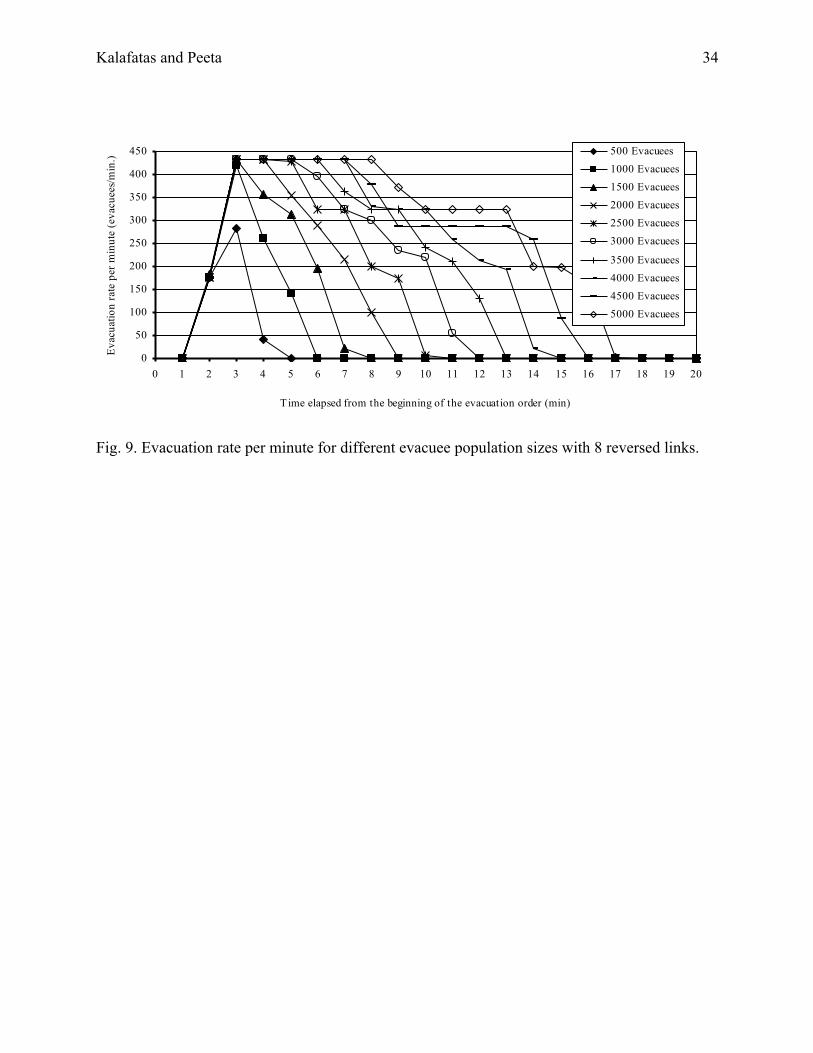
The evacuation rate of evacuees exiting the evacuation zone for various population sizes
(under uniform spatial distribution) are illustrated in Figure 9. It is useful to note that for small
evacuee population sizes, the evacuation rate does not reach the network capacity. However, for
large population sizes, the maximum capacity of the network is reached and retained constant for

Kalafatas and Peeta 18
a long time period, substantially constraining the evacuation performance. In terms of the
solution methodology, this observation also indicates that it is adequate to solve for a population
size that activates the bottleneck capacity and not for the potentially millions of the actual
evacuees in order to design for the optimal contra-flow options. The observation highlights the
direct usage of the minimum-cut maximum-flow theorem for large population sizes that
maintains steady-state flows at the bottlenecks for long periods.
Effect of spatial distribution of evacuation demand on network performance
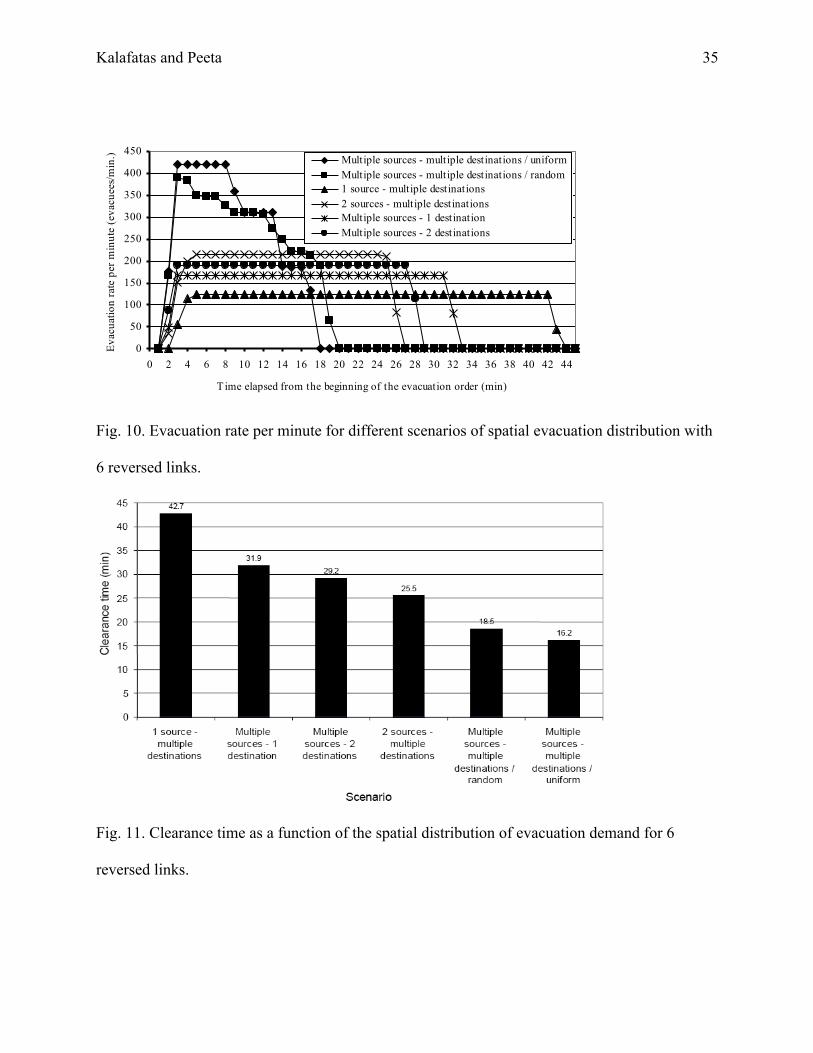
The evacuation rates of evacuees exiting the evacuation zone for various scenarios of spatial
distribution under the 6 reversed links case are illustrated in Figure 10. The examined scenarios
are combinations of single or multiple sources and/or destinations, as illustrated in Table 3.
These scenarios are discrete and cannot be physically examined in a continuous manner. The
results suggest that the patterns with multiple sources, multiple destinations, and uniform spatial
distributions lead to better clearance times (Fig. 11). This trend is reasonable as multiple sources
and destinations avoid local congestion hotspots that can occur due to concentration of demand
at few locations. Further, as expected, the uniform distribution scenario performs better than the
random distribution scenario.
The topology of the selected reversed links is illustrated in Figure 12. The selected
reversed links for contra-flow operations are indicated with thick lines. They indicate that
capacity is added where bottlenecks exist. This is easily observed especially in the scenarios with
1 or 2 sources or sinks. It is important to note that for the scenarios with 1-2 sources to many
destinations, there exist links that do not reduce bottlenecks, like links 52 and 54 for both
scenarios (Fig. 12, part A and B). That is, the bottleneck has been optimally improved, and the
Kalafatas and Peeta 19
reversal of links 52 and 54 does not provide additional benefits (it simply satisfies the 6 reversed
links requirement).
Concluding Comments
This paper presents an extensive sensitivity analysis for the evacuation planning problem. The
parameters studied were the magnitude of the available budget, the population size, and the
amount and spatial distribution of the evacuation demand. The results suggest that there is a
threshold budget beyond which benefits (in terms of the network clearance time) are negligible.
They also indicate that the network clearance time varies linearly with population size. Finally,
greater spatial uniformity of O-D demand reduces clearance times, suggesting that specifying
multiple destinations in the safety zone may lead to more efficient evacuation in many instances.
The study results consistently suggest the presence of efficient sizes of resource
allocation (budget); there is a critical level of resource allocation (in terms of the number of
reversed links) beyond which benefits are trivial (in terms of network clearance time). The level
of resource allocation is directly related to the resources required to efficiently handling the
capacity bottleneck in the studied network. More specifically, it was observed that capacity is
allocated to the exact location of the bottlenecks. Under uniformly distributed population,
capacity was allocated near the evacuation zone exits leading to the formation of corridors and,
eventually, trees. In the case of 1-2 sources or destinations, capacity was allocated to the links in
their vicinity. Furthermore, the network clearance time was observed to be linearly related to the
population size for the same level of resource allocation. Again, the effect of the activated
bottleneck was dominant, especially for large population sizes. Finally, the analysis of the effects
of the spatial distribution of the population indicates that uniformity in the spatial distribution
and multiple origins/destinations lead to lesser clearance times. This was attributed to the fact

Kalafatas and Peeta 20
that a pattern of distributed demand could avoid local congestion hotspots, therefore utilizing
more capacity spatially in the network.
From a response standpoint, the study suggests that operational effectiveness requires
pre-determined contra-flow strategy plans with designated and well-trained personnel, rather
than just reacting to a security event in real-time in an ad-hoc manner.
In summary, it appears that the capacity bottleneck plays a dominant role for large-scale
evacuation problems: (i) it is responsible for the efficient size of resource allocation, (ii) it
strongly influences the network clearance time, and (ii) even for different spatially distributed
patterns, the location of the capacity bottleneck determines the performance. In future research,
we plan to analyze the effects of different network topologies, various driving behavior patterns
under evacuation conditions, the effects of various sigmoid network loading curves, and
alternative traffic conditions, and develop heuristic solution methodologies to further reduce
computational times.

Kalafatas and Peeta 21
References
Cova, T. J., and Johnson, J. P. (2003). “A network flow model for lane-based evacuation
routing.” Trans. Res., Part A, 37, 579-604.
Daganzo, C.F. (1994). “The cell transmission model: A simple dynamic representation of
highway traffic consistent with the hydrodynamic theory.” Trans. Res., Part A, 28(4), 269-
287.
Daganzo, C.F. (1995). “The cell transmission model, Part II: Network traffic.” Trans. Res.,
Part B, 29(2), 79-93.
Highway Capacity Manual. (2000).
Johnson, D.S., Lenstra, J. K., and Rinnoy, A. H. (1978). “The complexity of the network
design problem.” Networks, 8, 279-285.
Kalafatas, G., and Peeta, S. (2006). “Network design for evacuation planning.” Proc., 11th
IFAC Symposium on Control in Transportation System, Delft, Netherlands.
Kalafatas, G., and Peeta, S. (2007). “An exact graph structure for dynamic traffic assignment:
Formulation, properties, computational experience.” Proc., 86th Annu. Meeting, Transp. Res.
Board.
Kwon, E., and Pitt, S. (2005). “Evaluation of emergency evacuation strategies for downtown
event traffic using a dynamic network model.” Proc., 84th Annu. Meeting, Transp. Res.
Board.
Li, Y., T. S. Waller, and Ziliaskopoulos, A. (2003). “A decomposition scheme for system
optimal dynamic traffic assignment models.” Networks and Spatial Economics, 3(4), 441-
455.

Kalafatas and Peeta 22
Sbayti, H., and Mahmassani, H. S. (2006). “Optimal scheduling of evacuation operations.”
Proc., 85th Annu. Meeting, Transp. Res. Board.
Sheffi, Y., Mahmassani, H. S. and Powell, W. B. (1982). “A transportation network
evacuation model.” Trans. Res., Part A, 16(3), 209-218.
Southworth, F. (1991). “Regional evacuation modeling: a state-of-the-art review.” Oak Ridge
National Labs, ORNL/TM-11740.
Tuydes, H., and Ziliaskopoulos, A. (2004). “Network re-design to optimize evacuation
contra-flow.” Proc., 83rd Annu. Meeting, Transp. Res. Board.
Tuydes, H., and Ziliaskopoulos, A. (2006). “Tabu-based heuristic for optimization of
network evacuation contraflow.” Proc., 85th Annu. Meeting, Transp. Res. Board.
Wolshon, B. (2001). “One-way-out: Contra flow freeway operation for hurricane
evacuation.” Natural Hazards Review, 2(3), 105-112.
Kalafatas and Peeta 23
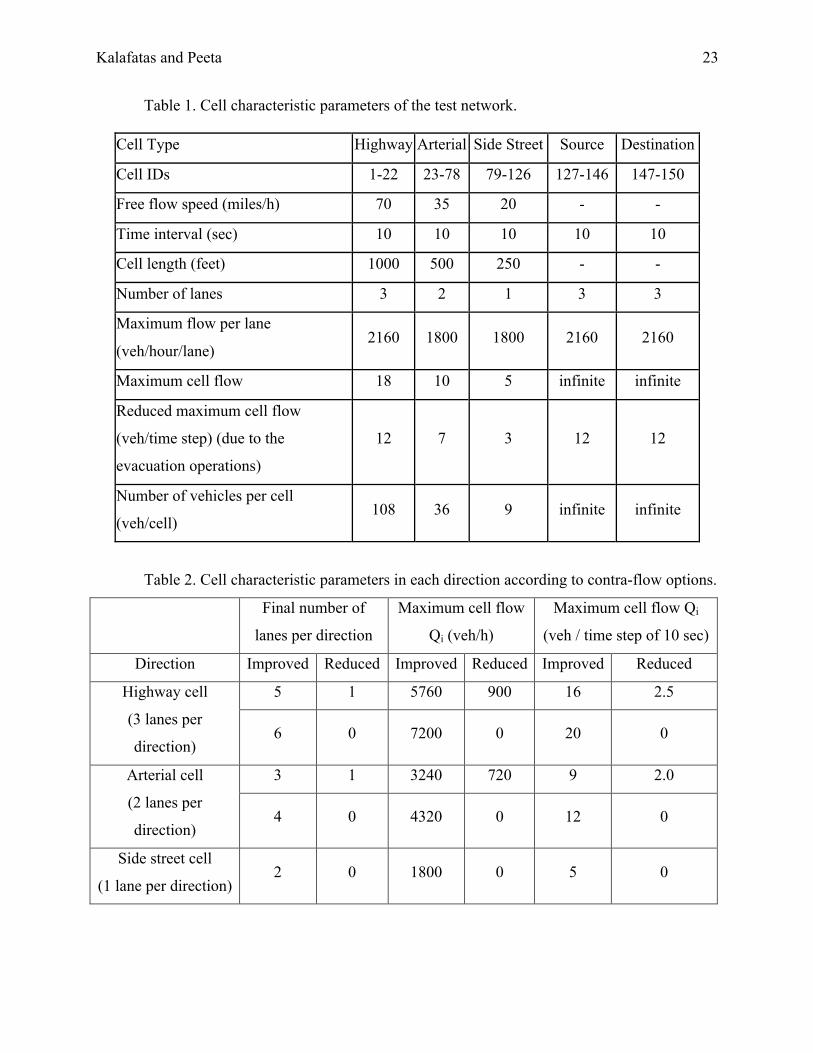
Table 1. Cell characteristic parameters of the test network.
Cell Type Highway Arterial Side Street Source Destination
Cell IDs 1-22 23-78 79-126 127-146 147-150
Free flow speed (miles/h) 70 35 20 - -
Time interval (sec) 10 10 10 10 10
Cell length (feet) 1000 500 250 - -
Number of lanes 3 2 1 3 3
Maximum flow per lane
(veh/hour/lane) 2160 1800 1800 2160 2160
Maximum cell flow 18 10 5 infinite infinite
Reduced maximum cell flow
(veh/time step) (due to the
evacuation operations)
12 7 3 12 12
Number of vehicles per cell
(veh/cell) 108 36 9 infinite infinite
Table 2. Cell characteristic parameters in each direction according to contra-flow options.
Final number of
lanes per direction
Maximum cell flow
Qi (veh/h)
Maximum cell flow Qi
(veh / time step of 10 sec)
Direction Improved Reduced Improved Reduced Improved Reduced
Highway cell
(3 lanes per
direction)
5 1 5760 900 16 2.5
6 0 7200 0 20 0
Arterial cell
(2 lanes per
direction)
3 1 3240 720 9 2.0
4 0 4320 0 12 0
Side street cell
(1 lane per direction) 2 0 1800 0 5 0

Kalafatas and Peeta 24
Table 3. Characteristic parameters of the experiment scenarios.
Scenario
ID
(SID)
Description Population
size
Spatial
distribution of
the population
Number
of
sources
Number of
destinations
Number of
reversed
links
1.1
Number of
reversed
links
5000 Uniform 20 4 0
1.2 5000 Uniform 20 4 2
1.3 5000 Uniform 20 4 4
1.4 5000 Uniform 20 4 6
1.5 5000 Uniform 20 4 8
1.6 5000 Uniform 20 4 10
1.7 5000 Uniform 20 4 12
1.8 5000 Uniform 20 4 14
1.9 5000 Uniform 20 4 18
1.10 5000 Uniform 20 4 20
2.1
Population
size
500 Uniform 20 4 8
2.2 1000 Uniform 20 4 8
2.3 1500 Uniform 20 4 8
2.4 2000 Uniform 20 4 8
2.5 2500 Uniform 20 4 8
2.6 3000 Uniform 20 4 8
2.7 3500 Uniform 20 4 8
2.8 4000 Uniform 20 4 8
2.9 4500 Uniform 20 4 8
2.10 5000 Uniform 20 4 8
3.1 Spatial
distribution
of
evacuation
demand
5000 Uniform 20 4 6
3.2 5000 Random 20 4 6
3.3 5000 Uniform 1 4 6
3.4 5000 Uniform 2 4 6
3.5 5000 Uniform 20 1 6
3.6 5000 Uniform 20 2 6

Kalafatas and Peeta 25
Table 4. 5000 evacuees randomly distributed to source cells in the random distribution scenario.
Source
ID Population
Source
ID Population
127 235 137 429
128 48 138 81
129 27 139 234
130 73 140 398
131 167 141 111
132 390 142 67
133 214 143 343
134 268 144 97
135 1042 145 436
136 203 146 137

Kalafatas and Peeta 26
Fig. 1. Characteristic points of the CTM traffic flow-density relationship.

Kalafatas and Peeta 27
Fig. 2. Refined cell representations for planning applications.
Kalafatas and Peeta 28
Fig. 3. Test network.

Kalafatas and Peeta 29
Fig. 4. Clearance time as a function of the number of reversed links.

Kalafatas and Peeta 30
0
100
200
300
400
500
0 1 2 3 4 5 6 7 8 9 10 11 12 13 14 15 16 17 18 19 20 21 22 23
Time elapsed from the beginning of the evacuation (min)
Evacuees reaching the safety zone per minute
(evacuees/minute)
0 RL 2 RL4 RL 6 RL8 RL 10 RL12 RL 14 RL16 RL 18 RL20 RL
Fig. 5. Evacuation rate per minute for different numbers of reversed links.
Kalafatas and Peeta 31
Part
B. I
mpr
oved
net
wor
k w
ith 2
0 re
vers
ed li
nks f
or 5
000
evac
uees
unifo
rmly
dis
tribu
ted
to 2
0 so
urce
s and
rout
ed to
4 d
estin
atio
ns
(SID
1.1
0).
Fig.
6. T
opol
ogic
al c
hara
cter
istic
s of t
he o
ptim
al so
lutio
n fo
r var
ious
leve
ls o
f con
tra-f
low
reso
urce
s.
Part
A. I
mpr
oved
net
wor
k w
ith 8
reve
rsed
link
s for
500
0 ev
acue
es
unifo
rmly
dis
tribu
ted
to 2
0 so
urce
s and
rout
ed to
4 d
estin
atio
ns
(SID
1.4
)

Kalafatas and Peeta 32
Fig. 7. Computational time for 1% optimality gap for different number of reversed links.
Kalafatas and Peeta 33
Fig. 8. Clearance time as a function of evacuee population with 8 reversed links.
Kalafatas and Peeta 34
0
50
100
150
200
250
300
350
400
450
0 1 2 3 4 5 6 7 8 9 10 11 12 13 14 15 16 17 18 19 20
Time elapsed from the beginning of the evacuation order (min)
Evac
uatio
n ra
te p
er m
inut
e (e
vacu
ees/m
in.)
500 Evacuees1000 Evacuees1500 Evacuees2000 Evacuees2500 Evacuees3000 Evacuees
3500 Evacuees4000 Evacuees4500 Evacuees5000 Evacuees
Fig. 9. Evacuation rate per minute for different evacuee population sizes with 8 reversed links.
Kalafatas and Peeta 35
0
50
100
150
200
250
300
350
400
450
0 2 4 6 8 10 12 14 16 18 20 22 24 26 28 30 32 34 36 38 40 42 44
Time elapsed from the beginning of the evacuation order (min)
Evac
uatio
n ra
te p
er m
inut
e (e
vacu
ees/m
in.) Multiple sources - multiple destinations / uniform
Multiple sources - multiple destinations / random1 source - multiple destinations2 sources - multiple destinationsMultiple sources - 1 destinationMultiple sources - 2 destinations
Fig. 10. Evacuation rate per minute for different scenarios of spatial evacuation distribution with
6 reversed links.
Fig. 11. Clearance time as a function of the spatial distribution of evacuation demand for 6
reversed links.

Kalafatas and Peeta 36
Pa
rt C
. Im
prov
ed n
etw
ork
with
6 re
vers
ed li
nks f
or 5
000
evac
uees
uni
form
ly d
istri
bute
d to
2 so
urce
s (ce
lls 1
42 a
nd 1
34,
high
light
ed) a
nd ro
uted
to 4
des
tinat
ions
(SID
3.4
).
Pa
rt E.
Impr
oved
net
wor
k w
ith 6
reve
rsed
link
s for
500
0
evac
uees
uni
form
ly d
istri
bute
d to
20
sour
ces a
nd ro
uted
to 2
dest
inat
ions
(cel
ls 1
47 a
nd 1
50, h
ighl
ight
ed),
(SID
3.6
).
Pa
rt B
. Im
prov
ed n
etw
ork
with
6 re
vers
ed li
nks f
or 5
000
evac
uees
in a
1 so
urce
(cel
l 142
, hig
hlig
hted
) cas
e an
d
rout
ed to
4 d
estin
atio
ns (S
ID 3
.3).
Pa
rt D
. Im
prov
ed n
etw
ork
with
6 re
vers
ed li
nks f
or 5
000
evac
uees
uni
form
ly d
istri
bute
d to
20
sour
ces a
nd ro
uted
to 1
dest
inat
ion
(cel
l 148
, hig
hlig
hted
), (S
ID 3
.5).
Pa
rt A
. Im
prov
ed n
etw
ork
with
6 re
vers
ed li
nks f
or 5
000
evac
uees
rand
omly
dis
tribu
ted
to 2
0 so
urce
s and
rout
ed to
4
dest
inat
ions
(SID
3.2
). H
ighl
ight
ed o
rigin
cel
ls in
dica
te
larg
er p
opul
atio
n ce
nter
s.
Fig.
12.
Opt
imal
net
wor
k co
nfig
urat
ion
for v
ario
us sp
atia
l
dist
ribut
ions
of t
he e
vacu
atio
n de
man
d.


