
Wollondilly Shire Council
Picton Post Event Analysis
June 2016 Weather and Flood Event
Picton Post Event Analysis
June 2016 Weather and Flood Event
25th November 2016
Level 17, 141 Walker St
North Sydney NSW 2060
Australia
rp301015-03199rg161125_June 2016 Post Event Analysis (Draft for Public Comment).docx
Revision C
www.advisian.com

Wollondilly Shire Council
Picton Post Event Analysis
June 2016 Weather and Flood Event
rp301015-03199rg161125_June 2016 Post Event Analysis (Draft for Public Comment).docx Revision C
Disclaimer
This report has been prepared on behalf of and for the exclusive use of Wollondilly Shire Council,
and is subject to and issued in accordance with the agreement between Wollondilly Shire Council
and Advisian (trading as WorleyParsons Services Pty Ltd).
Advisian accepts no liability or responsibility whatsoever for it in respect of any use of or reliance
upon this report by any third party.
Copying this report without the permission of Wollondilly Shire Council and Advisian is not
permitted.
Project No: 301015-03199
Picton Post Event Analysis – June 2016 Weather and Flood Event
Rev Description Author Review Advisian Approval
Date
A Draft Report (Issued for Internal Review)
RG
WJH
25/10/2016
B Draft Report (Issued for Client Review)
RG
WJH
31/10/2016
C Draft Report (Issued for Public Comment)
RG
WJH
25/11/2016

Wollondilly Shire Council
Picton Post Event Analysis
June 2016 Weather and Flood Event
rp301015-03199rg161125_June 2016 Post Event Analysis (Draft for Public Comment).docx page 1 Revision C
Table of Contents
1 INTRODUCTION .............................................................................. 1
2 AVAILABLE DATA FOR THE JUNE 2016 EVENT ............................ 1
2.1 Assessment of Rainfall Data ................................................................. 1
2.2 Assessment of Streamflow Data .......................................................... 2
2.3 High Water Mark (HWM) Data ............................................................ 4
3 JUNE 2016 EVENT HYDROLOGIC AND HYDRAULIC MODELLING5
3.1 XP-RAFTS Hydrologic Modelling ......................................................... 5
3.1.1 Discussion .....................................................................................................................7
3.2 RMA-2 Hydrodynamic Modelling ........................................................ 7
3.2.1 Model Set-Up ..............................................................................................................7
3.2.2 Comparison of Simulated and Recorded HWMs ...........................................9
3.2.3 Comparison to the 1% AEP Flood .................................................................... 10
4 CONCLUSIONS .............................................................................. 11
5 REFERENCES .................................................................................. 12

Wollondilly Shire Council
Picton Post Event Analysis
June 2016 Weather and Flood Event
rp301015-03199rg161125_June 2016 Post Event Analysis (Draft for Public Comment).docx page 1 Revision C
1 INTRODUCTION
During the first week of June 2016 an upper level trough developed over central and eastern
Australia along with an accompanying low pressure surface trough. The system intensified on
Friday 3rd
June and moved across south-east Queensland bringing with it persistent rainfall and
high winds.
Early on Sunday 5th
June 2016, the system moved off the coast and developed into an East Coast
Low causing heavy rain, strong winds and large waves along the NSW coast. The low pressure
system brought widespread heavy rainfall to the northern coast and ranges, before the main
rainfall focus shifted southwards to impact the south coast and ranges of NSW. Rain persisted
through both Saturday and Sunday and many locations reported their wettest June on record in
the first week of the month.
In the Sydney Basin, major flooding occurred in a number of catchments, particularly those that
drain to the Georges River. Severe coastal erosion was reported in areas including Coogee and
Collaroy. In the western areas of the Sydney Basin, major flooding occurred at Picton and
Camden, with over 330 mm of rainfall observed during the event.
The major flooding that occurred in Picton resulted in damage to commercial and residential
properties. Properties throughout the study area, including many along Argyle Street in the
centre of town, experienced significant inundation with depths in excess of 1.5 metres recorded.
A large number of trees and other in-bank vegetation were up-rooted during the flood event
and conveyed downstream; a reflection of the significant volume and velocity of floodwaters
along Stonequarry Creek and its tributaries.
In the aftermath of the event Council has collected High Water Mark (HWM) information for
76 locations throughout the floodplain. These anecdotal or visual records of the peak flood level
is particularly useful for the purposes of validating computer models developed for predicting
peak flood levels and flood behaviour.
Accordingly, Council has engaged Advisian (a part of WorleyParsons) to use the collected HWM
information to validate Council’s existing two-dimensional RMA-2 flood model. The RMA-2
model was last used to predict flood behaviour for the study area as documented in the
‘Picton/Stonequarry Creek Flood Study’ (WorleyParsons, August 2014) which is currently in draft
(referred to as the Flood Study herein).
This report has been prepared first and foremost to document the validation of the RMA-2
model to the June 2016 flood event. Validation of the XP-RAFTS hydrologic model and a review
of available event specific data is also included.
Please note that this report is not intended as a standalone document and, as such, does not
contain extensive detail regarding the background of the RMA-2 flood model, XP-RAFTS
hydrologic model or history of flood modelling for Picton. Additional information is provided
within the Flood Study and should therefore be read in conjunction with this report.
Wollondilly Shire Council
Picton Post Event Analysis
June 2016 Weather and Flood Event
rp301015-03199rg161125_June 2016 Post Event Analysis (Draft for Public Comment).docx page 1 Revision C
2 AVAILABLE DATA FOR THE JUNE 2016 EVENT
2.1 Assessment of Rainfall Data
Rainfall and river level data was obtained from the Bureau of Meteorology (BOM) and NSW
Office of Water (NOW) for a number of gauges in the surrounding area. The nearest
pluviometer to the site is located at the Stonequarry Creek river level gauge (NOW Gauge No.
212053). No other pluviometers are located within the Stonequarry Creek catchment, although
Lake Nerrigorang (NOW Gauge No. 212063) and Thurns Road (NOW Gauge No. 568296), are
close to the western and eastern catchment boundary, respectively.
One daily-read rainfall gauge is available in Picton at the Council Depot (BOM Gauge No. 68052).
However, no readings were taken on Saturday 4th
and Sunday 5th
June and the reading for
Monday 6th
June includes the rain that fell on the two preceding days.
The gauges used in this assessment are:
Picton Council Depot – daily read gauge located approximately 500 m to the north-east
Stonequarry Creek – pluviometer gauge located approximately 800 m to the south
Thurns Road TBRG – pluviometer located approximately 4.5 km to the north-east
Nerrigorang at Thirlmere – pluviometer located approximately 9 km to the south-west
Camden Airport AWS – pluviometer located approximately 16 km to the north
Campbelltown (Mount Annan) – pluviometer located approximately 20 km to the north-east
The rainfall data has been compiled and is presented in Plate 1. The pluviograph data shows a
consistent pattern of rainfall in the area. Rain began on the morning of Saturday 4th
June and
continued until about 20:00 on Sunday 5th
June.
The total rainfall recorded at the daily-read gauge at Picton Council Depot appears low
compared to the rainfall recorded for the corresponding period at surrounding gauges. There is
potential that the gauge may have overflowed as it was not emptied in the two days prior.
Therefore, it is possible that the total rainfall recorded at this location may be underestimated.
The gauge at Stonequarry Creek recorded the greatest depth of rainfall with 334 mm recorded
over the duration of the event. Based on the BOM’s Intensity-Frequency-Distribution (IFD) data,
the rainfall exceeded a 100-year Average Recurrence Interval (ARI) event over 9 hours, which is
the critical duration determined for the catchment.

Wollondilly Shire Council
Picton Post Event Analysis
June 2016 Weather and Flood Event
rp301015-03199rg161125_June 2016 Post Event Analysis (Draft for Public Comment).docx page 2 Revision C
Plate 1: Cumulative Rainfall Data
^ The gauge at Picton Council Depot is a daily read gauge usually recorded at 09:00 every morning. The gauge was not read on
4th
and 5th
June and the data for 6th
June is accumulated over the 2 days prior. It is possible that the reading at this gauge is an
underestimate of the actual total rainfall as it may have filled to capacity and overflowed.
2.2 Assessment of Streamflow Data
The nearest river level gauge on Stonequarry Creek is located approximately 950 m downstream
(to the south) of Argyle Street and a short distance upstream of the Railway Crossing. Recorded
river level and flow data for this gauge was obtained from the NSW Office of Water. Rainfall
data is also recorded at this gauge as discussed above.
River level and rainfall data for the June 2016 event as recorded by the Stonequarry Creek
Gauge (NOW Gauge No. 212053) is presented in Plate 2.
The gauge data shows the creek began to respond at about 10:00 on 4th
June with floodwaters
rising relatively slowly for the first 15 hours. From the early hours of Sunday 5th
June water
levels in the creek began to rise more rapidly at about 0.3 m per hour. From around 14:00 on
Sunday 5th
June, as the rainfall intensified, water levels rose even more rapidly at a rate of
1.3 m/hr to the peak at 18:30. The gauge at Stonequarry Creek recorded a peak water level of
8.8 m. This equates to an elevation of about 156.6 mAHD.
The rainfall began to ease from around 19:00 and water levels dropped rapidly over the next
12 hours.
Wollondilly Shire Council
Picton Post Event Analysis
June 2016 Weather and Flood Event
rp301015-03199rg161125_June 2016 Post Event Analysis (Draft for Public Comment).docx page 3 Revision C
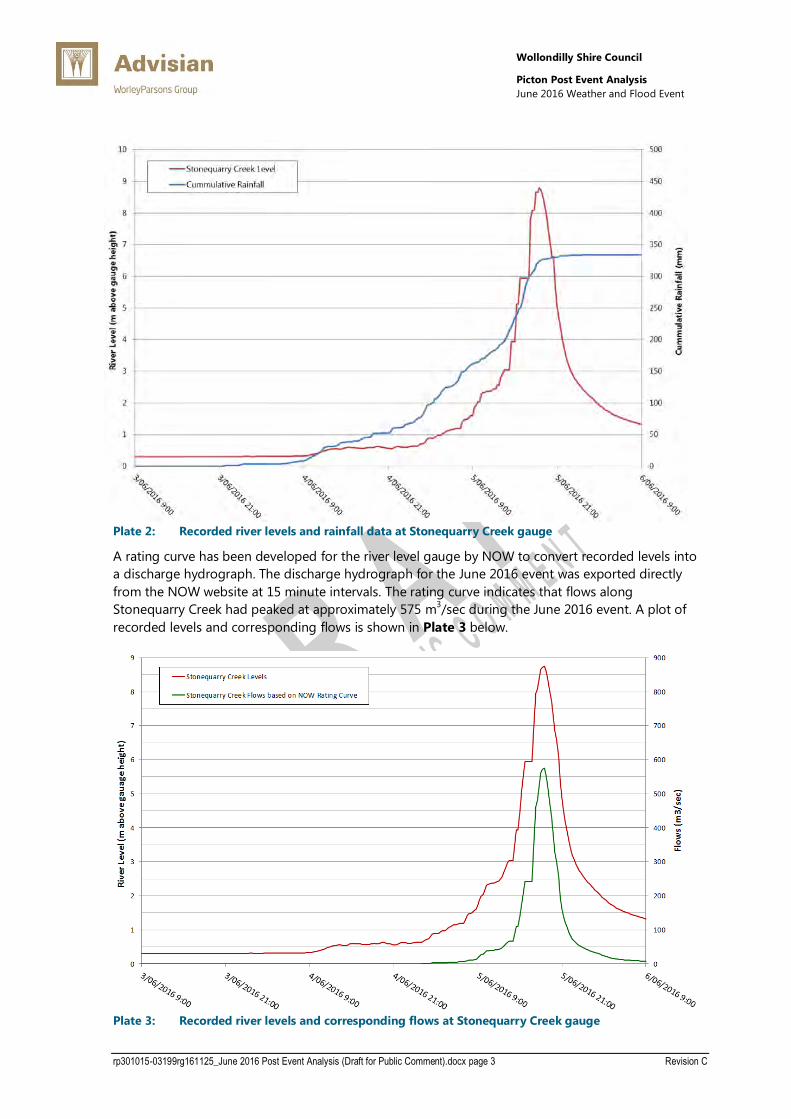
Plate 2: Recorded river levels and rainfall data at Stonequarry Creek gauge
A rating curve has been developed for the river level gauge by NOW to convert recorded levels into
a discharge hydrograph. The discharge hydrograph for the June 2016 event was exported directly
from the NOW website at 15 minute intervals. The rating curve indicates that flows along
Stonequarry Creek had peaked at approximately 575 m3/sec during the June 2016 event. A plot of
recorded levels and corresponding flows is shown in Plate 3 below.
Plate 3: Recorded river levels and corresponding flows at Stonequarry Creek gauge
Wollondilly Shire Council
Picton Post Event Analysis
June 2016 Weather and Flood Event
rp301015-03199rg161125_June 2016 Post Event Analysis (Draft for Public Comment).docx page 4 Revision C
2.3 High Water Mark (HWM) Data
Following the June 2016 flood event Council officers were successful in collecting 76 HWMs
throughout the study area. The majority of the collected HWMs were identified based on debris
lines observed on fences, trees and buildings both externally and internally. Where possible the
HWMs were surveyed to determine a peak flood elevation reduced to Australian Height Datum
(AHD). This approach was adopted for approximately 30% of the HWMs.
A height above ground measurement was taken for the remaining HWMs. This height
information was translated to an elevation in mAHD by adding it to a ground elevation
determined by Advisian according to the available LiDAR data. This approach is less reliable than
surveying (refer above) and is expected to provide a vertical accuracy of +/- 0.2 metres. Where
HWM heights were measured within buildings, Council provided Advisian with a surveyed floor
height on which to determine the appropriate HWM elevation.
The location of all HWMs are shown in Figure 1.

FIGURE 1
LOCATION OF COLLECTED HIGH WATER MARKS (HWM) FOR THE JUNE 2016 EVENT
FIGURE A
301015-03199-Stonequarry Ck Flood Modelling fg301015-03199rg161013_Fig1_HWM Locations.doc
Railway Crossing
DRAFT LEGEND:
Location of a Surveyed High Water Mark (HWM)
Predicted June 2016 Flood Extent based on
RMA-2 Flood Modelling (DRAFT)
HWM RMA-2 DIFF (m)
159.95 159.38 -0.57
HWM Confidence: Good
HWM RMA-2 DIFF (m)
161.44 161.25 -0.19
HWM Confidence: Good
HWM RMA-2 DIFF (m)
/ 160.70 /
No Measurement Taken
HWM RMA-2 DIFF (m)
160.40 160.32 -0.08
HWM Confidence: Good
HWM RMA-2 DIFF (m)
160.73 160.23 -0.50
HWM Confidence: Average
HWM RMA-2 DIFF (m)
/ 160.32 /
No Measurement Taken
HWM RMA-2 DIFF (m)
160.47 160.22 -0.25
HWM Confidence: Good
HWM RMA-2 DIFF (m)
160.27 160.20 -0.07
HWM Confidence: Good
HWM RMA-2 DIFF (m)
160.02 160.07 +0.05
HWM Confidence: Good
HWM RMA-2 DIFF (m)
160.08 159.97 -0.11
HWM Confidence: Good
HWM RMA-2 DIFF (m)
160.39 160.20 -0.19
HWM Confidence: Good
HWM RMA-2 DIFF (m)
160.14 159.58 -0.56
HWM Confidence: Good
HWM RMA-2 DIFF (m)
161.66 159.88 -1.78
HWM Confidence: Poor
Note: HWM elevation based on an approximate measurement to debris in tree branches. Comparison of the HWM elevation to others nearby indicates it is likely to be in error by 1.5-2 metres
COMPARISON OF RMA-2 MODELLED LEVELS FOR THE ‘JUNE 2016’ FLOOD EVENT
FLOOD TO SURVEYED HWMs [EXTENT 1 OF 3]
Picton Town Centre
LEGEND:
Location of a Surveyed High Water Mark (HWM) Probable Maximum Flood
(PMF) Extent

Wollondilly Shire Council
Picton Post Event Analysis
June 2016 Weather and Flood Event
rp301015-03199rg161125_June 2016 Post Event Analysis (Draft for Public Comment).docx page 5 Revision C
3 JUNE 2016 EVENT HYDROLOGIC AND
HYDRAULIC MODELLING
The available rainfall, streamflow and HWM data described in Section 2 provides an opportunity
to validate the RMA-2 flood model to the June 2016 flood event. The opportunity to
validate/calibrate the model was not available at the time the model was developed due to the
absence of any sizeable floods in the study area since gauging commenced.
The following sections discuss the process and findings of the RMA-2 model validation. This
includes discussion on the adopted inflow hydrographs, simulation parameters and differences
between recorded and simulated flood levels.
3.1 XP-RAFTS Hydrologic Modelling
In order to validate the RMA-2 model a reliable estimate is required of the June 2016 inflow
hydrographs. The Stonequarry Creek RMA-2 model requires inflow hydrographs to be specified
for all of the upstream model boundaries located at Stonequarry Creek, Halfway Creek,
Crawfords Creek and an unnamed creek.
Discharge hydrographs for the June 2016 event can be estimated for input to the RMA-2 model
using the existing XP-RAFTS hydrologic model (refer Flood Study for further discussion) and the
rainfall data discussed in Section 2.1. As there are multiple rainfall gauges within the catchment
rainfall was applied to catchments based on their proximity to the guage. A figure showing the
distribution of catchments relative to the applied rainfall data is shown in Figure 2.
As shown, only three of the rainfall gauges were adopted to represent the June 2016 rainfall
event across the study area. This is based on the proximity of the gauges relative to the
catchment and their spread across the centre and perimeters of the catchment. Analysis of the
recorded rainfall for each of the adopted gauges also indicates that the recorded rainfall
intensities (mm/hr) and total cumulative rainfall (mm) was similar for each. It is therefore unlikely
that the modelling would be sensitive to any variation in the application of gauge data to the
catchments (refer Figure 2).
Initial XP-RAFTS simulations of the June 2016 rainfall event were based without change on the
XP-RAFTS model adopted for the Updated Flood Study. That is, all catchment and routing
parameters such as roughness, slope and storage coefficients and the initial and continuing
losses were left unchanged.
The flow hydrograph predicted by the base XP-RAFTS Flood Study model at the downstream
limit of the model, which coincides with the Railway Crossing and the river level gauge (NOW
Gauge No. 212053), is shown in Plate 4. The flow hydrograph determined by NOW is
superimposed for comparison.
The base XP-RAFTS Flood Study model is shown to predict flows that are within 20 m3/sec of the
NOW gauge at the peak of the flood event. The timing of the peak flow is also close and within
60 minutes. The base XP-RAFTS Flood Study model does not align with the gauged hydrograph
during the early stages of the event; i.e., during the rising limb of the flood. As shown in Plate 4,

FIGURE 2
301015-03199-Stonequarry Ck Flood Modelling fg301015-03199rg161013_Fig2_Adopted Gauge to Catchment Breaup.doc
Nerrigorang at Thirlmere Gauge
(NOW 212063)
DRAFT
NOTE: Sub-Catchments are coloured in accordance to the gauge from which rainfall records were applied LEGEND:
XP-RAFTS Sub-Catchments
GAUGE RAINFALL RECORDS ADOPTED FOR EACH SUB-CATCHMENT
Stonequarry Creek at Picton Gauge
(NOW 212053)
Thurns Road Gauge
(NOW 568296)
Catchment Boundary
Wollondilly Shire Council
Picton Post Event Analysis
June 2016 Weather and Flood Event
rp301015-03199rg161125_June 2016 Post Event Analysis (Draft for Public Comment).docx page 6 Revision C
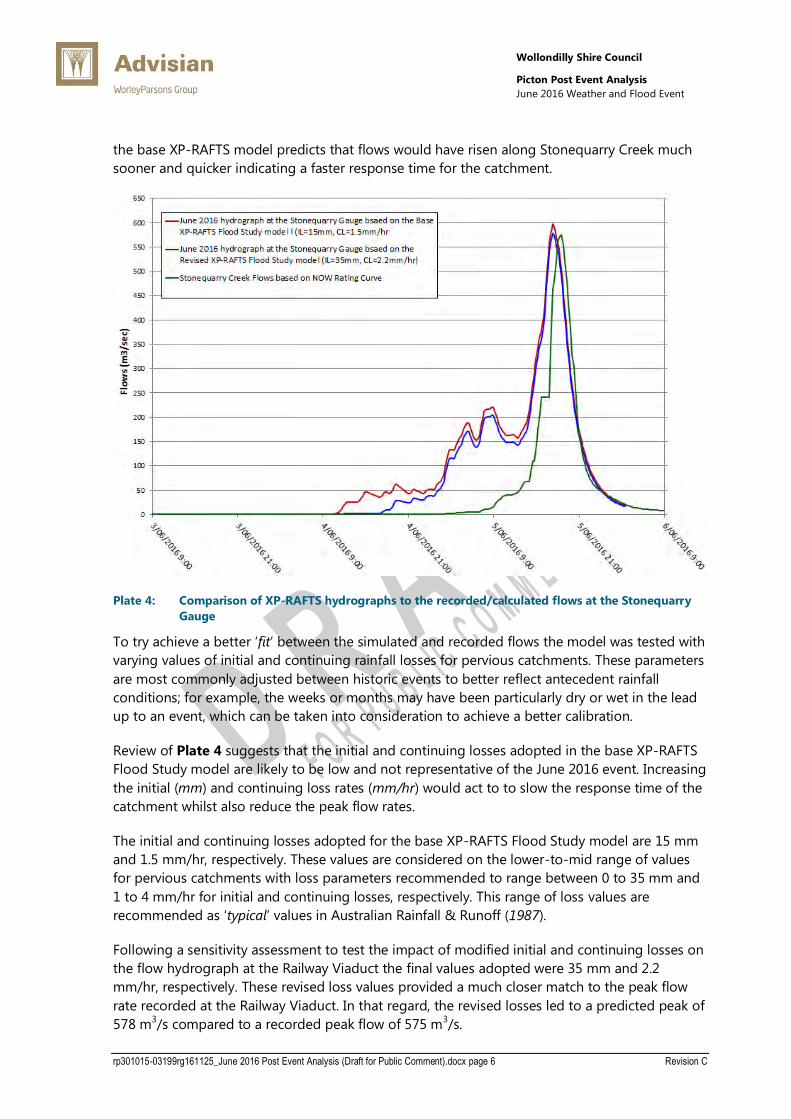
the base XP-RAFTS model predicts that flows would have risen along Stonequarry Creek much
sooner and quicker indicating a faster response time for the catchment.
Plate 4: Comparison of XP-RAFTS hydrographs to the recorded/calculated flows at the Stonequarry
Gauge
To try achieve a better ‘fit’ between the simulated and recorded flows the model was tested with
varying values of initial and continuing rainfall losses for pervious catchments. These parameters
are most commonly adjusted between historic events to better reflect antecedent rainfall
conditions; for example, the weeks or months may have been particularly dry or wet in the lead
up to an event, which can be taken into consideration to achieve a better calibration.
Review of Plate 4 suggests that the initial and continuing losses adopted in the base XP-RAFTS
Flood Study model are likely to be low and not representative of the June 2016 event. Increasing
the initial (mm) and continuing loss rates (mm/hr) would act to to slow the response time of the
catchment whilst also reduce the peak flow rates.
The initial and continuing losses adopted for the base XP-RAFTS Flood Study model are 15 mm
and 1.5 mm/hr, respectively. These values are considered on the lower-to-mid range of values
for pervious catchments with loss parameters recommended to range between 0 to 35 mm and
1 to 4 mm/hr for initial and continuing losses, respectively. This range of loss values are
recommended as ‘typical’ values in Australian Rainfall & Runoff (1987).
Following a sensitivity assessment to test the impact of modified initial and continuing losses on
the flow hydrograph at the Railway Viaduct the final values adopted were 35 mm and 2.2
mm/hr, respectively. These revised loss values provided a much closer match to the peak flow
rate recorded at the Railway Viaduct. In that regard, the revised losses led to a predicted peak of
578 m3/s compared to a recorded peak flow of 575 m
3/s.

Wollondilly Shire Council
Picton Post Event Analysis
June 2016 Weather and Flood Event
rp301015-03199rg161125_June 2016 Post Event Analysis (Draft for Public Comment).docx page 7 Revision C
The flow hydrograph determined using these revised parameters is superimposed on Plate 4.
The increased initial losses have acted to delay the rise in flows by approximately 8 hours.
Although this has led to a closer match to the gauge, the rising limb of the two hydrographs are
still not aligned, with the revised XP-RAFTS hydrograph still rising considerably sooner.
Although the simulated hydrograph could further be delayed by increasing the initial loss rates,
sensitivity modelling showed initial losses would need to be increased to between 80 mm and
100 mm to achieve a reasonable match. This is considered to represent a very high estimate of
initial losses which would be difficult to justify without detailed investigation. This suggests there
may have been event-specific phenomenon unaccounted for, or potentially an error with the
NOW Rating Curve for low gauge levels.
For the purposes of this assessment, the discrepancies between the simulated and calculated
flows (NOW Rating Curve) during the initial stages of the flood were not further investigated.
This discrepancy does not impact the predicted flows at the peak of the event and hence would
not impact the RMA-2 model validation to peak flood level data, which is the main purpose of
this investigation.
3.1.1 Discussion
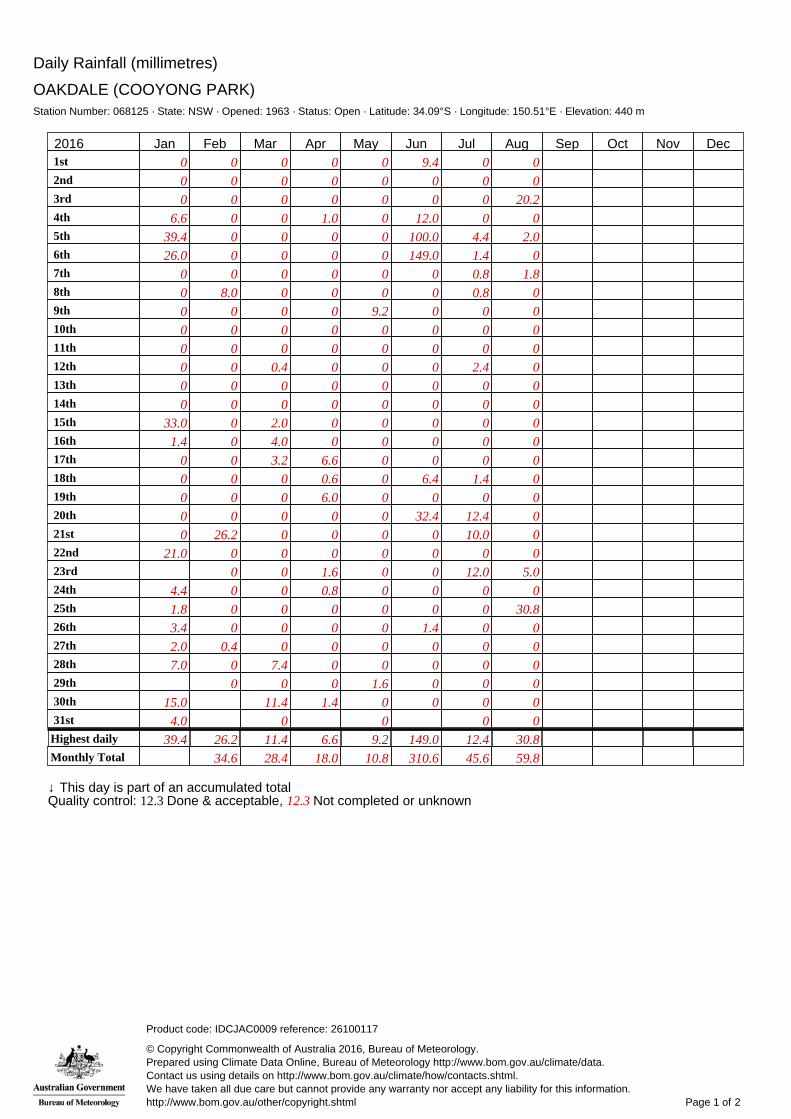
An increase in the adopted initial and continuing losses (beyond the base values adopted in the
Flood Study) is considered appropriate based on a review of rainfall records in the months
leading up to the event. As shown in Appendix A, monthly rainfall records for the three gauges
nearest to the catchment all recorded below average rainfall over a period of at least 6 months
prior to the event. This lower than average rainfall would have resulted in particularly dry
conditions, which would support adopting a higher than average initial and continuing loss rate.
Overall the XP-RAFTS model has been shown to predict a hydrograph shape (with the exception
of the initial stages of the flood) and peak flow rate that is reflective of the recorded data at the
Stonequarry Creek Gauge. This has been achieved by only modifying the initial and continuing
loss values for pervious catchments, which is typical for event-specific modelling.
3.2 RMA-2 Hydrodynamic Modelling
3.2.1 Model Set-Up
Upstream Boundary Conditions
The upstream boundary conditions for the RMA-2 model are based on inflow hydrographs
extracted from the XP-RAFTS hydrologic model (discussed in Section 3.1). In that regard, flow
hydrographs were extracted from the revised XP-RAFTS model simulation of the June 2016
event at the following locations:
Stonequarry Creek – 300 metres upstream of Bakers Lodge Road,
Racecourse Creek – 850 metres upstream of Confluence with Crawfords Creek,
Crawfords Creek – 550 metres upstream of Confluence with Racecourse Creek, and
Unnamed Creek – 850 metres upstream of Evelyn Bridge Crossing.

Wollondilly Shire Council
Picton Post Event Analysis
June 2016 Weather and Flood Event
rp301015-03199rg161125_June 2016 Post Event Analysis (Draft for Public Comment).docx page 8 Revision C
The inflow hydrograph for the June 2016 event at each model boundary location are shown in
Plate 5.
Plate 5: Adopted RMA-2 Inflow Hydrographs for the June 2016 Event
Downstream Boundary Condition
The downstream boundary condition for the RMA-2 model is based on a stage-discharge
relationship determined using a ‘normal depth’ analysis (refer to the Flood Study for further
information). The stage-discharge boundary allows water levels at the boundary to be updated
within the model as the simulation progresses and flows are increased or decreased.
This boundary condition is appropriate for use in simulating the June 2016 event and therefore
was not changed.
Model Network and Material Roughness
No changes were made to the RMA-2 model network or material roughness values and
distribution as part of the June 2016 event validation. In that regard, similarly to simulations for
all design events documented in the Flood Study, all buildings (residential and commercial) were
completely ‘blocked-out’ of the model to simulate the significant obstructions they impose to
floodwaters.
By not changing the material roughness values and distribution this exercise is more reflective of
a model validation, rather than a recalibration.

Wollondilly Shire Council
Picton Post Event Analysis
June 2016 Weather and Flood Event
rp301015-03199rg161125_June 2016 Post Event Analysis (Draft for Public Comment).docx page 9 Revision C
3.2.2 Comparison of Simulated and Recorded HWMs
The Flood Study RMA-2 model was simulated with the boundary conditions discussed in
Section 3.2.1 and the inflow hydrographs shown in Plate 5. In order to validate the model the
predicted flood level at the location of each HWM was extracted and recorded. This flood level
was subsequently compared to the flood level recorded at the HWM and the difference noted.
The findings of this comparison are shown in Figure 3, Figure 4 and Figure 5. The figures show
the locations of each HWM and the calculated difference between modelled and recorded June
2016 flood levels.
Differences are shown to generally range between -0.05 to -0.20 metres, with the exception of
scattered outliers. Closer investigation of the outliers shows that in most cases there is an
inconsistency in the recorded HWMs with those upstream or downstream. Other differences
appear to be influenced by localised hydraulic effects, such as a loss of hydraulic efficiency due
to debris build-up along fences or along the upstream side of bridges. These local and event
specific occurrences are difficult to capture in hydraulic modelling unless event specific models
and modelling parameters are adopted.
A statistical analysis of the flood level differences indicates that the RMA-2 model predicts flood
levels to within an average of 0.18 metres and median of 0.145 metres when compared to all of
the 76 recorded HWMs. This statistical analysis is broken-down further in Table 1, providing the
mean and median difference based on the HWMs included in each figure. This break-down
analysis is beneficial as it loosely represents the model accuracy for the upper (upstream of the
town), middle (Picton Town Centre) and lower (downstream of the town) model reaches.
Table 1 Findings of RMA-2 Model Validation
Figure 3 Upstream Town
Figure 4 Town Centre
Figure 5 Downstream Town
All HWMs
Number of HWMs 17 38 21 76
Mean Difference (m) - 0.21 - 0.17 - 0.18 - 0.18
Median Difference (m) - 0.19 - 0.15 - 0.13 - 0.145
Table 1 indicates that the simulated and recorded flood level differences are largely uniform
throughout the study area with the calculated mean and median differences only changing
marginally between figures. A mean difference of less than 0.2 metres for all figures is
considered to represent a favourable validation. This indicates that the RMA-2 model is in good
agreement with the HWM data and shows that the RMA-2 model can be a reliable tool for the
estimation of flood behaviour across the study area.
The mean and median differences shown in Table 1 indicate a consistent trend that suggests
the RMA-2 model may be under-predicting flood levels by between 0.13 to 0.21 metres. This
result was unexpected given there has been concern that the RMA-2 model is over-predicting
flood levels across the study area. This concern is based on a comparison documented in the

FIGURE 3
301015-03199-Stonequarry Ck Flood Modelling fg301015-03199rg130417_Fig2_Predicted Flood levels (100yr_North).doc
Evelyn Bridge
DRAFT LEGEND:
Location of a Surveyed High Water Mark (HWM)
Predicted June 2016 Flood Extent based on
RMA-2 Flood Modelling (DRAFT)
HWM RMA-2 DIFF (m)
161.81 161.76 -0.05
HWM Confidence: Average
HWM RMA-2 DIFF (m)
161.71 161.66 -0.05
HWM Confidence: Good
HWM RMA-2 DIFF (m)
159.95 159.38 -0.57
HWM Confidence: Good
HWM RMA-2 DIFF (m)
161.44 161.25 -0.19
HWM Confidence: Good
HWM RMA-2 DIFF (m)
/ 160.70 /
No Measurement Taken
HWM RMA-2 DIFF (m)
160.40 160.32 -0.08
HWM Confidence: Good
HWM RMA-2 DIFF (m)
160.73 160.23 -0.50
HWM Confidence: Average
HWM RMA-2 DIFF (m)
/ 160.32 /
No Measurement Taken
HWM RMA-2 DIFF (m)
160.47 160.22 -0.25
HWM Confidence: Good
HWM RMA-2 DIFF (m)
160.27 160.20 -0.07
HWM Confidence: Good
HWM RMA-2 DIFF (m)
160.02 160.07 +0.05
HWM Confidence: Good
HWM RMA-2 DIFF (m)
160.08 159.97 -0.11
HWM Confidence: Good
HWM RMA-2 DIFF (m)
162.86 162.61 -0.25
HWM Confidence: Good
HWM RMA-2 DIFF (m)
/ 162.59 /
No measurement Taken
HWM RMA-2 DIFF (m)
/ 162.60 /
No Measurement Taken
HWM RMA-2 DIFF (m)
162.69 162.71 +0.02
HWM Confidence: Good
HWM RMA-2 DIFF (m)
160.14 160.01 -0.13
HWM Confidence: Average
HWM RMA-2 DIFF (m)
160.39 160.20 -0.19
HWM Confidence: Good
HWM RMA-2 DIFF (m)
160.14 159.58 -0.56
HWM Confidence: Good
HWM RMA-2 DIFF (m)
161.66 159.88 -1.78
HWM Confidence: Poor
Note: HWM elevation based on an approximate measurement to debris in tree branches. Comparison of the HWM elevation to others nearby indicates it is likely to be in error by 1.5-2 metres
HWM RMA-2 DIFF (m)
160.20 159.94 -0.26
HWM Confidence: Average
COMPARISON OF RMA-2 MODELLED LEVELS FOR THE ‘JUNE 2016’ FLOOD EVENT
FLOOD TO SURVEYED HWMs [EXTENT 1 OF 3]
Note: Shading representative of magnitude of WL difference between observed and modelled flood levels. Green = 0 – 200 mm difference, Orange = 200 – 400 mm difference, Red = 400+ mm

H:\301015-03199 - Stonequarry Ck FPRMS&P [Picton]\2.0 Reports\3. June 2016 Post Event Analysis
FIGURE 4
301015-03199-Stonequarry Ck Flood Modelling fg301015-03199rg130417_Fig2_Predicted Flood levels (100yr_North).doc
DRAFT HWM RMA-2 DIFF (m)
159.44 159.57 +0.13
HWM Confidence: Average
HWM RMA-2 DIFF (m)
159.63 159.26 -0.37
HWM Confidence: Good
HWM RMA-2 DIFF (m)
158.30 158.35 +0.05
HWM Confidence: Good
HWM RMA-2 DIFF (m)
159.85 159.81 -0.04
HWM Confidence: Good
HWM RMA-2 DIFF (m)
159.05 158.71 -0.34
HWM Confidence: Good
HWM RMA-2 DIFF (m)
158.56 158.72 +0.16
HWM Confidence: Good
Note: HWM elevation recorded above floor level. Accordingly, survey required
to establish HWM elevation.
HWM RMA-2 DIFF (m)
158.50 158.72 +0.22
HWM Confidence: Average
HWM RMA-2 DIFF (m)
158.85 158.70 -0.15
HWM Confidence: Good
HWM RMA-2 DIFF (m)
158.84 158.69 -0.15
HWM Confidence: Good
HWM RMA-2 DIFF (m)
158.75 158.69 -0.06
HWM Confidence: Good
HWM RMA-2 DIFF (m)
158.90 158.72 -0.18
HWM Confidence: Good
HWM RMA-2 DIFF (m)
158.76 158.72 -0.04
HWM Confidence: Good
HWM RMA-2 DIFF (m)
158.76 158.93 +0.23
HWM Confidence: Good
HWM RMA-2 DIFF (m)
158.74 158.60 -0.14
HWM Confidence: Good
HWM RMA-2 DIFF (m)
158.62 158.57 -0.05
HWM Confidence: Good
HWM RMA-2 DIFF (m)
158.50 158.32 -0.28
HWM Confidence: Good
HWM RMA-2 DIFF (m)
159.12 159.27 +0.15
HWM Confidence: Good
HWM RMA-2 DIFF (m)
158.70 158.68 -0.02
HWM Confidence: Good
HWM RMA-2 DIFF (m)
158.49 158.52 +0.03
HWM Confidence: Good
HWM RMA-2 DIFF (m)
158.72 158.62 -0.10
HWM Confidence: Good
HWM RMA-2 DIFF (m)
158.92 158.65 -0.28
HWM Confidence: Good
HWM RMA-2 DIFF (m)
158.50 158.34 -0.16
HWM Confidence: Good
HWM RMA-2 DIFF (m)
158.47 158.31 -0.16
HWM Confidence: Good
HWM RMA-2 DIFF (m)
158.42 158.29 -0.13
HWM Confidence: Good
HWM RMA-2 DIFF (m)
158.57 158.30 -0.27
HWM Confidence: Good
HWM RMA-2 DIFF (m)
158.36 158.29 -0.07
HWM Confidence: Good
HWM RMA-2 DIFF (m)
158.50 158.20 -0.30
HWM Confidence: Good
HWM RMA-2 DIFF (m)
158.14 157.94 -0.20
HWM Confidence: Good
HWM RMA-2 DIFF (m)
158.05 157.65 -0.40
HWM Confidence: Good
HWM RMA-2 DIFF (m)
158.33 158.14 -0.19
HWM Confidence: Good
HWM RMA-2 DIFF (m)
159.55 159.32 -0.23
HWM Confidence: Good
HWM RMA-2 DIFF (m)
/ 159.12 /
No Measurement Taken
HWM RMA-2 DIFF (m)
158.27 158.04 -0.23
HWM Confidence: Good
HWM RMA-2 DIFF (m)
158.31 158.31 -0.00
HWM Confidence: Good
1% AEP RMA-2 DIFF (m)
157.65 158.04 /
No HWM Measurement Taken
HWM RMA-2 DIFF (m)
158.32 158.23 -0.09
HWM Confidence: Good
HWM RMA-2 DIFF (m)
158.53 158.27 -0.26
HWM Confidence: Good
HWM RMA-2 DIFF (m)
158.57 158.28 -0.29
HWM Confidence: Good
HWM RMA-2 DIFF (m)
157.94 157.74 -0.20
HWM Confidence: Good
HWM RMA-2 DIFF (m)
158.07 157.78 -0.29
HWM Confidence: Good
HWM RMA-2 DIFF (m)
158.82 158.71 -0.11
HWM Confidence: Good
COMPARISON OF RMA-2 MODELLED LEVELS FOR THE ‘JUNE 2016’ FLOOD EVENT
FLOOD TO SURVEYED HWMs [EXTENT 2 OF 3]
Note: Shading representative of magnitude of WL difference between observed and modelled flood levels. Green = 0 – 200 mm difference, Orange = 200 – 400 mm difference, Red = 400+ mm
LEGEND:
Location of a Surveyed High
Water Mark (HWM)
Predicted June 2016 Flood
Extent based on RMA-2 Flood
Modelling (DRAFT)

FIGURE 5
301015-03199-Stonequarry Ck Flood Modelling fg301015-03199rg130417_Fig2_Predicted Flood levels (100yr_North).doc
DRAFT
HWM RMA-2 DIFF (m)
157.80 157.34 -0.46
HWM Confidence: Good
HWM RMA-2 DIFF (m)
157.85 157.38 -0.47
HWM Confidence: Good
HWM RMA-2 DIFF (m)
157.45 157.38 -0.07
HWM Confidence: Good
HWM RMA-2 DIFF (m)
157.20 157.37 +0.17
HWM Confidence: Good
HWM RMA-2 DIFF (m)
157.56 157.37 -0.19
HWM Confidence: Good
HWM RMA-2 DIFF (m)
157.28 157.24 -0.04
HWM Confidence: Good
HWM RMA-2 DIFF (m)
157.19 157.22 +0.03
HWM Confidence: Good
HWM RMA-2 DIFF (m)
157.77 157.33 -0.44
HWM Confidence: Average
HWM RMA-2 DIFF (m)
157.57 157.38 -0.19
HWM Confidence: Good
HWM RMA-2 DIFF (m)
157.69 157.38 -0.31
HWM Confidence: Good
HWM RMA-2 DIFF (m)
/ 157.20 /
No Measurement Taken
HWM RMA-2 DIFF (m)
156.98 157.22 +0.24
HWM Confidence: Average
HWM RMA-2 DIFF (m)
157.28 157.21 -0.07
HWM Confidence: Average
HWM RMA-2 DIFF (m)
157.12 157.13 +0.01
HWM Confidence: Good
HWM RMA-2 DIFF (m)
157.25 157.16 -0.09
HWM Confidence: Good
HWM RMA-2 DIFF (m)
157.54 157.34 -0.20
HWM Confidence: Average
HWM RMA-2 DIFF (m)
157.12 157.06 -0.06
HWM Confidence: Good
HWM RMA-2 DIFF (m)
157.32 157.17 -0.15
HWM Confidence: Good
HWM RMA-2 DIFF (m)
157.33 157.20 -0.13
HWM Confidence: Average
HWM RMA-2 DIFF (m)
157.11 156.97 -0.14
HWM Confidence: Good
HWM RMA-2 DIFF (m)
/ 156.86 /
No Measurement Taken
HWM RMA-2 DIFF (m)
/ 156.72 /
No Measurement Taken
HWM RMA-2 DIFF (m)
/ 156.23 /
No Measurement Taken
HWM RMA-2 DIFF (m)
157.64 157.32 -0.32
HWM Confidence: Average
Victoria Park Railway Viaduct
COMPARISON OF RMA-2 MODELLED LEVELS FOR THE ‘JUNE 2016’ FLOOD EVENT
FLOOD TO SURVEYED HWMs [EXTENT 3 OF 3]
Note: Shading representative of magnitude of WL difference between observed and modelled flood levels. Green = 0 – 200 mm difference, Orange = 200 – 400 mm difference, Red = 400+ mm
LEGEND:
Location of a Surveyed High Water Mark (HWM) Predicted June 2016 Flood Extent based on RMA-2 Flood Modelling (DRAFT)
Stonequarry at Picton Gauge
HWM RMA-2 DIFF (m)
156.55 156.49 -0.06
HWM Confidence: Good

Wollondilly Shire Council
Picton Post Event Analysis
June 2016 Weather and Flood Event
rp301015-03199rg161125_June 2016 Post Event Analysis (Draft for Public Comment).docx page 10 Revision C
Flood Study which shows that RMA-2 levels for the 1% Annual Exceedance Probability (AEP)
flood were consistently higher than the HEC-RAS modelling that it is proposed to supersede.
3.2.3 Comparison to the 1% AEP Flood
Peak flood levels modelled for the June 2016 event were compared to the peak 1% AEP flood
levels documented in the Flood Study (2014). This comparison involved preparation of flood
level difference mapping to allow a graphical comparison of peak flood levels at each location
within the study area.
Figure 6 to Figure 8 shows the flood level difference mapping. The varying shades of red
mapping indicates locations where the June 2016 flood event is predicted to be higher than the
1% AEP flood. The darker shades of red represent locations where differences are higher in
magnitude.
As shown in Figure 6 to Figure 8, flood levels for the June 2016 flood event are predicted to be
between 0.02 to 0.22 metres higher across the study area than those predicted for the 1% AEP
event (as documented in the Flood Study). The difference between June 2016 and 1% AEP flood
levels can further be broken-down into the following:
0.02 to 0.07 metres higher for areas upstream of the Town (refer Figure 6),
0.07 to 0.16 metres higher for areas around the Town Centre (refer Figure 7), and
0.160 to 0.22 metres higher for areas downstream of the Town (refer Figure 8).
The difference in flood levels is generally highest downstream of the Town where floodwaters
are constricted by the Railway Crossing and gorge (refer Figure 6 to Figure 8).

FIGURE 6
301015-03199-Stonequarry Ck Flood Modelling fg301015-03199rg161013_Fig6_June 2016 less 1% AEP (North).doc
Evelyn Bridge
DRAFT LEGEND:
Areas predicted to flood during the
June 2016 event and not predicted to
flood during the 1% AEP event
COMPARISON OF RMA-2 MODELLED LEVELS FOR THE ‘JUNE 2016’ FLOOD EVENT
AND THE 1% AEP FLOOD [June 2016 less 1% AEP - Extent 1 of 3]
+ 0.05m
+ 0.05m
+ 0.07m
+ 0.05m
+ 0.02m
+ 0.07m
+ 0.05m
+ 0.04m

FIGURE 7
301015-03199-Stonequarry Ck Flood Modelling fg301015-03199rg161013_Fig7_June 2016 less 1% AEP (Town).doc
DRAFT
LEGEND:
Areas predicted to flood during the
June 2016 event and not predicted to
flood during the 1% AEP event
+ 0.10m
+ 0.07m
+ 0.10m + 0.06m
+ 0.07m
+ 0.09m
+ 0.09m
+ 0.14m
+ 0.16m
COMPARISON OF RMA-2 MODELLED LEVELS FOR THE ‘JUNE 2016’ FLOOD EVENT
AND THE 1% AEP FLOOD [June 2016 less 1% AEP - Extent 2 of 3]

COMPARISON OF RMA-2 MODELLED LEVELS FOR THE ‘JUNE 2016’ FLOOD EVENT
AND THE 1% AEP FLOOD [June 2016 less 1% AEP - Extent 3 of 3]
FIGURE 8
301015-03199-Stonequarry Ck Flood Modelling fg301015-03199rg161013_Fig8_June 2016 less 1% AEP (South).doc
DRAFT
Railway Viaduct + 0.22m
+ 0.19m
+ 0.19m
+ 0.16m
+ 0.16m
+ 0.18m
+ 0.17m
+ 0.16m
+ 0.21m
+ 0.22m
LEGEND:
Areas predicted to flood during the
June 2016 event and not predicted to
flood during the 1% AEP event

Wollondilly Shire Council
Picton Post Event Analysis
June 2016 Weather and Flood Event
rp301015-03199rg161125_June 2016 Post Event Analysis (Draft for Public Comment).docx page 11 Revision C
4 CONCLUSIONS
The post event analysis for the June 2016 weather event at Picton has determined that the
recorded rainfall exceeded the amount predicted for a 1% Annual Exceedance Probability (AEP)
event. In that regard, rainfall records at the three nearest rainfall gauges all exceeded the rainfall
depths required for a 1% AEP event over the critical catchment duration of 9 hours.
Hydrologic modelling and hydrodynamic modelling using the existing XP-RAFTS and RMA-2
models, respectively, has also supported the above findings. In that regard, the RMA-2 model
predicts flood levels for the June 2016 event that are between 0.02 to 0.22 metres higher than
those predicted for the 1% AEP event (as documented in the Flood Study).
The validation completed for the XP-RAFTS hydrologic model and RMA-2 hydrodynamic model
has drawn the following conclusions:
The existing XP-RAFTS model was used to simulated the June 2016 event and match the
peak flow recorded at the Stonequarry Gauge with only minor modifications required to
initial and continuing losses.
The hydrograph shape predicted by XP-RAFTS during the rising limb of the flood does not
align with recorded data. Sensitivity analysis indicates initial rainfall losses would need to be
increased to between 80 to 100 mm to achieve a good fit. This range of values is considered
high but not unreasonable given the dry catchment conditions that preceded the event in
June (refer Appendix A).
The RMA-2 model predicted flood levels for the June 2016 event that were on average
0.18 metres lower than the peak flood level recorded at all 76 High Water Marks (HWM);
refer Figure 3 to Figure 5.
The June 2016 validation exercise is considered to provide an acceptable agreement between
flood levels simulated using RMA-2 to the recorded HWM levels.
Wollondilly Shire Council
Picton Post Event Analysis
June 2016 Weather and Flood Event
rp301015-03199rg161125_June 2016 Post Event Analysis (Draft for Public Comment).docx page 12 Revision C
5 REFERENCES
NSW Government (April 2005), ‘Floodplain Development Manual: the Management of Flood Liable
Land’; ISBN 0 7347 5476 0.
NSW Department of Water Resources (1989), ‘Picton Flood Study Report’ [CM1265].
Institution of Engineers (1987), ‘Australian Rainfall and Runoff – A Guide to Flood Estimation’;
edited by DH Pilgrim, ISBN 085825 434 4.
King, I (2001), ‘RMA2 – A Two Dimensional Finite Element Model for Flow in Estuaries and Streams’,
developed by Resource Modelling Associates, Sydney, Australia.
Wollondilly Shire Council (2006), ‘Stonequarry Creek - 2D Modelling and WaterRIDETM
Application’;
prepared by Patterson Britton & Partners.
WP Software (1992), ‘Runoff Analysis & Flow Training Simulation, RAFTS-XP Manual, Version 2.80’
Wollondilly Shire Council (2014), ‘Picton/Stonequarry Creek Flood Study’ (Issue 1 - Draft); prepared
by WorleyParsons.

Wollondilly Shire Council
Picton Post Event Analysis
June 2016 Weather and Flood Event
rp301015-03199rg161125_June 2016 Post Event Analysis (Draft for Public Comment).docx Revision C
Appendix A:
Rainfall Records for Preceding Months

↓ This day is part of an accumulated totalQuality control: 12.3 Done & acceptable, 12.3 Not completed or unknown
2016 Jan Feb Mar Apr May Jun Jul Aug Sep Oct Nov Dec 1st 0 0 0 0 0 1.2 0 0 0 2nd 0 1.2 0 ↓ 0 1.2 0 0 3.4 3rd 0 0 0 ↓ 2.0 0 0 17.0 ↓ 4th 0.6 3.0 0 0.2 0 ↓ 0 0.2 ↓ 5th 47.6 0 0 0 0 ↓ 1.2 1.6 25.2 6th 16.8 ↓ 0 0 ↓ 245.0 3.2 ↓ 0 7th 5.6 ↓ 0 0 ↓ 0 0.4 ↓ 0 8th 0.2 0.4 0 0 ↓ 0 2.0 1.0 0 9th 0 0 0.2 0 ↓ 0.4 ↓ 0.2 0 10th 0 0 0 0 13.6 0 ↓ 0 ↓ 11th 0 0 0 0 0 0 6.4 0 ↓ 12th 0 0 0 1.8 0 0 0 0 2.6 13th 0 0 0 0 0 0 0.6 0 0 14th 0 0 0 0 0 0 0 0 15th 32.0 0 7.0 0 0 0 0 0 16th 0 0 0 ↓ 0 0 ↓ 0 17th 0 0 2.0 ↓ 0 0 ↓ 0 18th 0 0 0 2.0 0 ↓ 2.0 0 19th 0 0 ↓ 2.5 0 ↓ 0 0 20th 0 ↓ ↓ 0 0 30.0 7.0 ↓ 21st 0 ↓ 2.6 0 0 0.2 15.2 ↓ 22nd ↓ 6.4 0 0 0 0 1.0 1.2 23rd ↓ 0 0 0 0 0 ↓ 2.8 24th 37.0 0 0 ↓ 0 0 ↓ 0.2 25th 0 0 0 ↓ 0 ↓ 11.6 24.2 26th ↓ 0 0 2.0 0.2 ↓ 0 0.2 27th 11.6 0 0 0.2 0 0.6 0 0 28th 7.2 0 0 0 ↓ 0.8 0 0 29th ↓ 0 5.8 0 ↓ 0 0 0 30th ↓ 14.0 0 4.2 0 0 0 31st 15.6 0 0 0 0Highest daily 47.6 3.0 14.0 2.5 2.0 1.2 15.2 24.2 3.4Monthly Total 174.2 11.0 31.6 8.7 20.0 279.4 50.6 48.6
Page 1 of 2
Daily Rainfall (millimetres)
PICTON COUNCIL DEPOTStation Number: 068052 · State: NSW · Opened: 1880 · Status: Open · Latitude: 34.17°S · Longitude: 150.61°E · Elevation: 165 m
Product code: IDCJAC0009 reference: 26099849
© Copyright Commonwealth of Australia 2016, Bureau of Meteorology.Prepared using Climate Data Online, Bureau of Meteorology http://www.bom.gov.au/climate/data.Contact us using details on http://www.bom.gov.au/climate/how/contacts.shtml.We have taken all due care but cannot provide any warranty nor accept any liability for this information.http://www.bom.gov.au/other/copyright.shtml

Statistics for this station calculated over all years of dataJan Feb Mar Apr May Jun Jul Aug Sep Oct Nov Dec
Mean 87.4 90.0 87.8 69.9 56.1 67.7 49.7 44.9 44.0 63.7 72.2 70.3Median 67.1 66.4 67.2 49.3 31.2 43.3 26.1 25.2 37.5 49.5 55.5 54.4Highest daily 211.6 216.7 132.6 156.0 132.1 201.9 124.5 118.4 77.5 141.5 245.9 104.1Date of highestdaily
23rd1933
10th1956
25th1890
16th1969
21st1949
12th1964
10th1904
30th1963
11th1929
5th1916
9th1966
13th1910
Page 2 of 2
Daily Rainfall (millimetres)
PICTON COUNCIL DEPOTStation Number: 068052 · State: NSW · Opened: 1880 · Status: Open · Latitude: 34.17°S · Longitude: 150.61°E · Elevation: 165 m
1) Calculation of statistics
Summary statistics, other than the Highest and Lowest values, are only calculated if there are at least 20 years of data available.
2) Gaps and missing data
Gaps may be caused by a damaged instrument, a temporary change to the site operation, ordue to the absence or illness of an observer.
3) Further information
http://www.bom.gov.au/climate/cdo/about/about-rain-data.shtml.
Product code: IDCJAC0009 reference: 26099849 Created on Tue 13 Sep 2016 14:18:48 PM EST
© Copyright Commonwealth of Australia 2016, Bureau of Meteorology.Prepared using Climate Data Online, Bureau of Meteorology http://www.bom.gov.au/climate/dataContact us using details on http://www.bom.gov.au/climate/how/contacts.shtml.We have taken all due care but cannot provide any warranty nor accept any liability for this information.http://www.bom.gov.au/other/copyright.shtml
↓ This day is part of an accumulated totalQuality control: 12.3 Done & acceptable, 12.3 Not completed or unknown
2016 Jan Feb Mar Apr May Jun Jul Aug Sep Oct Nov Dec 1st 0 0 0 0 0 9.4 0 0 2nd 0 0 0 0 0 0 0 0 3rd 0 0 0 0 0 0 0 20.2 4th 6.6 0 0 1.0 0 12.0 0 0 5th 39.4 0 0 0 0 100.0 4.4 2.0 6th 26.0 0 0 0 0 149.0 1.4 0 7th 0 0 0 0 0 0 0.8 1.8 8th 0 8.0 0 0 0 0 0.8 0 9th 0 0 0 0 9.2 0 0 0 10th 0 0 0 0 0 0 0 0 11th 0 0 0 0 0 0 0 0 12th 0 0 0.4 0 0 0 2.4 0 13th 0 0 0 0 0 0 0 0 14th 0 0 0 0 0 0 0 0 15th 33.0 0 2.0 0 0 0 0 0 16th 1.4 0 4.0 0 0 0 0 0 17th 0 0 3.2 6.6 0 0 0 0 18th 0 0 0 0.6 0 6.4 1.4 0 19th 0 0 0 6.0 0 0 0 0 20th 0 0 0 0 0 32.4 12.4 0 21st 0 26.2 0 0 0 0 10.0 0 22nd 21.0 0 0 0 0 0 0 0 23rd 0 0 1.6 0 0 12.0 5.0 24th 4.4 0 0 0.8 0 0 0 0 25th 1.8 0 0 0 0 0 0 30.8 26th 3.4 0 0 0 0 1.4 0 0 27th 2.0 0.4 0 0 0 0 0 0 28th 7.0 0 7.4 0 0 0 0 0 29th 0 0 0 1.6 0 0 0 30th 15.0 11.4 1.4 0 0 0 0 31st 4.0 0 0 0 0Highest daily 39.4 26.2 11.4 6.6 9.2 149.0 12.4 30.8Monthly Total 34.6 28.4 18.0 10.8 310.6 45.6 59.8
Page 1 of 2
Daily Rainfall (millimetres)
OAKDALE (COOYONG PARK)Station Number: 068125 · State: NSW · Opened: 1963 · Status: Open · Latitude: 34.09°S · Longitude: 150.51°E · Elevation: 440 m
Product code: IDCJAC0009 reference: 26100117
© Copyright Commonwealth of Australia 2016, Bureau of Meteorology.Prepared using Climate Data Online, Bureau of Meteorology http://www.bom.gov.au/climate/data.Contact us using details on http://www.bom.gov.au/climate/how/contacts.shtml.We have taken all due care but cannot provide any warranty nor accept any liability for this information.http://www.bom.gov.au/other/copyright.shtml

Statistics for this station calculated over all years of dataJan Feb Mar Apr May Jun Jul Aug Sep Oct Nov Dec
Mean 102.7 130.7 113.4 78.4 50.5 85.9 33.7 44.7 44.4 77.0 99.8 78.6Median 76.3 109.8 85.3 68.6 37.1 49.5 19.4 25.7 42.5 56.6 74.2 78.2Highest daily 131.0 173.6 125.0 162.1 76.2 208.0 52.0 203.2 80.6 106.6 195.8 84.6Date of highestdaily
29th2013
11th2007
22nd1983
16th1969
8th1963
12th1964
28th1984
7th1967
21st1982
24th1975
7th1966
8th1970
Page 2 of 2
Daily Rainfall (millimetres)
OAKDALE (COOYONG PARK)Station Number: 068125 · State: NSW · Opened: 1963 · Status: Open · Latitude: 34.09°S · Longitude: 150.51°E · Elevation: 440 m
1) Calculation of statistics
Summary statistics, other than the Highest and Lowest values, are only calculated if there are at least 20 years of data available.
2) Gaps and missing data
Gaps may be caused by a damaged instrument, a temporary change to the site operation, ordue to the absence or illness of an observer.
3) Further information
http://www.bom.gov.au/climate/cdo/about/about-rain-data.shtml.
Product code: IDCJAC0009 reference: 26100117 Created on Tue 13 Sep 2016 14:27:56 PM EST
© Copyright Commonwealth of Australia 2016, Bureau of Meteorology.Prepared using Climate Data Online, Bureau of Meteorology http://www.bom.gov.au/climate/dataContact us using details on http://www.bom.gov.au/climate/how/contacts.shtml.We have taken all due care but cannot provide any warranty nor accept any liability for this information.http://www.bom.gov.au/other/copyright.shtml

↓ This day is part of an accumulated totalQuality control: 12.3 Done & acceptable, 12.3 Not completed or unknown
2016 Jan Feb Mar Apr May Jun Jul Aug Sep Oct Nov Dec 1st 0 0 0 0 0 2.0 0 0 0 2nd 0 2.0 0 0 0 1.0 0 0 7.0 3rd 0 0 0 0 0 0 0 15.0 21.0 4th 8.0 5.0 0 2.0 0 11.0 0 1.0 0 5th 44.0 0 0 0 0 137.0 5.0 3.0 0 6th 15.0 0 0 0 0 122.0 0 0 0 7th 4.0 0 0 0 0 0 2.0 0 0 8th 0 0 0 0 0 0 6.0 0 0 9th 0 0 0 0 10.0 0 1.0 1.0 0 10th 0 0 0 0 0 0 0 0 2.0 11th 0 0 0 0 0 0 0 0 0 12th 0 0 0 3.0 0 0 0 0 0 13th 0 0 0 0 0 0 0 0 0 14th 0 0 0 0 0 0 0 0 15th 31.0 0 4.0 0 0 0 0 0 16th 1.0 0 1.0 0 0 0 0 0 17th 0 0 4.0 2.0 0 0 0 0 18th 0 0 1.0 0 0 6.0 1.0 0 19th 0 0 1.0 4.0 0 0 0 0 20th 0 0 0 0 0 23.0 14.0 1.0 21st 0 1.0 0 0 0 0 8.0 0 22nd 10.0 0 0 0 0 0 1.0 0 23rd 12.0 0 0 1.0 0 0 8.0 1.0 24th 3.0 0 0 2.0 0 0 0 1.0 25th 0 0 0 0 0 0 0 24.0 26th 1.0 0 0 0 0 0 0 0 27th 0 0 0 0 0 1.0 0 0 28th 1.0 0 0 0 0 0 0 0 29th 0 0 0 0 3.0 0 0 0 30th 50.0 19.0 1.0 0 0 0 0 31st 8.0 0 0 0 0Highest daily 50.0 5.0 19.0 4.0 10.0 137.0 14.0 24.0 21.0Monthly Total 188.0 8.0 30.0 15.0 13.0 303.0 46.0 47.0
Page 1 of 2
Daily Rainfall (millimetres)
MENANGLE BRIDGE (NEPEAN RIVER)Station Number: 068216 · State: NSW · Opened: 1963 · Status: Open · Latitude: 34.12°S · Longitude: 150.74°E · Elevation: Unknown m
Product code: IDCJAC0009 reference: 26100134
© Copyright Commonwealth of Australia 2016, Bureau of Meteorology.Prepared using Climate Data Online, Bureau of Meteorology http://www.bom.gov.au/climate/data.Contact us using details on http://www.bom.gov.au/climate/how/contacts.shtml.We have taken all due care but cannot provide any warranty nor accept any liability for this information.http://www.bom.gov.au/other/copyright.shtml

Statistics for this station calculated over all years of dataJan Feb Mar Apr May Jun Jul Aug Sep Oct Nov Dec
Highest daily 100.0 79.0 84.0 68.0 38.0 137.0 56.0 61.0 32.0 90.0 35.0 53.0Date of highestdaily
29th2013
11th2007
1st2007
19th2012
27th2010
5th2016
1st2005
25th2015
7th2006
10th2010
23rd2013
11th2004
Page 2 of 2
Daily Rainfall (millimetres)
MENANGLE BRIDGE (NEPEAN RIVER)Station Number: 068216 · State: NSW · Opened: 1963 · Status: Open · Latitude: 34.12°S · Longitude: 150.74°E · Elevation: Unknown m
1) Calculation of statistics
Summary statistics, other than the Highest and Lowest values, are only calculated if there are at least 20 years of data available.
2) Gaps and missing data
Gaps may be caused by a damaged instrument, a temporary change to the site operation, ordue to the absence or illness of an observer.
3) Further information
http://www.bom.gov.au/climate/cdo/about/about-rain-data.shtml.
Product code: IDCJAC0009 reference: 26100134 Created on Tue 13 Sep 2016 14:29:25 PM EST
© Copyright Commonwealth of Australia 2016, Bureau of Meteorology.Prepared using Climate Data Online, Bureau of Meteorology http://www.bom.gov.au/climate/dataContact us using details on http://www.bom.gov.au/climate/how/contacts.shtml.We have taken all due care but cannot provide any warranty nor accept any liability for this information.http://www.bom.gov.au/other/copyright.shtml


