
1
Healthcare Environmental Terms and Outcome Measures:
An Evidence-based Design Glossary
Research Coalition
Phase I RePoRt
By
Xiaobo Quan, PhD, EDACResearch AssociateThe Center for Health Design
Anjali Joseph, PhD, EDACDirector of ResearchThe Center for Health Design
November 2011
Eileen Malone, RN, MSN, MS, EDACSenior PartnerMercury Healthcare Consulting, LLC.Research Coalition Member
Debajyoti Pati, PhD, FIIA, LEED APExecutive DirectorCenter for Advanced Design Research & Evaluation (CADRE)Research Coalition Member

abstract V
healthcare environmental terms and outcome Measures: an evidence-based Design Glossary
itable of Contents |
I. Introduction ............................................................................................. 1
Background ............................................................................................................ 1
Purpose of this Project ........................................................................................... 2
Acknowledgements ................................................................................................ 2
II. Methods ................................................................................................... 3
Advisory Committee ............................................................................................... 3
Literature Search .................................................................................................... 3
Literature Analysis .................................................................................................. 4
III. Results ..................................................................................................... 5
A. Healthcare-associated Infections ...................................................................... 8
B. Medical Errors .................................................................................................... 13
C. Patient Falls ........................................................................................................ 15
D. Patient Satisfaction ............................................................................................ 17
E. Patient Waiting ................................................................................................... 20
F. Staff Efficiency .................................................................................................... 22
G. Staff Satisfaction ................................................................................................ 25
IV. Healthcare Environmental Variables ......................................................... 28
V. Healthcare Outcome Measures ................................................................ 44
VI. Using the Glossary .................................................................................. 63
VII. Conclusion ............................................................................................... 65
VIII. Next Steps ............................................................................................... 67
IX. Appendix .................................................................................................. 68
Table of Contents
healthcare environmental terms and outcome Measures: an evidence-based Design Glossary

abstract V
healthcare environmental terms and outcome Measures: an evidence-based Design Glossary
1Introduction |
Research into the impact of the healthcare environment on healthcare outcomes
has been growing rapidly in recent years. Many scientific studies have collected
empirical evidence demonstrating connections between the environmental
design of healthcare facilities and outcomes that are important for patients,
families, healthcare staff, and healthcare organizations (Ulrich et al., 2008).
As a result, there is a growing understanding that an appropriately designed
built environment can help to improve patient outcomes; create a safe,
nurturing, and positive work environment for caregivers; and help achieve
organizational and business objectives.
A key issue increasingly restricting the development and application of evidence-
based design (EBD) research is the lack of a standard glossary of terms, definitions,
metrics, and measurement tools that are commonly accepted by interdisciplinary
design team members including researchers, designers, administrators, clinicians,
and other stakeholders. This results in:
A lack of generalizability in healthcare design research studies•
Difficulty translating research findings into design knowledge•
Difficulty developing a centralized evidence base for design •
Inefficient communication between stakeholders•
Difficulty benchmarking or comparing multiple facilities and •
conducting multi-site studies
Difficulty making informed predictions based on research findings•
To further promote the development, translation, and use of research about the built
environment and its impact on healthcare outcomes, The Center for Health Design
(CHD) initiated a project in October 2009 to develop a standard glossary of key
environmental terms and healthcare outcome measures.
I. Introduction
healthcare environmental terms and outcome Measures: an evidence-based Design Glossary
Background

abstract V
healthcare environmental terms and outcome Measures: an evidence-based Design Glossary
2Introduction |
Purpose of this project
Phase I of this glossary project identified variables and metrics found in EBD
research that examined relationships between environmental elements and healthcare
outcomes in seven high-priority topic areas:
Healthcare-associated infections (HAIs)•
Medical errors•
Patient falls•
Patient satisfaction•
Patient waiting•
Staff efficiency•
Staff satisfaction•
The authors are grateful for the support of the Research Coalition (view all members
here: http://www.healthdesign.org/chd/about-chd/volunteer-councils/research-coalition).
The authors would like to specifically thank the EBD glossary groups who provided
feedback and guidance during the course of this project:
Paul Barach, MD, MPH, Clinician
Debra Harris, PhD, President and CEO, RAD Consultants
Colonel Guy Kiyokawa, Assistant Chief of Staff Facilities,
Office of The Surgeon General
Roger Leib, AIA, ACHA, President, Leib & Leib, Inc
Mark Patterson, AIA, LEED AP, Vice President, SmithGroup
Bill Rostenberg, FAIA, FACHA, ACHE, EDAC, Principal, Director of Research,
Anshen+Allen, a part of Stantec Architecture
Mardelle Shepley, D.Arch., AIA, EDAC, Professor and Director,
Center for Health Systems & Design, Texas A&M University
Craig Zimring, PhD, EDAC, Professor, Georgia Institute of Technology
Acknowledgements

abstract V
healthcare environmental terms and outcome Measures: an evidence-based Design Glossary
3Methods |
II. Methods
healthcare environmental terms and outcome Measures: an evidence-based Design Glossary
The glossary project was conducted in several steps. Each step focused on one or two
of the seven high-priority topic areas.
Advisory committee
An advisory committee consisting of six academic and industry experts from CHD’s
Research Coalition provided guidance throughout the project. The committee
regularly conducted telephone conferences, reviewed results for each topic area, and
provided suggestions and comments, including recommendations for additional
environmental features and articles to be included in the project’s literature analysis.
Literature search
An extensive search and review of research publications was conducted in each of
the seven high-priority topic areas. The search focused on articles that: empirically
revealed connections between physical environment variables such as ventilation
rate and targeted healthcare outcomes such as infection rate; and were published in
peer-reviewed journals in relevant disciplines such as medicine, nursing, healthcare
service, management, architecture, and planning.
The literature search was conducted using several methods:
Relevant articles from CHD’s previous work were examined. This included •
two extensive reviews of EBD research literature conducted in 2004 and 2008,
led by Ulrich and colleagues; and a research project focusing on the effects of
sustainable design, sponsored by the U.S. Green Building Council.
Research databases such as PubMed and EBSCO were searched for articles •
published after CHD’s literature reviews.
Additional relevant articles were found through references in the existing •
articles and through recommendations of advisory committee members.
abstract V
healthcare environmental terms and outcome Measures: an evidence-based Design Glossary
4Methods |
Literature analysis
The top priority of the literature review was to identify all physical environment
variables that have been found to impact targeted healthcare outcomes (e.g., HAIs)
and to examine how these variables and outcomes were defined and measured in the
existing research. Therefore, although multiple research articles were available for one
environmental variable in many cases, articles were selected for detailed analysis based
on the number and variety of metrics and measurement tools used in the research.
Information extracted from each article included definitions (when available) of
the environmental variable(s) and outcome(s), measurement tool(s), sample size(s),
setting(s), research design, and research findings. The extracted information was
compiled into an article analysis table. The relationships that were studied between
environmental variables, intermediate environmental quality variables, and outcome
variables were illustrated using a topic model framework and a relationship matrix.
Definitions and metrics used in the literature for each environmental variable or
outcome measure were compiled into a glossary table and cross-referenced to the
relevant topics.
abstract V
healthcare environmental terms and outcome Measures: an evidence-based Design Glossary
5Results |
III. Results
healthcare environmental terms and outcome Measures: an evidence-based Design Glossary
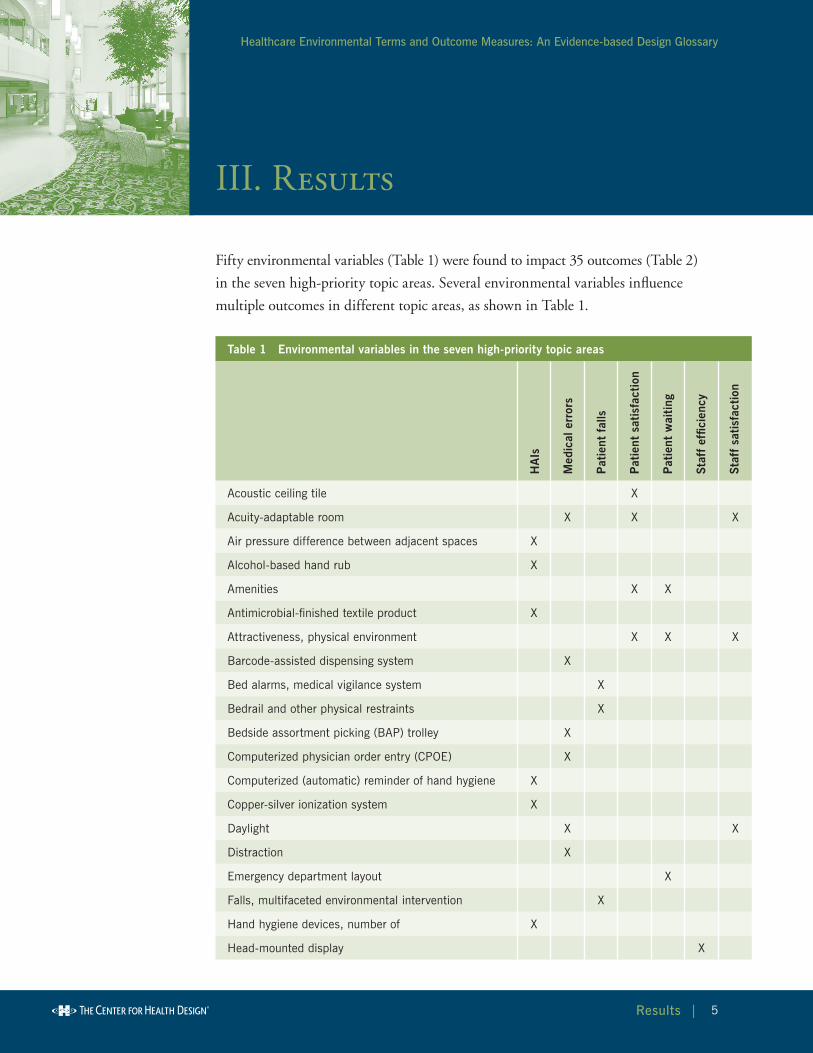
Fifty environmental variables (Table 1) were found to impact 35 outcomes (Table 2)
in the seven high-priority topic areas. Several environmental variables influence
multiple outcomes in different topic areas, as shown in Table 1.
Table 1 Environmental variables in the seven high-priority topic areas
Acoustic ceiling tile X
Acuity-adaptable room X X X
Air pressure difference between adjacent spaces X
Alcohol-based hand rub X
Amenities X X
Antimicrobial-finished textile product X
Attractiveness, physical environment X X X
Barcode-assisted dispensing system X
Bed alarms, medical vigilance system X
Bedrail and other physical restraints X
Bedside assortment picking (BAP) trolley X
Computerized physician order entry (CPOE) X
Computerized (automatic) reminder of hand hygiene X
Copper-silver ionization system X
Daylight X X
Distraction X
Emergency department layout X
Falls, multifaceted environmental intervention X
Hand hygiene devices, number of X
Head-mounted display X
HA
Is
Med
ical
err
ors
Pat
ient
fal
ls
Pat
ient
sat
isfa
ctio
n
Pat
ient
wai
ting
Staf
f ef
ficie
ncy
Staf
f sa
tisf
acti
on

abstract V
healthcare environmental terms and outcome Measures: an evidence-based Design Glossary
6Results |
Table 1 Environmental variables in the seven high-priority topic areas (continued)
High-efficiency particulate air (HEPA) filter X
HEPA filters, location of X
Illumination level (illuminance) X X
Information access X
Interior finish material X X
Interruption X
Laminar air flow X
Light fixture (luminaire) X
Medication distribution system X
Mobile air-treatment unit X
Music X X
Noise X X X X X
Nursing station layout X X
Nursing unit shape/layout X
Patient bathroom design X
Patient room layout X X
Patient room occupancy X X X X
Pharmacy equipment X
Physical configuration of drug stock shelves X
Physical proximity X
Positive distractions X X
Rapid assessment clinic/pod/zone X
Subfloor X
Surface cleaning X
Ultraviolet germicidal irradiation X
Ventilation grilles, location of X
Ventilation, natural X
Ventilation rate X
Wireless technology X
Workroom layout X
HA
Is
Med
ical
err
ors
Pat
ient
fal
ls
Pat
ient
sat
isfa
ctio
n
Pat
ient
wai
ting
Staf
f ef
ficie
ncy
Staf
f sa
tisf
acti
on

abstract V
healthcare environmental terms and outcome Measures: an evidence-based Design Glossary
7Results |
Table 2 Outcomes in the seven topic areas
Adverse drug event (ADE) X
Anxiety X
Bacterial growth X
Bioaerosol concentration X
Burnout X
Circadian misalignment X
Cleaning, thoroughness of terminal cleaning X
Endotoxin concentration X
Fall-related injuries X
Falls, patient X
Hand hygiene compliance X
Job satisfaction X
Length of stay X
Medication administration procedural failure X
Medication errors X
Medication processing time X
Mortality X
Nosocomial infections X
Nurse response to patient call X
Particulate level X
Patient colonization X
Patient loyalty X
Perception of physical environment X
Satisfaction, patient X X
Staff travel X
Stress, staff X
Surface contamination X
Surgeon/anesthesiologist performance X
Surgical errors X
Team communication X
HA
Is
Med
ical
err
ors
Pat
ient
fal
ls
Pat
ient
sat
isfa
ctio
n
Pat
ient
wai
ting
Staf
f ef
ficie
ncy
Staf
f sa
tisf
acti
on

abstract V
healthcare environmental terms and outcome Measures: an evidence-based Design Glossary
8Results |
Table 2 Outcomes in the seven topic areas (continued)
Transport, intra-hospital patient transport X
Tuberculin conversion and reactivity X
Turnover intent X
Waiting behavior, patient X
Waiting time, patient X
HA
Is
Med
ical
err
ors
Pat
ient
fal
ls
Pat
ient
sat
isfa
ctio
n
Pat
ient
wai
ting
Staf
f ef
ficie
ncy
Staf
f sa
tisf
acti
on
Detailed findings for each high-priority topic area are presented in three tables and
one model/framework:
An article analysis table including environmental and outcome variables, •
metrics, measurement tools, settings, study design, and other details
extracted from each article
A glossary table summarizing the environmental and outcome variables, •
definitions, metrics, and measurement tools in each topic area
A matrix illustrating the connections between environmental variables and •
outcome variables
A model/framework illustrating the relationships between environmental •
variables, intermediate environmental quality variables, and outcome variables
The Results chapter is organized into seven sections, each focusing on one high-priority
topic area. Each section includes a summary of key research findings for that topic
and a model/framework depicting the topic’s environmental variables, intermediate
environmental quality variables, outcome variables, and the studied relationships between
these variables. The article analysis tables, glossary tables, and matrices are included
in the Appendix which can be found at: http://www.healthdesign.org/chd/research/
healthcare-environmental-terms-and-outcome-measures-evidence-based-design-glossary.
A. Healthcare-associated Infections
The environmental variables impacting HAIs can be grouped according to the major
routes of infection transmission–air, inanimate surfaces, water, and the hands of staff

abstract V
healthcare environmental terms and outcome Measures: an evidence-based Design Glossary
9Results |
members (Figure 1). Studies show that reducing the contamination of air, inanimate
surfaces, and water as well as improving hand hygiene influences the prevalence rate
of HAIs and related outcomes.
Environmental variables impacting air hygiene can be classified into two
categories—air flow design and air disinfection. Significant air flow design variables
include patient room occupancy (single room versus open unit), location of
ventilation grilles, ventilation rate, laminar air flow, air pressure difference between
adjacent spaces, and environmental factors impacting natural ventilation (Beggs,
Kerr, Noakes, Hathway, & Sleigh, 2008; Gardner, Court, Brocklebank, Downham,
& Weightman, 1973; Hutton, Stead, Cauthen, Bloch, & Ewing, 1990; Jiang et al.,
2003; Menzies, Fanning, Yuan, & Fitzgerald, 2000).
One computational f luid dynamics study found that placing ventilation grilles
on ceilings resulted in faster reduction of bioaerosol concentration than placing
the grilles on walls (Beggs et al., 2008). Another study found that air f lowing
from a positive-pressure room where a patient had a large tuberculous abscess
contributed to higher risk of tuberculin conversion in healthcare workers and
reactivity in visitors and patients in adjacent areas (Hutton, Stead, Cauthen,
Bloch, & Ewing, 1990). The size of operable windows, as measured by the ratio
of window area to room volume, was negatively associated with infection rates
of severe acute respiratory syndrome (Jiang et al., 2003).
Environmental strategies for air disinfection include high-efficiency particulate
air (HEPA) filters, mobile air-treatment units using nonthermal-plasma reactors,
ultraviolet germicidal irradiation (UVGI), ventilation system maintenance, and
control of construction work (Barnes & Rogers, 1989; Bergeron, Reboux, Poirot, &
Laudinet, 2007; Lutz, Rinaldi, Wickes, Huycke, & Mark, 2003; McDevitt, Milton,
Rudnick, & First, 2008).
Crimi and others (2006) examined how the location of HEPA filters in the
HVAC system significantly inf luenced air contamination level. Microbiological
surveillance data showed that air contamination level was lower in hospital
departments with HEPA filters placed at the openings of air ducts (peripheral)
versus inside main air ducts (central).

abstract V
healthcare environmental terms and outcome Measures: an evidence-based Design Glossary
10Results |
Environmental factors influencing the contamination of inanimate surfaces include
interior finish materials such as flooring and furniture surfaces as well as surface
cleaning methods (Anderson, Mackel, Stoler, & Mallison, 1982; Lankford, Collins,
Youngberg, Rooney, Warren, & Noskin, 2006).
Anderson and colleagues (1982) conducted an experiment in two patient rooms—
one with carpet and one with bare vinyl flooring—and reported higher surface
contamination on the carpet. Harris et al., (2010) examined bacterial community
composition on carpet and vinyl flooring and found a lower number of genera but
higher numbers of bacterial genus/species associated with genera of pathogenic
bacteria on vinyl samples. Lankford et al., (2006) reported higher vancomycin-
resistant enterococci (VRE) growth on vinyl composition tile, microvented
perforated vinyl wallcovering, and paper-backed wallcovering than on other
materials including synthetic or vinyl-backed carpet. Noskin and colleagues (2000)
reported that disinfection with a quaternary ammonium germicide successfully
removed VRE from vinyl furniture covering but not from fabric covering.
Hand hygiene is an important approach to preventing HAIs. Hand hygiene
compliance can be improved by installing more hand hygiene devices, using alcohol-
based hand rub dispensers, and utilizing automatic computerized reminder systems
(Cohen, Saiman, Cimiotti, & Larson, 2003; Kaplan & McGuckin, 1986; Swoboda,
Earsing, Strauss, Lane, & Lipsett, 2004).
In a comparison of two neonatal intensive care units (NICUs) with different
handwashing devices, Cohen and colleagues (2003) found that staff hand hygiene
was better in the unit with alcohol-based hand rub dispensers than in the unit with
antimicrobial soap and sinks. Kaplan & McGuckin (1986) reported that staff hand
hygiene compliance was higher in an intensive care unit (ICU) with a bed-to-sink
ratio of 1:1 than in an ICU with a bed-to-sink ratio of 4:1. A team led by Swoboda
(2004) evaluated the effectiveness of a computerized reminding system that gave
prerecorded audio/visual messages instructing staff to wash their hands. The team
found that the installation of this system resulted in significant increases in hand
hygiene compliance and reduction of infections.
The water transmission of pathogens may be interrupted by a water
disinfection system using copper-silver ionization. Modol et al., (2007)
abstract V
healthcare environmental terms and outcome Measures: an evidence-based Design Glossary
11Results |
found that the installation of the copper-silver ionization system significantly
reduced water colonization of L. pneumophila and reduced the infection rate
of hospital-acquired Legionnaires’ disease from 2.45 to 0.18 cases per 1,000
patient discharges.
The vast majority of the above-mentioned environmental variables were
measured on a categorical scale, such as single- versus multiple-occupancy
rooms, central versus peripheral ventilation grilles, and alcohol-based hand
rub dispensers versus water/soap sinks. Some environmental variables were
measured on an interval/ratio scale. For example, ventilation rate was measured
by air changes per hour or cubic feet per minute, and one metric of the relative
number of hand hygiene devices was bed-to-sink/dispenser ratio. In most
cases, environmental variables were manipulated by designers or researchers and
treated as independent variables. Other methods of measuring environmental
variables included site inspection and the tracer gas concentration decay
technique for measuring ventilation rate.
Two groups of outcomes have been examined in literature:
Healthcare hygiene such as the contamination of environmental surfaces, •
bioaerosol concentration, and hand hygiene compliance
Healthcare outcomes such as infection rate, colonization, and length of stay •
All outcomes were typically measured on an interval/ratio scale. Measurement
tools included:
Air sampling using particle counter or biocollector•
Surface culture•
Biology analysis•
Generic analysis (denaturing gradient gel electrophoresis)•
Fluorescent marker•
Behavior observation•
Automatic electronic system•

abstract V
healthcare environmental terms and outcome Measures: an evidence-based Design Glossary
12Results |
Microbiology surveillance•
Tuberculosis (TB) skin test•
Medical charts•
Estimation using established models/equations •
For details, see the glossary table in the HAIs topic area, in the Appendix at http://
www.healthdesign.org/chd/research/healthcare-environmental-terms-and-outcome-
measures-evidence-based-design-glossary.
FIgurE 1Model of environmental variables examined in relationship to haIs
Air flow designAir pressure difference between adjacent spaces Positive pressure room Negative pressure roomLaminar air flow (LAF)Location of ventilation grillesVentilation system typeVentilation rateEnvironmental factors influencing natural ventilation
Patient room occupancyPhysical proximity
Environmental variables Environmental qualities Outcomes
Air contaminationParticulate levelBioaerosol concentration(fungi, virus, bacteria, etc.)
Healthcare-associated infectionNosocomial infection rateRisk of infectionTuberculin conversion & reactivityPatient colonization (frequency, time delay)
Length of stay MortalityInanimate surface contaminationSurface contaminationBacterial growthThoroughness of terminal cleaningViable microbial concentrationEndotoxin concentration
Water contaminationColonization of Legionella
Hand hygieneHand hygiene complianceHand hygiene complianceHand hygiene frequencyDispenser use frequency
Air disinfectionHigh-efficiency participate air (HEPA) filterLocation of HEPA filtersMobile air-treatment unitUltraviolet germicidal irradiation (UVGI)HVAC system maintenanceConstruction work
Inanimate surfacesInterior finish materialFurniture covering materialAntimicrobial-finished textile productSurface cleaning
Water disinfection systemCopper-silver ionization
Hand hygiene deviceNumber of hand hygiene devicesAlcohol-based hand rubAutomatic computerized reminder
abstract V
healthcare environmental terms and outcome Measures: an evidence-based Design Glossary
13Results |
B. Medical Errors
Research has found that the design of the physical environment can impact two
groups of medical errors—medication errors and surgical errors (Figure 2).
Environmental variables impacting medication errors include lighting fixtures,
measures to reduce distractions and interruptions, acoustic design, use of
acuity-adaptable rooms, and infrastructures for barcode-assisted dispensing and
computerized physician order entry (CPOE) systems.
By manipulating lighting fixtures, Buchanan and colleagues (1991) evaluated the
performance of pharmacists under three illumination levels – 45, 102, and 146
foot candles (ftc) – and found significantly fewer medication dispensing errors at
higher illumination levels (146 versus 45 ftc). Length of daylight exposure had a
positive correlation to nurses’ medication administration errors in Alaska (Booker &
Roseman, 1995). Distractions and interruptions caused by noise and unrelated traffic
near pharmacists’ work areas were associated with higher numbers of dispensing
errors (Flynn et al., 1999). Physical separation and distance between items on
drug stock storage shelves tended to help reduce medication dispensing errors in
pharmacies (Flynn, Dorris, Holman, Garnahan, & Barker, 2002). Renovating and
combining a critical care unit and a step-down unit into one, acuity-adaptable unit
led to significant reductions in patient transfers and medication errors (Hendrich,
Fay, & Sorrells, 2004). A dedicated medication repackaging center in the pharmacy
and a bedside assortment picking trolley were among physical environment features
supporting the implementation of a barcode-assisted dispensing system and CPOE,
both of which significantly reduced dispensing errors (Poon et al., 2006).
Environmental factors impacting surgical errors include distractions and noise.
A simulated experiment showed that surgeons tended to make more errors while
performing surgical tasks when exposed to auditory distractions such as popular
songs and social conversation irrelevant to the surgical tasks (Pluyter, Buzink,
Rutkowski, & Jakimowicz, 2010). Another experiment suggested that reducing the
operating room’s background noise level might help reduce surgical errors (Moorthy,
Munz, Dosis, Bann, & Darzi, 2003).
Environmental interventions are typically manipulated and measured on a
categorical scale such as yes or no. Other environmental variables are measured

abstract V
healthcare environmental terms and outcome Measures: an evidence-based Design Glossary
14Results |
on an interval/ratio scale. For example, lighting level is typically measured
by a photometer; noise level, by a sound meter or dosimeter; distractions and
interruptions, by direct observation and video-recording.
The two main metrics of medical errors include prevalence (e.g., dispensing errors
per pharmacist per hour) and severity (e.g., minor versus major errors). The two
major methods of measuring medication errors are direct observation with expert
evaluation and use of existing data from adverse event reporting systems. The direct
observation method is more frequently used. Surgical errors are mainly measured by
a surgery simulation system.
Measures to eliminate impacts of unrelated traffic (visual barriers, reroute traffic, etc.), unit configuration, access to information sources
Light fixtures Illumination level
Environmentalvariables
Environmentalqualities Outcomes
Distraction interruption
Surgical errors
Medication administration procedural failure
Medication error
Intro hospitalpatient transfer
Adverse drug event
Noise
Separation between drug items
Barcode-assisted dispensing system
Computerized physician order entry (CPOE)
Acoustic design
Physical configuration of drug stock shelves
Dedicated medication repackaging center in pharmacy
Bedside assortment picking (BAP) trolley
Acuity-adaptable rooms
FIgurE 2Model of environmental variables examined in relationship to medical errors

abstract V
healthcare environmental terms and outcome Measures: an evidence-based Design Glossary
15Results |
C. Patient Falls
Environmental interventions aiming at reducing patient falls were often studied as
one component of comprehensive patient fall prevention programs. Such programs
typically included additional interventions such as training, education, physical
excise, and policy and operational changes.
Becker et al., (2003) evaluated environmental hazards contributing to patient falls
and implemented a fall-prevention program that included modifications to lighting,
chair and bed height, floor surfaces, room clutter, and grab bars. The program
also included staff training, patient education, physical exercise, and protection.
The patient fall rate decreased after the program’s implementation. However,
environmental interventions could not be disentangled from other interventions,
making it difficult to estimate the contributions of the environmental interventions.
Environmental factors impacting patient falls can be grouped into two categories–
environmental hazards that directly impact patients and factors that impact staff ’s
ability to monitor patients and provide assistance (Figure 3).
Fall-related environmental hazards include physical restraints such as bedrails,
hard flooring and sub-flooring, noise, shared bathrooms, limited opening area
for bathroom doors, and other factors. Capezuti, Strumpf, Evans, Grisso, and
Maislin (1998) reported that the removal of physical restraints such as vests,
wrist/ankle restraints, and belts resulted in lower rates of falls and fall-related
injuries. Healey (1994) found that patients who fell on vinyl flooring received
more injuries than patients who fell on carpets. Simpson, Lamb, Roberts,
Gardner, and Evans (2004) found that the rate of fall-related hip fractures was
lower for falls on a wooden sub-floor than for falls on a concrete sub-floor.
A recently completed multi-site correlational study conducted by Calkins,
Biddle, and Biesan (2011) identified multiple environmental factors impacting
patient fall rates: bathroom design (e.g., private versus shared, amount of space
between the opening side of the bathroom door and the closest wall or other
obstacles, toilet location, grab bars around toilet), patient room layout (e.g.,
bathroom located at the headwall), f looring (e.g., size of f looring pattern,
f looring material), and noise (e.g., alarms, overhead paging).

abstract V
healthcare environmental terms and outcome Measures: an evidence-based Design Glossary
16Results |
Design strategies that enhance staff ’s ability to monitor patients and provide
assistance for the purpose of fall prevention include family space in patient rooms,
medical vigilance systems, and decentralized nursing stations.
Renovating a nursing unit from a centralized nursing station with semi-private
rooms to decentralized nursing stations with family spaces in single rooms
reduced patient falls from 4 or more falls per 100 patient days to 2 falls per patient
days (Hendrich et al., 2004). Designated family space in patient rooms was an
independent factor contributing to lower rate of patient falls (Calkins et al., 2011).
A medical vigilance system in which sensors on patient beds connected to a nursing
call system to alarm nurses when patients left their beds, was also effective in
preventing patient falls (Spetz, Jacobs, & Hatler, 2007).
Environmental variables related to patient falls are typically categorical variables, for
example, the type of flooring materials (carpet versus vinyl), or the type of nursing
station layout (decentralized versus centralized). Three methods are used to measure
environmental variables in observational studies: inspection or audit of the existing
physical environment, data collected from existing incidence/accident reports,
and direct observation of the usage of environmental features (e.g., use of physical
restraints).
In interventional studies, environmental variables are typically manipulated by
researchers, designers, or administrators. The major outcomes of these studies are
patient falls and fall-related injuries. Currently, there are no universally accepted
definitions, metrics, or measurement tools for these outcomes. Both outcomes can
be measured by prevalence (e.g., number of falls or injuries per 1,000 patient days)
and severity (e.g., percentage of falls resulting in injuries of different severity levels,
number of hip fractures per 100 falls).
The measurement of falls and fall-related injuries has been highly dependent on
incidence/accident reporting systems used by individual healthcare facilities.
Different facilities use different systems, and self-reporting by staff is often
biased. The lack of a universally accepted measurement system threatens the
validity and generalizability of research.

abstract V
healthcare environmental terms and outcome Measures: an evidence-based Design Glossary
17Results |
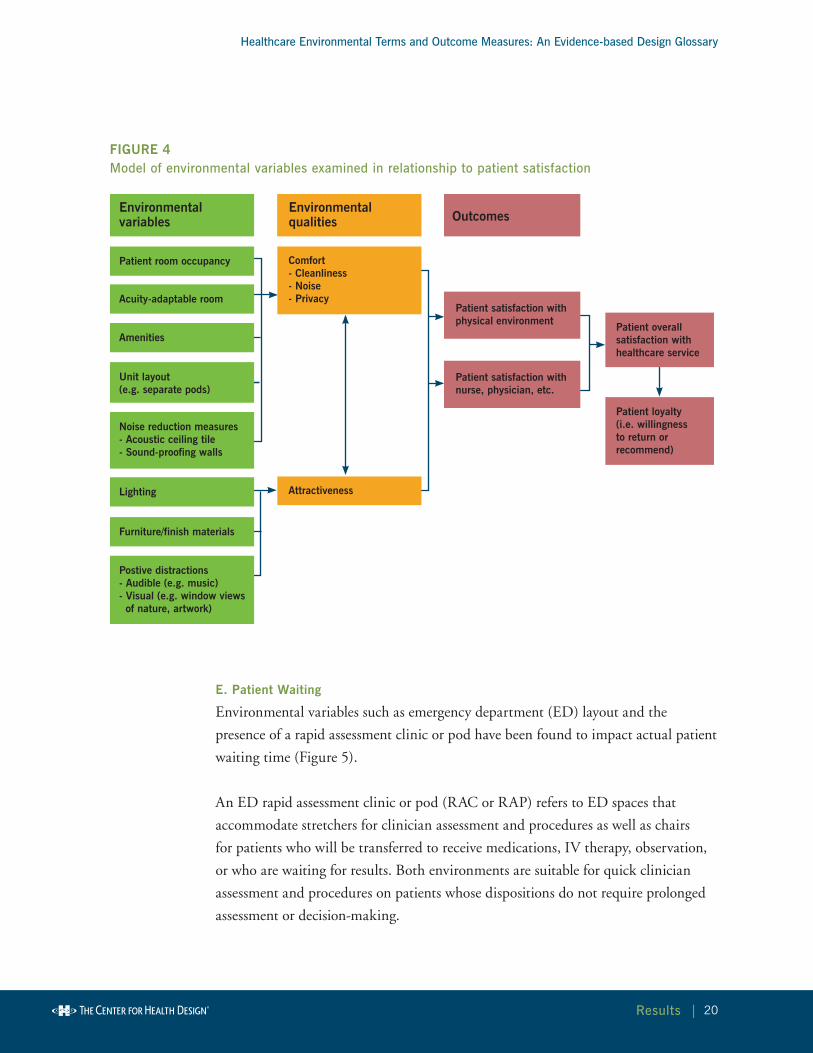
D. Patient Satisfaction
Environmental variables impacting patient satisfaction can be classified into two
main groups – factors related to patients’ physical comfort and factors related to
aesthetic qualities of the physical environment (Figure 4).
Variables influencing patients’ physical comfort include noise reduction measures,
room occupancy (number of beds in one room), acuity-adaptable rooms, unit layout,
and amenities. Single-bed patient rooms scored higher than double-bed and multi-
bed rooms in terms of patient satisfaction with admissions, hospital environment,
information, overall quality of care, and other aspects of healthcare services (Harris,
Shepley, & White, 2006; Nguyen Thi, Briancon, Empereur, & Guillemin, 2002). A
comparison of double-bed rooms and multi-bed rooms showed that patients staying in
double rooms were more satisfied than patients in multi-bed rooms (Soufi et al., 2010).
Hendrich and others (2004) reported a significant decrease in patient dissatisfaction
after a building renovation combined separate critical care and step-down units into
Bedrails and other restraints
Patient bathroom design
Noise
Patient room layout
Medical vigilance system
Nursing station layout(decentrailized versus centralized)
Multifaceted environmental intervention (flooring, door openings, furniture height, lighting, environmental obstacles)
Flooring (finished material & subfloor)
Environmental variables Environmental qualities Outcomes
Environmental hazards related to patient falls & injuries
Ease of patientmonitoring & assistance
Patient falls
Patient fall-related injuries
FIgurE 3Model of environmental variables examined in relationship to patient falls

abstract V
healthcare environmental terms and outcome Measures: an evidence-based Design Glossary
18Results |
one acuity-adaptable unit. Hagerman and colleagues (2005) found that patients were
more satisfied with the overall quality of care and staff attitude after sound-reflecting
ceiling tiles were replaced with sound-absorbing tiles that reduced noise.
Some before-after studies examined the effects of combined environmental factors
on patient satisfaction. Patient satisfaction was significantly higher in a new
unit with separated pods of patient bays, decentralized work stations, wireless
communication, patient controlled lighting, windows, and a television for each
patient than in an old unit with limited privacy, noise, no windows, harsh lighting,
and a centralized nursing station (Smykowski, 2008). Patients were more satisfied
with a new unit featuring single rooms, spaces for families and visitors, and wireless
communication than an old unit lacking these features (Kline et al., 2007).
Within the group of environmental factors related to aesthetic qualities of the
physical environment, attractiveness of the physical environment is an important
predictor of patients’ overall satisfaction with healthcare service. Higher attractiveness
rating scores were associated with higher overall satisfaction in both outpatient and
inpatient settings (Becker & Douglass, 2008; Swan, Richardson, & Hutton, 2003).
Specific factors in this group include positive audio distractions such as music;
positive visual distractions such as nature views and artwork; lighting; furniture;
and finish materials. Women who listened to relaxing music while undergoing
a Cesarean delivery reported greater satisfaction with the experience (Chang &
Chen, 2005). A new clinic waiting area with separated sub-areas, soothing music,
nature views, and warm wall colors and lighting was associated with higher patient
satisfaction than the old waiting area which featured one big room and “hospital-
like” colors (Groff, Carlson, Tsang, & Potter, 2008). Patients were more satisfied
with a waiting room environment incorporating healing features such as wooden
chairs, nature photography, and indoor plants than with a traditional waiting
room featuring elements such as plastic-covered chairs and small dried flower
arrangements (Leather, Beale, Santos, Watts, & Lee, 2003).
The majority of environmental variables found for patient satisfaction were design
or experimental interventions manipulated by designers or researchers. The
interventions included positive distractions, acoustic ceiling tiles, acuity-adaptable
rooms, and amenities.

abstract V
healthcare environmental terms and outcome Measures: an evidence-based Design Glossary
19Results |
Other environmental variables were measured using different methods. Patient
room occupancy was measured using existing data from medical and administrative
databases. Noise was measured by sound measurement equipment.
Subjective rating tools were used for rating physical environment attractiveness and
patient perception of the physical environment.
Outcomes were measured by a variety of questionnaires/scales. Samples of patient
satisfaction questionnaires/scales, including section titles and actual questions,
were listed and compared. Patient satisfaction was found to refer to various aspects
of healthcare, including physical environment, nurse, physician, overall experience,
access/admission, discharge, food, family/visitor, cost, and overall quality. Another
finding was that satisfaction surveys used in a research study might only cover a
subset of the various aspects of healthcare. Therefore, patient satisfaction scores in
different studies may not be fully comparable.
Two major scoring methods used in patient satisfaction are:
Summation or average of scores of items in the scale or subscales •
(Groff et al., 2008)
Count or percentage of the most favorable answer (e.g., “excellent” response in •
Becker & Douglass, 2008)
Patient satisfaction refers to a patient’s perception about past experience. Patient
loyalty indicates the likelihood of a patient using the service again or recommending
the service in the future. Another closely related variable in patient satisfaction
literature is patient anxiety which is typically measured by standard anxiety scales
(e.g., Spielberger State-Trait Anxiety Inventory [S-STAI] score).
abstract V
healthcare environmental terms and outcome Measures: an evidence-based Design Glossary
20Results |
E. Patient Waiting
Environmental variables such as emergency department (ED) layout and the
presence of a rapid assessment clinic or pod have been found to impact actual patient
waiting time (Figure 5).
An ED rapid assessment clinic or pod (RAC or RAP) refers to ED spaces that
accommodate stretchers for clinician assessment and procedures as well as chairs
for patients who will be transferred to receive medications, IV therapy, observation,
or who are waiting for results. Both environments are suitable for quick clinician
assessment and procedures on patients whose dispositions do not require prolonged
assessment or decision-making.
Patient room occupancy
Acuity-adaptable room
Amenities
Lighting
Furniture/finish materials
Postive distractions- Audible (e.g. music)- Visual (e.g. window views of nature, artwork)
Noise reduction measures- Acoustic ceiling tile- Sound-proofing walls
Unit layout(e.g. separate pods)
Comfort- Cleanliness- Noise- Privacy
Attractiveness
Environmentalvariables
Environmentalqualities Outcomes
Patient satisfaction with physical environment
Patient satisfaction with nurse, physician, etc.
Patient overall satisfaction with healthcare service
Patient loyalty(i.e. willingnessto return orrecommend)
FIgurE 4Model of environmental variables examined in relationship to patient satisfaction

abstract V
healthcare environmental terms and outcome Measures: an evidence-based Design Glossary
21Results |
In one study, waiting time to be seen by a doctor was reduced 8 to 11 minutes and
length of ED stay was reduced 20 to 25 minutes after an RAC was implemented
(Ardagh, Wells, Cooper, Lyons, Patterson, & O’Donovan, 2002). In another
study, the RAP helped reduce time from triage to bed by 24 minutes (Bullard, Lo,
Latoszek, Holroyd, Rowe, 2008). In yet another study, patient waiting time in the
ED treatment room was influenced by ED layout. Patients in a treatment room that
was farther from the physician work station and had a solid door instead of soft
curtains tended to wait longer (Hall, Kyriacou, Handler, & Adams, 2008).
Several environmental factors impact a patient’s cognitive perception of waiting time,
patient waiting experience, and waiting behaviors. Patients who periodically received
information regarding ED process and medical procedures on devices such as TVs
perceived significantly shorter ED stays and were more satisfied (Papa et al., 2008;
Tran, Schutte, Muelleman, & Wadman, 2002).
Research has examined the possible connection between physical environment
attractiveness and a patient’s perceived waiting time but did not find any
significant direct relationship (Becker & Douglass, 2008; Pruyn & Smidts, 1998).
Environmental attractiveness was associated with more favorable perceptions of the
quality of care, a higher percentage of anxiety reduction, and higher ratings of staff
interactions (Becker & Douglass, 2008; Pruyn & Smidts, 1998). Positive distractions
such as visual-audio stimuli presented on a plasma TV, nature photographs on
canvas, window films with garden scenes, and cloud patterns attracted patients’
attention during waiting time, significantly reduced patients’ restless behavior and
“people watching”, and helped calm children (Nanda, 2010; Pati & Nanda, 2011).
Environmental variables for patient waiting are categorical variables that can be
manipulated by experimenters or measured by environment inspection. The exception
is physical environment attractiveness which is measured by subjective rating.
A correlation exists between the key outcomes of actual patient waiting time and
perceived waiting time, although patients tend to overestimate short waiting times
and underestimate long waiting times (Becker & Douglass, 2008).
A patient’s cognitive perception plays a significant role in the relationships between
patient waiting and patient satisfaction (Pruyn & Smidts, 1998). Actual patient

abstract V
healthcare environmental terms and outcome Measures: an evidence-based Design Glossary
22Results |
waiting time was measured by direct observation or using existing medical records.
Perceived waiting time was measured by subjective report – patients’ responses to
questionnaire surveys. Typically, patient waiting behaviors were directly observed to
determine the percentage or number of behaviors in different categories, including
continuous behaviors (e.g., reading) and discrete behaviors (e.g., getting out of seat) as
well as distraction activities, non-distraction activities, and restless/anxious behaviors.
F. Staff Efficiency
Research has identified staff efficiency outcomes that can be influenced by physical
environment (Figure 6). These outcomes include staff travel time and distance,
team communication, circadian misalignment, nurse response time to patient calls,
medication processing time, and surgeon/anesthesiologist performance
(e.g., percentage of correct judgments, accuracy of cystic and artery clipping).
A time-motion study based on the space syntax theory indicated that linear
integration, a measure of the centrality of the assigned room with regard to the
entire nursing unit layout, has a positive impact on the number of nurse entries to
patient rooms and the nursing station (Hendrich, Chow, Bafna, Choudhary, Heo, &
Skierczynski, 2009).
Several studies found that nurses working in radial units walked less and spent more
time with patients than nurses working in rectangular units (e.g., Shepley & Davies,
Triage area/Rapidassessment clinic
Information access
Amenities
ED layout (distance from room to work station, solid doors
Physical environment attractiveness/Positive distractions
ED environment
Environmentalvariables
Environmentalqualities Outcomes
Environmental stimulation
Actual waiting time
Perceived waiting time
Patient experience, behaviors, satisfaction
Comfort
FIgurE 5Model of environmental
variables examined in relationship to patient waiting

abstract V
healthcare environmental terms and outcome Measures: an evidence-based Design Glossary
23Results |
2003; Trites, Galbraith, Sturdavant, & Leckwart, 1970). Dividing a large, 38-bed
unit into four pods, each served by two RNs, significantly reduced nurse walking
steps and significantly increased the amount of time nurses spent in direct patient
care (Donahue, 2009). One study found that nurses in units with decentralized
nursing stations spent more time on all types of communication activities except
communication with other nurses for patient information and spent more time
on patient care activities in patient rooms (Gurascio-Howard & Malloch, 2007).
Another study found that nurses in decentralized units had fewer verbal interactions
with other nurses (Dutta, 2008).
Patient room layout is an important factor impacting staff efficiency. An open
configuration providing an immediate global view of conditions in the caregiver
zone and the location of equipment was perceived as best supporting nursing tasks
(Pati, Cason, Harvey, & Evans, 2010). Nurses in a NICU spent less time traveling
after moving from an old unit with six rooms (each room contained 1 to 5 beds) to a
new unit with an open floor plan (Shepley, 2002).
Multiple studies examined the benefits of wireless communication systems.
Having a wireless device equipped with audio and visual display significantly
reduced nurse response time to patient calls and increased nurse-initiated and
team-initiated communications (Guarascio-Howard, 2011). Compared with
indirect page communication, direct cellular communication was associated
with better response rate and lower error rate in communication (Ortega,
Taksali, Smart, & Baumgaertner, 2009). ICU staff reported in a questionnaire
survey that wireless email communication helped: improve speed and reliability
of communication, improve coordination of team members, reduce staff
frustration, and provide faster, safer patient care (O’Connor, Friedrich, Scales,
& Adhikari, 2009).
The impact of other environmental variables on staff efficiency has also
been studied. A drug counter and pharmacy fixture specially designed to
fit the ergonomic needs of pharmacists helped reduce prescription filling
time and reduce pharmacist travel distance (Lin, Barker, Hassall, & Gallelli,
1988). Decentralized satellite pharmacies close to nursing units and on-line
computerized physician order-entry systems might reduce technician and nurse
work time as well as reduce pharmacy order-processing time (Poley, Bouwmans,

abstract V
healthcare environmental terms and outcome Measures: an evidence-based Design Glossary
24Results |
Hanff, Roos, & van Ineveld, 2004; Wietholter, Sitterson, & Allison, 2009).
Noise increased errors and path length per movement when surgeons performed
laparoscopy tasks (Moorthy, Munz, Dosis, Bann, & Darzi, 2003). Several
studies identified the benefits of music for anesthesia monitoring and surgical
tasks (e.g., Sanderson, Tosh, Philp, Rudie, Watson, & Russell, 2005). Bright
light during the night shift helped reduce circadian misalignment in nightshift
workers, helping reduce sleep disorders, fatigue, gastrointestinal disturbances,
impaired performance, and declined safety (Crowley, Lee, Tseng, Fogg, &
Eastman, 2003).
Environmental variables for staff efficiency are categorical variables that can be
manipulated by experimenters or designers. The exception is linear integration,
a metric calculated using architectural drawings and space syntax software.
Staff efficiency outcomes were measured using a variety of methods. Staff travel
was measured by direct observation (e.g., videotaping, link analysis), work
sampling studies (nurses using PDAs to record their locations and activities),
pedometers worn by nurses, and indoor position systems that tracked radio-
frequency identification (RFID) badges worn by staff.
Methods to measure team communication included observation, audio
recording, interview, and questionnaire. Saliva sampling and radioimmunoassay
analysis was used to determine circadian misalignment. Nurse response time to
patient calls was measured by observation and questionnaire survey. Computer
simulation, questionnaire, and data from medical records or architectural
drawings were the main methods for measuring medication processing time and
surgeon/anesthesiologist performance.

abstract V
healthcare environmental terms and outcome Measures: an evidence-based Design Glossary
25Results |
g. Staff Satisfaction
Multiple environmental variables have been found to impact healthcare staff ’s job
satisfaction (Figure 7). Nurses’ self-reported daily exposure to daylight correlated
positively with job satisfaction (Alimoglu & Donmez, 2005). Staff working in
single-patient rooms reported higher satisfaction with the physical environment,
Nursing unit shape/layout(Pod design; circular, rectangular; centrality)
Nursing station layout(Decentralized versuscentralized)
Patient room layout(Direction of approach location of equipment)
Patient room occupancy:Single, double, open
Noise (experiment condition)
Music
Headmounted display
Workroom layout
Wireless technology
Lighting design
Pharmacy equipment
Medication distribution system (Centralized versus satellite pharmacy)
Nursing unit environment- Physical proximity
Nursing unit environment- Ease of communication
Nursing unit environment- Illumination level
Pharmacy environment
Visual/audio environmentof OR
Environmentalvariables
Environmentalqualities Outcomes
Staff travel(time allocation,travel distance)
Nurse response time to patient calls
Circadian misalignment(Staff fatigue)
Medication processing time (preparation/dispensing)
Surgeon/anesthesiologist performance
Clinical outcomes
Patient satisfaction
Staffing efficiency(# of FTE)
Team communication
FIgurE 6Model of environmental variables examined in relationship to staff efficiency

abstract V
healthcare environmental terms and outcome Measures: an evidence-based Design Glossary
26Results |
higher job satisfaction, and lower work stress than staff working in open bays
(Harris, Shepley, & White, 2006; Shepley, Harris, & White, 2008). Nurses working
in acuity-adaptable, single maternity care rooms that enabled patients to stay in one
room throughout the intra- and post-partum periods and accommodated staff and
family were more satisfied than nurses working in traditional maternity units with
separate rooms for labor/delivery and postpartum care (Janssen, Harris, Soolsma,
Klein, & Seymour, 2001).
Noise is a major source of stress and annoyance and has a negative impact on staff
(Morrison, Haas, Shaffner, Garrett, & Fackler, 2003). Applebaum and colleagues
(2010) reported that noise was positively correlated with stress, stress negatively related
to job satisfaction, and job satisfaction negatively correlated with turnover intent.
Many before-after studies compared staff satisfaction in new versus old healthcare
environments. These studies typically focused on bundled environmental
modifications. Berry and Parish (2008) reported that nursing staff working in
a new unit featuring 100 percent single rooms, larger space, more natural light,
more handwashing stations, and more staff break rooms were more satisfied and
less stressed. Rice, Ingram, and Mizan (2008) reported that administrative and
professional staff ’s job satisfaction significantly increased after a primary care facility
moved from a converted Victorian house that was cramped, noisy, and provided
minimal privacy, comfort, and decoration to a spacious, new, purpose-built facility
that provided more light, greater comfort, and novel artwork.
Several studies examined the relationship between staff ’s perception of physical
environment and job satisfaction. Cannon and others (2008) found significant
relationships between some staff-perceived environment qualities, such as facility
cleanliness and availability of phones, with overall job satisfaction. A survey study
by Djukic and colleagues (2010) revealed a group of nurses who negatively perceived
their physical work environment, and that the nurses’ perception of the work
environment positively related to their job satisfaction.
Several environmental factors such as patient room occupancy, acuity-adaptable
room, and bundled environmental changes are categorical variables manipulated
by designers or researchers. Noise was measured directly by sound level meters or
indirectly by staff perception of noise level. Daylight exposure was self-reported by

abstract V
healthcare environmental terms and outcome Measures: an evidence-based Design Glossary
27Results |
staff members and categorized as less than 3 hours exposure per day or 3 hours or
more exposure per day.
Outcome variables include staff stress, job satisfaction, burnout, intent to turnover,
and perception of the physical environment. The vast majority of outcomes
were measured using questionnaire scales, some of which are well-developed
and validated: Job Satisfaction Scale, Nurses’ Intent to Stay Questionnaire,
Rehabilitation Job Satisfaction Inventory, PedQL Staff Satisfaction Coworker
Module, Maslach Burnout Inventory, and Work Related Starin Inventory. Staff stress
was measured using questionnaire scales as well as physiological methods such as
electrocardiography (ECG) monitoring and salivary hormone analysis.
Daylight
Noise
Maintenance/cleanliness
Aesthetics
Patient room occupancy types: Single, double, open
Acuity-adaptable room(single room maternity care)
Dedicated/purpose-built facility
Comfort- Cleanliness- Noise- Privacy
Attractiveness
Environmentalvariables
Environmentalqualities Outcomes
Perceptions or satisfaction with the physical environment
Staff stressBurnout
Staff job satisfaction
Staff turnover intention
FIgurE 7Model of environmental
variables examined in relationship to staff
satisfaction

abstract V
healthcare environmental terms and outcome Measures: an evidence-based Design Glossary
28 healthcare environmental Variables |
IV. Healthcare Environmental Variables
healthcare environmental terms and outcome Measures: an evidence-based Design Glossary
All healthcare environmental variables found during the exploration of the seven
high-priority topics discussed in this report are listed in alphabetical order in Table
3. Each identified variable is accompanied by a definition and a summary of the
metrics and measurement tools used to study the variable’s impact on different
healthcare outcomes. A detailed summary of the cited research can be found in the
topical summary sections (noted in parentheses following the term name in Table 3)
in the Results chapter and in the article analysis table in the Appendix at
http://www.healthdesign.org/chd/research/healthcare-environmental-terms-and-
outcome-measures-evidence-based-design-glossary
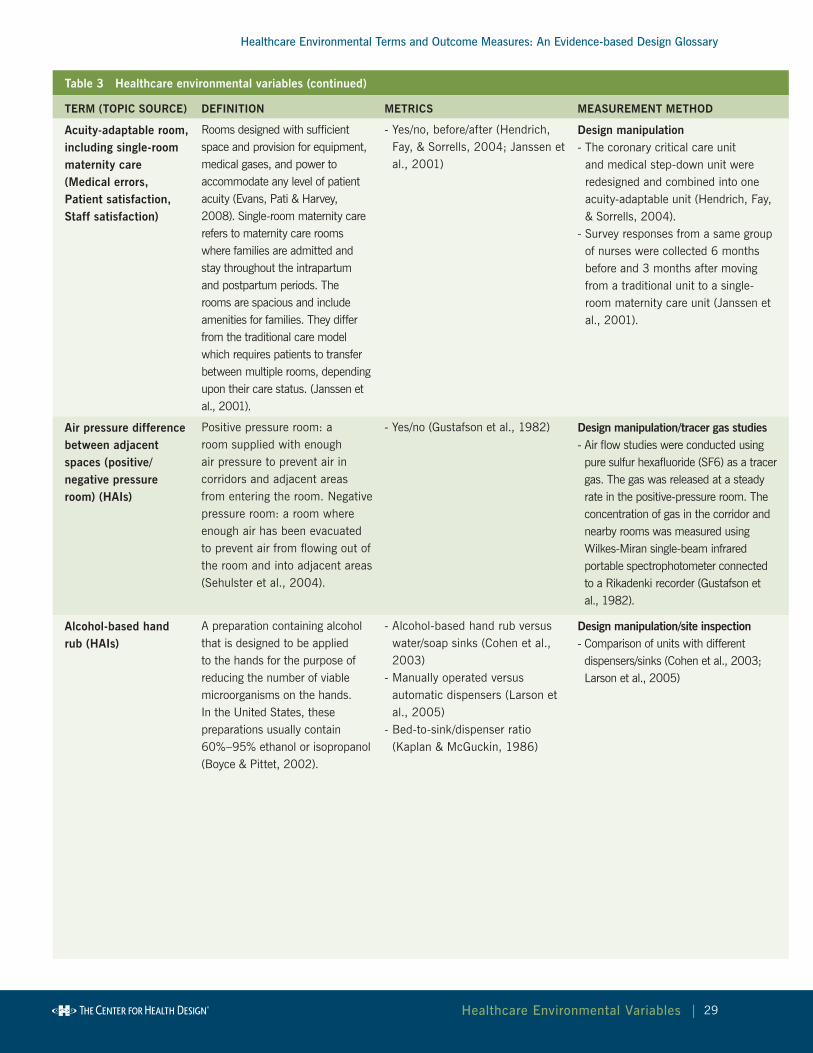
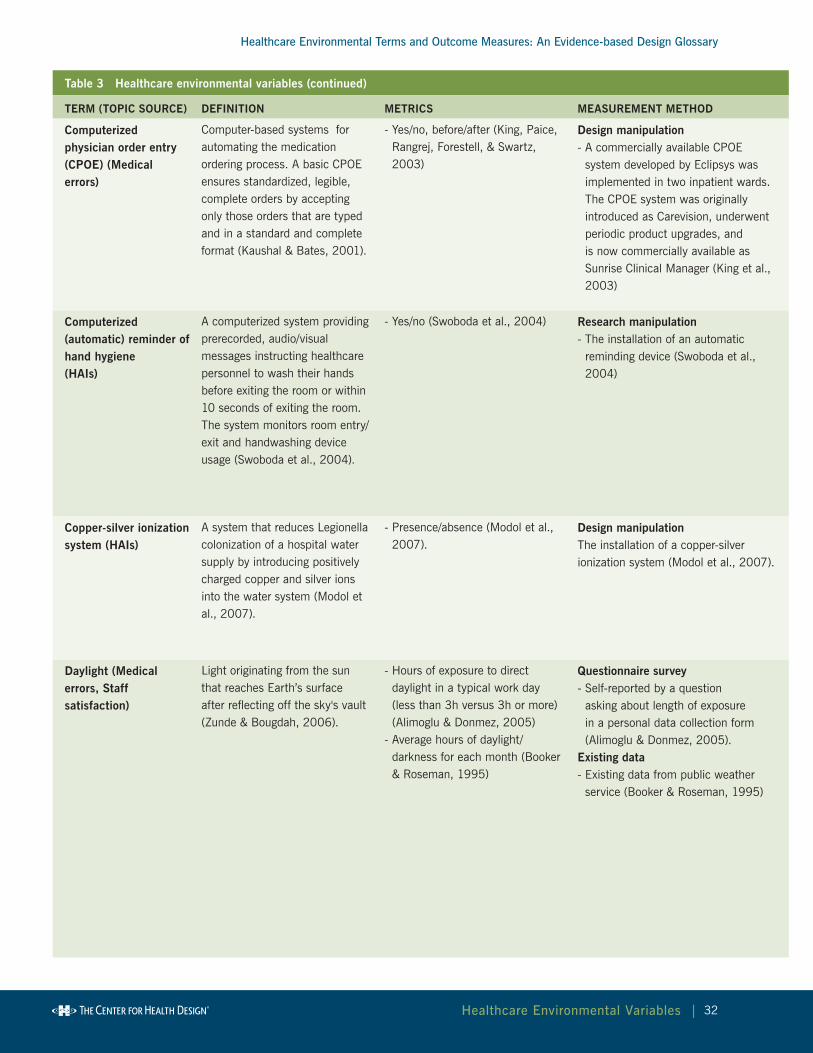
Table 3 Healthcare environmental variables
TErM (TOPIC SOurCE) DEFInITIOn METrICS MEASurEMEnT METHOD
Acoustic ceiling tile (Patient satisfaction)
Ceiling tiles that absorb sound reflected off hard surfaces and can be used in a grid or direct-glued to a solid ceiling deck. Typically porous, these products accept and trap sound/vibration and allow it to dissipate before leaving the products (ASI Pro Audio Acoustics, 2010).
- Yes/no, before/after- Noise Reduction Coefficient
(NRC) - A measure for rating the overall sound-absorption performance of a material when used in an enclosed architectural space such as an office where sound is being reflected at many angles of incidence. Specifically, it is the 4 frequency averaged absorption coefficients @ 250, 500, 1000 and 2000 Hz, rounded to the nearest 0.05. A material with NRC < 0.50 is a poor absorber, and NRC > .80 is a very good absorber (Armstrong, 2010).
Design manipulation- First, sound-reflecting ceiling tiles
(13 mm solid painted plaster board tiles) were installed. Four weeks later, the ceiling tiles were replaced with sound-absorbing ceiling tiles (40 mm Ecophon high density resin bonded glass wool with a painted surface) of nearly identical appearance (Hagerman et al., 2005).
abstract V
healthcare environmental terms and outcome Measures: an evidence-based Design Glossary
29 healthcare environmental Variables |
Table 3 Healthcare environmental variables (continued)
TErM (TOPIC SOurCE) DEFInITIOn METrICS MEASurEMEnT METHOD
Acuity-adaptable room, including single-room maternity care(Medical errors, Patient satisfaction, Staff satisfaction)
Rooms designed with sufficient space and provision for equipment, medical gases, and power to accommodate any level of patient acuity (Evans, Pati & Harvey, 2008). Single-room maternity care refers to maternity care rooms where families are admitted and stay throughout the intrapartum and postpartum periods. The rooms are spacious and include amenities for families. They differ from the traditional care model which requires patients to transfer between multiple rooms, depending upon their care status. (Janssen et al., 2001).
- Yes/no, before/after (Hendrich, Fay, & Sorrells, 2004; Janssen et al., 2001)
Design manipulation- The coronary critical care unit
and medical step-down unit were redesigned and combined into one acuity-adaptable unit (Hendrich, Fay, & Sorrells, 2004).
- Survey responses from a same group of nurses were collected 6 months before and 3 months after moving from a traditional unit to a single-room maternity care unit (Janssen et al., 2001).
Air pressure difference between adjacent spaces (positive/negative pressure room) (HAIs)
Positive pressure room: a room supplied with enough air pressure to prevent air in corridors and adjacent areas from entering the room. Negative pressure room: a room where enough air has been evacuated to prevent air from flowing out of the room and into adjacent areas (Sehulster et al., 2004).
- Yes/no (Gustafson et al., 1982) Design manipulation/tracer gas studies - Air flow studies were conducted using pure sulfur hexafluoride (SF6) as a tracer gas. The gas was released at a steady rate in the positive-pressure room. The concentration of gas in the corridor and nearby rooms was measured using Wilkes-Miran single-beam infrared portable spectrophotometer connected to a Rikadenki recorder (Gustafson et al., 1982).
Alcohol-based hand rub (HAIs)
A preparation containing alcohol that is designed to be applied to the hands for the purpose of reducing the number of viable microorganisms on the hands. In the United States, these preparations usually contain 60%–95% ethanol or isopropanol (Boyce & Pittet, 2002).
- Alcohol-based hand rub versus water/soap sinks (Cohen et al., 2003)
- Manually operated versus automatic dispensers (Larson et al., 2005)
- Bed-to-sink/dispenser ratio (Kaplan & McGuckin, 1986)
Design manipulation/site inspection- Comparison of units with different dispensers/sinks (Cohen et al., 2003; Larson et al., 2005)
abstract V
healthcare environmental terms and outcome Measures: an evidence-based Design Glossary
30 healthcare environmental Variables |
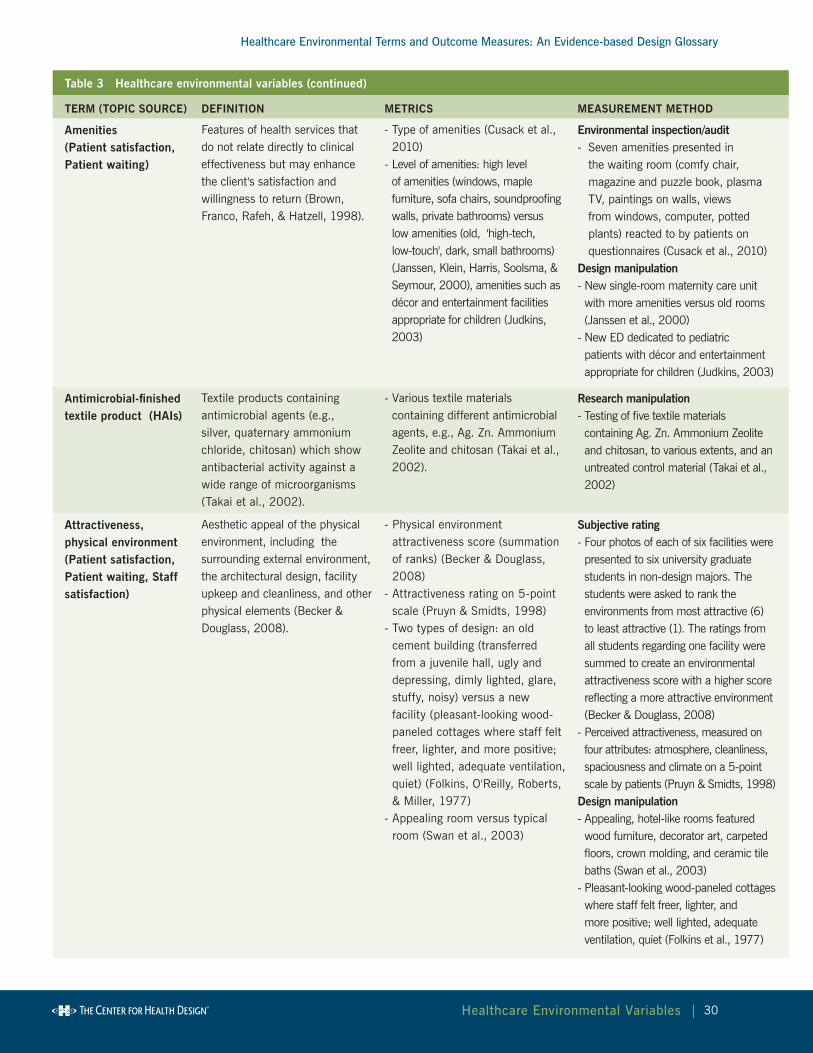
Table 3 Healthcare environmental variables (continued)
TErM (TOPIC SOurCE) DEFInITIOn METrICS MEASurEMEnT METHOD
Amenities (Patient satisfaction, Patient waiting)
Features of health services that do not relate directly to clinical effectiveness but may enhance the client's satisfaction and willingness to return (Brown, Franco, Rafeh, & Hatzell, 1998).
- Type of amenities (Cusack et al., 2010)
- Level of amenities: high level of amenities (windows, maple furniture, sofa chairs, soundproofing walls, private bathrooms) versus low amenities (old, 'high-tech, low-touch', dark, small bathrooms) (Janssen, Klein, Harris, Soolsma, & Seymour, 2000), amenities such as décor and entertainment facilities appropriate for children (Judkins, 2003)
Environmental inspection/audit- Seven amenities presented in
the waiting room (comfy chair, magazine and puzzle book, plasma TV, paintings on walls, views from windows, computer, potted plants) reacted to by patients on questionnaires (Cusack et al., 2010)
Design manipulation- New single-room maternity care unit with more amenities versus old rooms (Janssen et al., 2000)
- New ED dedicated to pediatric patients with décor and entertainment appropriate for children (Judkins, 2003)
Antimicrobial-finished textile product (HAIs)
Textile products containing antimicrobial agents (e.g., silver, quaternary ammonium chloride, chitosan) which show antibacterial activity against a wide range of microorganisms (Takai et al., 2002).
- Various textile materials containing different antimicrobial agents, e.g., Ag. Zn. Ammonium Zeolite and chitosan (Takai et al., 2002).
research manipulation - Testing of five textile materials containing Ag. Zn. Ammonium Zeolite and chitosan, to various extents, and an untreated control material (Takai et al., 2002)
Attractiveness, physical environment(Patient satisfaction, Patient waiting, Staff satisfaction)
Aesthetic appeal of the physical environment, including the surrounding external environment, the architectural design, facility upkeep and cleanliness, and other physical elements (Becker & Douglass, 2008).
- Physical environment attractiveness score (summation of ranks) (Becker & Douglass, 2008)
- Attractiveness rating on 5-point scale (Pruyn & Smidts, 1998)
- Two types of design: an old cement building (transferred from a juvenile hall, ugly and depressing, dimly lighted, glare, stuffy, noisy) versus a new facility (pleasant-looking wood-paneled cottages where staff felt freer, lighter, and more positive; well lighted, adequate ventilation, quiet) (Folkins, O'Reilly, Roberts, & Miller, 1977)
- Appealing room versus typical room (Swan et al., 2003)
Subjective rating- Four photos of each of six facilities were presented to six university graduate students in non-design majors. The students were asked to rank the environments from most attractive (6) to least attractive (1). The ratings from all students regarding one facility were summed to create an environmental attractiveness score with a higher score reflecting a more attractive environment (Becker & Douglass, 2008)
- Perceived attractiveness, measured on four attributes: atmosphere, cleanliness, spaciousness and climate on a 5-point scale by patients (Pruyn & Smidts, 1998)
Design manipulation- Appealing, hotel-like rooms featured wood furniture, decorator art, carpeted floors, crown molding, and ceramic tile baths (Swan et al., 2003)
- Pleasant-looking wood-paneled cottages where staff felt freer, lighter, and more positive; well lighted, adequate ventilation, quiet (Folkins et al., 1977)
abstract V
healthcare environmental terms and outcome Measures: an evidence-based Design Glossary
31 healthcare environmental Variables |
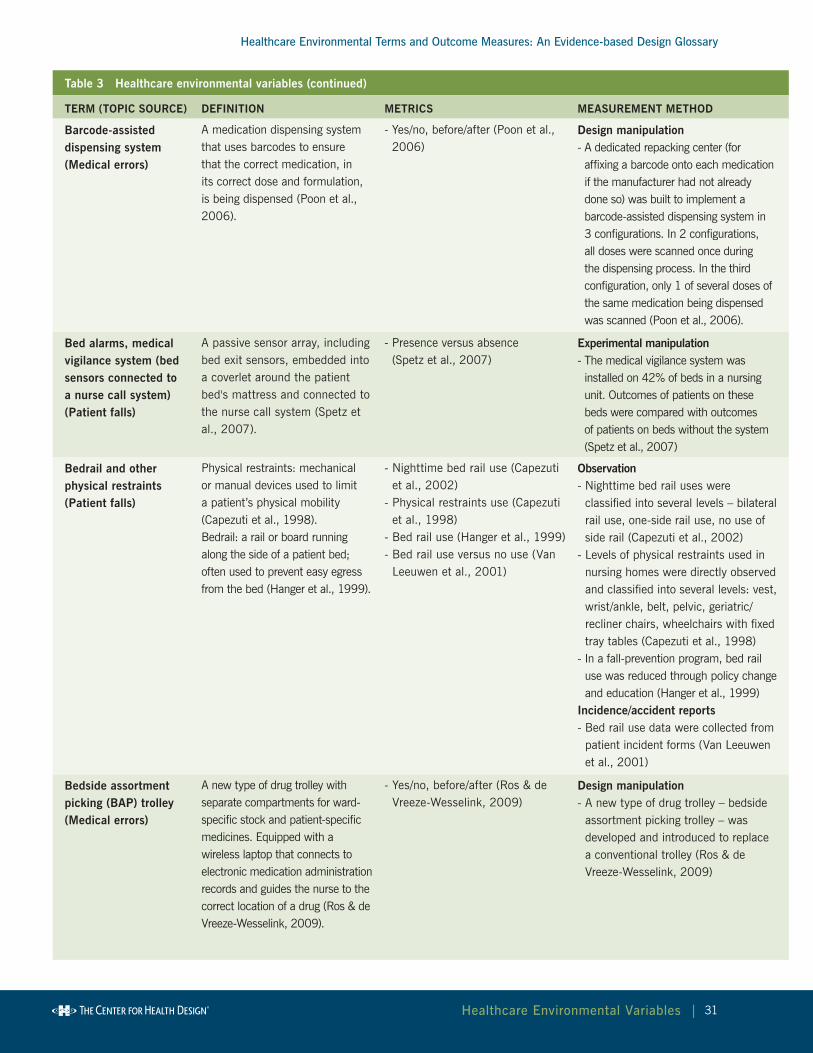
Table 3 Healthcare environmental variables (continued)
TErM (TOPIC SOurCE) DEFInITIOn METrICS MEASurEMEnT METHOD
Barcode-assisted dispensing system (Medical errors)
A medication dispensing system that uses barcodes to ensure that the correct medication, in its correct dose and formulation, is being dispensed (Poon et al., 2006).
- Yes/no, before/after (Poon et al., 2006)
Design manipulation- A dedicated repacking center (for affixing a barcode onto each medication if the manufacturer had not already done so) was built to implement a barcode-assisted dispensing system in 3 configurations. In 2 configurations, all doses were scanned once during the dispensing process. In the third configuration, only 1 of several doses of the same medication being dispensed was scanned (Poon et al., 2006).
Bed alarms, medical vigilance system (bed sensors connected to a nurse call system) (Patient falls)
A passive sensor array, including bed exit sensors, embedded into a coverlet around the patient bed's mattress and connected to the nurse call system (Spetz et al., 2007).
- Presence versus absence (Spetz et al., 2007)
Experimental manipulation- The medical vigilance system was installed on 42% of beds in a nursing unit. Outcomes of patients on these beds were compared with outcomes of patients on beds without the system (Spetz et al., 2007)
Bedrail and other physical restraints (Patient falls)
Physical restraints: mechanical or manual devices used to limit a patient’s physical mobility (Capezuti et al., 1998). Bedrail: a rail or board running along the side of a patient bed; often used to prevent easy egress from the bed (Hanger et al., 1999).
- Nighttime bed rail use (Capezuti et al., 2002)
- Physical restraints use (Capezuti et al., 1998)
- Bed rail use (Hanger et al., 1999)- Bed rail use versus no use (Van
Leeuwen et al., 2001)
Observation- Nighttime bed rail uses were
classified into several levels – bilateral rail use, one-side rail use, no use of side rail (Capezuti et al., 2002)
- Levels of physical restraints used in nursing homes were directly observed and classified into several levels: vest, wrist/ankle, belt, pelvic, geriatric/recliner chairs, wheelchairs with fixed tray tables (Capezuti et al., 1998)
- In a fall-prevention program, bed rail use was reduced through policy change and education (Hanger et al., 1999)
Incidence/accident reports- Bed rail use data were collected from
patient incident forms (Van Leeuwen et al., 2001)
Bedside assortment picking (BAP) trolley (Medical errors)
A new type of drug trolley with separate compartments for ward-specific stock and patient-specific medicines. Equipped with a wireless laptop that connects to electronic medication administration records and guides the nurse to the correct location of a drug (Ros & de Vreeze-Wesselink, 2009).
- Yes/no, before/after (Ros & de Vreeze-Wesselink, 2009)
Design manipulation- A new type of drug trolley – bedside
assortment picking trolley – was developed and introduced to replace a conventional trolley (Ros & de Vreeze-Wesselink, 2009)
abstract V
healthcare environmental terms and outcome Measures: an evidence-based Design Glossary
32 healthcare environmental Variables |
Table 3 Healthcare environmental variables (continued)
TErM (TOPIC SOurCE) DEFInITIOn METrICS MEASurEMEnT METHOD
Computerized physician order entry (CPOE) (Medical errors)
Computer-based systems for automating the medication ordering process. A basic CPOE ensures standardized, legible, complete orders by accepting only those orders that are typed and in a standard and complete format (Kaushal & Bates, 2001).
- Yes/no, before/after (King, Paice, Rangrej, Forestell, & Swartz, 2003)
Design manipulation- A commercially available CPOE
system developed by Eclipsys was implemented in two inpatient wards. The CPOE system was originally introduced as Carevision, underwent periodic product upgrades, and is now commercially available as Sunrise Clinical Manager (King et al., 2003)
Computerized (automatic) reminder of hand hygiene (HAIs)
A computerized system providing prerecorded, audio/visual messages instructing healthcare personnel to wash their hands before exiting the room or within 10 seconds of exiting the room. The system monitors room entry/exit and handwashing device usage (Swoboda et al., 2004).
- Yes/no (Swoboda et al., 2004) research manipulation- The installation of an automatic
reminding device (Swoboda et al., 2004)
Copper-silver ionization system (HAIs)
A system that reduces Legionella colonization of a hospital water supply by introducing positively charged copper and silver ions into the water system (Modol et al., 2007).
- Presence/absence (Modol et al., 2007).
Design manipulationThe installation of a copper-silver ionization system (Modol et al., 2007).
Daylight (Medical errors, Staff satisfaction)
Light originating from the sun that reaches Earth’s surface after reflecting off the sky's vault (Zunde & Bougdah, 2006).
- Hours of exposure to direct daylight in a typical work day (less than 3h versus 3h or more) (Alimoglu & Donmez, 2005)
- Average hours of daylight/darkness for each month (Booker & Roseman, 1995)
Questionnaire survey- Self-reported by a question
asking about length of exposure in a personal data collection form (Alimoglu & Donmez, 2005).
Existing data - Existing data from public weather
service (Booker & Roseman, 1995)

abstract V
healthcare environmental terms and outcome Measures: an evidence-based Design Glossary
33 healthcare environmental Variables |
Table 3 Healthcare environmental variables (continued)
TErM (TOPIC SOurCE) DEFInITIOn METrICS MEASurEMEnT METHOD
Distraction (Medical errors)
An external stimulus causing observable responses from healthcare workers without disrupting the ongoing, productive activity. Distractions (Flynn et al., 1999).
- Distraction condition versus non-distraction condition (Pluyter et al., 2010)
- Number of distractions per pharmacist per half hour (Flynn et al., 1999)
Experimental manipulation - I n one experimental condition,
subjects listened to popular songs combined with social conversation irrelevant to the surgical task and non-optimal laparoscope navigation (Pluyter et al., 2010).
Video recording of actual work- Two video cameras recorded
prescription-filling operations from two different angles throughout each eight-hour study day. The videotapes were reviewed simultaneously to record time of interruption or distraction, prescription-filling task affected, type of interruption or distraction, reason for the interruption or distraction, and study participant affected (Flynn et al., 1999)
Emergency Department, layout (Patient waiting)
Spatial configuration of the ED, including treatment rooms, work stations, and other components (Hall et al., 2008).
- Distance from treatment room to work station
- Solid door versus soft curtain (Hall et al., 2008)
Environmental inspection/audit- Nine experimental conditions defined
by three directions of approach to the patient and three conditions of IV pole location (Hall et al., 2008)
Falls - Multifaceted environmental intervention (Patient falls)
Simultaneous modification of multiple aspects of the physical environment for the purpose of reducing patient falls and injuries (Becker et al., 2003; Brandis, 1999).
- Before versus after the implementation of a fall-prevention program including environmental modifications (Becker et al., 2003; Brandis, 1999)
Design manipulation- Environmental modification based on environmental hazard check and discussion with staff and administrators (lighting, chair and bed height, floor surfaces, room clutter, grab bars, walking aids) together with staff training, resident education, exercise and hip protectors) (Becker et al., 2003)
Hand hygiene devices, number of (HAIs)
The number of staff-accessible handwashing sinks (Kaplan et al., 1986).
- Bed-to-sink/dispenser ratio (Kaplan et al., 1986)
Design manipulation/site inspection- Dividing the total number of beds in one unit by the number of sinks/dispensers in that unit (Kaplan et al., 1986)
Head-mounted display (Staff efficiency)
A scanning retinal display that uses a laser to project a monochromatic red image onto a transparent monocle which then reflects the image on the wearer’s retina. The device keeps patients’ vital signs within view of the anesthesiologist at all times, precluding the need to look at a patient monitor (Liu et al., 2009).
Monitoring display type- Head-mounted display versus
standard monitoring equipment (a video graphics array screen mounted within the anesthesia machine) (Liu et al., 2009)
Experimental manipulation- Subjects were asked to perform
simulated monitoring tasks when the HMD was used versus not used (Liu et al., 2009).

abstract V
healthcare environmental terms and outcome Measures: an evidence-based Design Glossary
34 healthcare environmental Variables |
Table 3 Healthcare environmental variables (continued)
TErM (TOPIC SOurCE) DEFInITIOn METrICS MEASurEMEnT METHOD
High-efficiency particulate air (HEPA) filter (HAIs)
A high-efficiency air filter that removes at least 99.97% of airborne particles measuring 0.3 micrometers (µm) in diameter (Sehulster et al., 2004). Can be portable or installed in an HVAC system.
- Yes/no (Barnes & Rogers, 1989; Hahn et al., 2002)
Design manipulation- Before/after installation of HEPA filter
(Barnes & Rogers, 1989)Site inspection- One unit wing with HEPA filters
(including some rooms with laminar air flow) versus a wing without HEPA filters (Hahn et al., 2002)
HEPA filters, location of (HAIs)
The locations of HEPA filters in an HVAC system (Crimi, et al, 2006).
- Central (inside main air ducts) versus peripheral (at the openings of ducts) (Crimi, et al, 2006)
Site inspection- Hospital departments with central
HEPA filters and departments with peripheral HEPA filters were identified and compared (Crimi et al., 2006)
Illumination level (illuminance) (Medical errors, Staff efficiency)
The intensity of luminous flux (Stein, 1997).
- Lux (1 lux=1 lumen/m2)- Footcandle (1 ftc = 10.764 lux) - Bright light versus normal room
lighting (Crowley et al., 2003)
Photometer- Photometer (model IL1350,
serial 2048, International Light Inc., Newburyport, MA) with an illuminance sensor (model SCD110, serial 1366, International light). Eight measurements were taken, starting 6 inches from the end of the conveyor belt and every 12 inches thereafter. The amount of illumination represents the mean of the eight measurements taken daily for seven days (Buchanan et al., 1991).
Design manipulation- Bright light (BL) exposure during night
shifts compared with normal room lighting. Bright light (~5000 lux) was produced by 3 light boxes (61.0 cm wide, 77.5 cm high, 12.1 cm deep, cool white fluorescent lamps, Apollo Light Systems Inc., Orem, UT) set on the perimeter of a large, round table facing the center of the table. Normal room light is about 150 lux (Crowley et al., 2003).

abstract V
healthcare environmental terms and outcome Measures: an evidence-based Design Glossary
35 healthcare environmental Variables |
Table 3 Healthcare environmental variables (continued)
TErM (TOPIC SOurCE) DEFInITIOn METrICS MEASurEMEnT METHOD
Information access (Patient waiting)
Patient access to information regarding ED process (time to see a doctor/consultant, blood draw) and medical and therapeutic plans (Tran et al., 2002).
- Yes versus no (Tran et al., 2002)- Before versus after (Papa et al.,
2008)
Experimental manipulation- In the intervention group, ED process
information and medical information were provided to each patient every 15 minutes. The control group received regular care (Tran et al., 2002)
- An instructional waiting room video explaining what patients should expect during ED visits played continuously on a TV set in the waiting room (Papa et al., 2008)
Interior finish material (HAIs, Patient falls)
Material covering interior surfaces such as ceiling, floors, and walls (Calkins et al., 2011; Noskin et al., 2000).
- Flooring type: carpet versus vinyl (Donald et al., 2000; Healey, 1994); with carpet versus without carpet (Simpson et al., 2004); linoleum, VCT, ceramic tile (Calkins et al., 2011); carpet, vinyl, fabric, wood, rubber, etc. (Noskin et al., 2000)
- Flooring pattern: pattern size (no, small [less than 1”], medium [1’-6”], large pattern [>6”]) (Calkins et al., 2011)
research manipulation- Testing of different materials (Noskin
et al., 2000)- Installation of a new carpet flooring
(Donald et al., 2000)- Incidence/accident reporting- Data about flooring types were
gathered from the accident forms completed by nurses (Healey, 1994)
Environmental inspection/audit- Existing flooring materials were
examined through environmental inspection (Simpson et al., 2004)
Interruption (Medical errors)
Cessation of productive activity before completing a prescription-filling task, due to any externally imposed, observable, or audible reason. Interruptions can be caused by staff looking at people passing through the ambulatory care pharmacy and related to prescription-processing questions (Flynn et al., 1999).Situation in which a nurse ceased a medication preparation or administration task in order to attend to an external stimulus (Westbrook et al., 2010).
- Number of interruptions per pharmacist per half hour (Flynn et al., 1999)
- Number of interruptions during one medication administration (Westbrook et al., 2010)
Video recording- See “distraction”Observation- Observers (registered nurses and
physicians) used a structured observational tool on a PDA to record number of interruptions that a nurse experienced (Westbrook et al., 2010)
Laminar air flow (LAF) (HAIs)
HEPA-filtered air blown into a room at a rate of 90 ± 10 feet/min in a unidirectional pattern with 100 ACH–400 ACH (Sehulster et al., 2004).
- Yes/no (Barnes & Rogers, 1989) Design manipulation - Before/after the installation of LAF
(Barnes & Rogers, 1989)

abstract V
healthcare environmental terms and outcome Measures: an evidence-based Design Glossary
36 healthcare environmental Variables |
Table 3 Healthcare environmental variables (continued)
TErM (TOPIC SOurCE) DEFInITIOn METrICS MEASurEMEnT METHOD
Light fixture(luminaire) (Medical errors)
A complete lighting unit consisting of a light source (one or more lamps), and the parts designed to position the light source and connect it to the power supply. Parts for protecting the light source or ballast and for distributing the light may be included. (National Fire Protection Association, 2010)
- Different lighting conditions determined by supplemental lighting fixtures and color filters (Buchanan et al., 1991
Design manipulation- The installation of supplemental light
fixtures and the removal of color filters (Buchanan et al., 1991)
Medication distribution system (Staff efficiency)
A system for preparing and distributing medications for the treatment of patients in healthcare settings (Poley et al., 2004).
Medication distribution system type:- A decentralized, patient-
orientated, ready-to-use drug distribution system with satellite pharmacies close to the patient units versus a ward stock system in which routinely used drugs are issued by the hospital’s central pharmacy, which is located in a neighboring building, and stored in cupboards on the wards (Poley et al., 2004)
Design manipulation- Patient units that used different
medication distribution systems were compared (Poley et al., 2004)
Mobile air-treatment unit that uses nonthermal-plasma reactors (HAIs)
A portable device utilizing nonthermal-plasma reactors to destroy microorganisms and electrostatically capture particles and molecular residues for the purpose of reducing airborne bioburden in high-risk areas (Bergeron et al., 2007).
- On versus off; presence/absence (Bergeron et al., 2007)
research manipulation/Site inspection- In an operating room with volume of
118 m3, airborne concentration was measured when the air treatment was turned on versus off; in a hematology unit, airborne fugal level in one room with the unit was compared to the airborne fungal level in the control room (Bergeron et al., 2007)
Music (Staff efficiency) The art of arranging sounds in time so as to produce a continuous, unified, and evocative composition, as through melody, harmony, rhythm, and timbre (The Free Dictionary).
- Type of music (activating music, deactivating music, no music) (Miskovic, et al, 2008); (rock music, classic, no music) (Sanderson et al., 2005)
Experimental manipulation- Music played on a computer with a
constant volume of 35 dB (Miskovic et al., 2008)

abstract V
healthcare environmental terms and outcome Measures: an evidence-based Design Glossary
37 healthcare environmental Variables |
Table 3 Healthcare environmental variables (continued)
TErM (TOPIC SOurCE) DEFInITIOn METrICS MEASurEMEnT METHOD
noise (Medical errors, Patient falls, Patient satisfaction, Staff efficiency, Staff satisfaction)
Auditory stimulus, such as a change in loudness, bearing no informational relationship to the presence or completion of the task. Sound: a change in loudness bearing some informational relationship with the task at hand (Flynn, et al, 1996).A sound that is loud, unpleasant, unexpected, or undesired (The Free Dictionary).
- Equivalent sound level (Leq) per half hour (Flynn et al., 1996); Equivalent sound pressure level (Laeq) (weighted average sound pressure level in dBA, constant noise level that would result in the same total sound energy being produced over a given period) (Hagerman et al., 2005; Morrison, et al, 2003); minimum and maximum sound level (Morrison et al., 2003)
- Reverberation time (time needed for the sound pressure level to decrease by 60 dB) measured in central areas and two patient rooms in the unit (Hagerman et al., 2005)
- Auditory events (alarm, telephone, etc.) (Morrison et al., 2003); Number of unpredictable/controllable/ uncontrollable sounds per minute (Flynn et al., 1996)
- Perception of noise (Applebaum et al., 2010)
- Alarms and overhead paging heard frequently, infrequently, never used (Calkins et al., 2011)
- Noise versus quiet conditions (Moorthy et al., 2003)
Acoustic measurement- Sound levels were continuously recorded in decibels (A scale) by a noise-logging dosimeter (Quest Electronics Noise-Logging Dosimeter, model M28-12) located at a 70 degree angle above the main prescription-filling area; the Leq was calculated for each half hour using the methods described by Taylor & Lipscomb (1978) for analyzing decibel levels that change over time (Flynn et al., 1996)
- Sound pressure levels recorded continuously by a Quest Advanced 1900 precision integrating logging sound level meter (Morrison et al., 2003)
- Acoustic measurement by a third-party company (Hagerman et al., 2005)
Videotape recording- Two video cameras placed in inconspicuous locations recorded ambient sounds. The videotapes were synchronized with the time that each patient’s prescription set was being filled in order to determine which sounds affected performance (Flynn et al., 1996).
Questionnaire survey- Items about perceived noise in M. D. Anderson Patient Contact Survey (Applebaum et al., 2010)
Environmental inspection/audit - Environmental inspection performed by hospital staff using the Falls Environment Evaluation Tool (FEET) (Calkins et al., 2011)
Experimental manipulation- Operating theatre background noise at 80 to 85 dB (Moorthy et al., 2003)
nursing station, layout – decentralized, centralized (Patient falls, Staff efficiency)
Spatial arrangement of nurse work stations in a nursing unit (Dutta, 2008; Gurascio-Howard & Malloch, 2007; Hendrich et al., 2004).
- Types: decentralized versus centralized (Dutta, 2008; Gurascio-Howard & Malloch, 2007; Hendrich et al., 2004)
Design manipulation- Environmental changes implemented during a
nursing unit renovation (Hendrich et al., 2004)- New unit with 9 decentralized nursing stations versus old unit with 2 centralized nursing stations (Dutta, 2008)
- Centralized nurse station design (one centralized station in unit) versus decentralized nurse station design (12 alcoves near patient rooms) (Gurascio-Howard & Malloch, 2007)
- Two units in each of three hospitals: one with a centralized nursing station design and the other with a decentralized nursing station design (Zborowsky et al., 2010)

abstract V
healthcare environmental terms and outcome Measures: an evidence-based Design Glossary
38 healthcare environmental Variables |
Table 3 Healthcare environmental variables (continued)
TErM (TOPIC SOurCE) DEFInITIOn METrICS MEASurEMEnT METHOD
nursing unit shape/layout (Staff efficiency)
Spatial arrangement of patient care rooms and nursing stations in nursing units (Donahue, 2009; Shepley, & Davies, 2003; Trites et al., 1970).
- Type of unit design: pod design; circular, rectangular; racetrack (Donahue, 2009; Shepley, & Davies, 2003; Trites et al., 1970)
- Linear integration (space syntax) (Hendrich et al., 2009).
Design manipulation- Pod design (a nursing unit was
divided into four pods, each covered 100 feet, two per hallway. Each served eight rooms and was staffed by two RNs) versus a racetrack design (two, 200-foot parallel hallways, with rooms totaling 20 beds along one hallway and 18 beds along the other; patient rooms on the outer sides, a central nursing station, utility room, and patient kitchen between hallways; three pathways connect the long hallways). (Donahue, 2009)
- Dense radial configuration (circular design with patient rooms radiating around the circumference and a nurse station at the center, 10 beds, 8,100 SF, 2 nurses, carpeted, with low-volume radio) versus double-corridor rectangular/racetrack (nurse station/support space in the core, patient rooms on the perimeter wall, 24 beds, 18,500 SF, 5-10 nurses, resilient flooring) (Shepley, & Davies, 2003)
- 12 units, three types of layout, four units in each type: radial, single-corridor rectangular, double-corridor rectangular (Trites et al., 1970)Measurement using architectural drawings and computer software
- Linear integration (a measure of the centrality of a space with respect to the entire layout). The integration of a space such as a patient room is computed by mapping the layout of the space onto a unique network of straight lines representing potential movement paths through it. Each space then maps onto one or more individual lines that pass through it; distances between spaces are described as the number of intermediate lines between them (Hendrich et al., 2009).

abstract V
healthcare environmental terms and outcome Measures: an evidence-based Design Glossary
39 healthcare environmental Variables |
Table 3 Healthcare environmental variables (continued)
TErM (TOPIC SOurCE) DEFInITIOn METrICS MEASurEMEnT METHOD
Patient bathroom design (Patient falls)
Architectural and interior design of bathrooms containing bath and toilet facilities for patients (Calkins et al., 2011).
- Private versus shared or no bathroom; open versus closed door; 18” space on the opening side of bathroom door versus no space; bathroom located on footwall versus headwall; toilet on side wall versus across from entrance; two bars on both sides of toilet in bathroom, one bar, no bar (Calkins et al., 2011)
Environmental inspection/audit - Environmental inspection performed
by hospital staff using the Falls Environment Evaluation Tool (FEET) (Calkins et al., 2011)
Patient room layout (Patient falls, Staff efficiency)
Spatial arrangement of architectural elements and equipment in patient rooms (Calkins et al., 2011; Pati et al., 2010).
- Designated family space versus no designated family space (Calkins et al., 2011)
- Direction of approach to the patient (right-handed, left-handed, and neutral-handed configurations)
- The presence or absence and location of an intravenous (IV) line to the patient, using a mobile pole (IV pole on patient’s left, on patient’s right, and no-IV pole) (Pati et al., 2010)
Environmental inspection/audit - Environmental inspection performed
by hospital staff using the Falls Environment Evaluation Tool (FEET) (Calkins et al, 2011)
Experimental manipulation- Nine experimental conditions defined
by three directions of approach to the patient and three conditions of IV pole location (Pati et al., 2010)
Patient room occupancy (HAIs, Patient satisfaction, Staff efficiency, Staff satisfaction)
The number of patients per patient room—one (single room, private room), two (double room), four (multi-bed open bays) (Ben-Abraham et al., 2002; Nguyen Thi, Briancon, Empereur, & Guillemin, 2002; Shepley, Harris, & White, 2008).
- Single versus double or multiple occupancy room (Ben-Abraham et al., 2002); Single family room versus open bay (Shepley, Harris, & White, 2008); Single room versus 2 or 3 patients per room (Nguyen Thi, Briancon, Empereur, & Guillemin, 2002); Double room versus six-bed room (Soufi et al., 2010);New open NICU versus old unit with 1-5 bed patients rooms (Shepley, 2002); Proportion of beds in single rooms (Gardner et al., 1973)
Design manipulation- Conversion of an open bay unit to a
single-room unit with separated sinks (Ben-Abraham et al., 2002)
- Comparison between three types of patient spaces: single rooms from an all-single-room NICU, single rooms and open bays from another NICU (Shepley, Harris, & White, 2008)
Site inspection- The study wards were divided into
two groups based on the percentage of beds in single rooms <40% versus >85% (Gardner et al., 1973)
Existing data from medical or administrative records- Health characteristics including
admission room (double/common) were collected at admission (Soufi et al., 2010)
- Old NICU: six rooms for 1-5 beds each versus new, remodeled NICU: open unit (Shepley, 2002)

abstract V
healthcare environmental terms and outcome Measures: an evidence-based Design Glossary
40 healthcare environmental Variables |
Table 3 Healthcare environmental variables (continued)
TErM (TOPIC SOurCE) DEFInITIOn METrICS MEASurEMEnT METHOD
Pharmacy equipment (Staff efficiency)
Fixtures and equipment used in the pharmacy area for the purpose of preparing and distributing medications (Lin et al., 1988).
Pharmacy equipment type- Baker drug counter, Systamodule
pharmacy fixture, exiting equipment (Lin et al., 1988)
Experimental manipulation- Simulated experiments were conducted in four conditions: baseline—existing layout, Baker drug counter, Systamodule pharmacy fixture, both Baker drug counter and Systamodule pharmacy fixture (Lin et al., 2009)
Physical configuration of drug stock shelves (Staff efficiency)
Spatial arrangement of drug items including the amount of space between drug items on shelves (Flynn et al., 2002).
- Separation and space between items versus tightly packed items on shelves (Flynn et al., 2002)
Environmental inspection- A pharmacy's drug stock was
classified into one of two systems: stocked with space between items or tightly packed onto shelves (Flynn et al., 2002)
Physical proximity (HAIs)
A risk factor of nosocomial infection. A patient is considered to be in physical proximity when he/she is a roommate or neighbor of a patient with an infectious disease, or when he/she stays in the room after the patient with the infectious disease has left (Chang & Nelson, 2000).
- Yes/no, whether or not a patient was roommate or neighbor of a patient with diarrhea, or stayed in the room after the patient with diarrhea left (Chang & Nelson, 2000)
Mapping patient rooms- With medical records data, determine
whether or not a patient was a roommate or neighbor of a patient with diarrhea, or stayed in the room after the patient with diarrhea left (Chang & Nelson, 2000)
Positive distractions (Patient satisfaction, Patient waiting)
A set of environmental features or conditions that have been found by research to effectively reduce stress. These features or conditions include nature and certain types of music, companion animals, laughter or comedy, and certain types of art (Ulrich, 1991).
- Yes/no, before/after; Art intervention (Nanda, 2010); Visual-auditory stimuli presented on a plasma TV (Pati & Nanda, 2011)
Design and experimental manipulation- Art intervention included plasma
TV screens showing looped video of nature scene photos, still nature photographs printed on canvas, window films with garden scenes and cloud patterns (Nanda, 2010)
- Five distraction conditions as defined by types of visual and audio stimuli—slide show of nature images, virtual Ambient Art, natural aquarium, and accompanying audio (Pati & Nanda, 2011)
- 42x52 photographic quality mural of a mountain stream in a spring meadow, mounted from the ceiling at bedside so patients could view it supine, nature sounds played with a portable tape recorder (Diette et al., 2003)
- Classical music and home-made movie (mainly scenic views) provided by an Eyetrek system (Olympus, Japan) (Lee et al., 2004)

abstract V
healthcare environmental terms and outcome Measures: an evidence-based Design Glossary
41 healthcare environmental Variables |
Table 3 Healthcare environmental variables (continued)
TErM (TOPIC SOurCE) DEFInITIOn METrICS MEASurEMEnT METHOD
rapid assessment clinic/pod/zone (Patient waiting)
An ED area for quick clinician assessment and procedures on patients whose disposal is readily apparent for whom required interventions can be quickly undertaken, and for problems that do not require prolonged assessment or decision-making. Generally adapted from existing ED space, it is a novel intervention for reducing ED waiting time (Ardagh et al., 2002; Bullard et al., 2011).
- RAC versus no RAC (Ardagh et al., 2002; Bullard et al., 2008)
Experimental manipulation- RAC operated in odd weeks and did not operate in even weeks during the study period (Ardagh et al., 2002)
- ED spaces were converted to RAP (Bullard et al., 2008)
Subfloor (Patient falls) Rough floor serving as a base under a finished floor (Simpson et al., 2004)
- Type: wood versus concrete (Simpson et al., 2004)
Environmental inspection/audit- Existing subfloor materials were
examined through environmental inspection (Simpson et al., 2004)
Surface cleaning—cleaning, disinfection, sterilization (HAIs)
Cleaning: removal of visible soil and organic contamination from a device or surface, using either the physical action of scrubbing with a surfactant or detergent and water, or an energy-based process such as ultrasonic cleaners with appropriate chemical agents; thorough cleaning is an important step before high-level disinfection and sterilization (Sehulster et al., 2004).Disinfection: compared to sterilization, a less lethal process of microbial inactivation that eliminates virtually all recognized pathogenic microorganisms but may not eliminate all microbial forms (e.g., bacterial spores) (Sehulster et al., 2004).Sterilization: use of a physical or chemical procedure to destroy all microbial life, including large numbers of highly-resistant bacterial endospores (Sehulster et al., 2004).
- Type of cleaning processes and products (Carling et al., 2006)
research Manipulation- Before and after the intervention to
improve environmental cleaning—a structured, multidisciplinary educational intervention was developed for the environmental services staff of participating hospitals. The role of the staff in infection prevention and safety improvement within the hospital was explained, and expectations with respect to cleaning HTOs were defined (Carling et al., 2006).

abstract V
healthcare environmental terms and outcome Measures: an evidence-based Design Glossary
42 healthcare environmental Variables |
Table 3 Healthcare environmental variables (continued)
TErM (TOPIC SOurCE) DEFInITIOn METrICS MEASurEMEnT METHOD
ultraviolet germicidal irradiation (HAIs)
Use of ultraviolet radiation to kill or inactivate microorganisms (Sehulster et al., 2004).
- On versus off (McDevitt et al., 2008)
research manipulation- Testing of the effectiveness of upper room UVGI in a simulated real world environment in an experimental chamber (McDevitt et al., 2008)
Ventilation grilles, location of (HAIs)
Arrangement of ventilation grilles on ceilings and walls (Beggs et al., 2008).
- Ceiling versus wall ventilation; High versus low (Beggs et al., 2008)
research manipulation- Various ventilation regimes set up in
computer simulation using Fluent 6.2 CFD software (ANSYS, Canonsburg, PA) with an unstructured tetrahedral grid containing approximately 540,000 cells. A standard k-e turbulence model with enhanced wall treatment was used, and a no-slip condition was applied at the walls (Beggs et al., 2008).
Ventilation, natural (HAIs)
Movement of outdoor air into a space through intentionally provided openings such as windows, doors, or non-powered ventilators) (Sehulster et al., 2004).
- Natural versus mechanical ventilation (Escombe et al., 2007)
Site inspection- 70 naturally ventilated clinical rooms
where infectious patients are likely to be encountered were compared with 12 mechanically ventilated, negative-pressure respiratory isolation rooms built post-2000 (Escombe et al., 2007)
Ventilation rate(HAIs)
The rate at which air enters and leaves a building, space, or room (EPA, n.d.).
- Air changes per hour (ACH) - Cubic feet per minute (CFM)- Cubic meter per hour (absolute
ventilation rate) (Escombe et al., 2007)
Tracer gas concentration decay technique- With all windows and doors closed,
carbon dioxide (CO2) was released and mixed well with room air using large fans to create a spatially uniform CO2 concentration in the room. CO2 concentrations were measured throughout the room at 1-minute intervals using a centrally located infrared gas analyzer. ACH were calculated as the gradient of the straight line through the natural logarithm of CO2 concentration plotted against time in hours (Escombe et al., 2007; Menzies et al., 2000)

abstract V
healthcare environmental terms and outcome Measures: an evidence-based Design Glossary
43 healthcare environmental Variables |
Table 3 Healthcare environmental variables (continued)
TErM (TOPIC SOurCE) DEFInITIOn METrICS MEASurEMEnT METHOD
Wireless technology(Staff efficiency)
Technology enabling the transfer of information over a distance without the use of electrical conductors or wires (Guarascio-Howard, 2011; O'Connor et al., 2009).
Communication system type- The addition of a wireless
device for nurse communication with display and audio versus traditional communication infrastructure using nurse call system, telephones, health unit coordinator (HUC) stations (Guarascio-Howard, 2011)
- Wireless e-mail over a GSM cellular network using handheld devices versus baseline (receive-only numeric pagers, overhead paging, physical searches for staff, handwritten messages left in or near patient charts, and e-mail accessed by computers) (O'Connor et al., 2009)
Design manipulation- A wireless device was added to the existing communication system to help nurses receive team communications and alarms (Guarascio-Howard, 2011)
- The installation of a wireless e-mail system using a GSM cellular network and handheld devices (O'Connor et al., 2009)
Workroom layout (Staff efficiency)
Spatial arrangement of equipment in a workroom (Lu & Hignett, 2009).
- Spatial layout of soiled workroom (Lu & Hignett, 2009)
Measurement on architectural drawings- Examination of the location of
equipment in floor plans (Lu & Hignett, 2009)

abstract V
healthcare environmental terms and outcome Measures: an evidence-based Design Glossary
44healthcare outcome Measures |
V. Healthcare Outcome Measures
healthcare environmental terms and outcome Measures: an evidence-based Design Glossary
All healthcare outcome measures found during the exploration of the seven high-
priority topics discussed in this report are listed in alphabetical order in Table 4.
Each identified outcome is accompanied by a definition and a summary of the
metrics and methods used to measure that outcome. A detailed summary of the
cited research can be found in the topical summary sections (noted in parentheses
following the term name in Table 4) in the Results chapter and in the article analysis
table in the Appendix at: http://www.healthdesign.org/chd/research/healthcare-
environmental-terms-and-outcome-measures-evidence-based-design-glossary.
Table 4 Healthcare outcome measures
TErM (TOPIC SOurCE) DEFInITIOn METrICS MEASurEMEnT METHOD
Adverse drug event (ADE) (Medical errors)
Harm caused by a drug or the use of a drug (Nebeker, Barach, & Samore, 2004).Potential drug event defined as dispensing errors that can harm patients if not intercepted before medication administration (Poon et al., 2006).
- Number of ADEs per 1,000 patient days; percentage of prescriptions involved in potential ADEs divided by the total number of prescriptions (King, Paice, Rangrej, Forestell, & Swartz, 2003; Poon et al., 2006)
Physician review of error reports- Two physicians accessed the
medication error database and reviewed all original incident reports. Severity was reclassified based on patient impact as an ADE, potential ADE, or other. (King, Paice, Rangrej, Forestell, & Swartz, 2003)
- Each of two board-certified internists independently reviewed and rated the severity of each dispensing error by using an explicit set of criteria. Each physician-reviewer determined whether the patient could have had an injury if the dispensing error had reached the patient, defined errors that could harm patients as potential ADEs, and classified potential ADEs as significant, serious, and life-threatening (Poon et al., 2006)
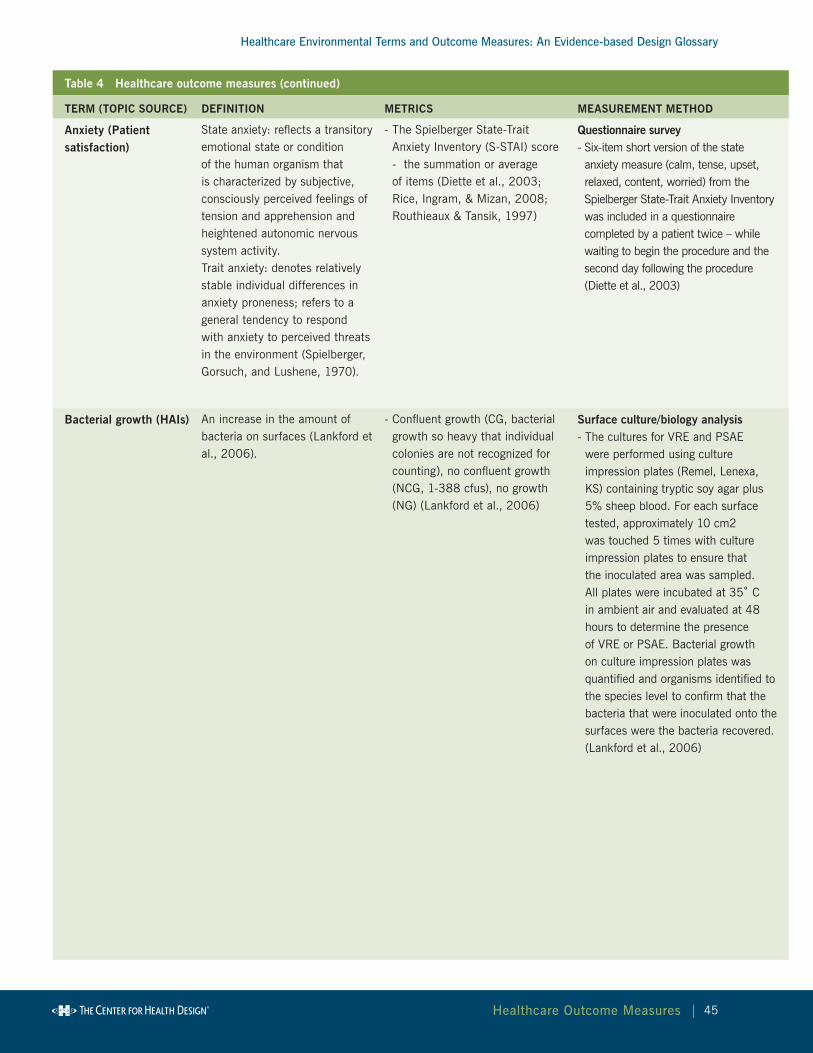
abstract V
healthcare environmental terms and outcome Measures: an evidence-based Design Glossary
45healthcare outcome Measures |
Table 4 Healthcare outcome measures (continued)
TErM (TOPIC SOurCE) DEFInITIOn METrICS MEASurEMEnT METHOD
Anxiety (Patient satisfaction)
State anxiety: reflects a transitory emotional state or condition of the human organism that is characterized by subjective, consciously perceived feelings of tension and apprehension and heightened autonomic nervous system activity.Trait anxiety: denotes relatively stable individual differences in anxiety proneness; refers to a general tendency to respond with anxiety to perceived threats in the environment (Spielberger, Gorsuch, and Lushene, 1970).
- The Spielberger State-Trait Anxiety Inventory (S-STAI) score - the summation or average of items (Diette et al., 2003; Rice, Ingram, & Mizan, 2008; Routhieaux & Tansik, 1997)
Questionnaire survey- Six-item short version of the state anxiety measure (calm, tense, upset, relaxed, content, worried) from the Spielberger State-Trait Anxiety Inventory was included in a questionnaire completed by a patient twice – while waiting to begin the procedure and the second day following the procedure (Diette et al., 2003)
Bacterial growth (HAIs) An increase in the amount of bacteria on surfaces (Lankford et al., 2006).
- Confluent growth (CG, bacterial growth so heavy that individual colonies are not recognized for counting), no confluent growth (NCG, 1-388 cfus), no growth (NG) (Lankford et al., 2006)
Surface culture/biology analysis- The cultures for VRE and PSAE
were performed using culture impression plates (Remel, Lenexa, KS) containing tryptic soy agar plus 5% sheep blood. For each surface tested, approximately 10 cm2 was touched 5 times with culture impression plates to ensure that the inoculated area was sampled. All plates were incubated at 35˚ C in ambient air and evaluated at 48 hours to determine the presence of VRE or PSAE. Bacterial growth on culture impression plates was quantified and organisms identified to the species level to confirm that the bacteria that were inoculated onto the surfaces were the bacteria recovered. (Lankford et al., 2006)

abstract V
healthcare environmental terms and outcome Measures: an evidence-based Design Glossary
46healthcare outcome Measures |
Table 4 Healthcare outcome measures (continued)
TErM (TOPIC SOurCE) DEFInITIOn METrICS MEASurEMEnT METHOD
Bioaerosol concentration (HAIs)
The amount of airborne particles that are biological in origin (Bergeron et al., 2003).
- cfu (colony-forming unit)/m3 (Bergeron et al., 2003)
Air sampling using biocollector and biology analysis - Concentrations of airborne biological particles were determined with biocollectors (MAS 100; Merck) from a height of 1 meter above the floor and operating at 100 L/min for 5 minutes. Petri dishes containing Sabouraud culture media were used for fungal analysis, and standard plate count agar dishes were used to evaluate the total mesophilic flora. Fungal cultures were incubated at 27˚ C and the number of colony-forming units was determined on days 3, 5, and 7 (Bergeron et al., 2003).
Computational fluid dynamics [CFD] study - Fluent 6.2 CFD software (ANSYS, Canonsburg, PA) with an unstructured tetrahedral grid containing approximately 540,000 cells was used to estimate bioaerosol concentration in various simulated conditions (Beggs et al., 2008)
Burnout (Staff satisfaction)
A prolonged psychological response to chronic emotional and interpersonal stressors on the job and defined by three dimensions –emotional exhaustion (EE), depersonalization (D), and low personal accomplishment (PA). EE refers to feelings of being overextended and depleted of emotional and physical resources. D refers to a negative, callous, or excessively detached response to various aspects of the job. PA refers to feelings of incompetence and a lack of achievement and productivity at work (Alimoglu & Donmez, 2005).
- Self-reported burnout scores (Alimoglu & Donmez, 2005)
Questionnaire survey- Maslach Burnout Inventory (22
items in 3 subscales 'emotional exhaustion', 'depersonalization', 'personal accomplishment', 5-point scale 0 never to 4 always, [Maslach & Jackson, 1996], Turkey translation [Ergin, 1992]) (Alimoglu & Donmez, 2005; Tyson et al., 2002)

abstract V
healthcare environmental terms and outcome Measures: an evidence-based Design Glossary
47healthcare outcome Measures |
Table 4 Healthcare outcome measures (continued)
TErM (TOPIC SOurCE) DEFInITIOn METrICS MEASurEMEnT METHOD
Circadian misalignment (Staff efficiency)
A mismatch between an individual’s desired bedtime and the timing of his/her circadian system. Often observed among shift workers and individuals suffering from jet-lag. Usually occurs when individuals attempt to initiate sleep at sub-optimal times during their circadian cycles and, consequently, experience sleep disturbances (Jean-Louis et al., 2008).
- DLMO (dim light melatonin onset) based on melatonin level obtained through saliva sampling and radioimmunoassay analysis
- Temperature minimum (Tmin) - Amount of re-entrainment
(Crowley et al., 2003)
Saliva sampling and radioimmunoassay analysis- Saliva sampling and radioimmunoassay analysis to determine DLMO, Tmin (DLMO + 7 hr), and amount of re-entrainment (not re-entrained [Tmin before the daytime dark/sleep period], partially re-entrained [Tmin during the first half of dark/sleep], or completely re-entrained [Tmin during the second half of dark/sleep]) (Crowley et al., 2003)
Cleaning, thoroughness of terminal cleaning (HAIs)
The amount of high-risk objects cleaned after terminal cleanings (cleanings after discharge) (Carling et al., 2006).
- Percentage of objects cleaned after terminal cleanings (Carling et al., 2006)
Fluorescent marker- Objects marked with targeting
solutions which fluoresce under black light (Carling et al., 2006)
Endotoxin concentration (HAIs)
The amount of toxins associated with certain bacteria (Menzies et al., 2003).
- eu/m3, eu/coupon (Menzies et al., 2003)
Air sampling - Airborne samples for endotoxin
measurements were captured on an isopore polycarbonate membrane (Millipore, Biccerica, MA, UK) backed by a glass fiber pad (Millipore) with a volumetric air pump (Menzies et al., 2003)

abstract V
healthcare environmental terms and outcome Measures: an evidence-based Design Glossary
48healthcare outcome Measures |
Table 4 Healthcare outcome measures (continued)
TErM (TOPIC SOurCE) DEFInITIOn METrICS MEASurEMEnT METHOD
Falls, patient(Patient falls)
There is no universally accepted definition of patient falls. The following definitions are used in literature and practice:- An unplanned descent to
the floor (or extension of the floor, e.g., trash can or other equipment) with or without injury to the patient, and occurring on an eligible reporting nursing unit. All types of falls are included, whether they result from physiological reasons (fainting) or environmental reasons (slippery floor).
- Includes assisted falls which occur when a staff member attempts to minimize the impact of a patient’s fall (NDNQI, 2005).
- Unintentionally coming to rest on the ground, floor, or other lower level regardless of the cause (Becker et al., 2007).
- A sudden, unanticipated change (downward) in body position with or without physical injury (Brandis, 1999).
- An accidental collapse to the ground leading to the completion of an accident report form by nursing staff (Donald, Pitt, Armstrong, & Shuttleworth, 2000).
- A sudden, unexpected descent from a standing, sitting, or horizontal position, including slipping from a chair to the floor, a patient found on the floor, and an assisted fall (Hitcho et al., 2004).
Prevalence:- Number of patients injured per
1,000 admissions (Brandis, 1999)
- Number of injuries per 1,000 patient days (Capezuti et al., 1998)
Severity- Percentage of falls resulting in
injuries of different severity levels (Capezuti et al., 1998; Hanger et al., 1999; Schwendimann et al., 2006; Van Leeuwen et al., 2001)
- Number of hip fractures per 100 falls (Simpson et al., 2004)
Incidence/accident reporting system as described above- Nursing home incidence report (Capezuti, 2002)
- Routine data collection using incident forms (Hanger et al., 1999)
- Falls register of nursing home (Simpson et al., 2004)
radiograph review- Radiograph review of hip fractures (Simpson et al., 2004)
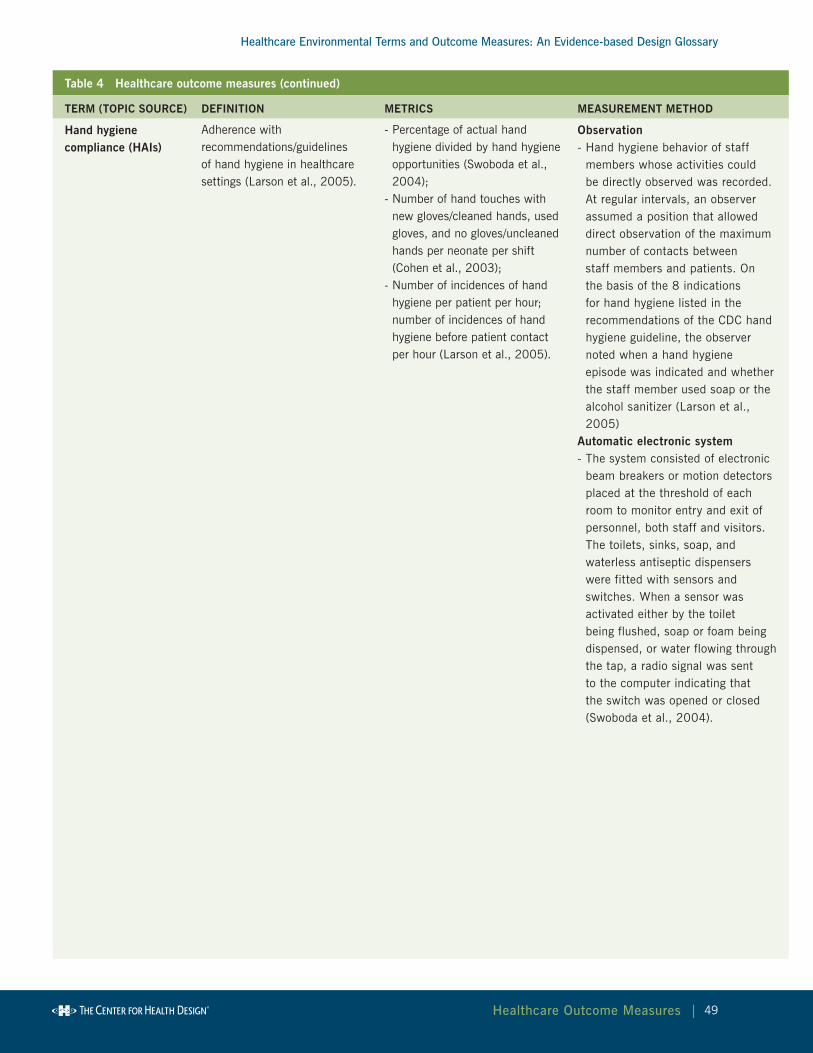
abstract V
healthcare environmental terms and outcome Measures: an evidence-based Design Glossary
49healthcare outcome Measures |
Table 4 Healthcare outcome measures (continued)
TErM (TOPIC SOurCE) DEFInITIOn METrICS MEASurEMEnT METHOD
Hand hygiene compliance (HAIs)
Adherence with recommendations/guidelines of hand hygiene in healthcare settings (Larson et al., 2005).
- Percentage of actual hand hygiene divided by hand hygiene opportunities (Swoboda et al., 2004);
- Number of hand touches with new gloves/cleaned hands, used gloves, and no gloves/uncleaned hands per neonate per shift (Cohen et al., 2003);
- Number of incidences of hand hygiene per patient per hour; number of incidences of hand hygiene before patient contact per hour (Larson et al., 2005).
Observation - Hand hygiene behavior of staff
members whose activities could be directly observed was recorded. At regular intervals, an observer assumed a position that allowed direct observation of the maximum number of contacts between staff members and patients. On the basis of the 8 indications for hand hygiene listed in the recommendations of the CDC hand hygiene guideline, the observer noted when a hand hygiene episode was indicated and whether the staff member used soap or the alcohol sanitizer (Larson et al., 2005)
Automatic electronic system- The system consisted of electronic
beam breakers or motion detectors placed at the threshold of each room to monitor entry and exit of personnel, both staff and visitors. The toilets, sinks, soap, and waterless antiseptic dispensers were fitted with sensors and switches. When a sensor was activated either by the toilet being flushed, soap or foam being dispensed, or water flowing through the tap, a radio signal was sent to the computer indicating that the switch was opened or closed (Swoboda et al., 2004).

abstract V
healthcare environmental terms and outcome Measures: an evidence-based Design Glossary
50healthcare outcome Measures |
Table 4 Healthcare outcome measures (continued)
TErM (TOPIC SOurCE) DEFInITIOn METrICS MEASurEMEnT METHOD
Job satisfaction (Staff satisfaction)
A pleasurable or positive emotional state in an individual, resulting from the appraisal of that person’s job or job experiences (Berry & Parish, 2008).
- Self-reported job satisfaction scores (Alimoglu & Donmez, 2005; Applebaum et al., 2010; Berry & Parish, 2008; Djukic et al., 2010; Folkins et al., 1977; Harris et al., 2006; Jason et al., 2002; Shepley et al., 2008; Tyson et al., 2002; Varni et al., 2004 )
Questionnaire survey- Job Satisfaction Scale (JSS), a 5-item
subscale from the Nurse Stress Index by Harris, Hingley, and Cooper (1988) (Harris et al., 2006; Shepley et al., 2008)
- Work Satisfaction Questionnaire (14 items, 5-point scale from 1 never satisfies me to 5 highly satisfies me, [Hackman & Oldham, 1980] (Alimoglu & Donmez, 2005)
- One item in a staff questionnaire (Berry & Parish, 2008)
- Nurses’ Intent to Stay Questionnaire (NISQ), Job satisfaction 7 items, turnover intent 4 items (Applebaum et al., 2010)
- A five-item Likert type job satisfaction scale with response category varying among items and rescaled to a 7-point scale (Djukic et al., 2010)
- Minnesota Satisfaction Questionnaire (Weiss, Dawis, England, & Lofquist, 1967)
- GM Faces Scale (Kunin, 1955), a simple, well-validated measure including seven drawings of faces with facial expressions ranging from a frown to a smile (Folkins et al., 1977)
- Rehabilitation Job Satisfaction Inventory (Wright & Terrian, 1987) including 15 items, agreement with the statement on a 5-point scale, the final score of job satisfaction was calculated from 4 items (satisfied with job, plan on staying, the best compared to past jobs, look forward to going to work) (Jason et al., 2002)
- Job Satisfaction (Warr et al., 1979), satisfaction with extrinsic and intrinsic features of the job as well as overall job satisfaction, 16 items (Tyson et al., 2002)
- PedQL Staff Satisfaction Coworker Module (Varni et al., 2004)
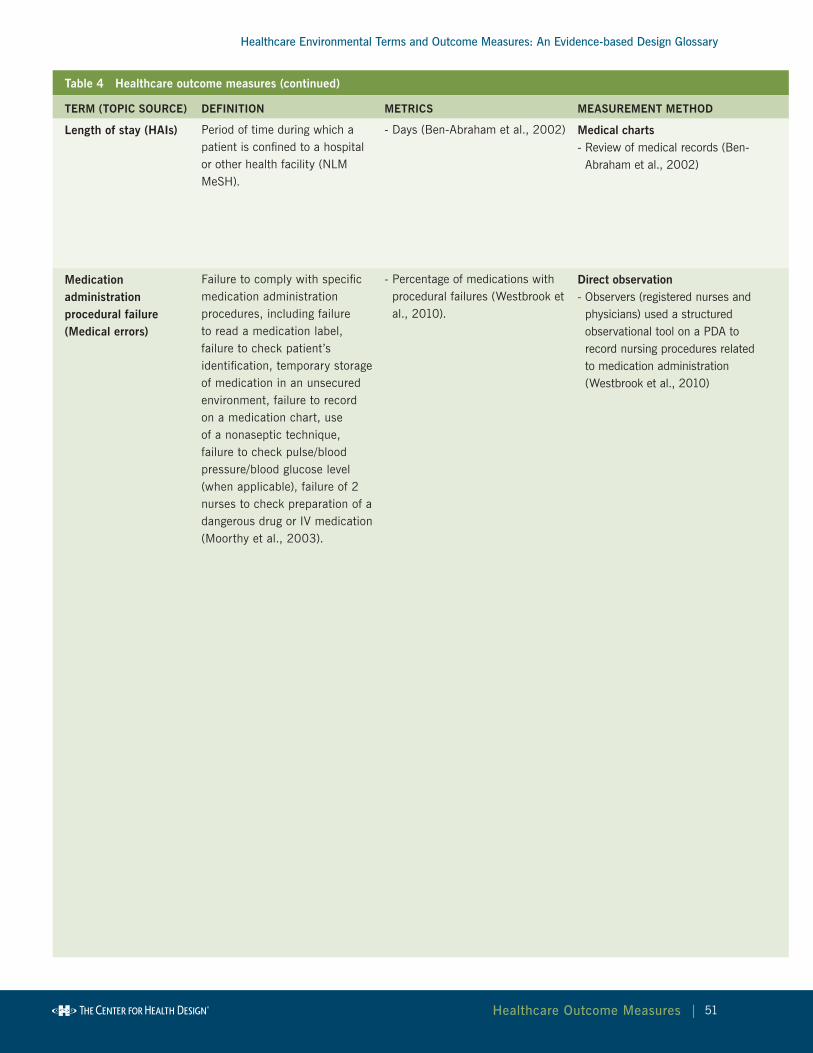
abstract V
healthcare environmental terms and outcome Measures: an evidence-based Design Glossary
51healthcare outcome Measures |
Table 4 Healthcare outcome measures (continued)
TErM (TOPIC SOurCE) DEFInITIOn METrICS MEASurEMEnT METHOD
Length of stay (HAIs) Period of time during which a patient is confined to a hospital or other health facility (NLM MeSH).
- Days (Ben-Abraham et al., 2002) Medical charts - Review of medical records (Ben-
Abraham et al., 2002)
Medication administration procedural failure (Medical errors)
Failure to comply with specific medication administration procedures, including failure to read a medication label, failure to check patient’s identification, temporary storage of medication in an unsecured environment, failure to record on a medication chart, use of a nonaseptic technique, failure to check pulse/blood pressure/blood glucose level (when applicable), failure of 2 nurses to check preparation of a dangerous drug or IV medication (Moorthy et al., 2003).
- Percentage of medications with procedural failures (Westbrook et al., 2010).
Direct observation- Observers (registered nurses and
physicians) used a structured observational tool on a PDA to record nursing procedures related to medication administration (Westbrook et al., 2010)

abstract V
healthcare environmental terms and outcome Measures: an evidence-based Design Glossary
52healthcare outcome Measures |
Table 4 Healthcare outcome measures (continued)
TErM (TOPIC SOurCE) DEFInITIOn METrICS MEASurEMEnT METHOD
Medication error (Medical errors)
Error that occurs while ordering, transcribing, dispensing, administering, or monitoring medications, irrespective of the outcome (Kaushal & Bates, 2001).
- Number of dispensing errors per pharmacist per hour Flynn et al., 1999)
- Percentage of prescriptions involved in errors divided by the total number of prescriptions (Buchanan et al., 1991; Flynn et al., 1999; Westbrook et al., 2010)
- Percentage of prescriptions with near-errors corrected and corrected staff (Flynn et al., 2002)
- Number of nurse medication errors per month (Booker & Roseman, 1995)
- Severity of error: five severity rating levels (1 - little or no effect on patient, 2 - likely to lead to increase in level of care, 3 - likely to lead to permanent reduction in bodily functioning, 4 - likely to lead to a major permanent loss of function, 5 - likely to lead to death); two categories (major errors - levels 4-5, minor errors - levels 1-3) (Westbrook et al., 2010)
Direct observation & expert evaluation - Filled prescriptions evaluated by researcher to detect deviations from physician's orders (Flynn et al., 1999; Flynn et al., 2002)
- After the routine final check by a pharmacist but before the drug was dispensed to the patient, every prescription was reviewed for content by the observer (Buchanan et al., 1991)
- A trained research pharmacist-observer inspected the medications that had already undergone the usual 3-step dispensing process to look for dispensing errors and classify the error types (Poon et al., 2006)
- The direct observation method consists of an observer witnessing the administration of medicines to patients by the nurse. The observer checks the administration of each dose by the nurse with the help of an exact copy of the medication administration record. The observer does not interfere if an error is observed. If the observer estimated that the patient's safety is compromised, a warning is given to the nurse before the medicine is actually taken by the patient (Ros & de Vreeze-Wesselink, 2009).
- Observers (registered nurses and physicians) used a structured observational tool on a PDA to record details of medication administrated and compare the data with patients' medication charts to determine whether the medication administrated differed from what was ordered (Westbrook et al., 2010).
Adverse event reporting system - A passive reporting system. The nurse and physician involved in a medication error complete an incident report and document the incident. The severity of patient harm is rated as none, mild, moderate, or severe. Medication errors are then sent to the pharmacy department and entered into a spreadsheet database (King, Paice, Rangrej, Forestell, & Swartz, 2003).
- The annual medication error index was measured by the hospital’s standard system for reporting adverse events (Hendrich, Fay, & Sorrells, 2004).
- Errors were documented on a standard error reporting form completed by the nurse committing the error and/or staff discovering the error (Booker & Roseman, 1995).

abstract V
healthcare environmental terms and outcome Measures: an evidence-based Design Glossary
53healthcare outcome Measures |
Table 4 Healthcare outcome measures (continued)
TErM (TOPIC SOurCE) DEFInITIOn METrICS MEASurEMEnT METHOD
Medication processing time (Staff efficiency)
Amount of time from when a prescriber orders medication, to the pharmacy receiving the order, to the pharmacist completing the order (Wietholter et al., 2009).
- Prescription filling time (Lin et al., 1988; Wietholter et al., 2009)
- Pharmacist travel distance for filling prescriptions (Lin et al., 1988)
Computer simulation- Prescription filling time measured
by computer simulation using a predetermined motion time system (PMT systems), standards determined through consultation with supervising pharmacist and videotaping of pharmacist work (Lin et al., 1988)
Medical records- Review of medication records
(Wietholter et al., 2009)Measurement on architectural drawings- Pharmacist travel distance for
filling prescriptions was measured and calculated using architectural drawings (Lin et al., 1988)
Mortality (HAIs) The rate of death from any cause in hospitalized populations (NLM MeSH).
- Percentage of deaths/total number of patients (McManus et al., 1992)
Actual: Medical charts;Expected: Estimated using an equation based on patient characteristics e.g., burn size, age (McManus et al, 1992)
nosocomial infection (HAIs)
An infection that is acquired in a hospital as a result of medicalcare; also called hospital-acquired infection (Sehulster et al., 2004).
- Number of NIs per 100 admits/discharges (Modol et al., 2007); Number of NIs per 1,000 patient days (Swoboda et al., 2004); Number of hospital-acquired infections per patient (Ben-Abraham et al., 2002);
- Risk of infection - Percentage of susceptible patients infected (Escombe et al., 2007)
Medical charts- Infection data were prospectively
collected and stored in a computerized database. All infections and antibiotic uses were reviewed by the facility's Infection Control Committee based on pre-existing criteria (McManus et al., 1992)
- Physician evaluation according to CDC criteria based on test results of respiratory, serum, or urinary samples (Modol et al., 2007)
Model estimation- Estimated by Wells-Riley model of
airborne infection (Escombe et al., 2007)
nurse response to patient calls(Staff efficiency)
Amount of time from when a nurse call button is pressed to when the nurse responds to the call (Guarascio-Howard, 2011)
- Response time to patient calls (minute) (Guarascio-Howard, 2011)
- Patient ratings of nurse response to patient calls (Donahue, 2009)
Observation- Shadowing of nursing activity
(Guarascio-Howard, 2011)Questionnaire survey- Press Ganey score on nurses’
promptness in response to patient calls (Donahue, 2009)

abstract V
healthcare environmental terms and outcome Measures: an evidence-based Design Glossary
54healthcare outcome Measures |
Table 4 Healthcare outcome measures (continued)
TErM (TOPIC SOurCE) DEFInITIOn METrICS MEASurEMEnT METHOD
Particulate level (HAIs) Amount of particles in the air (Bergeron et al., 2003).
- Number of particles/m3 (Bergeron et al., 2003).
Air Sampling using particle counter- Airborne particle counts were
measured over a 1-minute interval with a 6-channel, light-scattering particle counter (CI-500; Climet), operating at a flow rate of 1.7 cubic meters per hour and placed 1.2 meters above floor level (Bergeron et al., 2003)
Patient colonization (HAIs)
Isolation of a targeted pathogen (organism) from the patient (e.g., sputum, wound surface, urine, stool) (McManus et al., 1992).
- Percentage of patients colonized;- Postburn time delay in
colonization (McManus et al., 1992)
Microbiology surveillance- Microbiology surveillance was
performed for the first 30 days of hospitalization or longer if patients remained in the unit. The surveillance included weekly cultures of sputum, wound surface, urine, and stool. Colonization was defined as isolation of the organism from any site on the body (McManus et al., 1992)
Patient loyalty (Patient satisfaction)
Patient's long-term commitment to a preferred healthcare service provider; a manifestation of attitudes and actual purchasing behaviors (Hsu, Hsu, & Chiu, 2009)
- Willingness to recommend or return, ratings of Likert scale (Nguyen Thi et al., 2002; Swan et al., 2003)
Questionnaire survey- Two questions in Patient Judgments
of Hospital Quality questionnaire (PJHQ) about intention of recommending the hospital or returning (Nguyen Thi et al., 2002)
Perception of physical environment (Staff satisfaction)
Quality of the physical environment as perceived by healthcare staff members. May include perceptions of environmental aspects such as quality of the patient care area (comfort and privacy afforded to patients and families due to the design of patient areas), safety (degree of hazard for staff and patients related to facility design), pleasantness (ambience of the facility design due to specific design features) (Berry & Parish, 2008).
- Subjective rating of physical environment (Berry & Parish, 2008; Harris et al., 2006; Shepley et al., 2008)
Questionnaire survey- Perception of physical environment
(quality of patient areas [4 items], safety [3 items], pleasantness [3 items], quality of workspace [6 items]) (Berry & Parish, 2008)
- Level of agreement with statement regarding the physical environment, 12 questions, 5-point scale, average score (e.g., quiet, private space for family to be alone, atmosphere tense and stressful for staff/family) (Harris et al., 2006; Shepley et al., 2008)

abstract V
healthcare environmental terms and outcome Measures: an evidence-based Design Glossary
55healthcare outcome Measures |
Table 4 Healthcare outcome measures (continued)
TErM (TOPIC SOurCE) DEFInITIOn METrICS MEASurEMEnT METHOD
Satisfaction, patient (Patient satisfaction, Patient waiting)
Degree to which an individual regards a provider’s health care service, product, or the manner in which the service or product is delivered as useful, effective, or beneficial (NLM MeSH).
Patient Waiting- Overall satisfaction with service
(Papa et al., 2008; Pruyn & Smidts, 1998)
Patient Satisfaction- Scores of Likert type scales or
subscales calculated (summation or average of items in the each scale/subscale) (e.g., Groff et al., 2008; Janssen et al., 2000 )
- Percentage of "excellent" responses (Becker & Douglass, 2008)
- Percentage of patients who are dissatisfied (Hendrich, Fay & Sorrells, 2004)
- Score of a single question of patient satisfaction (Leather et al., 2003; Lee et al., 2004)
Questionnaire- One question in the survey asked for
the overall satisfaction level, 5-point Likert scale, excellent - poor (Papa et al., 2008)
- Overall patient satisfaction rated on a 10-point scale (Pruyn & Smidts, 1998)
Questionnaire survey (see Appendix for a table of questions and subscales in questionnaires found in literature)- Questionnaires (8 subscales - e.g.,
information and support, being with family and friends, privacy needs, physical environment) were distributed on the day of delivery and completed after delivery and before discharge (Janssen et al., 2000). A questionnaire including 16 items from a patient judgment system (PJS) developed by the Hospital Corporation of America was distributed to patients before and after the movement to a new unit. Patients completed the questionnaires independently or with help from nurses. The completed questionnaires were collected by nurses (Kline et al., 2007).
- Patients were offered a questionnaire survey when completing their clinic visits and asked to fill out a questionnaire on-site or mail in the completed questionnaire from home. The quality of care index was the average percentage of "excellent" responses to 4 questions related to care, services, and interactions with staff and doctors (Becker & Douglass, 2008)
- Patient Expectation Project standardized tool (Arbor Associates, Inc., Potoskey, MI) measuring how closely patients' experiences meet their expectations (Hendrich, Fay & Sorrells, 2004)
- Satisfaction score on a 10 cm visual analog scale (0 =not satisfied, 10 = very satisfied) (Lee et al., 2004)

abstract V
healthcare environmental terms and outcome Measures: an evidence-based Design Glossary
56healthcare outcome Measures |
Table 4 Healthcare outcome measures (continued)
TErM (TOPIC SOurCE) DEFInITIOn METrICS MEASurEMEnT METHOD
Staff travel(Time allocation, travel distance) (Staff efficiency)
Physical movements (location, time, duration, frequency, activity type) of healthcare staff members (Shepley, 2002; Zborowsky, 2010).
- Nursing activity (20 types), location (31), time data, and nurse type were recorded sequentially (Shepley, 2002)
- Frequency and duration of activities (Zborowsky, 2010)
- Nurse walking distance (steps per minute, the ratio of travel distance to unit floor area) (Shepley, 2002)
Observation- Observers made rounds of the facility at
specific time points and recorded activities. Staff activities were classified in 9 categories (e.g., direct patient care, indirect patient care, nonproductive time), locations in 5 categories (e.g., nurse station, patient room), and 2 other categories (with patient, total not travel) (Trites et al., 1970)
- Behavior mapping (recording staff behaviors, locations, time data) (Shepley, 2002)
- Videotaping using ceiling-mounted cameras received and processed by custom-made software installed on computers (Pati, Cason, Harvey, & Evans, 2010)
- Frequency and duration of activities recorded by a digital timer and visual data charts (Zborowsky, 2010)
Work sampling study with PDAs- The PDAs were set to vibrate randomly
approximately 22 times over a 12-hour period. The nurse then selected her or his location and the most accurate description of the activity being performed (Donahue, 2009)
- A personal digital assistant (PDA) vibrated at random times throughout the work shift, prompting nurses to select their location and activity at that moment from a predetermined list of options (Hendrich et al., 2009)
Pedometer- Electronic pedometer attached to the back
of staff's belts (Shepley & Davies, 2003; Donahue, 2009)
Indoor positioning system- A positioning system tracked radio-frequency
identification (RFID) badges worn by participating nurses (Hendrich, 2009)
Link analysis- Link analysis was used to record and analyze
movements among components, e.g., nursing staff, equipment/devices, and furniture. Tasks that occupied the most space, areas that had the highest level of activity (to determine the layout and adjacency requirements of equipment and furniture), and areas needing easiest access were identified (Lu, 2009)

abstract V
healthcare environmental terms and outcome Measures: an evidence-based Design Glossary
57healthcare outcome Measures |
Table 4 Healthcare outcome measures (continued)
TErM (TOPIC SOurCE) DEFInITIOn METrICS MEASurEMEnT METHOD
Stress, staff (Staff satisfaction)
A state of mental or bodily tension caused by the imbalance between an individual's environmental demands or perceived demands and the individual’s ability or perceived ability to cope with the environmental demands (Stokols & Montero, 2002).
Physiology measures- Heart rate (average HR [bpm],
minimum, maximum HR for every half-hour period, percent of time in tachycardia [HR>100], number of episodes of ectopy [disturbance of the cardiac rhythm]) (Morrison et al., 2003)
- Salivary amylase concentration (units per mL) (Morrison et al., 2003)
Psychology measures- Self-reported stress and
annoyance (Alimoglu & Donmez, 2005; Morrison et al., 2003)
Electrocardiography (ECg) monitoring- A portable cassette battery-driven
Holter monitor (GE Marquette 8500 series, Milwaukee, WI) (Morrison et al., 2003)
- Salivary hormone analysis - A citric acid impregnated cellulose
sponge, salivary amylase field test kits (Morrison et al., 2003).
Questionnaire survey- Expanded Nurse Stress Scale (ENSS)
by French, Lenton, Walters, and Eyles (2000), 59 items in 9 subscales (Harris et al., 2006; Shepley et al., 2008).
- Specific Rating of Events Scale, nurses rated how stressed or annoyed "right now" on a scale of 0 for "not at all stressful" or "not at all annoyed" to 100 for "most stress possible" or "most annoyance possible" (Morrison et al., 2003)
- Work Related Starin Inventory, 18 items about work-related expectations, stress, interpersonal relations, productivity, working habits, interactions between work and family [Revicki et al., 1991], 4 point scale from 1 surely agree to 4 surely disagree (Alimoglu & Donmez, 2005)
- 3 items in a questionnaire developed specifically for the study (Berry & Parish, 2008)

abstract V
healthcare environmental terms and outcome Measures: an evidence-based Design Glossary
58healthcare outcome Measures |
Table 4 Healthcare outcome measures (continued)
TErM (TOPIC SOurCE) DEFInITIOn METrICS MEASurEMEnT METHOD
Surface contamination (HAIs)
Presence of pathogens on inanimate surfaces (Anderson et al., 1982).
- Number of microorganisms (cfu) per square inch (Anderson et al., 1982);
- Bacterial community composition (Harris et al., 2010)
Swab sampling/biology analysis - Surface swab samples were collected
from each flooring type using a surface swab kit (SKC, Eighty Four, PA, USA). DNA from the swab washes was extracted with an Ultraclean Microbial DNA Kit (Mo-Bio, Carlsbad, CA, USA) (Harris et al., 2010). Generic analysis - denaturing gradient gel electrophoresis (DGGE)
- The DGGE technique is based on the separation of PCR fragments of the same length in a linearly increasing gradient of chemical denaturants. The different fragments melt and, consequently, stop at particular positions in the gel, a transition from helical to partially melted molecule that depends on the base composition of their sequences. The resulting banding pattern represents a profile of the community, and the relative intensity of each band represents the relative abundance of a particular member of the community. Consequently, microbial communities can be quickly analyzed and compared, permitting temporal and spatial analysis within and between communities (Harris et al., 2010)

abstract V
healthcare environmental terms and outcome Measures: an evidence-based Design Glossary
59healthcare outcome Measures |
Table 4 Healthcare outcome measures (continued)
TErM (TOPIC SOurCE) DEFInITIOn METrICS MEASurEMEnT METHOD
Surgeon/anesthesiologist performance (Staff efficiency)
Performance of surgical tasks and anesthesia monitoring tasks (Liu et al., 2009; Miskovic et al., 2008; Sanderson, 2005).
Anesthesiologist performance- Number of anesthesia events
detected, event detection time(s), frequency of changes in gaze location (changes/minutes), percentage of time looking toward a location
- Percentage of correct judgments (abnormality judgments: normal, high, low; trend judgments: steady, increasing, decreasing, fluctuating) (Sanderson, 2005)
- Anesthesiologist perception of work efficiency (Liu et al., 2009)
Surgeon performance - Global task score (the anatomy
scores [accuracy of cystic duct and artery clipping] minus the error score [e.g., clipping errors, cutting errors, bleeding], with a minimum score of 0), total task time, instrument travel distances, and surgeons’ heart rate (Miskovic et al., 2008)
Simulation- Test scenarios performed on a METI ECS™ (Sarasota, FL) mannequin. Video data were analyzed to determine the onset time of an event (when event symptoms are first visible in the video) and the time of detection (when the participant makes a comment about the event or begins a corrective action). Gaze location was coded using three categories: Anesthesia machine, Patient, and Other (Liu et al., 2009)
- LS500 (Xitact) virtual patient laparoscopy simulator, run by a Pentium PC with a high-resolution thin film transistor (TFT) monitor connected to 2 robotic force feedback devices acting as interfaces for the laparoscopic instruments (Miskovic et al., 2008).
- The surgical task was to move cylindrical pieces of sponge from one disc to another. Surgical performance was measured by the Imperial College Surgical Assessment Device. When motion tracking sensors attached to the dorsum of both hands move in an electromagnetic field generated by the system, the positional data from the trackers gets converted into data on the number of movements and the path length traversed by each hand using specially developed software (Moorthy et al., 2003).
- During simulated monitoring of visual and auditory displays of patients’ vital signs (9 anesthesia test scenarios), participants were asked every 50–70 seconds whether one of five vital signs was abnormal and the trend of its direction. Anesthesia simulator (Advanced Simulation Corporation’s Body TM physiological and pharmacological engine, connected to an interface largely similar to the Body TM Anesthesia Simulator interface) (Sanderson, 2005).
Questionnaire- Self-reported work efficiency (Liu et al., 2009)

abstract V
healthcare environmental terms and outcome Measures: an evidence-based Design Glossary
60healthcare outcome Measures |
Table 4 Healthcare outcome measures (continued)
TErM (TOPIC SOurCE) DEFInITIOn METrICS MEASurEMEnT METHOD
Surgical errors (Medical errors)
Errors in the performance of surgical procedures. In a laparoscopic task, skill-based errors involved dropped objects and objects placed inaccurately in the disc–either on their side or incompletely within the zone; knowledge-based errors occurred when objects were placed in the wrong zone (Moorthy et al., 2003).
- Number of errors in a surgical task (task error score) (Moorthy et al., 2003; Pluyter et al., 2010)
Surgery simulation system- Xitact LC 3.0 virtual reality simulator (Xitact SA, Morges, Switzerland). The clip and cut assessed (CCA) task in the Clip and Cut (C&C) module was used. Task errors were recorded by the simulator (Pluyter et al., 2010)
Team communication (Staff efficiency)
Frequency, formalization, structure, and openness of information exchange between team members (Carmeli, Gelbard, & Goldriech, 2010)
- Number of verbal interactions per hour, length of conversations, number of persons involved in one interaction (Dutta, 2008)
- Number of nurse-initiated communications (Guarascio-Howard, 2011)
- Communication type, number, time (Gurascio-Howard & Malloch, 2007)
- Staff perception of communication (Gurascio-Howard & Malloch, 2007; O'Connor et al., 2009)
- Communication between nurse and surgeon (response rate, correct patient ID time, error rate, response time, solution time, communication time, intraoperative case interruptions) (Ortega et al., 2009)
Observation- Staff verbal interactions were manually recorded according to predetermined categories for physical location, participant roles, gender and duration of interactions (Dutta, 2008)
- Shadowing of nurses (Gurascio-Howard & Malloch, 2007)
- Direct observation with stop-watch (Ortega et al., 2009)
Audio recording- Analysis of audio recording of team communication (Gurascio-Howard & Malloch, 2007)
Interview - Interviews regarding staff perceptions of communication, technology, and team-work (Gurascio-Howard & Malloch, 2007)
Questionnaire- Questionnaire, 49 items, developed by interview, focus group, pretesting. Items included: improved speed of communication, improved reliability of communication, less effort required to communicate, improved physician response times to critical issues, etc. 7 point scale (O'Connor et al., 2009).
Transport, patient intra-hospital transport (Medical errors)
Transport of patients within the hospital (Ulrich & Zhu, 2007)
- Number of patient transports between nursing units /month (Hendrich, Fay, & Sorrells, 2004).
Medical and operational data- Data collected from Transition System, Inc. (TSI) by Vanderbilt University Medical Center, Nashville, TN (Hendrich, Fay, & Sorrells, 2004).
Tuberculin conversion and reactivity (HAIs)
TB conversion: indurations of 10 mm or greater with an increase of at least 6 mm more than 1 year after a negative result (<10 mm).TB reactivity: indurations of 10 mm or greater (Menzies et al., 2000).
- Ratio (percentage) of healthcare workers with Tuberculin conversion (Menzies et al., 2000);
- Ratio (percentage) of patients/visitors with Tuberculin reactivity (Hutton et al., 1990)
TB skin test- Tuberculin conversion is indicated by induration of 10 mm or greater with an increase of at least 6 mm more than 1 year after a negative result (<10 mm) (Menzies et al., 2000)

abstract V
healthcare environmental terms and outcome Measures: an evidence-based Design Glossary
61healthcare outcome Measures |
Table 4 Healthcare outcome measures (continued)
TErM (TOPIC SOurCE) DEFInITIOn METrICS MEASurEMEnT METHOD
Turnover intent (Staff satisfaction)
Employees' inclination to voluntarily leave their organization (Haybatollahi, 2009).
- Self-reported turnover intent (Applebaum et al., 2010; Lin et al., 2008)
Questionnaire survey- Nurses’ Intent to Stay Questionnaire (NISQ) (turnover intent 4 items) (Applebaum et al., 2010)
- Variables measured on 0-100 scale (Lin et al., 2008)
Waiting behavior, patient (Patient waiting)
Behaviors that patients exhibit in waiting rooms (Nanda, 2010; Pati & Nanda, 2011).
- Percentage of behaviors in the following categories: attention (positive distraction, other artwork, toy, book, wall, ceiling, floor, door, window, furniture, people, themselves), physical behavior (calm, fidgety, fine movement, intense), activity (playing with toys, playing with non-toys, non-play activity/other play), location (out of seat, in seat, parent's lap), social behavior (positive interaction, negative interaction, solitary behavior) (Pati & Nanda, 2011)
- Number of discrete behaviors (getting out of seat, entering waiting room, people pacing, changing seat, aggressive behavior) in three, 5-minute periods every 20 minutes (Nanda, 2010)
Observation- Behavioral observations during 20-minute windows over 12 days, snapshot at beginning of each minute, modification of an existing children's observation instrument (Handen, McAuliffe, Janosky, Feldman, & Breaux, 1998) (Pati & Nanda, 2011)
- Systematic observation, behavior mapping (Nanda, 2010)

abstract V
healthcare environmental terms and outcome Measures: an evidence-based Design Glossary
62healthcare outcome Measures |
Table 4 Healthcare outcome measures (continued)
TErM (TOPIC SOurCE) DEFInITIOn METrICS MEASurEMEnT METHOD
Waiting time, patient (Patient waiting)
Period of time from when a patient arrives at a clinic or ED to the time his or her consultation/treatment begins (Dexter, 1999).
Actual waiting time- ED: patient waiting time to
be seen by a doctor (minute) (Ardagh et al., 2002), overall ED length of stay (minute) (Ardagh et al., 2002; Bullard et al., 2008), time from triage to bed (Bullard et al., 2008), ED time from bed to physician (Bullard et al., 2008), time from treatment room to physician (Hall et al., 2008)
- Medical office: time spent in waiting room and exam room (Becker & Douglass, 2008)
Perceived waiting time- Percentage of respondents in
categories from 0-5 minutes to more than 30 minutes (Becker & Douglass, 2008)
- Subjective rating from "very short" to "very long" (Papa et al., 2008)
Medical records- Data extracted from the ED module of Patient Management System (Ardagh et al., 2002)
- Actual waiting time and LOS were extracted from computerized medical records (Tran et al., 2002)
- Times were recorded by physicians and retrospectively collected from existing database (Hall et al., 2008)
Observation- Observer was located in waiting area and hallway outside exam rooms. Time from patient entering the practice until called into exam room by staff, and time from patient entering exam room until leaving the exam room (Becker & Douglass, 2008)
Questionnaire- Patient perception of how long they waited in the waiting area and in the exam room was assessed on the survey (Becker & Douglass, 2008)
- In one question, questionnaire asked patients to rate the wait time on a 4-point scale from very short to very long (Papa et al., 2008)
abstract V
healthcare environmental terms and outcome Measures: an evidence-based Design Glossary
63Using the Glossary |
VI. Using the Glossary
healthcare environmental terms and outcome Measures: an evidence-based Design Glossary
The glossary in this report was developed using evidence-based methodologies for
two important reasons – to provide definitions of environmental terms and outcome
measures for seven high-priority healthcare outcome topics and to create a standard
reference that can be used by researchers, designers and the entire healthcare team.
A comprehensive set of reference tools have been created for the seven healthcare
outcome topics:
Models depicting the environmental terms and outcome measures found for •
each topic during a literature review (see models in Chapter III. Results)
Definitions for each environmental term and outcome measure found, along •
with the metrics and measurement methods used to evaluate the terms and
measures (see tables in Chapter IV. Healthcare Environmental Variables and
Chapter V. Healthcare Outcome Measures)
Matrix summarizing the evidence of the relationships between environmental •
features and outcome measures. (See http://www.healthdesign.org/chd/
research/healthcare-environmental-terms-and-outcome-measures-evidence-
based-design-glossary).
Article analysis table with summary information about each study used •
to develop the glossary – sample and study setting, study design, variables
examined, metrics used, and results. (See http://www.healthdesign.org/chd/
research/healthcare-environmental-terms-and-outcome-measures-evidence-
based-design-glossary). For the patient satisfaction topic, a summary of the
types of questions asked in various patient satisfaction surveys is also provided.
The glossary can be used for:
Defining environmental terms and outcome measures for research projects•
Developing environmental research studies•

abstract V
healthcare environmental terms and outcome Measures: an evidence-based Design Glossary
64Using the Glossary |
Exploring the high-priority healthcare topics to identify which environmental •
features have been studied for their impact on healthcare outcomes
Identifying metrics and measures that have been used to evaluate the impact of •
specific environmental features
Beginning a literature review for an evidence-based design research project•
Identifying key environmental features to include in healthcare projects across the •
facility life-cycle
Defining outcome measures to monitor as a component of post-occupancy •
evaluation and healthcare facility performance improvement projects

abstract V
healthcare environmental terms and outcome Measures: an evidence-based Design Glossary
65Conclusion |
VII. Conclusion
healthcare environmental terms and outcome Measures: an evidence-based Design Glossary
Over the past decade, our understanding of the associations between the physical
healthcare environment and the outcomes associated with the patient, patient’s
family, staff, and the care organization has made healthy progress. Once considered
a passive backdrop to the process of care delivery, the physical design of the care
setting is now regarded as an active contributor to the health and well-being of the
environment’s users and a business driver of healthcare organizations.
Challenges remain, however, in reaching an optimal understanding of the complex
and interacting factors that characterize the care environment. Factors from multiple
domains – e.g., treatment, workflow, processes, cultures, policies, physical environments,
and sociological and psychological processes at the individual and group levels – interact
in complex ways in care delivery and healing. Improving patient and staff outcomes
and reducing care delivery costs requires a greater, more accurate comprehension of
these complex interactions as opposed to the traditional focus of healthcare research
in individual, narrowly defined domains. The need for better comprehension of these
complex processes is even more crucial at a time when the central focus of healthcare is
moving away from treating illnesses and toward promoting health.
A lack of common definitions, tools, measures, and metrics poses a fundamental
problem in any research endeavor, let alone the physical environment. As our
understanding of the physical environment improved over the past decade, it
became increasingly clear that further research and meaningful study outcomes
are contingent on having common definitions, tools, and metrics associated with
the physical care environment. This glossary project was initiated to address this
critical challenge.
An absence of a glossary impacts more than the ability to conduct meaningful,
individual research. The lack of a glossary:
Poses problems in systematic integrative reviews of multiple studies, both •
quantitative and qualitative

abstract V
healthcare environmental terms and outcome Measures: an evidence-based Design Glossary
66Conclusion |
Creates problems when translating findings to design decisions and when •
developing design guidelines
Precludes the development of advanced and more complex theoretical •
frameworks to capture the interactions between the myriad factors that impact
healthcare outcomes; without such frameworks, multi-disciplinary studies
might not optimize our understanding of critical phenomena
This glossary project was envisaged in multiple phases. The first phase forms the
content of this report and was designed to provide a snapshot of the current state of
environmental terms and outcome measures for seven high priority topics. It was
not meant to be a comprehensive review of scientific literature. Rather, articles were
selected to create a comprehensive list of factors/variables that have been targeted in
healthcare environment studies. The objective was to capture in a single document
the environmental variables used in healthcare studies, their definitions (conceptual
and operational, if provided by the authors), tools and measures used in the studies,
and the sources and validation studies associated with such tools and measures,
where available.
As underscored in this report, the physical environment has more frequently been
measured at the categorical (or nominal) level. Categorical levels of measurement
per se do not connote any reduction in the robustness of the studies. Moreover,
numerous aspects of the physical environment are amenable only to categorical levels
of measurement. The key problem is that higher levels of measurement need to be
developed to provide greater analytical power to data analyses. A prerequisite to
developing higher levels of measurement is the availability of precise conceptual and
operational definitions for the targeted variables.
This is where the glossary project provides a crucial foundation. Future phases
of this study will expand the list of terms and definitions in both the healthcare
environmental variables and outcome measures. Expanding the glossary will
enable researchers to develop more powerful tools and measures and to articulate
frameworks that capture the true complexities of the relationship between the built
environment and healthcare outcomes.

abstract V
healthcare environmental terms and outcome Measures: an evidence-based Design Glossary
67Next steps |
VIII. Next Steps
healthcare environmental terms and outcome Measures: an evidence-based Design Glossary
Recommended next steps are organized around two major goals: distributing the
glossary report and further glossary development.
Distributing the glossary report (November 2011)
Distributing the glossary findings is an important step in the glossary development.
This report will be:
Made available on CHD’s website•
Highlighted in a message to CHD community members•
Shared at key conferences and meetings•
Highlighted in a message to communities that work with healthcare •
environmental and outcome variables
Used to develop relationships with other key stakeholder groups, with a goal of •
persuading them to support and adopt these terms
Shared with post-occupancy evaluation development teams•
Further glossary development (November 2011 – October 2012)
A four-pronged approach is envisioned for the second phase of glossary development:
Engage interested, multidisciplinary volunteers to assist in the glossary’s development •
Facilitate additional topic area development in partnership with •
academic institutions
Examine additional sources of environmental terms and healthcare outcome measures•
Develop the Ripple database (an open source, searchable database containing usable •
and relevant information to help user learn about evidence-based design) to house
the glossary and support its development

abstract V
healthcare environmental terms and outcome Measures: an evidence-based Design Glossary
68appendix |
IX. Appendix
healthcare environmental terms and outcome Measures: an evidence-based Design Glossary
The following tables of article analysis, glossary tables, and matrices of relationships
as well as a complete reference list can be found at http://www.healthdesign.org/chd/
research/healthcare-environmental-terms-and-outcome-measures-evidence-based-
design-glossary:
Healthcare-associated infections•
Medical errors•
Patient falls•
Patient satisfaction•
Patient waiting•
Staff efficiency•
Staff satisfaction•

abstract V
healthcare environmental terms and outcome Measures: an evidence-based Design Glossary
69
Copyright (c) 2011 by The Center for Health Design's Research Coalition.
The work of The Center for Health Design's Research Coalition is generously
supported by Tandus Flooring
Pubilshed by
The Center for Health Design
1850 Gateway Boulevard, Suite 1083
Concord, CA 94520
(925) 521-9404
Designed by
Robert Anthony Strategic Marketing & Design
1470 Maria Lane, Suite 380
Walnut Creek, CA 94596
www.robertanthony.com


