
Note: this is a draft of the journal article:
Peter R. Worsley, G. Gower, G. Prudden, Dan L. Bader (2016) “Investigating the Effects of Strap tension during Non-Invasive Ventilation Mask Application: A Combined
Biomechanical and Biomarker Approach.”
Medical Devices: Evidence and Research
The final, fully proofed and peer-reviewed journal article is available from the publisher online, via
https://www.dovepress.com/medical-devices-evidence-and-research-archive24
1
1
2
3
4
5
6789
10
1112
13
14
15
16
17
18
19
20
21
22

Medical Devices: Evidence and Research
Title: Investigating the Effects of Strap tension during Non-Invasive Ventilation Mask
Application: A Combined Biomechanical and Biomarker Approach
Peter R. Worsley PhD a, George Prudden MSc a, George Gower MSc a, Dan L. Bader DSc a.
a Clinical Academic Facility, Faculty of Health Sciences, University of Southampton,
Southampton, SO17 1BJ, UK
Key words: medical device; pressure ulcers, respiratory masks, non-invasive ventilation;
biomarkers
Running Header: The Effects of Strap tension during Respiratory Mask Application
Corresponding Author: Dr Peter Worsley, MP 11 South Academic Block, Southampton General
Hospital, Southampton, UK. Email: [email protected] Tel: +44(0)2381 208957
Word Count
Abstract: 299
Manuscript: 3034
2
23
24
25
26
27
28
29
30
31
32
33
34
35
36
37
38
39
40
41
42
43

Abstract
Non-invasive ventilation is commonly used for respiratory support. However, in some cases,
mask application can cause pressure ulcers to specific features of the face resulting in pain and
reduced quality of life for the individual. This study investigated the effects of mask strap
tension on the biomechanical and biomarker responses at the skin interface.
Healthy participants (n=13) were recruited and assigned two different masks in a random
order, fitted with three strap conditions representing increments of 5mm to increase tension.
Masks were worn for 10 minutes at each tension followed by a 10 minute refractory period.
Assessment at the device-skin interface included measurements of pressures at the nose and
cheeks, temperature and humidity, a selection of inflammatory cytokine concentrations
collected from sebum and scores of comfort.
Results indicated significantly higher interface pressures at the bridge of the nose compared
to the cheeks for both masks (p<0.05), with nasal interface pressures significantly increasing
with elevated strap tension (p<0.05). One inflammatory cytokine, IL-1α, increased following
mask application at the highest tension, with median increases from baselines ranging from
21-33%. The other cytokines revealed a less consistent trend with strap tension. Participants
reported statistically greater discomfort during elevated strap tension. Temperature and
humidity values under the mask were elevated from ambient conditions, although no
differences were observed between mask type or strap tension.
The bony prominence on the bridge of the nose represents a vulnerable area of skin during
respiratory mask application. This study has shown that mask strap tension has a significant
effects on the pressure exerted on the nose. This can result in discomfort and an inflammatory
3
44
45
46
47
48
49
50
51
52
53
54
55
56
57
58
59
60
61
62
63
64
65

response at the skin surface. Further studies are required to investigate respiratory mask
application for appropriate individuals with co-morbidities.
1. Introduction
Functional medical devices are often attached to the body with straps or tape to provide a
secure fixation to the skin surface. This creates pressure and shear forces at the device-skin
interface, in addition to an altered microclimate in the form of elevated temperature and
humidity. These devices are typically used as interventions for critically ill individuals or those
who have multiple comorbidities. Consequently, their tissues may exhibit a reduced intrinsic
tolerance to withstand prolonged pressures and shear forces acting at the device-skin
interface, creating a susceptibility to pressure ulcers (PUs).1 Indeed PUs are defined by the
National and European Pressure Ulcer Advisory Panel (2014) as ‘a localized injury to the skin
and/or underlying tissue usually over a bony prominence, as a result of pressure, or pressure in
combination with shear’. Recent studies have reported that 33% of all hospital acquired PUs
are related to medical devices and that those employing devices were 2.4 times more likely to
have a PU of any kind.2 The growing awareness of medical device related pressure ulcers
(MDRPUs) has led to an international advisory panel adopting the term into their classification
systems (https://www.npuap.org/).
In recent years non-invasive ventilation (NIV) masks have been identified as potential sources
of MDRPUs.3 NIV is delivered through a respiratory mask attached to the individual to manage
a number of respiratory disorders, such as chronic obstructive pulmonary disorder and acute
cardiogenic pulmonary oedema.4 Despite the respiratory benefits of NIV being widely
accepted, PU complications represent a significant burden to both the individual, in the form
of pain and discomfort, as well as the healthcare provider. The specific incidence of NIV related
PUs have been shown to range from 5-50% for 2-4 hours of continuous usage and up to 100%
4
66
67
68
69
70
71
72
73
74
75
76
77
78
79
80
81
82
83
84
85
86
87
88
89

after 48 hours of wearing a face mask.5
Skin damage may result from the generic mask designs employing traditional polymer
materials, which may not match the shape or compliance of an individual’s facial features. In
addition, there is little guidance for clinicians regarding the application of NIV masks, with
straps often being applied with high tensile forces to achieve a seal with the face. Elevated
tensioning of the straps have been shown to directly increase the pressure exerted on the
bridge of the nose.6 In addition, the material at the device-skin interface will influence the local
microclimate.7 In order to create an appropriate seal, impermeable polymers are often
employed whose properties impede the normal airflow and moisture transport through the
outermost skin layers.8 This can lead to the accumulation of moisture creating increased
friction forces at the skin interface.9
Research to-date has focused on identifying the magnitude and location of pressure associated
with the use of NIV masks for adults.10-12 Although higher interface pressures could potentially
enhance the risk of damage to the skin tissues, the measure of pressure alone will not predict
those areas of high risk of tissue damage.13 Consequently, recent research has combined
physiological measures with interface pressures to establish a more robust method of
monitoring tissue viability and predicting PU risk.14 In addition, recent evidence has shown that
the inflammatory biomarkers can be used to monitor the skin response to pressure and shear,
providing a potential indicator for early skin damage.15 This combined approach, involving both
biomechanical and biomarker assessment, was adopted in the present study to examine the
potential PU risk in wearing NIV masks.
5
90
91
92
93
94
95
96
97
98
99
100
101
102
103
104
105
106
107
108
109
110
111
112
113

2. Methods
2.1 Participants
Participants were recruited from the local university population through poster advertisement.
Participants were excluded if they had the presence of facial trauma or burns, skin disease, or
malignancy. The protocol was approved by the University of Southampton Ethics Committee
and informed written consent was obtained from the participants before testing (FOHS-ERGO-
13985).
2.2 Test Equipment
Two masks were investigated; the Philips Respironics Amara (ref no. 1090226, Respironics Inc.,
Murrysville, PA, USA) (designated M1) and ResMed Mirage Quattro (ref no. 61226, ResMed
Ltd., NSW, Australia) (designated M2). Both were initially fitted with reference to manufacturer
instructions and clinical guidelines.16 Interface pressures were measured using a pressure
Monitoring system (Mk III, Talley Medical, Romsey, UK) using 18 mm diameter cells, which
have a reported mean error of 12±1% and a repeatability of ±0 53mmHg.∙ 17 Relative humidity
and temperature measurements were collected at the mask-skin interface using a Sensiron
SHT75 Sensor (Sensiron AG, Switzerland). Each sensor sampled data at 0.5Hz and provided an
accuracy in relative humidity and temperature of ±0.5% and ±0·8°C, respectively. Sebutape
(CuDerm, Dallas, USA) was used to collect sebum for the detection of inflammatory cytokines
using a validated protocol.18 Subjective discomfort whilst wearing the mask was assessed using
a 10 point visual analogue scale.19
6
114
115
116
117
118
119
120
121
122
123
124
125
126
127
128
129
130
131
132
133
134
135

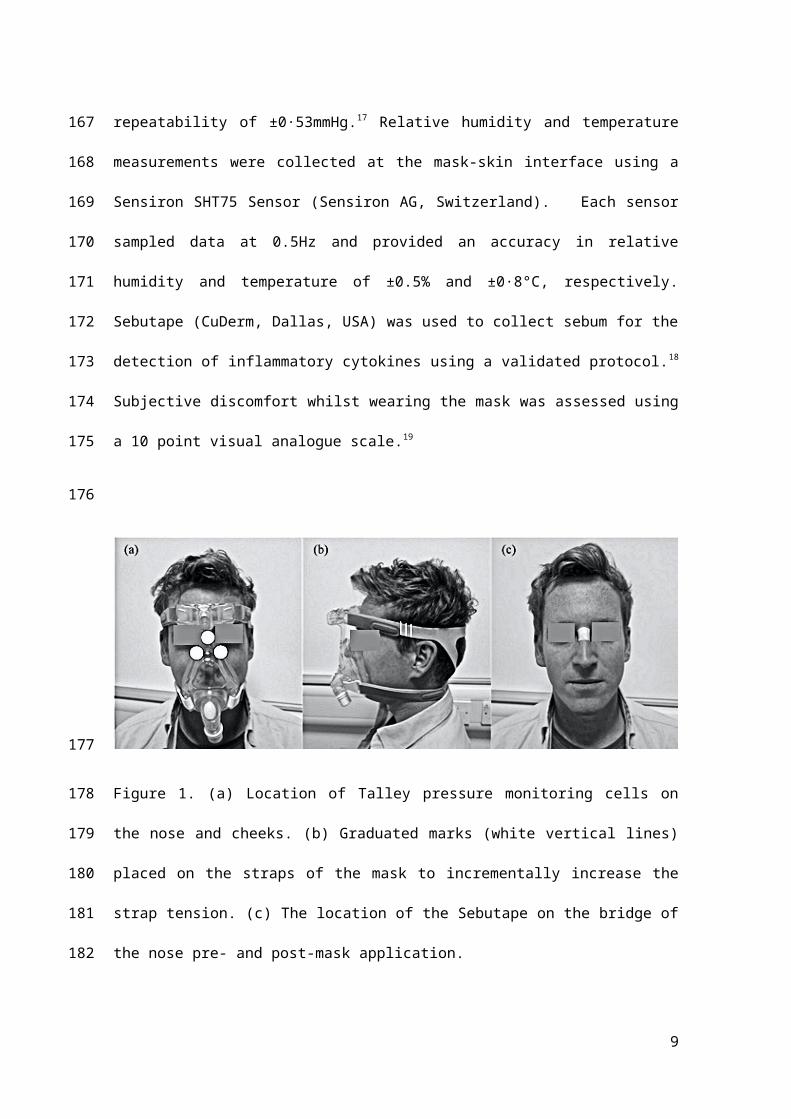
Figure 1. (a) Location of Talley pressure monitoring cells on the nose and cheeks. (b) Graduated
marks (white vertical lines) placed on the straps of the mask to incrementally increase the
strap tension. (c) The location of the Sebutape on the bridge of the nose pre- and post-mask
application.
2.3 Test Protocol
All test were performed in an environmentally controlled laboratory (temperature of 20°C,
relative humidity of 50%). Prior to the application of the mask, a baseline Sebutape sample was
collected for a two minute period. The Sebutape was attached to the bridge of the nose (Figure
1c) using blunt tweezers and gloved hands, to avoid cross contamination of skin proteins.
Participants were then fitted with NIV masks in the absence of positive pressure. On each mask
the bilateral straps on each side of the face were tensioned equally to ensure the mask was
centered on the face. Once secure, an optimum fit (T1) was defined by tensioning to a point at
which two fingers could be slid between the straps and the skin.20 Once marked, the straps
were tensioned by two further increments of 5mm thereby establishing tensions T2 and T3
(Figure 1b). Participants attended two sessions on non-consecutive days to test each randomly
7
136
137
138
139
140
141
142
143
144
145
146
147
148
149
150
151
152
153

allocated mask (M1 or M2). During each of these sessions the mask was fixed to the
participant’s face using the three randomly applied tensions (T1, T2, and T3) for a 10 minute
period, with participants blinded to strap tension. For each mask and tension, pressure
measurements were taken at the device-skin interface on the bridge of the nose and the
superomedial aspect of left and right cheeks (Figure 1a). Three pressure values were recorded
from each site following a period of 2 minutes with the mask in-situ. Mean temperature and
humidity measurements at the device-skin interface were then recorded for a 1 minute period.
After the mask was applied for 8 minutes, participants were asked to provide a subjective
score of discomfort. Following a 10 minute period of application, the mask was removed and a
second sample of Sebutape was collected from the bridge of the nose. This was subsequently
followed by a 10 minute refractory period, after which the mask was re-applied with a new
strap tension. All Sebutapes were coded and stored in vials at -80◦C prior to biochemical
analysis.
2.4 Biochemical Analysis
The Sebutape extraction process was based on the previous protocol of Perkins et al. (2001).
To review briefly, the frozen tapes were thawed to room temperature and 2ml of phosphate
buffered saline (PBS; Sigma-Aldrich Co, St. Louis, Missouri, USA) solution added to each vial.
After immersion for 1 hour, the tapes were sonicated for 10 minutes at 20± C, vortexed
vigorously for 2 minutes, and additionally mixed with a pipette tip. After refreezing overnight
at -80°C, the tape extracts were thawed, vortexed for 1 minute and mixed with a pipette to
recover the total extracts from the tapes. Samples from all participants (n=13) were then
8
154
155
156
157
158
159
160
161
162
163
164
165
166
167
168
169
170
171
172
173
174
175
176
processed and analyzed using Immunoassay kits (Meso Scale Diagnostics, USA) to estimate
concentrations for IL-1α. The sebum samples, from a subset of randomly allocated participants
(n=7) were separately analyzed for IL-1β, IL-2, IL-6, IL-8, IL-10 and IFN-γ (multiplex kit, Meso
Scale Diagnostics, USA).
2.5 Data analysis
Absolute values for cytokine concentration before and after the mask intervention were
obtained from the Sebutape samples and the corresponding ratio values post- to pre-mask
application were calculated for the three test conditions. Descriptive and inferential statistics
were performed using IBM SPSS statistics V22 (IBM Corp, Armonk, New York). Normality was
tested by the Kolmogorov–Smirnov test. Subsequently, results were expressed as mean with
standard deviation for interface pressures and relative humidity values. Non-parametric
descriptors were used for cytokine concentrations, temperatures and subjective comfort. Two-
way repeated measures analysis of variance and Freidman tests were used to evaluate the
effect of mask type and tension. Differences were considered to be statistically significant at
the 5% level (p<0.05).
9
177
178
179
180
181
182
183
184
185
186
187
188
189
190
191
192
193
194
195
196
197
198

3. Results
3.1 Participants
Thirteen healthy participants (6 males and 7 females) were included in the study with a mean
age of 25 years (range 21-31). Their mean height was 1.7 ±0.1m, mean weight 73 ±17kg with a
corresponding BMI of 24.8 ±3.2kg/m2.
3.2 Interface pressure
Table 1 reveals that the interface pressures at the bridge of the nose were considerably
higher than values at the cheek with median differences ranging between 34-77mmHg (p<0.05
for all test conditions). Although pressures on the left cheek tended to be higher than those on
the right cheek for both masks, the differences were not statistically significant (p>0.05). There
was a significant association between strap tension and nasal interface pressures for both
masks (p<0.01). This association was particularly marked with the Respironics Amara (M1)
mask, which revealed nasal pressures of 158±54mmHg at the highest strap tension,
representing an 88% increase compared with those measured at the optimum fit (T1). The
corresponding values in the interface pressures on each cheek with varying strap tension were
not statistically significantly different for either mask (p>0.05).
10
199
200
201
202
203
204
205
206
207
208
209
210
211
212
213
214
215
216
217
218
219

Table 1. Summary of outcome measure data from mask 1 and mask 2 across three strap
tensions.
Outcome MeasureMask 1 Mask 2
T 1 T 2 T 3 T 1 T2 T3
Interface Pressure Nose (mmHg) mean ± sted.dev.
84 ±39
132 ±63
158 ±54
94 ±49
102 ±52
121 ±55
Interface Pressure Right cheek (mmHg) mean ±
sted.dev.
32 ±18
42 ±21
54 ±24
39 ±12
41 ±21
36 ±20
Interface Pressure Left cheek (mmHg) mean ± sted.dev.
37 ±17
30 ±13
42 ±24
32 ±21
38 ±26
33 ±29
Temperature (deg C) median and range
34 (32-35)
34 (33-36)
34 (32-36)
33 (29-35)
34 (32-35)
34 (32-35)
Humidity (% RH) median and range
83 (67-91)
84 (75-92)
84 (77-92)
84 (77-96)
80 (67-93)
84 (73-94)
Discomfort Score
(VAS /10)* median and range
4 (0-7)
5 (0-7)
6 (0-7)
4 (0-7)
5 (0-7)
5 (1-8)
* 1= very comfortable, 10 = very uncomfortable.
3.3 Cytokine Analysis
It was evident that for IL-1α, there was a general increase in cytokine ratio at the highest strap
tension (T3) for both masks. Indeed, this increase in ratio was significant for M2 (p<0.05), with
a median ratio of 1.34 in IL-1α concentrations at T3 (Figure 2), representing increases for 10/13
(79%) of the participants. There was only modest increases in IL-1α ratio (median ratios of
11
220
221
222
223
224
225
226
227
228
229

0.97-1.18) between strap tension (T2) and the optimal fitting (T1), with differences not being
statistically significant (p>0.05).
Figure 2. Box and whisper plots of the IL-1α cytokine ratios from pre- to post-mask application.
Table 2 provides a summary of the pre- to post-mask ratios for the range of six cytokines in a
sub-set of participants (n=7). The analyses revealed more varied results, with IL-8 ratios
increasing for all tensions applied to M1 (median ratios of 1.34-1.60). However, the
corresponding data for M2 only revealed a major increase in the ratio at tension T2 (ratio =
2.84). No statistical significances were observed (p>0.05) in any of the cytokines with respect
to mask type or tension. Indeed, close examination of the data revealed a range of cytokine
values with respect to strap tensions. Three distinct profiles were identified as indicated in
Figure 3. For example, in some cases cytokines were elevated post-mask application compared
to baseline values for each tension (Figure 3a). Despite a statistical significance in IL-1α ratios
for the highest tension in M2, some participants (e.g. P12) showed little change in
concentrations pre- and post-mask application (Figure 3b). In addition, some individuals
12
230
231
232
233
234
235
236
237
238
239
240
241
242
243
244
245
246

revealed an inconsistent trend in cytokine release. This is exemplified in one case (P4, M1, IL-
2) with an increase in the cytokine concentration on the application of strap tensions T1 and
T3, but an apparent decrease after T2 (Figure 3c).
Secondary analysis of the cytokine data revealed significant relationships between cytokines
groups 21 including IL-1 family (R=0.62, p<0.05, Figure 4a), Interleukin Type II Family (R=0.93,
p<0.01, Figure 4b) and the γ Chain Family (R=0.92, p<0.01, Figure 4c). These relationships were
evident for both loaded and unloaded samples.
Figure 3. (a) IL-8 cytokine concentrations for participant P2 during M1 application. (b) IL-1α
cytokine concentrations for participant P12 during M2 application. (c) IL-2 cytokine
concentrations for participant P4 during M1 application.
13
247
248
249
250
251
252
253
254
255
256
257
258
259
260
261
262

Figure 4. Relationship between cytokine groups for (a) IL-1 family, IL-1α and IL-1β (b)
Interleukin Type II Family, IFN-γ and IL-10, (c) Relationship between γ Family, IL-2 and IFN-γ.
14
263
264
265
266
267
268
269
270
271
272
273
274
275
276
277

Table 2. Summary of ratio changes in the cytokines pre- to post-mask application (median and
range presented).
M1 M2
Pre:Post-
mask Ratio
T1 T2 T3 T1 T2 T3
IL-1β Median
(range)
0.75
(0.62-2.14)
1.18
(0.56-2.44)
1.27
(0.50-2.14)
0.73
(0.34-1.88)
1.44
(0.74-3.08)
0.70
(0.63-1.30)
IL-8 Median
(range)
1.34
(0.39-3.20)
1.45
(0.18-2.75)
1.60
(0.43-5.28)
0.53
(0.26-2.17)
2.84
(0.27-7.11)
0.62
(0.34-1.46)
IL-2 Median
(range)
2.60
(0.56-6.13)
0.90
(0.11-2.60)
0.53
(0.19-9.49)
0.34
(0.18-1.77)
2.00
(0.24-21.18)
0.50
(0.31-4.26)
IL-6 Median
(range)
1.44
(0.20-2.05)
0.71
(0.21-2.55)
1.01
(0.55-6.10)
0.90
(0.45-2.36)
1.30
(0.62-2.99)
0.80
(0.58-2.35)
IL-10 Median
(range)
2.24
(0.41-4.60)
1.03
(0.14-2.18)
0.73
(0.15-9.14)
0.37
(0.26-1.95)
2.49
(0.26-23.50)
0.66
(0.34-3.45)
IFN-γ
Median
(range)
2.01
(0.38-3.16)
0.87
(0.19-1.77)
0.66
(0.26-5.85)
1.32
(0.29-2.05)
1.17
(0.35-10.00)
0.62
(0.39-2.40)
15
278
279
280
281
282
283

3.4 Temperature and humidity
The results revealed that the interface between the respiratory mask and the skin exhibited
median values for temperature of 34° C and for relative humidity of 84% (Table 1). Analysis of
this data showed that there were no significant differences between different masks or strap
tensions for either skin temperature or humidity values (P>0·05). These values at the device
skin interface were significantly greater than ambient conditions, for all tests, with mean
ambient values of 22.3 ±0.8°C for temperature and 56.1 ±8.1% for humidity.
3.5 Perceived comfort
There were statistically significant increases in subjective discomfort from optimal tension (T1)
to increased strap tensions (T2 and T3) for both masks (p<0.05). However, there were no
significant differences in subjective comfort between masks (M1 vs. M2) for each of the
corresponding strap tensions (p>0.05).
4 Discussion
The aim of this study was to investigate the effect of varying NIV mask design and strap tension
by measuring the physical conditions at the device-skin interface (pressure and microclimate)
and the reaction at the skin surface (pro-inflammatory biomarkers) in a cohort of healthy
participants. Two commercially available masks were fitted with an optimal strap tension and
these tensions were increased by two standardized increments. The study revealed that
increasing strap tension had a significant effect on interface pressures and biomarker release,
in the form of elevated IL-1α cytokines. In addition, increased discomfort was reported with
enhanced strap tension for both masks designs.
16
284
285
286
287
288
289
290
291
292
293
294
295
296
297
298
299
300
301
302
303
304
305
306

This study revealed that the bridge of the nose is the site exposed to the highest interface
pressures. This corresponds with typical locations of respiratory mask related PUs reported in
the literature.22 The bony prominence on the bridge of the nose has minimal soft tissue
coverage, providing limited tolerance for vulnerable skin tissues to withstand high pressure
and shear forces. The effects of increased strap tension on interface pressures at the bridge of
the nose has previously been reported with an associated reduction in air cushioning support
at the mask skin interface.6 However, the magnitude of the nasal interface pressures (range
57-75mmHg) was markedly lower than those recorded in the present study (84-158mmHg).
These differences may have been due to the different mask designs employed and the
magnitude of tension exerted by the straps on the cohort of healthy participants. The present
study also reported a high degree of variability in interface pressures, with cheek values
varying between individuals within each test condition (Table 1). This variability could be
explained by the generic mask designs providing limited accommodation for inter-individual
differences in face and nose shapes. Indeed, it has been reported that individuals with
craniofacial anomalies have a greater risk of pressure ulcers due to poor mask fit.23 Poor fitting
masks are often over tightened to provide a seal, despite the fact that most commercially
available NIV systems are designed to compensate for minor gas leakage.24
The present study is the first to investigate the biomarker response of the skin to NIV mask
application. The concentrations of inflammatory cytokine IL-1α measured in sebum was
observed to be greater following the application of the masks at the highest tension (T3). The
data revealed ratio increases of 21-33% compared to unloaded skin following a refractory
period. These trends were not consistently observed in other cytokines for a sub-set of the
participants (Table 2), with varied participant specific responses between strap conditions for
17
307
308
309
310
311
312
313
314
315
316
317
318
319
320
321
322
323
324
325
326
327
328
329
330

individual cytokines (Figure 3). Previous studies have used sebum sampled with Sebutape to
measure the inflammatory response during mechanical loading of the forearm using
indenters.25 One such study revealed that a pressure of 100mmHg applied for 2 hours at the
volar aspect of the forearm revealed a 2.5 fold increase IL-1α concentrations compared to the
value at an adjacent unloaded control site. In a separate study a combined biaxial load was
applied at the forearm, incorporating an applied pressure of 30mmHg and a shear force
equivalent to 18mmHg.26 Significant changes in IL-1α concentrations were only evident when
the combined loading was applied for 30 minutes. This highlighted the temporal nature of pro-
inflammatory cytokine release at the skin surface and may explain the variable changes in
markers observed in the present study using 10 minute loading and refractory periods
between test conditions.
The results from the present study revealed relatively low correlations between IL-1a and IL-1β
(R2 = 0.38). IL-1a is released from keratinocytes in response to several stimuli, acting as the
primary event of inflammation. Consequently, it may have limited specificity to determine
whether skin has been irritated by either mechanical or chemical insults and lack the sensitivity
to detect subtle changes to skin physiology. The analysis of IL-1a in conjunction with secondary
mediators, for example IL-8, which is associated with promotion of dendritic cell migration and
recruitment of monocytes and neutrophils during the initiation phase of cutaneous
inflammation,27 may provide more robust means to detect inflammation resulting from
mechanical stimuli in the form of pressure and shear. Although the present findings from the
multiple cytokine assays did not provide significant results in relation to strap tension, there is
a need to establish the cytokines relationships with barrier disruption and impairment of
healing. Indeed, previous in-vivo and in-vitro research has shown multiple cytokines can
simultaneously exert their effects on the same cell population, altering the function of the
epidermal layers.28 The present study revealed highly significant correlations of cytokine
18
331
332
333
334
335
336
337
338
339
340
341
342
343
344
345
346
347
348
349
350
351
352
353
354
355

concentrations within the family groups (Figure 4). Given these relationships, future studies
may be able to select isolated cytokines which are indicative of multiple markers. Future
studies are required, powered to examine if significant changes in secondary mediators such as
IL-8, IL-6 or IFN-γ may provide more insight into the value of cytokines for the early detection
of pressure ulcers.
Skin temperature and humidity data shows that the interface between the skin and mask can
become hot and humid, with a peak skin temperature of 36.2°C and peak skin humidity of
95.9%. These temperature values are higher than those cited for unloaded facial skin, which
was reported to be 32oC around the cheek area.29 Indeed skin temperatures in excess of 35oC
has been found to have a detrimental effect on the stratum corneum by affecting its
mechanical stiffness and strength 7, therefore increasing the risk of tissue damage.30 The high
humidity levels at the skin interface recorded in the present study will also have a direct
impact on skin health in the form of stratum corneum softening, and increased cellular
permeability leading to increase susceptibility to skin irritation.31 Moist skin will also has an
increased coefficient of friction, resulting in elevated shear forces at the device-skin interface.32
The present study included some methodological limitations, which include the use of young
healthy participants, thus limiting the generalization of the findings. In addition, the current
study did not provide positive pressure within the mask, which has been reported to produce a
changing profile of interface pressures during ventilation.10 The mask application time was
relatively short when compared to the clinical application of NIV.33 In addition, the recovery
period of 10 minutes may not have been sufficient for the skin to fully recover to the unloaded
state. A previous study has proposed a refractory period of approximately 20 minutes for
19
356
357
358
359
360
361
362
363
364
365
366
367
368
369
370
371
372
373
374
375
376
377
378
379

upregulated cytokines to return to basal levels.25 Indeed, this was evident in some cases with
some “carry over effect” of upregulated cytokines between loaded and unloaded conditions
(Figure 4c). However, in clinical practice, if NIV interventions are removed for prolonged
periods patients may be at risk of oxygen desaturation. Further research is required to define
exact refractory periods in which cytokine expression returns to basal levels and whether
these periods are clinically viable.
4.2 Clinical Perspective
During NIV application, the clinicians’ primary focus is to attain a mask seal, as air leaks are
associated with reduced comfort and efficacy of the intervention.11 To achieve this seal, strap
tension is often increased, with the risk of pressure damage a secondary consideration. 34 It is
important to consider that the patient may not be alerted to an uncomfortable mask fit due to
sedation, medication, or neurological disease or injury.35 Oronasal masks have traditionally
been preferred for their comfort and ease of use, although other interfaces, such as full-face
masks have been shown to reduce pressure ulcer incidence.36,37 The development of new
evidence based devices which protect the skin, 38 enhanced guidance for clinical application,
for example, with respect to strap tension and the use of prophylactic interventions should
also be considered for the prevention of NIV related Pus.39 When device related injury does
occur there is a need to promote accurate documentation and communication with clinical
colleagues, regulatory bodies and industry. Advanced medical device surveillance systems
could be considered to provide a framework for improving patient safety.40 Further research
should monitor the interface pressures and skin physiological response of patients, who
require NIV treatment over prolonged periods of application. The comorbidities of patients
requiring NIV may contribute to an altered intrinsic capability for their tissues to tolerate
20
380
381
382
383
384
385
386
387
388
389
390
391
392
393
394
395
396
397
398
399
400
401
402
403

prolonged pressure from respiratory masks.1 The combined measurement of physical
conditions and biomarkers offers a robust objective methodology to monitor tissue damage
risk in these individuals.
5 Conclusion
This present study has considered both the biomechanical and biomarker response to NIV
mask application in a cohort of healthy participants. The study revealed that small increments
in strap tension result in large interface pressures transferred to the bridge of the nose. This
resulted in significant increases in discomfort and the release of pro-inflammatory cytokine, IL-
1, during the highest strap tension. It is therefore important that clinicians consider how
tightly they apply the straps of respiratory masks and monitor the health of skin regularly for
individuals who required NIV treatment.
Acknowledgements
We would like to thank all individuals who participated in the study. The work was supported
by the EPSRC-NIHR “Medical Device and Vulnerable Skin Network” (ref EP/M000303/1).
Disclosure statement
There were no conflicts of interest for the study.
21
404
405
406
407
408
409
410
411
412
413
414
415
416
417
418
419
420
421
422
423
424

References
1. Wolverton CL, Hobbs LA, Beeson T, Benjamin M, Campbell K, Forbes C, Huff N,
Kieninger M, Luebbehusen M, Myers M, White S. Nosocomial Pressure Ulcer Rates in
Critical Care: Performance Improvement Project. J. Nurs. Care Qual. 2005;20:56-62.
2. Black J, Cuddigan J, Walko M, Didier A, Lander M, Kelpe M. Medical device related
pressure ulcers in hospitalised patients. International Wound Journal. 2010;7:358-365.
3. Gay PC. Complications of Noninvasive Ventilation in Acute Care. Respir. Care. 2009
2009;54:246-258.
4. NICE. Chronic obstructive pulmonary disease in adults (QS10): National Institute for
Health and Care Excellence; 2011.
5. Carron M, Freo U, BaHammam AS, Dellweg D, Guarracino F, Cosentini R, Feltracco P,
Vianello A, Ori C, Esquinas A. Complications of non-invasive ventilation techniques: a
comprehensive qualitative review of randomized trials. Br. J. Anaesth. 2013;110:896-
914.
6. Munckton K, Ho KM, Dobb GJ, Das-Gupta M, Webb SA. The pressure effects of
facemasks during noninvasive ventilation: a volunteer study. Anaesthesia.
2007;62:1126-1131.
7. Clark M, Romanelli M, Reger S, Ranganathan V, Black J, Dealey C. Microclimate in
context. International guidelines. Pressureulcer prevention: pressure, shear, friction
and microclimate in context. A consensus document. Wounds International. 2010:19-
25.
22
425
426
427
428
429
430
431
432
433
434
435
436
437
438
439
440
441
442
443
444
445
446
447

8. Visscher MO, White CC, Jones JM, Cahill T, Jones DC, Pan BS. Face Masks for
Noninvasive Ventilation: Fit, Excess Skin Hydration, and Pressure Ulcers. Respir. Care.
2015;60:1536-1547.
9. Gefen A. How do microclimate factors affect the risk for superficial pressure ulcers: A
mathematical modelling study. Journal of Tissue Viability. 2011;20:81-88.
10. Schettino GP, Tucci MR, Sousa R, Valente Barbas CS, Passos Amato MB, Carvalho CR.
Mask mechanics and leak dynamics during noninvasive pressure support ventilation: a
bench study. Intensive Care Med. 2001;27:1887-1891.
11. Dellweg D, Hochrainer D, Klauke M, Kerl J, Eiger G, Kohler D. Determinants of skin
contact pressure formation during non-invasive ventilation. J Biomech. 2010;43:652-
657.
12. Munckton K, Ho KM, Dobb GJ, Das-Gupta M, Webb SA. The pressure effects of
facemasks during noninvasive ventilation: a volunteer study. Anaesthesia.
2007;62:1126-1131.
13. Reenalda J, Jannink M, Nederhand M, Ijzerman M. Clinical Use of Interface Pressure to
Predict Pressure Ulcer Development: A Systematic Review. Assist. Technol. 2009;21:76-
85.
14. Woodhouse M, Worsley PR, Voegeli D, Schoonhoven L, Bader DL. The physiological
response of soft tissue to periodic repositioning as a strategy for pressure ulcer
prevention. Clin Biomech. 2015;30:166-174.
15. de Wert LA, Bader DL, Oomens CWJ, Schoonhoven L, Poeze M, Bouvy ND. A new
method to evaluate the effects of shear on the skin. Wound Repair Regen.
2015;23:885-890.
16. British Thoracic Society, Royal College of Physicians, Intensive Care Society. Chronic
obstructive pulmonary disease: non-invasive ventilation with bi-phasic positive airways
23
448
449
450
451
452
453
454
455
456
457
458
459
460
461
462
463
464
465
466
467
468
469
470
471
472
pressure in the management of patients with acute type 2 respiratory failure. In: RCP,
ed. Vol 11. London: RCP; 2008.
17. Allen V, Ryan DW, Lomax N, Murray A. Accuracy of interface pressure measurement
systems. J. Biomed. Eng. 1993;15:344-348.
18. Perkins M, Osterhues M, Farage M, Robinson M. A noninvasive method to assess skin
irritation and compromised skin conditions using simple tape adsorption of molecular
markers of inflammation. Skin Research and Technology. 2001;7:227-237.
19. Aitken RC. Measurement of feelings using visual analogue scales. Proceedings of the
royal society of medicine. 1969;62:989.
20. Brill A-K. How to avoid interface problems in acute noninvasive ventilation. Breathe.
2014;10:230-242.
21. Hänel KH, Cornelissen C, Lüscher B, Baron JM. Cytokines and the Skin Barrier.
International Journal of Molecular Sciences. 2013;14:6720-6745.
22. Maruccia M, Ruggieri M, Onesti MG. Facial skin breakdown in patients with non-
invasive ventilation devices: report of two cases and indications for treatment and
prevention. International Wound Journal. 2015;12:451-455.
23. Visscher MO, White CC, Jones JM, Cahill T, Jones DC, Pan BS. Face Masks for
Noninvasive Ventilation: Fit, Excess Skin Hydration, and Pressure Ulcers. Respir Care.
2015;60:1536-1547.
24. Johnson KG, Johnson DC. Treatment of sleep-disordered breathing with positive airway
pressure devices: technology update. Medical Devices (Auckland, N.Z.). 2015;8:425-
437.
25. Cornelissen LH, Bronneberg D, Bader DL, Baaijens F, Oomens C. The Transport Profile
of Cytokines in Epidermal Equivalents Subjected to Mechanical Loading. Ann. Biomed.
Eng. 2009;37:1007-1018.
24
473
474
475
476
477
478
479
480
481
482
483
484
485
486
487
488
489
490
491
492
493
494
495
496
497

26. de Wert LA, Bader DL, Oomens CW, Schoonhoven L, Poeze M, Bouvy ND. A new
method to evaluate the effects of shear on the skin. Wound Repair Regen.
2015;23:885-890.
27. Coquette A, Berna N, Vandenbosch A, Rosdy M, De Wever B, Poumay Y. Analysis of
interleukin-1α (IL-1α) and interleukin-8 (IL-8) expression and release in in vitro
reconstructed human epidermis for the prediction of in vivo skin irritation and/or
sensitization. Toxicology in Vitro. 2003;17:311-321.
28. Gutowska-Owsiak D, Ogg GS. Cytokine regulation of the epidermal barrier. Clin. Exp.
Allergy. 2013;43:586-598.
29. Ariyaratnam S, Rood Jp. Measurement of facial skin temperature. J. Dent.
1990;18:250-253.
30. Sae-Sia W, Wipke-Tevis D, Williams D. Elevated sacral skin temperature (Ts): a risk
factor for pressure ulcer development in hospitalized neurologically impaired Thai
patients. Appl. Nurs. Res. 2005;18:29-35.
31. Atherton DJ. A review of the pathophysiology, prevention and treatment of irritant
diaper dermatitis. Curr. Med. Res. Opin. 2004;20:645-649.
32. Gerhardt LC, Strässle V, Lenz A, Spencer ND, Derler S. Influence of epidermal hydration
on the friction of human skin against textiles. Journal of the Royal Society Interface.
2008;5:1317-1328.
33. Racca F, Appendini L, Berta G, Barberis L, Vittone F, Gregoretti C, Ferreyra G, Urbino R,
Ranieri VM. Helmet ventilation for acute respiratory failure and nasal skin breakdown
in neuromuscular disorders. Anesth Analg. 2009;109:164-167.
34. Yamaguti WP, Moderno EV, Yamashita SY, Gomes TG, Maida AL, Kondo CS, de Salles IC,
de Brito CM. Treatment-related risk factors for development of skin breakdown in
25
498
499
500
501
502
503
504
505
506
507
508
509
510
511
512
513
514
515
516
517
518
519
520
521

subjects with acute respiratory failure undergoing noninvasive ventilation or CPAP.
Respir Care. 2014;59:1530-1536.
35. Black JM, Cuddigan JE, Walko MA, Didier LA, Lander MJ, Kelpe MR. Medical device
related pressure ulcers in hospitalized patients. Int Wound J. 2010;7:358-365.
36. Vaschetto R, De Jong A, Conseil M, Galia F, Mahul M, Coisel Y, Prades A, Navalesi P,
Jaber S. Comparative evaluation of three interfaces for non-invasive ventilation: a
randomized cross-over design physiologic study on healthy volunteers. Crit Care.
2014;18:R2.
37. Schallom M, Cracchiolo L, Falker A, Foster J, Hager J, Morehouse T, Watts P, Weems L,
Kollef M. Pressure Ulcer Incidence in Patients Wearing Nasal-Oral Versus Full-Face
Noninvasive Ventilation Masks. Am. J. Crit. Care. 2015;24:349-356.
38. Gregoretti C, Confalonieri M, Navalesi P, Squadrone V, Frigerio P, Beltrame F, Carbone
G, Conti G, Gamna F, Nava S, Calderini E, Skrobik Y, Antonelli M. Evaluation of patient
skin breakdown and comfort with a new face mask for non-invasive ventilation: a
multi-center study. Intensive Care Med. 2002;28:278-284.
39. Weng MH. The effect of protective treatment in reducing pressure ulcers for non-
invasive ventilation patients. Intensive Crit Care Nurs. 2008;24:295-299.
40. Polisena J, Jutai J, Chreyh R. A proposed framework to improve the safety of medical
devices in a Canadian hospital context. Medical Devices (Auckland, N.Z.). 2014;7:139-
147.
26
522
523
524
525
526
527
528
529
530
531
532
533
534
535
536
537
538
539
540
541
542
543
544
545


